Exploring Motion Boundaries in an End-to-End Network for Vision-based Parkinson’s Severity Assessment
Abstract
Evaluating neurological disorders such as Parkinson’s disease (PD) is a challenging task that requires the assessment of several motor and non-motor functions. In this paper, we present an end-to-end deep learning framework to measure PD severity in two important components, hand movement and gait, of the Unified Parkinson’s Disease Rating Scale (UPDRS). Our method leverages on an Inflated 3D CNN trained by a temporal segment framework to learn spatial and long temporal structure in video data. We also deploy a temporal attention mechanism to boost the performance of our model. Further, motion boundaries are explored as an extra input modality to assist in obfuscating the effects of camera motion for better movement assessment. We ablate the effects of different data modalities on the accuracy of the proposed network and compare with other popular architectures. We evaluate our proposed method on a dataset of 25 PD patients, obtaining 72.3% and 77.1% top-1 accuracy on hand movement and gait tasks respectively.
1 Introduction
Parkinson’s disease (PD) is the second most common neurodegenerative disorder after Alzheimer’s dementia [1]. The characteristic motor features include slowness of movement (bradykinesia), stiffness (rigidity), tremor and postural instability [2]. These symptoms affect patients in performing everyday tasks and impact the quality of their life. Regular clinical assessment and close monitoring of the signs and symptoms of PD are required to tailor symptomatic treatments and optimize disease control. Further, accurate quantification of disease progression is vital in the trials of any drugs or interventions that are designed to improve or modify the course of the condition.
Assessment of motor symptoms in PD patients is usually performed in clinical settings to evaluate the degree of rigidity and bradykinesia. Typically, the patient is asked to perform an elaborate series of specific physical tasks – such as opening and closing their hand in a rapid succession, i.e. gripping and letting go, walking at usual pace for several metres. and so on, whilst being assessed by a PD physician or specifically-trained nurse who makes an evaluation. In formal settings, such as drug trials or research studies, the clinical assessment is usually scored, employing a global recognized scale, the Unified Parkinson’s Disease Rating Scale (UPDRS) [3], where motor evaluation consists of 33 separate examiner-defined tests. Generally, clinicians quantify the severity of each action with a score ranging from 0 (normal) to 4 (most severe). However, such a process of assessment and scoring is highly subjective and necessitates the expense of an available rater. Therefore, automating the PD assessment process may assist in eliminating these shortcomings [4].
In this paper, we present a simple, novel, end-to-end approach to evaluate the severity of PD motor state in clinical neuroscientific studies from only video data, based on the UPDRS scale. To suppress the influence of arbitrary camera motions, commonly found in real-world video data, we deploy motion boundary features [5] computed via optical flow. We use such features along with other input modalities (i.e. RGB and optical flow) in a multi-stream, deep learning configuration to enhance the robustness of our model. We adapt the I3D CNN (Convolutional Neural Network) [6] to directly learn spatial and temporal features from RGB, Flow, and Motion Boundaries at a low computational cost. We also model long-range temporal structure in the patient’s action since assessing only a few moments of an action could result in different scores by a rater, e.g. rapid hand opening and closing sequences may be very similar in part, but in one case the hand may fail to keep up a consistent amplitude and speed of movement towards the end of the sequence due to fatiguing (as occurs in PD) or may start badly at the start of the sequence but get better as the action evolves. To this end, we adopt a sparse temporal sampling strategy (as proposed in [7]) to train our network. This allows for stacks of a few consecutive frames from different segments of the input video to be processed by the 3D CNN independently at inference time and their final scores averaged only at the end (see Figure 1).
Inspired by the success of ‘attention’, now commonly used in deep learning networks, e.g. for human action recognition [8, 9], we engage attention units which assign individual attention weights over each feature vector. This enables a more reliable model as it allows our network to focus more heavily on the critical segments of a video which may contain absolute classification information. This is motivated by the fact that, in some cases, clinicians are able to pass judgement on a patient based on momentary actions, e.g. an interruption or hesitation during the hand movement task.
We use a dataset collected from 25 clinically diagnosed PD patients who underwent UPDRS assessments of their motor function after withholding symptom improving dopaminergic medication overnight, focusing on the rapid hand opening and closing and gait components. We train and test our model via a subject-level N-fold cross validation scheme to evaluate its performance and compare against other popular deep learning architectures – in particular to demonstrate the importance of the use of motion boundaries. To the best of our knowledge, ours is the first work to propose an end-to-end deep learning framework for automatic PD severity assessment based on UPDRS scores from non-skeleton-based data.
In summary, our main contributions are as follows: (i) we leverage recent advances from deep learning techniques in human action recognition and combine them with a temporal attention-based approach to find a practical design choice for video-based PD severity prediction, (ii) in order to reduce the camera motion effect and increase accuracy, we propose to use motion boundaries as an extra input in our multi-stream configuration, (iii) we quantitatively compare different architectures and different input modalities, and include ablation studies to determine the influence of attention and each modality for two PD motor function tasks.
2 Related works
Recently, challenges in PD have been addressed through machine learning techniques, mostly employing wearable sensors, such as [10, 11, 12, 13]. For example, [10] performed a comparative study of various machine learning algorithms, such as decision trees, support vector machines, discriminant analysis, random forests, and k-nearest-neighbor on data from a wrist-worn wearable device to classify hand tremor severity. Evaluated on 85 patients, the highest accuracy obtained was 85.6% by a decision tree classifier.
Studies that have applied deep learning techniques, such as CNNs and RNNs (Recurrent Neural Networks), to PD severity automatically from wearable sensor data include [14, 15, 16, 17, 18]. For example, [14] developed a two-stream deep learning architecture, including a 5-layer CNN and a 2-layer LSTM (Long Short-Term Memory) network to capture the spatial and temporal features of gait data. Their model was trained and tested on three public Vertical Ground Reaction Force datasets collected by foot sensors from 93 patients with idiopathic PD and 73 healthy controls. A maximum accuracy of 98.8% was reported for classification of PD patients with different severity.
However, the use of force sensors, wearables and other on-body sensors have many limitations. They are mostly inconvenient, and sometimes very difficult, to attach to patients, but more importantly, they do not provide the spectrum of rich information a visual sensor can present. Moreover, a camera system in the clinic is passive and not so intrusive as an attached sensor that can produce discomfort and unease.
With the rise and wide availability of depth-based sensors (e.g. the Kinect), which reduces the burden of capturing 3D joints, they have been adopted in many health-related applications, such as [19, 20, 21]. For example, [21] used Kinect V2 skeletons to collect a dataset of normal and pathological gait examples from 27 subjects. Shoe-sole padding was placed into the right shoe of each person to simulate gait problems. They obtained dynamic features of lower limbs in their dataset to analyse the symmetry of gait and then applied these features in an LSTM-based model to learn the difference between normal and abnormal gait. An average accuracy of was achieved by cross-validation on 10 different validation partitions.
We are interested in assessing PD severity with recourse to only RGB (and RGB-derived) data which is an easily available modality. Works such as [22, 23, 24], generate RGB video features from deep learning-based pose estimation networks. For example, [23] estimated the frequency of hand tremors in Parkinson’s patients by applying Convolutional Pose Machines (CPM) [25] and Kalman filtering to detect and track hand motion, and then subtracting the original hand locations from their smooth trajectory to estimate the tremor frequency. [22] used movement trajectory characteristics (e.g. kinematic, frequency) extracted using CPM to train random forests to assess the severity of Parkinsonism in leg agility and toe tapping tasks. [24] used OpenPose [26] to extract frame-level feature keypoints from finger taps and hand tremor tasks. They encoded these into a single task-level feature vector by using 15 statistical functions, such as max, min, mean, median, standard deviation, Fisher vectors, and so on. This single task-level feature vector was then fed into a feedforward neural network to classify each subject into normal and abnormal classes for each hand at the individual task level. The key limitations of these pose-based methods are that they rely on hand-crafted feature extraction and pre-processing steps which limits their models’ representational capability.
To obtain good visual representations, especially rich in temporal features, is a challenging task and has received considerable attention in recent years [27, 7, 6, 28]. In an early work, [27] designed a two-stream CNN to model spatial and temporal features from RGB and optical flow, respectively. These were then fused to generate the final classification scores. The Temporal Segment Network of [7] further improved the results of the two-stream CNN at a reasonable computational cost by modelling long-range temporal structures and proposing a temporal sampling strategy for training CNNs on video data. By inflating the ImageNet pre-trained 2D kernels into 3D, [6] directly learned spatial and temporal features from RGB, significantly enhancing the state of the art on action recognition at the time. Their Inflated 3D ConvNet (I3D) remains a popular network of choice. Feichtenhofer et al. introduced the SlowFast architecture [28], which uses a slow pathway to capture spatial content of a video, and a fast pathway to capture motion at fine temporal resolution. Our proposed multi-stream architecture applies an I3D backbone, based on a temporal segment strategy, and we will also consider the SlowFast approach for our comparative analysis.
3 Proposed Approach
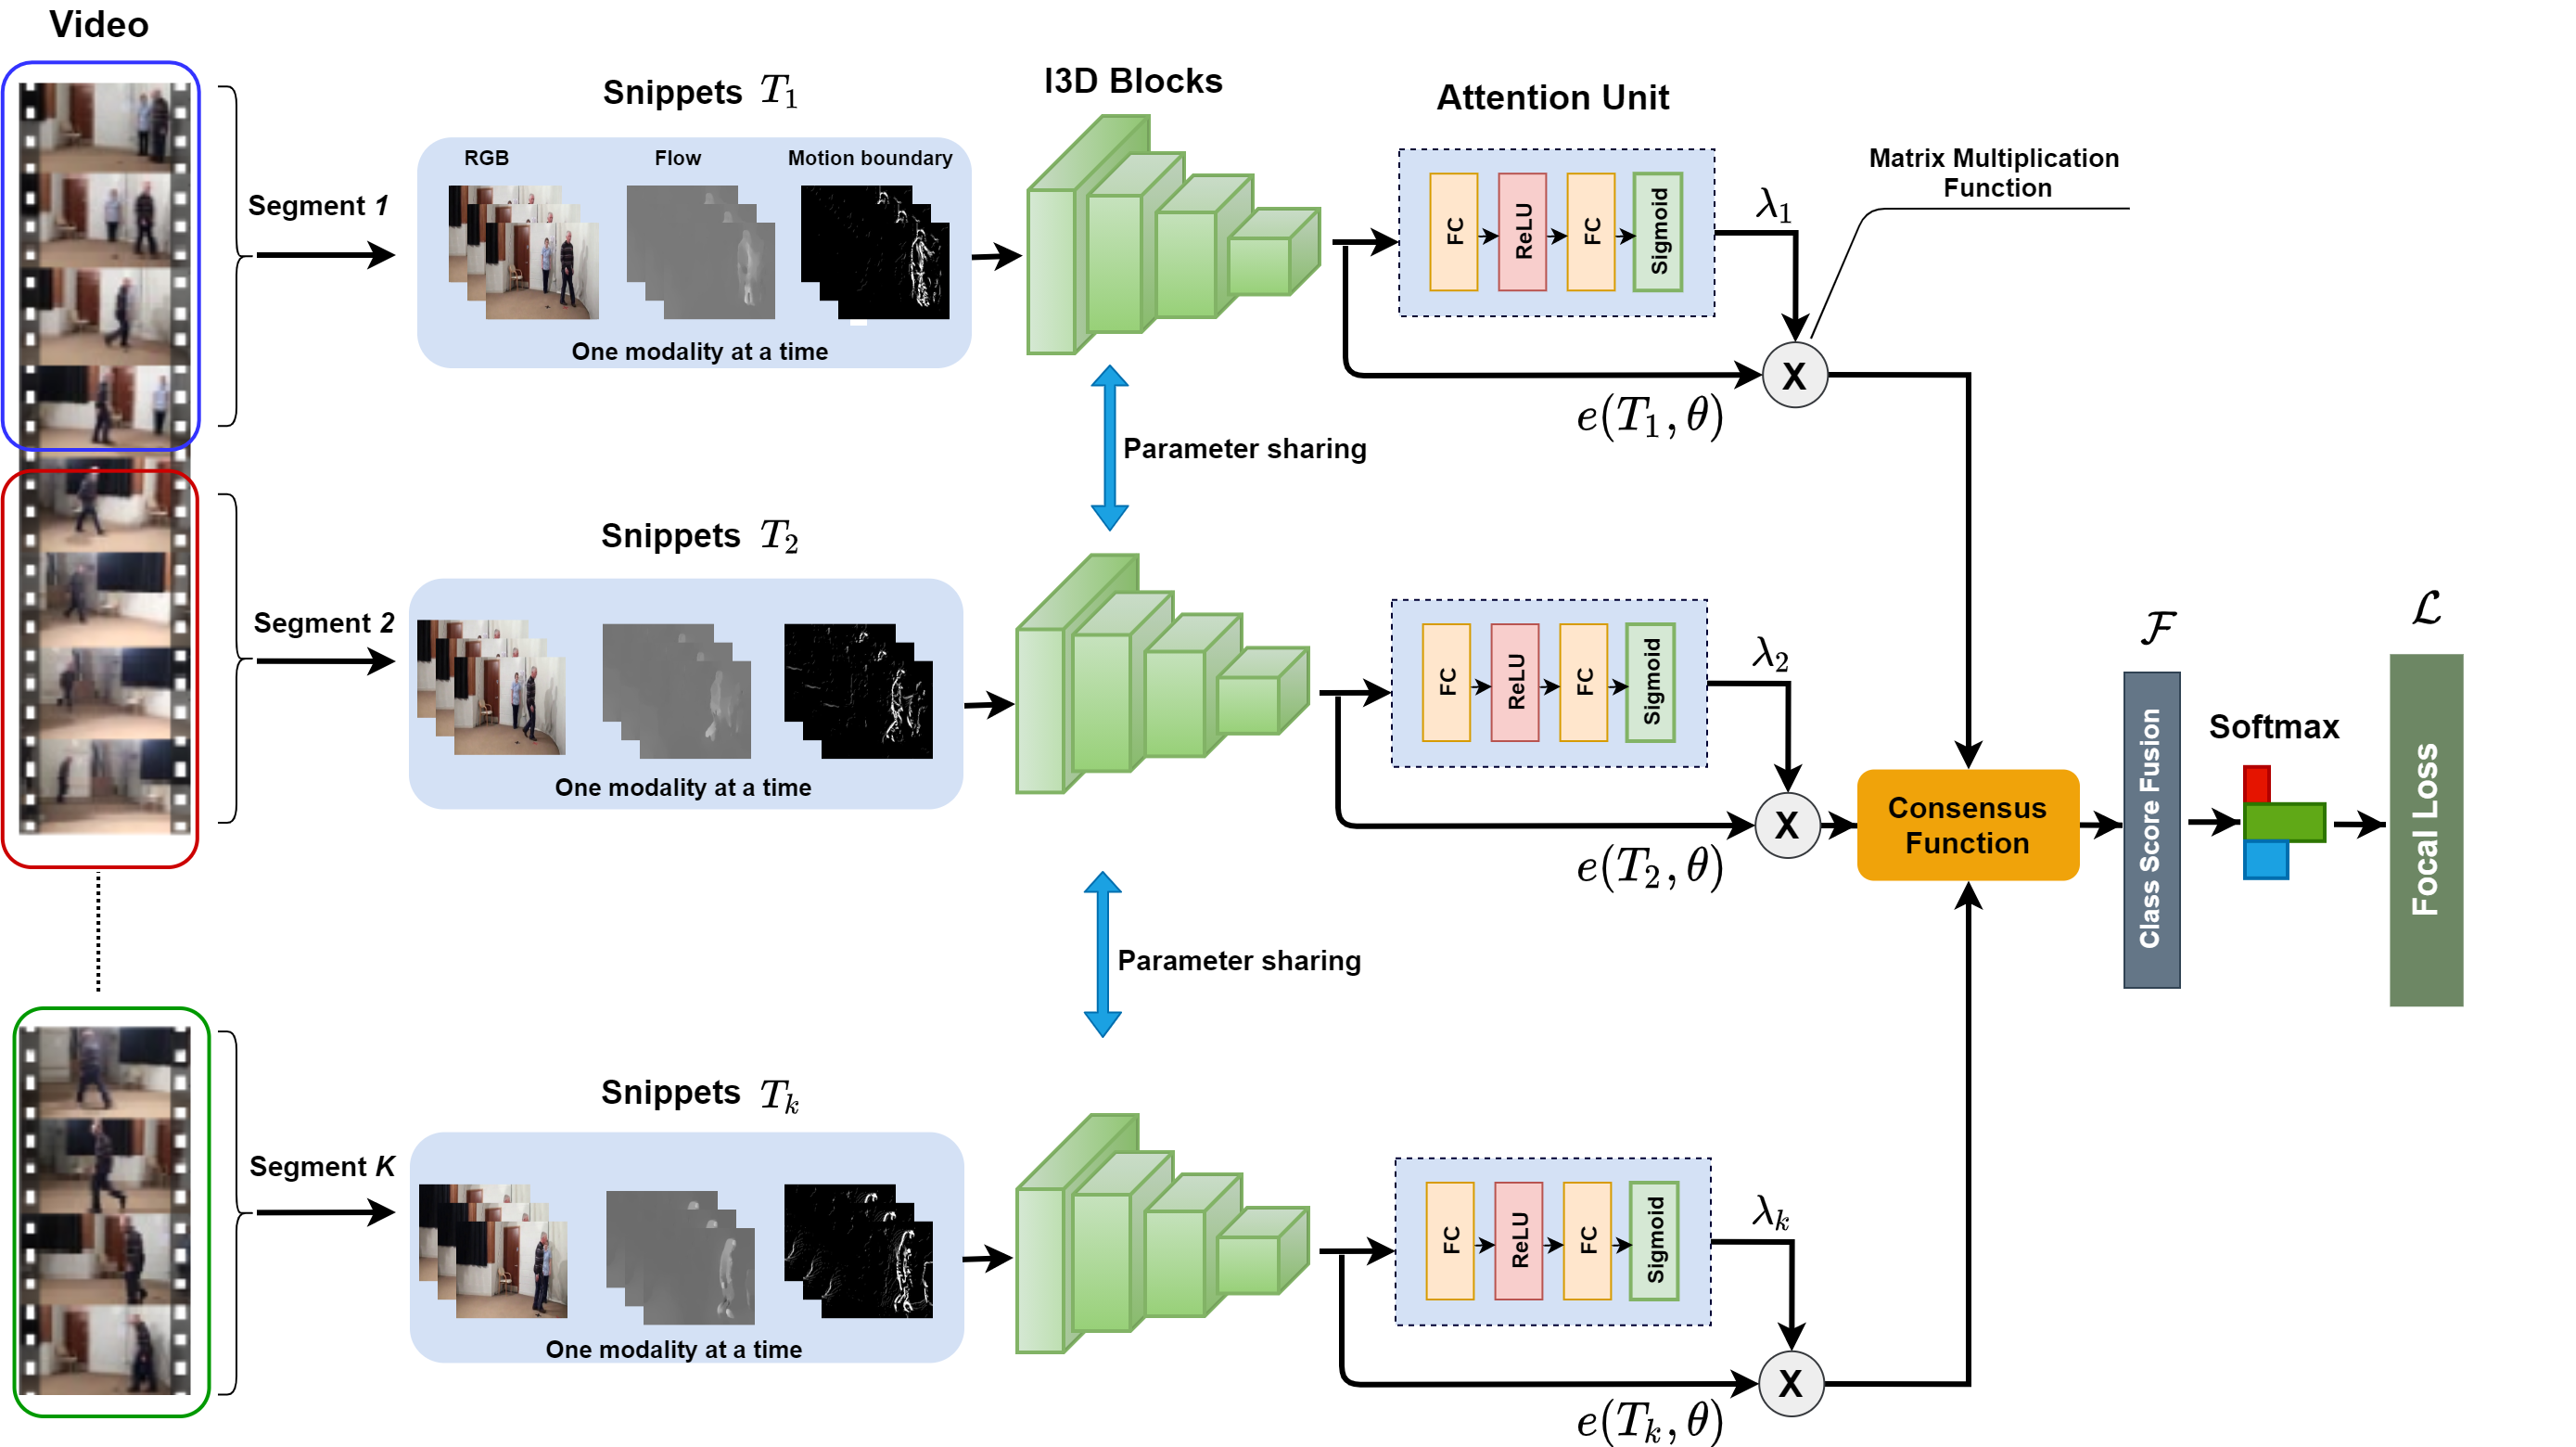
Our aim is to learn an end-to-end, deep learning model for movement disorder severity assessment in Parkinson’s patients, without resort to joint data or elaborate annotations. Given a video from a patient in the clinic performing a UPDRS test task, such as hand opening and closing, our model exploits the motion information in the scene to predict a score depending on how well the task was carried out. Our only annotation is the UPDRS score for the test, as determined by an expert clinical neuroscience rater. Figure 1 illustrates an overview of our network and approach. In the following, we explain the details of our method and its training procedure.
Network architecture – Following [7], we use sparse temporal sampling for our model training. As shown in Figure 1, we first split the video into segments, each of which is randomly sampled into a short snippet to form sparse sampling of the whole clip into snippets – with each snippet generated in three formats (RGB, Flow, and Motion Boundaries, but not individually specified here for reasons of simplicity and brevity). Then, similar to [29], we apply a 3D CNN as the backbone of this framework to directly learn spatial and temporal features from video snippets. To overcome the increased parameter space and associated risks of overfitting resulting from this change, I3D [6] is deployed as the 3D CNN which inflates all the 2D convolution filters used by the Inception V1 architecture [30] into 3D convolutions allowing a deep 3D ConvNet with many fewer parameters. We found this strategy very efficient to analyse the complex motions of our video data which are by nature relatively long.
The spatial and temporal feature maps of the last convolutional layer of I3D for each video snippet feed into an attention unit that consists of two fully connected (FC) layers interspersed by a ReLU activation function and a Sigmoid function to generate attention weights () for each video snippet. This is based on the attention module proposed in [31].
Then, in the forward pass of the system, the encoded, attention-weighted features are used to modulate the global average pooling and therefore compiled via the consensus function to produce class score fusion of length over video snippets,
| (1) |
where is the encoding function and are the network parameters. A Softmax on then provides the probability distribution of the UPDRS class scores of the video clip, i.e.
| (2) |
Motion Boundaries – Previous works, such as [27, 7, 6], have shown the importance of using optical flow in deep learning-based human action recognition. However, optical flow fields represent the absolute motion, making the disentanglement of object-level and camera motions a significant challenge [32]. [7] proposed to use warped flow [33] to cancel out the camera motion. However, warped flow did not results in a better performance than normal optical flow in their work. Moreover, computing this modality can be computationally very expensive [33].
To address this problem, we need a new input stream that better encodes the relative motion between pixels. Thus, we use motion boundaries, initially proposed in the context of human detection [5], to remove constant motion and therefore suppress the influence of camera motions.
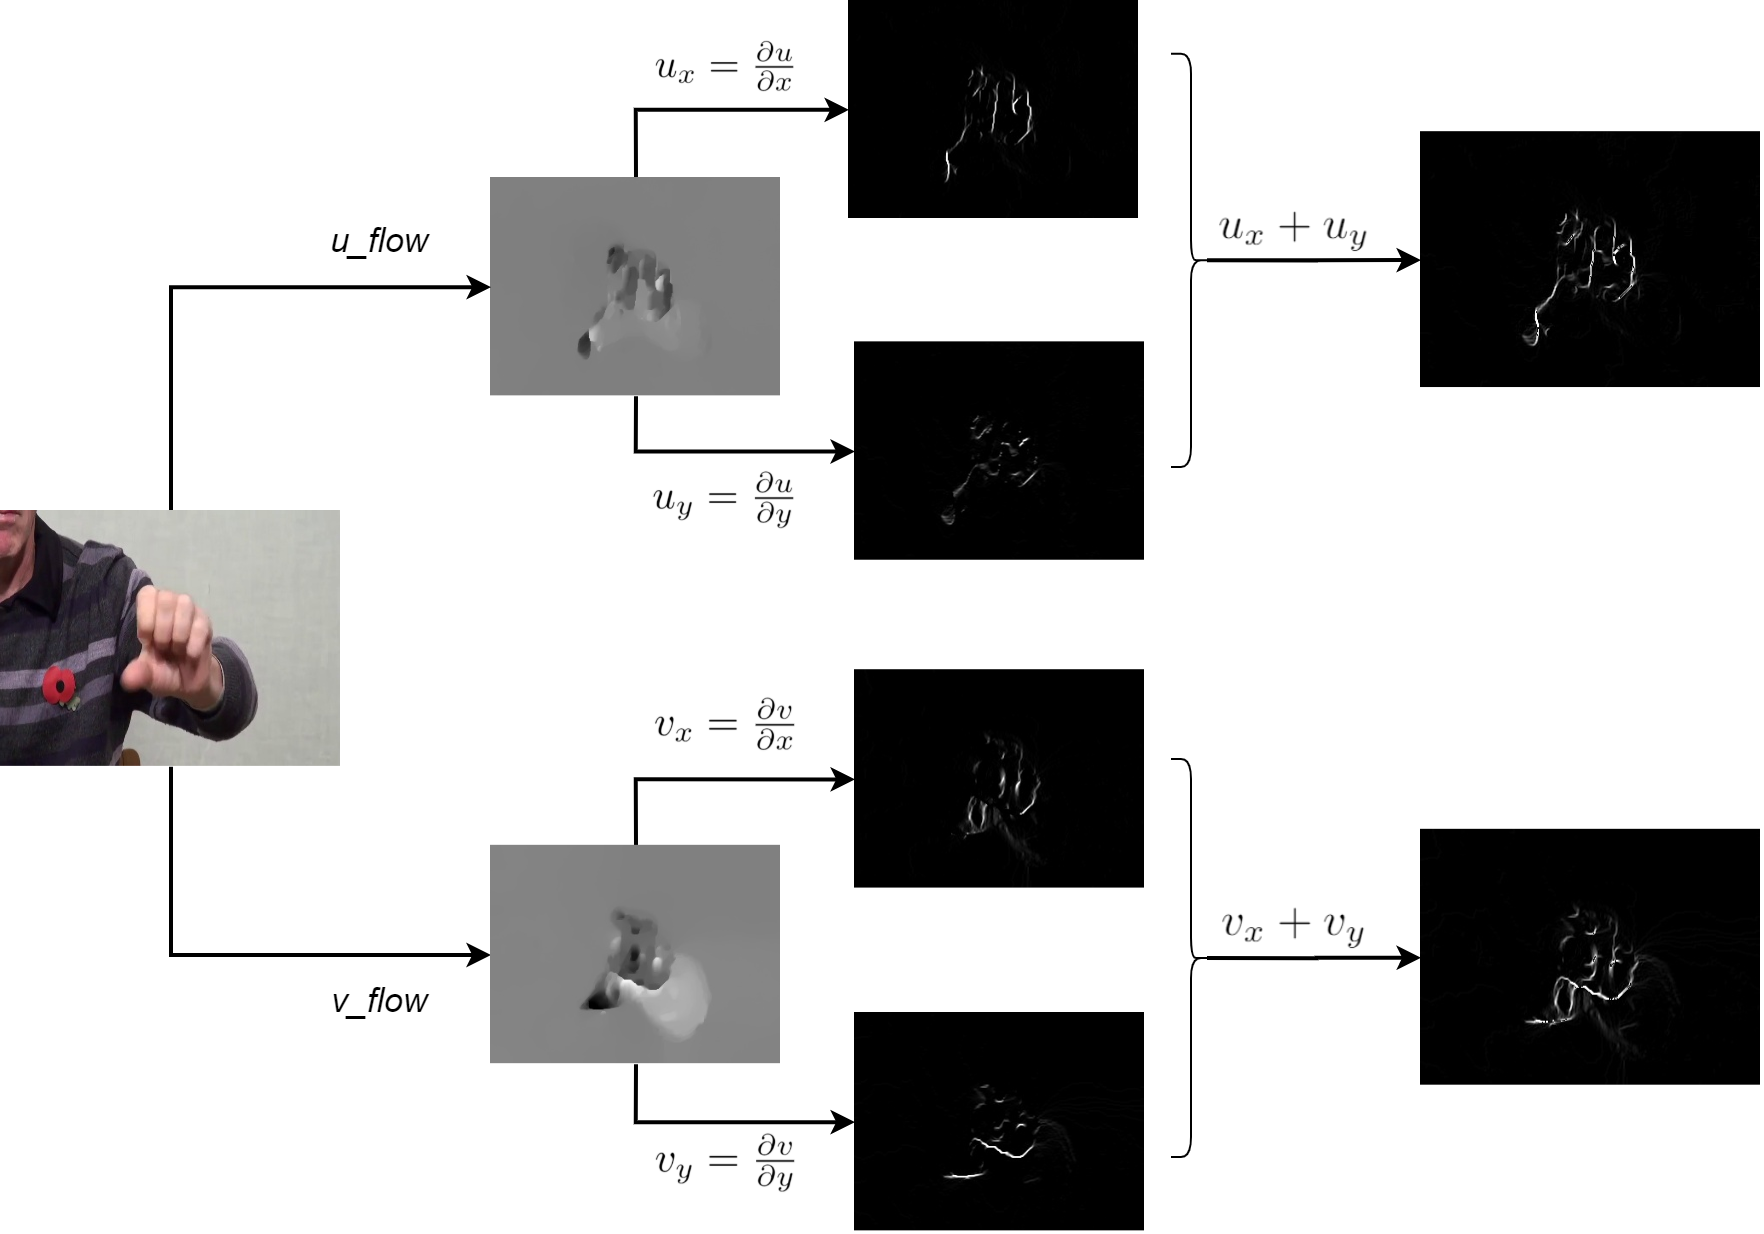
In a similar fashion to [5], we compute motion boundaries simply by a derivative operation on the optical flow components, as shown in Figure 2. Formally, let and represent the and derivatives of horizontal optical flow, and and represent the and derivatives of vertical optical flow respectively. Then, for any frame ,
| (3) |
where represents the motion boundary in horizontal optical flow , and represents the motion boundary in vertical optical flow , and is a summing function. It is clear that, for a video clip with frames, motion boundary frames are computed.
Class imbalance – In the PD dataset used in this study (see details in Section 4), the number of videos belonging to UPDRS scores 3 and 4 is significantly lower than those belonging to the other classes. Therefore, we have a class imbalance problem which can lead to a model biased towards the classes with large number of samples.
In order to mitigate this problem, we apply two strategies. In the first, we group the scores into three classes: score 0 for normal subjects - i.e. patients who are at very early stage of PD and may still have one unaffected upper limb, score 1-2 for subjects with mild symptoms, and score 3-4 for subjects with severe symptoms. In the second strategy, we utilize an extended version of the normal class entropy loss, called focal loss [34], to train our multi-class classification task. The original focal loss was proposed for single-class object detection in order to down-weight easy classes and better weight rarer classes by adding a factor to the standard cross entropy loss. Then, our loss function can be stated as
| (4) |
where is the UPDRS groundtruth label and adjusts the rate at which easy samples are down-weighted. This adds a modulating factor to the cross-entropy loss. When a sample is classified with a high probability, i.e. is large, the value of the modulating factor is small and the loss for that sample is down-weighted. In contrast, when a hard sample is misclassified with low probability, the modulating factor is large, increasing that sample’s contributions to the total loss. The value of is prefixed () to balance the importance of samples belonging to different classes. When and , the focal loss is equivalent to cross-entropy loss.
4 Experiments
In this section, we first present our PD dataset used for evaluating our proposed method. Then, we provide the experimental setup and our detailed ablation study of various aspects of our model. Finally, we compare our model with the state of the art works in human action recognition.
| Hand movement | Gait | ||||||||
| Score | #video |
|
#video |
|
|||||
| Normal (0) | 180 | 131/312 | 171 | 473/980 | |||||
| Mild (1-2) | 500 | 123/717 | 180 | 580/5007 | |||||
| Severe (3-4) | 24 | 202/1210 | 3 | 1367/3012 | |||||
4.1 Dataset
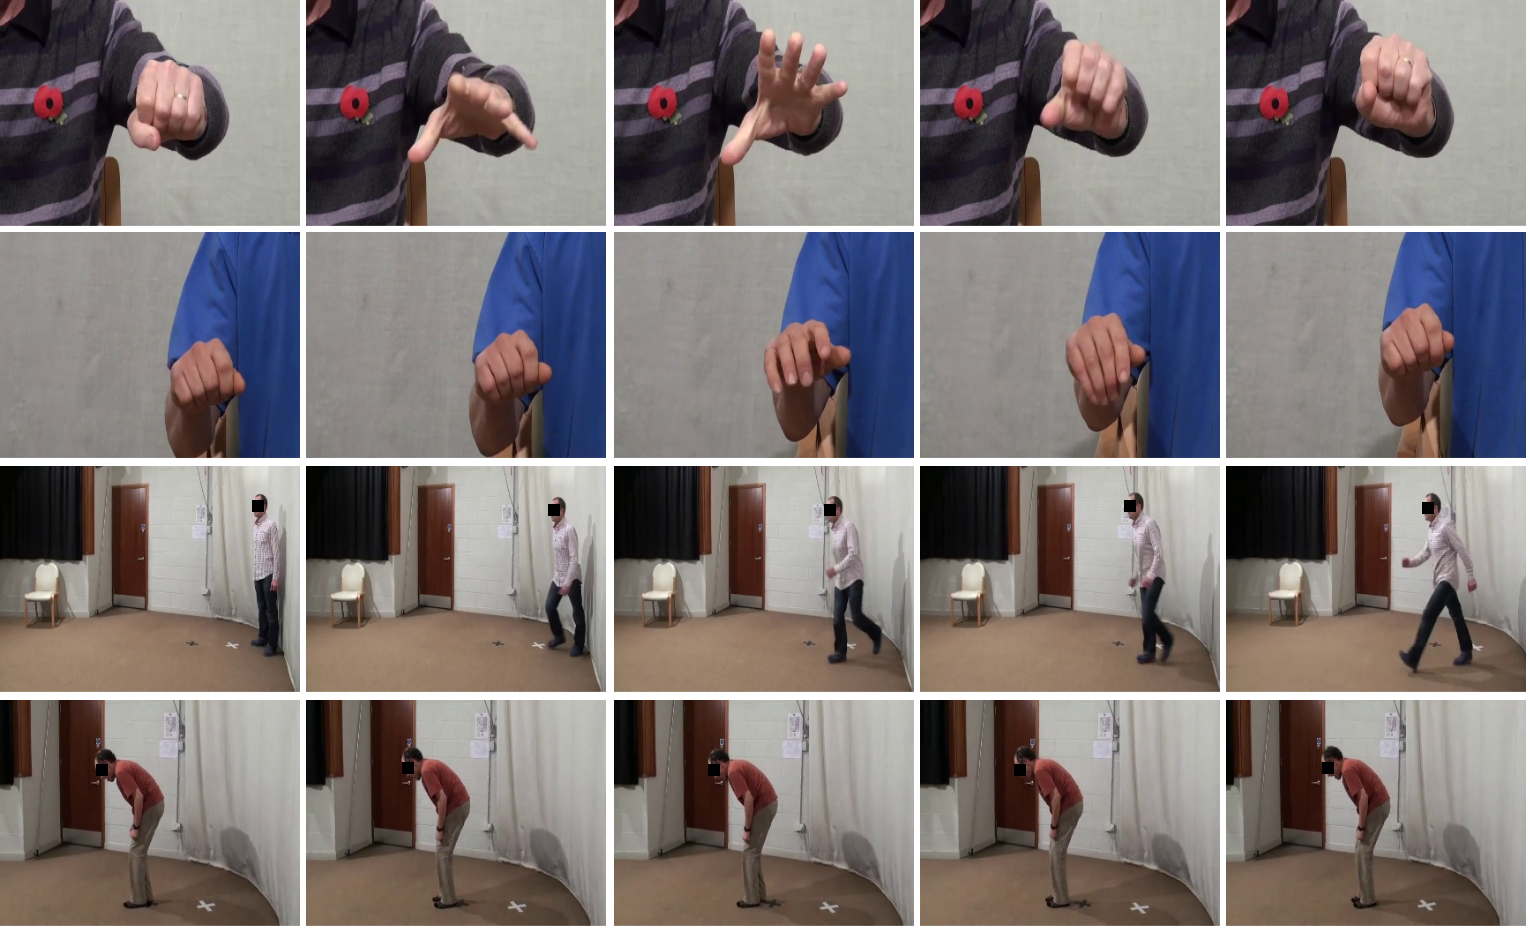
The Parkinson’s Disease dataset used in this study contains video data from 25 PD patients tested longitudinally at 8 week intervals over time. Subjects were between the ages of 41 to 72 years and performed UPDRS tasks and their scores were assigned by trained clinical raters. Videos were captured at 25fps at a resolution of 19201080, using a single RGB camera (SONY HXR-NX3). Our dataset consists of 1058 videos spanning two different UPDRS tasks: hand movement and gait. In the first task, the patients had to open and close their hand (each hand separately) 10 times, as fully and as quickly as possible. The second task is gait analysis in which the patients walked 10 metres at a comfortable pace and then returned to their starting point. Table 1 shows the number of videos in each of our score classes, as well as their minimum/maximum number of frames for each UPDRS task. Figure 3 shows sample frames from our dataset, selected from four subjects with different PD severity levels performing hand movement and gait tasks.
Implementation details – The input videos were reduced to a resolution of pixels. We used Pytorch to implement our models and TV-L1 [35] for computing optical flow fields. The focal loss (Eq. 4) parameters were set to and for all experiments. We applied Adam optimization with a learning rate of , and batch size to optimize our model parameters. Dropout was applied with a ratio of 0.7 before the output layer of our I3D network. All models were trained for 120 epochs using one Nvidia RTX 2048TI GPU under Cuda 10.1 with cuDNN 7.6.
4.2 Experimental Setup
Training and Testing details – Each video was split into equal segments along the temporal axis. Preserving chronological order, we randomly sampled frames within each video segment as a snippet. The length of our snippets is relatively larger than the length of snippets used in [7]. We verified empirically that for our PD task sampling these larger snippets can provide more application-specific motion characteristics to our network.
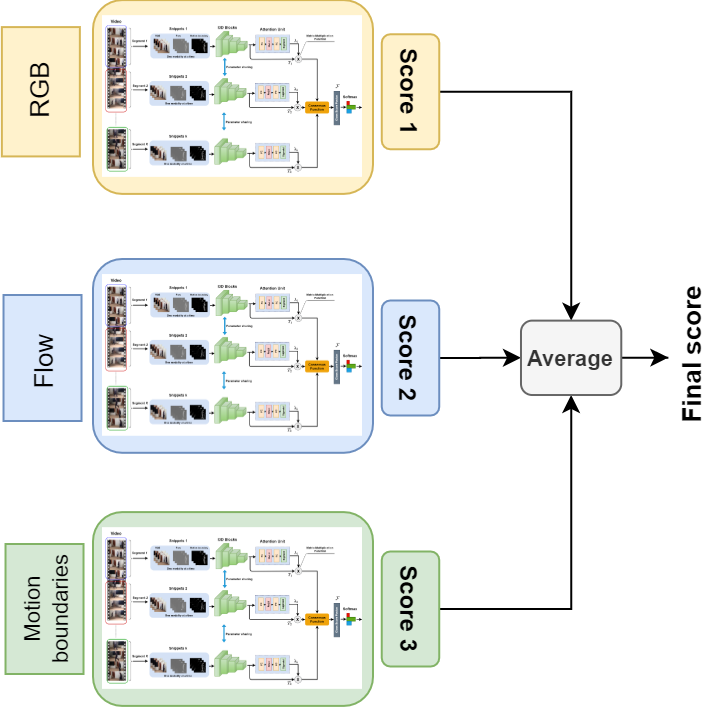
Since in the training step all I3D models share their parameters, our trained model behaves like the original I3D network [6] during testing. Therefore, we did not use temporal sampling when testing our model, allowing us to draw fair comparison with other models who also tested without temporal sampling, such as [27, 6, 28]. Specifically, during testing we used 64 non-sampled snippets per video, each containing consecutive frames. The prediction scores of all these snippets were then averaged across each or combined modalities to get a video-level score (as illustrated in Figure 4). Note, this follows the same approach as [6] where RGB and Flow were averaged at test time.
To avoid overfitting, we initialised our network by pretraining on Kinetics [36], and applied augmentation for all frames within each training snippet, including scale jittering, corner cropping, and horizontal flipping.
Evaluation metrics – We used 5-fold cross validation for 5 batches (given our 25 patients) to yield unbiased performance of the models and report the score over the average validation scores.
| Hand Movement | Gait | Average | ||||
| Input Modalities | attention | attention | attention | attention | attention | attention |
| RGB | 68.4 | 65.2 | 74.8 | 73.7 | 71.6 | 69.4 |
| Flow | 71.0 | 68.6 | 76.5 | 74.1 | 73.7 | 71.3 |
| Motion Boundaries | 72.3 | 70.0 | 76.8 | 76.5 | 74.5 | 73.2 |
| RGB + Flow | 69.9 | 68.8 | 76.2 | 75.1 | 73.0 | 71.9 |
| RGB + Motion Boundaries | 70.4 | 70.1 | 75.4 | 72.3 | 72.9 | 71.2 |
| Flow + Motion Boundaries | 71.7 | 71.7 | 77.1 | 76.2 | 74.4 | 73.9 |
| All Modalities | 71.1 | 70.2 | 77.1 | 75.1 | 74.1 | 72.6 |
| Model | RGB | Flow | MBs | Hand Movement | Gait | Average |
| Two-Stream [27] | ✓ | ✓ | ||||
| TSN [7] | ✓ | ✓ | ||||
| I3D [6] | ✓ | ✓ | ||||
| SlowFast [28] | ✓ | |||||
| TSN + SlowFast | ✓ | |||||
| Proposed Method w/o Focal loss | ✓ | |||||
| Proposed Method | ✓ | ✓ | 77.1 | |||
| Proposed Method | ✓ | 72.3 | 74.5 |
4.3 Results including Ablation Study
Choice of input modalities – The results in Table 2 show comparative evaluations on different input modalities. For the Hand Movement task, motion boundaries alone perform best at as they capture the characteristic motions in the task. This result improves over using RGB and Flow by and respectively. When Motion Boundaries are combined with RGB and Flow, the results improve over using those modalities alone to and respectively. For the gait task, where there is much more pronounced dynamic movement spatiotemporaly, all modalities perform comparatively well, with Flow+Motion Boundaries achieving the best performance at . On average, the use of Motion Boundaries is vindicated as a significant extra modality that can contribute to, or alone generate, improved results.
Effect of Attention – To study the influence of the attention units, we perform all our experiments with and without them. As seen in Table 2, in all experiments for hand movement and gait tasks, our model achieves better accuracy with the attention units. Again, even without attention units, Motion Boundaries play a significant role in improving the results over other modalities.
Performance of Other Architectures – Table 3 provides the percentages of other architectures adapted to provide a UPDRS score for our application. We used the same data augmentation strategy with focal loss to train all models. All the network weights were initialized with pre-trained models from Kinetics-400, except for the SlowFast network, as one of the properties of this model is training from scratch without needing any pre-training. Although we examined the performance of these architectures for all possible input modalities, we only report here their best results, again except for the SlowFast network, as this model is only based on RGB input. Thus, for example for I3D [6], its best result is when using Flow and Motion Boundaries. As shown in the table, our proposed approach performs better than these popular networks for both hand movement and gait tasks.
5 Conclusions
In this paper, we proposed an end-to-end network for the assessment of PD severity from videos for two UPDRS tasks: hand movement and gait. Our model builds upon an inflated 3D CNN trained by a temporal sampling strategy to exploit long-range temporal structure at low cost. We applied an attention mechanism along the temporal axis to provide learned attention weights for each video segment, allowing our model to focus more on the relevant parts of each video. We also proposed the use of motion boundaries as a viable input modality to suppress constant camera motion and showed its effect on the quality of the assessment scores quantitatively. We also evaluated the performance of several popular architectures for PD severity assessment.
One limitation of our approach is that it is unable to handle several UPDRS tasks in one training process in which we need to train and evaluate our model on each task separately. In future work, we hope to handle this issue through unsupervied learning and adopting multiple loss functions with an effective way to combine them.
Acknowledgements
The authors sincerely thank for the kind donations to the Southmead Hospital Charity and from Caroline Belcher. Their generosity has made this research possible.
References
- [1] Albert Samà, Carlos Pérez-López, J Romagosa, D Rodriguez-Martin, Andreu Català, Joan Cabestany, DA Perez-Martinez, and Alejandro Rodríguez-Molinero. Dyskinesia and motor state detection in parkinson’s disease patients with a single movement sensor. In 2012 Annual International Conference of the IEEE Engineering in Medicine and Biology Society, pages 1194–1197. IEEE, 2012.
- [2] YJ Zhao, LCS Tan, PN Lau, WL Au, SC Li, and N Luo. Factors affecting health-related quality of life amongst Asian patients with Parkinson’s disease. European Journal of Neurology, 15(7):737–742, 2008.
- [3] Christopher G Goetz, Barbara C Tilley, Stephanie R Shaftman, Glenn T Stebbins, Stanley Fahn, Pablo Martinez-Martin, Werner Poewe, Cristina Sampaio, Matthew B Stern, Richard Dodel, et al. Movement Disorder Society-sponsored revision of the Unified Parkinson’s Disease Rating Scale (MDS-UPDRS): scale presentation and clinimetric testing results. Movement Disorders: official Journal of the Movement Disorder Society, 23(15):2129–2170, 2008.
- [4] Laura M Cunningham, Chris D Nugent, George Moore, Dewar D Finlay, and David Craig. Computer-based assessment of movement difficulties in Parkinson’s disease. Computer Methods in Biomechanics and Biomedical Engineering, 15(10):1081–1092, 2012.
- [5] Navneet Dalal, Bill Triggs, and Cordelia Schmid. Human detection using oriented histograms of flow and appearance. In ECCV, pages 428–441. Springer, 2006.
- [6] Joao Carreira and Andrew Zisserman. Quo vadis, action recognition? a new model and the kinetics dataset. In CVPR, pages 6299–6308, 2017.
- [7] Limin Wang, Yuanjun Xiong, Zhe Wang, Yu Qiao, Dahua Lin, Xiaoou Tang, and Luc Van Gool. Temporal segment networks: Towards good practices for deep action recognition. In ECCV, pages 20–36. Springer, 2016.
- [8] Wenjie Pei, Tadas Baltrusaitis, David MJ Tax, and Louis-Philippe Morency. Temporal attention-gated model for robust sequence classification. In CVPR, pages 6730–6739, 2017.
- [9] Xiang Long, Chuang Gan, Gerard De Melo, Jiajun Wu, Xiao Liu, and Shilei Wen. Attention clusters: Purely attention based local feature integration for video classification. In CVPR, pages 7834–7843, 2018.
- [10] Hyoseon Jeon, Woongwoo Lee, Hyeyoung Park, Hong Ji Lee, Sang Kyong Kim, Han Byul Kim, Beomseok Jeon, and Kwang Suk Park. Automatic classification of tremor severity in Parkinson’s disease using a wearable device. Sensors, 17(9):2067, 2017.
- [11] Clayton R Pereira, Danilo R Pereira, Silke AT Weber, Christian Hook, Victor Hugo C de Albuquerque, and Joao P Papa. A survey on computer-assisted Parkinson’s disease diagnosis. Artificial Intelligence in Medicine, 95:48–63, 2019.
- [12] Enas Abdulhay, N Arunkumar, Kumaravelu Narasimhan, Elamaran Vellaiappan, and V Venkatraman. Gait and tremor investigation using machine learning techniques for the diagnosis of Parkinson disease. Future Generation Computer Systems, 83:366–373, 2018.
- [13] Markus A Hobert, Susanne Nussbaum, Tanja Heger, Daniela Berg, Walter Maetzler, and Sebastian Heinzel. Progressive gait deficits in Parkinson’s disease: A wearable-based biannual 5-year prospective study. Frontiers in Aging Neuroscience, 11:22, 2019.
- [14] Aite Zhao, Lin Qi, Jie Li, Junyu Dong, and Hui Yu. A hybrid spatio-temporal model for detection and severity rating of Parkinson’s disease from gait data. Neurocomputing, 315:1–8, 2018.
- [15] Yi Xia, ZhiMing Yao, Qiang Ye, and Nan Cheng. A dual-modal attention-enhanced deep learning network for quantification of Parkinson’s disease characteristics. IEEE Transactions on Neural Systems and Rehabilitation Engineering, 28(1):42–51, 2019.
- [16] Imanne El Maachi, Guillaume-Alexandre Bilodeau, and Wassim Bouachir. Deep 1D-Convnet for accurate Parkinson disease detection and severity prediction from gait. Expert Systems with Applications, 143:113075, 2020.
- [17] Murtadha D Hssayeni, Joohi Jimenez-Shahed, Michelle A Burack, and Behnaz Ghoraani. Wearable sensors for estimation of Parkinsonian tremor severity during free body movements. Sensors, 19(19):4215, 2019.
- [18] Luis Sigcha, Nélson Costa, Ignacio Pavón, Susana Costa, Pedro Arezes, Juan Manuel López, and Guillermo De Arcas. Deep Learning Approaches for Detecting Freezing of Gait in Parkinson’s Disease Patients through On-Body Acceleration Sensors. Sensors, 20(7):1895, 2020.
- [19] J Hall, S Hannuna, M Camplani, M Mirmehdi, D Damen, T Burghardt, L Tao, A Paiement, and I Craddock. Designing a video monitoring system for AAL applications: The SPHERE case study. 2016.
- [20] Qiannan Li, Yafang Wang, Andrei Sharf, Ya Cao, Changhe Tu, Baoquan Chen, and Shengyuan Yu. Classification of gait anomalies from Kinect. The Visual Computer, 34(2):229–241, 2018.
- [21] Margarita Khokhlova, Cyrille Migniot, Alexey Morozov, Olga Sushkova, and Albert Dipanda. Normal and pathological gait classification LSTM model. Artificial Intelligence in Medicine, 94:54–66, 2019.
- [22] Michael H Li, Tiago A Mestre, Susan H Fox, and Babak Taati. Vision-based assessment of Parkinsonism and levodopa-induced dyskinesia with pose estimation. Journal of Neuroengineering and Rehabilitation, 15(1):97, 2018.
- [23] Silvia L Pintea, Jian Zheng, Xilin Li, Paulina JM Bank, Jacobus J van Hilten, and Jan C van Gemert. Hand-tremor frequency estimation in videos. In ECCV, 2018.
- [24] Chun-Min Chang, Yu-Lin Huang, Jui-Cheng Chen, and Chi-Chun Lee. Improving Automatic Tremor and Movement Motor Disorder Severity Assessment for Parkinson’s Disease with Deep Joint Training. In EMBC, pages 3408–3411. IEEE, 2019.
- [25] Shih-En Wei, Varun Ramakrishna, Takeo Kanade, and Yaser Sheikh. Convolutional pose machines. In CVPR, pages 4724–4732, 2016.
- [26] Zhe Cao, Gines Hidalgo, Tomas Simon, Shih-En Wei, and Yaser Sheikh. OpenPose: realtime multi-person 2D pose estimation using Part Affinity Fields. arXiv preprint arXiv:1812.08008, 2018.
- [27] Karen Simonyan and Andrew Zisserman. Two-stream convolutional networks for action recognition in videos. In Advances in Neural Information Processing Systems, pages 568–576, 2014.
- [28] Christoph Feichtenhofer, Haoqi Fan, Jitendra Malik, and Kaiming He. Slowfast networks for video recognition. In ICCV, pages 6202–6211, 2019.
- [29] Kun Liu, Wu Liu, Chuang Gan, Mingkui Tan, and Huadong Ma. T-C3D: Temporal convolutional 3D network for real-time action recognition. In Thirty-second AAAI Conference on Artificial Intelligence, 2018.
- [30] Christian Szegedy, Wei Liu, Yangqing Jia, Pierre Sermanet, Scott Reed, Dragomir Anguelov, Dumitru Erhan, Vincent Vanhoucke, and Andrew Rabinovich. Going deeper with convolutions. In CVPR, pages 1–9, 2015.
- [31] Phuc Nguyen, Ting Liu, Gautam Prasad, and Bohyung Han. Weakly supervised action localization by sparse temporal pooling network. In CVPR, pages 6752–6761, 2018.
- [32] Marie-Neige Chapel and Thierry Bouwmans. Moving Objects Detection with a Moving Camera: A Comprehensive Review. arXiv preprint arXiv:2001.05238, 2020.
- [33] Heng Wang and Cordelia Schmid. Action recognition with improved trajectories. In Proceedings of the IEEE international conference on computer vision, pages 3551–3558, 2013.
- [34] Tsung-Yi Lin, Priya Goyal, Ross Girshick, Kaiming He, and Piotr Dollár. Focal loss for dense object detection. In ICCV, pages 2980–2988, 2017.
- [35] Christopher Zach, Thomas Pock, and Horst Bischof. A duality based approach for realtime TV-l 1 optical flow. In Joint Pattern Recognition Symposium, pages 214–223. Springer, 2007.
- [36] Will Kay, Joao Carreira, Karen Simonyan, Brian Zhang, Chloe Hillier, Sudheendra Vijayanarasimhan, Fabio Viola, Tim Green, Trevor Back, Paul Natsev, et al. The kinetics human action video dataset. arXiv preprint arXiv:1705.06950, 2017.