Interplay of Fractional Chern Insulator and Charge-Density-Wave Phases
in Twisted Bilayer Graphene
Abstract
We perform an extensive exact diagonalization study of interaction driven insulators in spin- and valley-polarized moiré flat bands of twisted bilayer graphene aligned with its hexagonal boron nitride substrate. In addition to previously reported fractional Chern insulator phases, we provide compelling evidence for competing charge-density-wave phases at multiple fractional fillings of a realistic single-band model. A thorough analysis at different interlayer hopping parameters, motivated by experimental variability, and the role of kinetic energy at various Coulomb interaction strengths highlight the competition between these phases. The interplay of the single-particle and the interaction induced hole dispersion with the inherent Berry curvature of the Chern bands is intuitively understood to be the driving mechanism for the ground-state selection. The resulting phase diagram features remarkable agreement with experimental findings in a related moiré heterostructure and affirms the relevance of our results beyond the scope of graphene based materials.
I Introduction
Over the course of the past three years, twisted bilayer graphene (TBLG) and related moiré heterostructures emerged as promising platforms for the study of interaction effects in realistic flat band systems. The ability to engineer bands of minimal bandwidth via two stacked graphene sheets subject to a relative magic twist-angle of about , in combination with the excellent experimental tunability of the band filling through electric gates has lead to a tremendous growth of interest in the field of graphene-based moiré materials. Experimental observations of correlated insulators in proximity to potentially unconventional superconductivity [1, 2, 3, 4] raised hopes that the study of this composite system may shine light on the long-standing mystery of the mechanism behind high-temperature superconductivity in cuprates. More recent experiments point to the possibility that these correlated insulators and superconductivity might have distinct microscopic origins though [5, 6, 7, 8]. The nature of the superconducting phase and its pairing mechanism is generally subject to hot debates, including exotic proposals involving topological solitons – skyrmions – carrying charge [9, 10, 11, 12, 13, 14, 15]. Further experimental signatures include ferromagnetism [16] and a quantized anomalous Hall effect [17] in TBLG aligned with the hexagonal boron nitride (hBN) substrate (TBLG/hBN), which suggests that a Chern insulator may be realized in TBLG related materials. The incorporation of interactions naturally leads to the question whether a fractional Chern insulator may form in TBLG, which has been answered affirmatively using exact diagonalizations in Refs. [18, 19] and analytically in Ref. [20].
Studies of TBLG-inspired Hofstadter models on the honeycomb lattice reiterate the importance of fractional quantum Hall (FQH) states at fillings as well as [21]. Further exact diagonalization [22] and DMRG based [23, 24] calculations support the formation of a Chern insulator as well as the possibility for different types of spatial symmetry breaking charge-density-waves (CDW) in pure TBLG. The former predictions are corroborated by the experimental observation of interaction induced Chern insulators at multiple integer fillings [25].
Very recently, novel sensing techniques were used to reveal insulating behavior at fractional single-band fillings , , , , , of a related moiré heterostructure based on transition metal dichalcogenides (TMD), such as / [26, 27]. The order mediated by Coulomb interactions is suggested to be of CDW-type, realizing generalized Wigner crystals (WC) that are locked to certain commensurate filling fractions of the moiré lattice and spontaneously break translational symmetry. This is in accordance with the possibility to engineer flat bands and the resulting signatures of collective phases reported in Ref. 28 for twisted bilayers of close to half-band filling.
The intrinsic competition of FQH states with WCs and CDWs at fractional fillings has a long history and dates back to early studies of interaction effects in the two-dimensional electron gas subject to a magnetic field [29, 30, 31, 32, 33, 34, 35]. More recently the lattice generalization of a topological Laughlin-like state, the fractional Chern insulator (FCI), has attracted considerable interest [36, 37, 38, 39, 40, 41]. In graphene related systems, a CDW as well as the FCI have been observed experimentally [42, 43]. Both types of bulk insulating phases inherently rely on the presence of strong electron-electron interactions, while the FCI additionally requires an effective magnetic field, quantified by a finite Chern number of the fractionally filled band. As the kinetic energy typically weakens such order tendencies, realizations of (nearly) flat bands are typically expected to be a prerequisite to study the competition of these two strongly correlated phases.
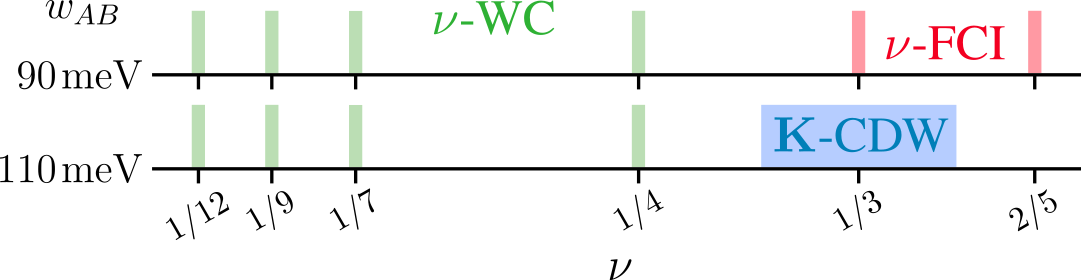
In our work, using large-scale exact diagonalizations, we carefully explore to what extent a similar competition is at work in a realistic spin- and valley-polarized single-band model for TBLG/hBN. We demonstrate that indeed charge ordered states are strong contenders for the ground-state at several fractional fillings, including cases where previous work highlighted the presence of an FCI state [18, 19]. Furthermore, the nature of the CDWs is shown to go beyond the simple WC-type, realizing stable -CDW order across a whole range of fillings for suitable band parameters. We show that the quantum geometry, manifest in the inhomogeneous distribution of the Berry curvature, but also the nontrivial momentum dependence of the single-particle dispersion have a strong influence on the FCI/CDW competition beyond the mere presence of a flat Chern band. This understanding allowed us to uncover another FCI state at , akin to the results of Ref. 19. The acquired intuition in conjunction with the extensive amount of numerical evidence is condensed in the tentative phase diagram of Fig. 1. Drawing connections to the experiment, the agreement of our results in Fig. 1 at for TBLG/hBN with those of the TMD moiré system in Ref. 26 suggests a substantial degree of similarity for the physics at play. The added twist of topological nontriviality in TBLG/hBN, however, enables more exotic correlated phases for different band parameters, ensuring again the diversity of physics contained in graphene based moiré structures.
This work is organized as follows: Section II introduces the single-particle model as well as the single-band-projected many-body Hamiltonian and gives an overview of crucial quantities that characterize the model for a certain choice of hopping parameters. We subsequently give a brief overview of the applied numerical method as well as important observables that characterize the discussed correlated phases in Sec. III. The main volume of numerical results is presented throughout Sec. IV, including solid evidence for CDW/WCs at multiple filling fractions as well as the identification of two hierarchy FCI states at and . In Sec. V, the results are condensed into a tentative phase diagram as a function of the electron filling and important aspects of the phases’ nature and stability towards the removal or addition of additional electrons are revealed. This section also demonstrates the commonalities and differences of the two distinguished hopping parameter regions at a glance and allows us to draw possible connections to the experiment in Ref. 26.
II Model
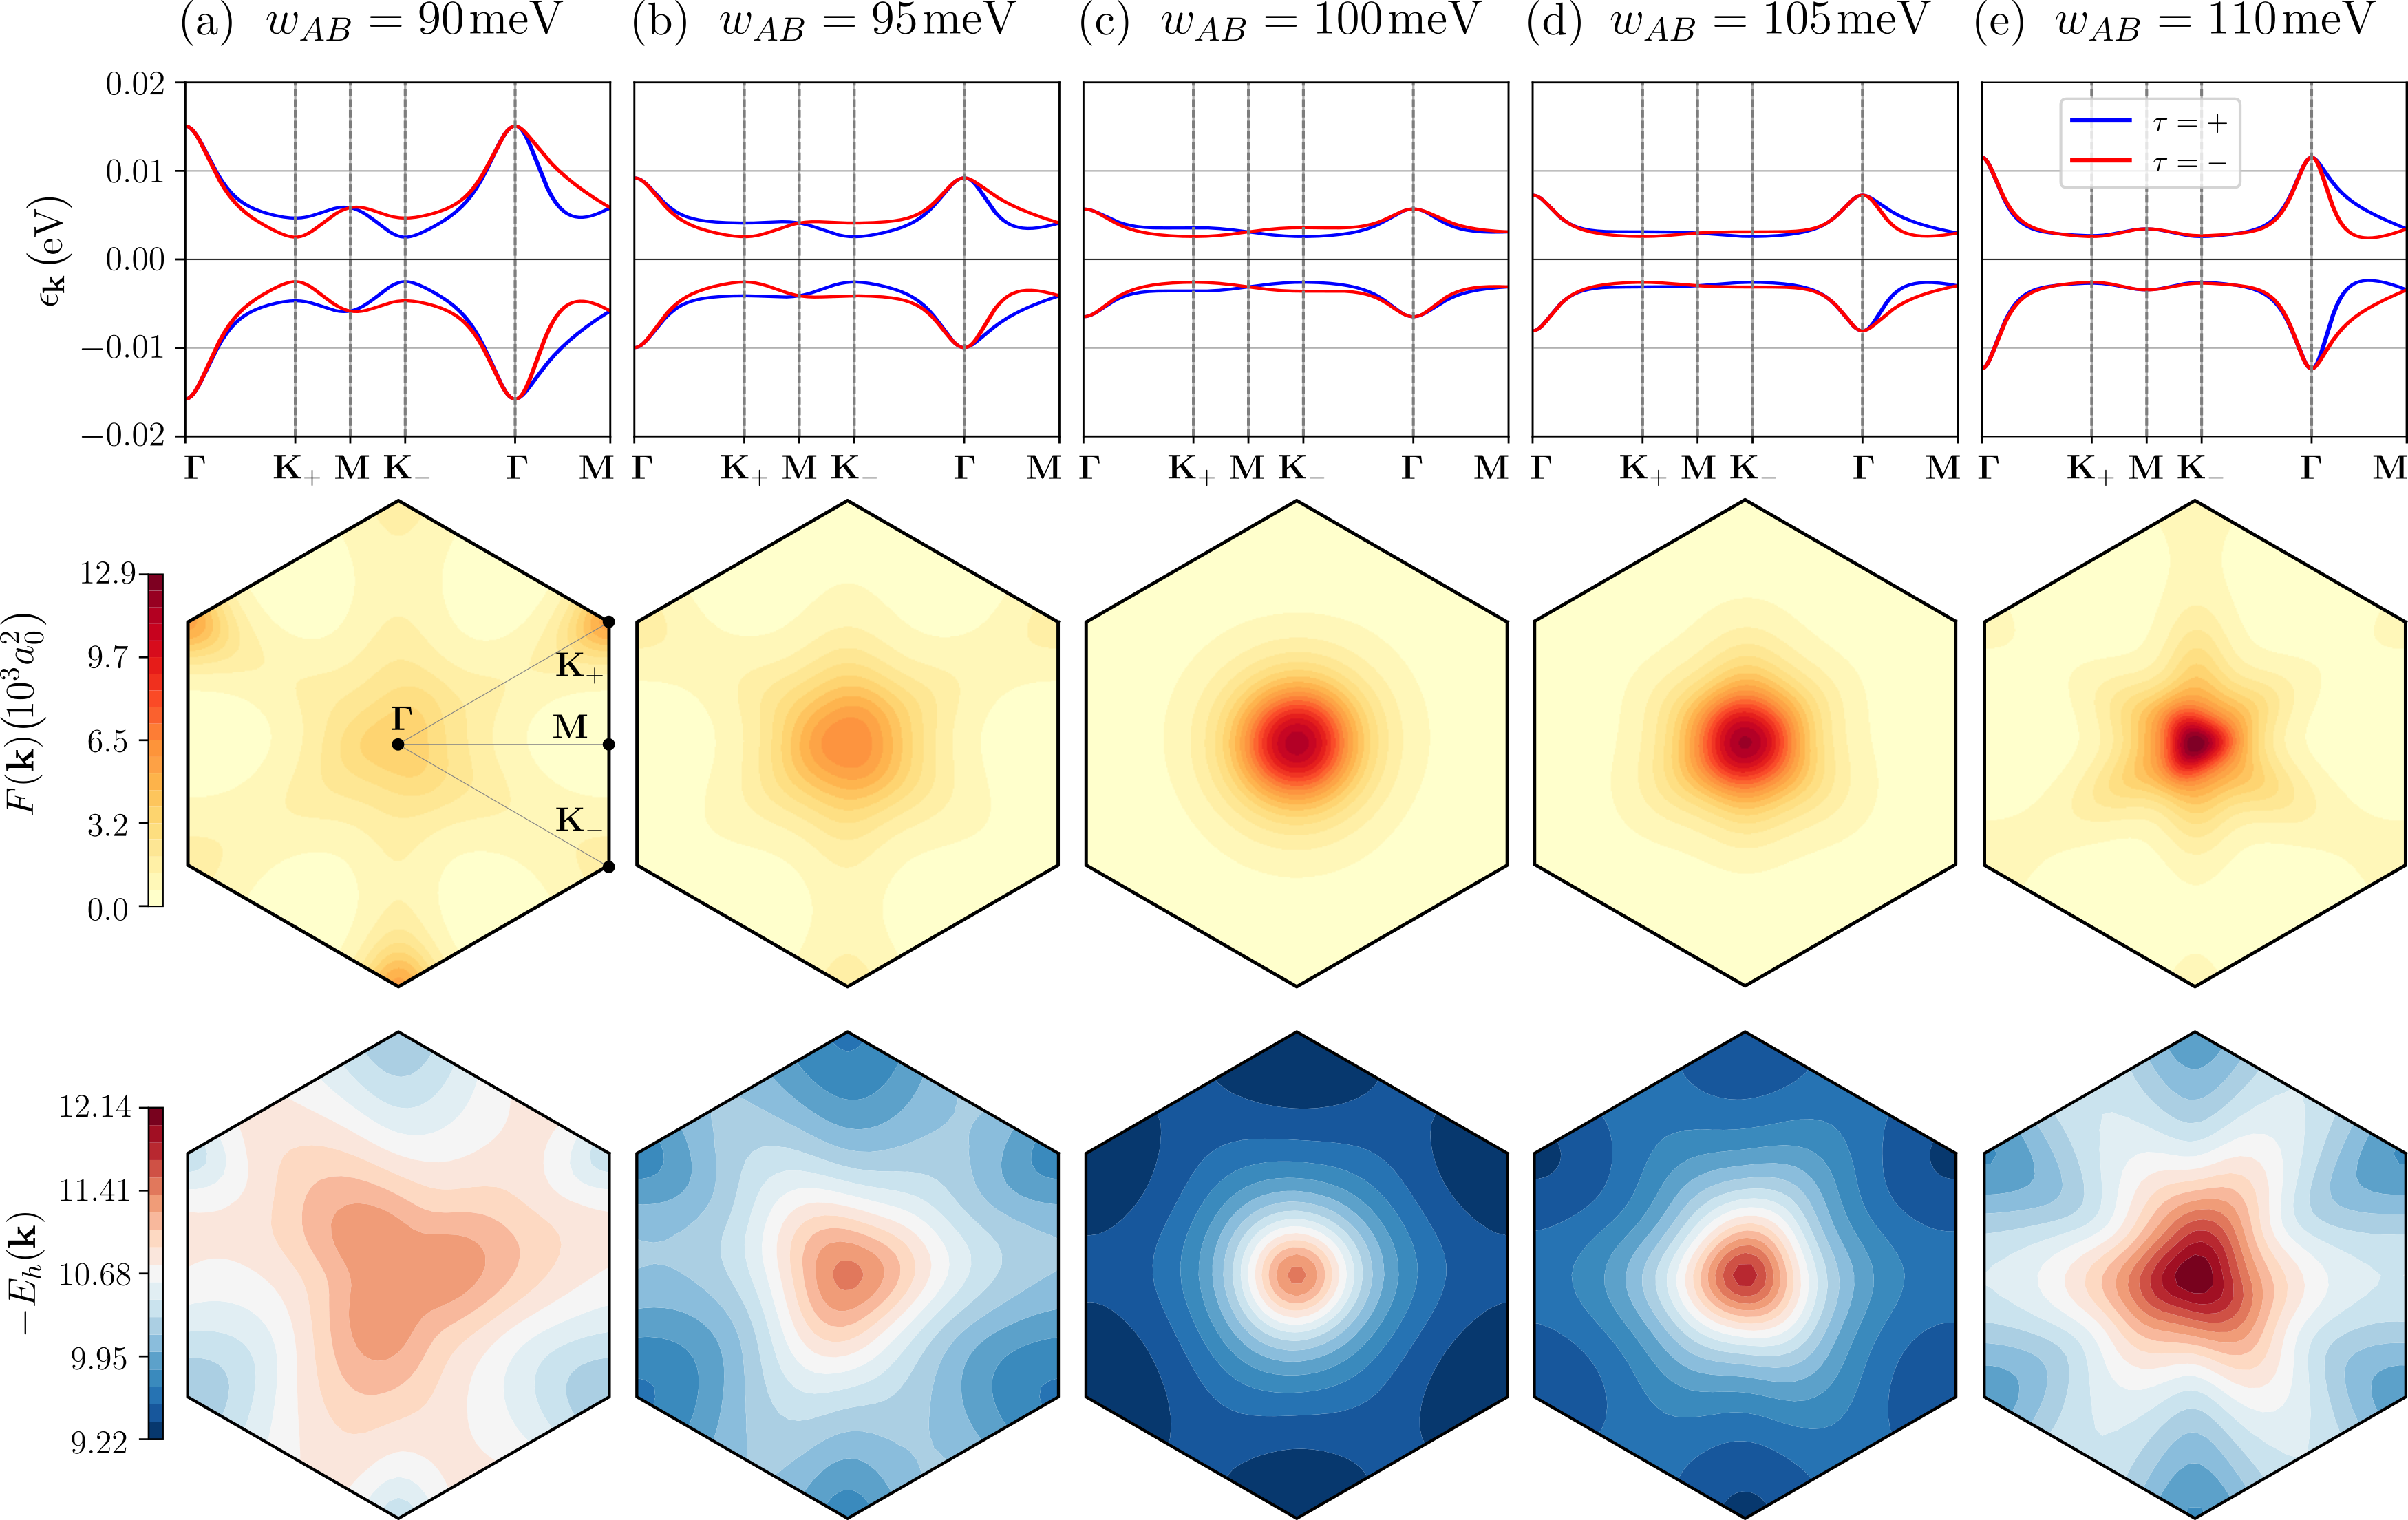
Our exact diagonalization study is based on the continuum model description of TBLG [44, 45] at (the commensurate superlattice in Ref. 46). We choose the nearest-neighbor hopping amplitude from graphene and additionally include a phenomenological layer corrugation by using distinct intra- and intersublattice hopping amplitudes and [47, 18, 48]. Throughout this manuscript we fix , and is varied between the realistic values of and to account for model variations and the presence of strain or pressure in samples [45, 49, 50, 47, 18]. We assume alignment with the hBN substrate, which, to lowest order, introduces a staggered potential that breaks sublattice symmetry and thus gaps the previously massless Dirac cones at the corners of the moiré Brillouin zone (MBZ) [51]. The resulting flat valence (conduction) bands of the valleys, presented in the top row of Fig. 2, then acquire a Chern number . For a realistic substrate induced potential of [51], the valence and conduction bands are well separated, such that they may be treated separately for appropriate bandwidths and interaction strengths. Except for an inversion of the valley resolved bands along the - path and an increased asymmetry of the gaps at for lower , the single-particle dispersions in Fig. 2 are qualitatively similar for all considered values of . A more profound distinction is present in the Berry curvature of the valence band in the middle row of Fig. 2. The rather uniform distribution for gradually develops a peak at upon increasing to . The analysis remains valid upon switching valley or band, as the Berry curvature is almost identical up to a sign flip, or combined sign coordinate inversion. Minor quantitative differences are the consequence of the slight particle-hole asymmetry of the dispersion. At this stage, it should be noted that the flatness of the Berry curvature is controlled by the combined choice of band parameters and twist angle, enabling a relatively uniform distribution also for at in Ref. 19.
We incorporate the Coulomb interaction via the two-dimensional Fourier transform of a Yukawa potential . Here, and are the elementary charge and vacuum dielectric constant, respectively, denotes the total area of the system and the screening length. The relative dielectric permittivity effectively scales the interaction strength, however it is replaced in our treatment by a convex combination of the kinetic and interacting parts of the full Hamiltonian and is thus set to a sensible value of . If not mentioned otherwise, in accordance with previous authors we choose to match the moiré period [18, 52, 53]. Motivated by experimental signatures [54, 55, 16, 56] and theoretical findings [48, 19] we assume full flavor polarization, resulting in an interaction Hamiltonian that acts on spinless fermions of a single valley. Because the two valley flavors of the model are related by time-reversal symmetry, we choose to study electrons in the valence band with Chern number at an electron filling . To incorporate this truncation of the band and flavor interaction channels in the model, we have to project the ordinary density-density interaction operator to the band basis. This step has been detailed in Refs. [57, 48, 58, 59, 18]. The resulting single-band-projected interaction Hamiltonian then reads
| (1) |
where () denotes the creation (annihilation) operator of band electrons in an orbital with momentum . The matrix elements are defined as
| (2) | ||||
represents form factors that contain overlaps of the band eigenvectors and the summation is over the moiré reciprocal lattice vectors of the continuum model discretization. In the band diagonal basis, the kinetic term takes the simple form . Although we start off by assuming a completely flat band and thus neglect , in later sections we account for a finite dispersion by a convex combination of the kinetic and interaction Hamiltonians as . This is physically equivalent to altering the permittivity , but leaves the energy scale of the problem approximately constant. This simplifies the interpretation of spectra and provides additional numerical stability. An effective dielectric constant is thus given by which matches at . In the case of pure interactions () we use units of energy , whereas for the combined Hamiltonian we use .
Upon performing a particle-hole transformation, the interaction Hamiltonian induces a single-hole dispersion [18, 40]
| (3) |
which turns out to be a useful characteristic for the intuitive understanding of one important aspect of the Coulomb interaction structure in this system. This (sign flipped) induced hole dispersion (IHD) is evaluated in the bottom row of Fig. 2. As varies, the features of remain qualitatively similar with a pronounced maximum at . The same holds for the situation in the conduction band. The IHD of differs from the one with primarily by a larger bandwidth.
Figure 2 suggests that the vital differences in the model are captured in the cases and , while intermediate values smoothly interpolate between these scenarios. We thus restrict ourselves to the two representative cases and in our exact diagonalization study of the many-body Hamiltonian.
III Numerical method and signatures of correlated phases
Similarly to Refs. [18, 19, 22], we use Lanczos based exact diagonalization (ED) in momentum space to tackle the many-body problem of interacting band-fermions. This enables us to obtain numerically exact ground-state energies as well as measurements of observables on finite size clusters with various geometric features at arbitrary filling fractions. In the considered spin- and valley-polarized subsector of a single band, the total Hilbert space dimension for a given number of electrons on orbitals is the binomial coefficient . By utilizing the translational symmetry of the system, the total Hilbert space decomposes into subspaces of center of mass (COM) momenta . In order to keep the code applicable to general geometries and Hamiltonians of potentially reduced symmetry, no point group operations are exploited in the algorithm. The average linear matrix dimension is then , which culminates in about 252 million states in the study of the cluster LABEL:cl:6.0.0.6 at .
The algorithm provides access to the ground-state wave function(s) as well as the momentum orbital resolved low-energy spectrum. This is a key advantage of the ED method, as many phases have distinct signatures in the structure of the low-energy spectrum, e.g., in the k-space location and degree of quasi-degenerate ground-state energy levels. To be precise, it should be noted that exact degeneracy generally holds only in the thermodynamic limit (TDL) and a finite splitting of the ground-state manifold is to be expected on finite clusters. With regard to the phases encountered in the current study, at a filling of the FCI manifests in the spectrum via a -fold degeneracy of orbitals satisfying the generalized Pauli principle developed in Ref. 39, which was extended to a heuristics on more general clusters in Ref. 40. In addition, the ground-state orbitals of an FCI are expected to exhibit spectral flow, that is, under the insertion of magnetic flux quanta like they exchange their order without mixing with excited states. The flow of orbitals into each other may be hindered if all ground-states coincide in their COM momentum. Nevertheless, they should remain isolated from higher lying states and the original spectrum has to be restored at . On the other hand, the degeneracy of the CDW depends on the specific pattern that is realized, i.e. in what manner the spatial symmetry is broken. For a simple WC-like order (with a single orientation) at , the ground-state is -fold degenerate, with orbitals separated by the order vectors . The possible variants of more complex patterns need to be counted individually, however the spontaneous symmetry breaking aspect may generally be analyzed using group theoretical tools in order to predict the location of ground-state COM orbitals [60]. A particular pattern manifests in the spatial correlations of the charge density, which can be measured using the charge structure factor. In the considered single-band-projected setting, we define it as
| (4) | ||||
where is the orbital occupation. A detailed derivation may be found in App. B.
IV Competition of correlated phases at canonical filling fractions
We start our discussion of numerical results with the single-band model at filling. We find strong evidence for the manifestation of an FCI for the band parameter , therefore corroborating the findings in Ref. [18], and a translation symmetry breaking CDW with order wave vector at , which is at odds with Ref. [18]. We provide an explanation for the underlying order mechanisms and investigate the stability of the phases against the introduction of kinetic energy. After highlighting the differences and commonalities in the conduction band and for the complementary filling , we turn to the investigation of other potentially interesting fractions. We reveal a series of WCs at commensurate fillings as well as the realization of a second FCI at , confirming similar calculations in Ref. 19. Finally, we present our numerical results for half filling of the moiré flat band, which, however, do not allow us to conclusively determine the nature of the ground-state.
IV.1 FCI versus CDW at
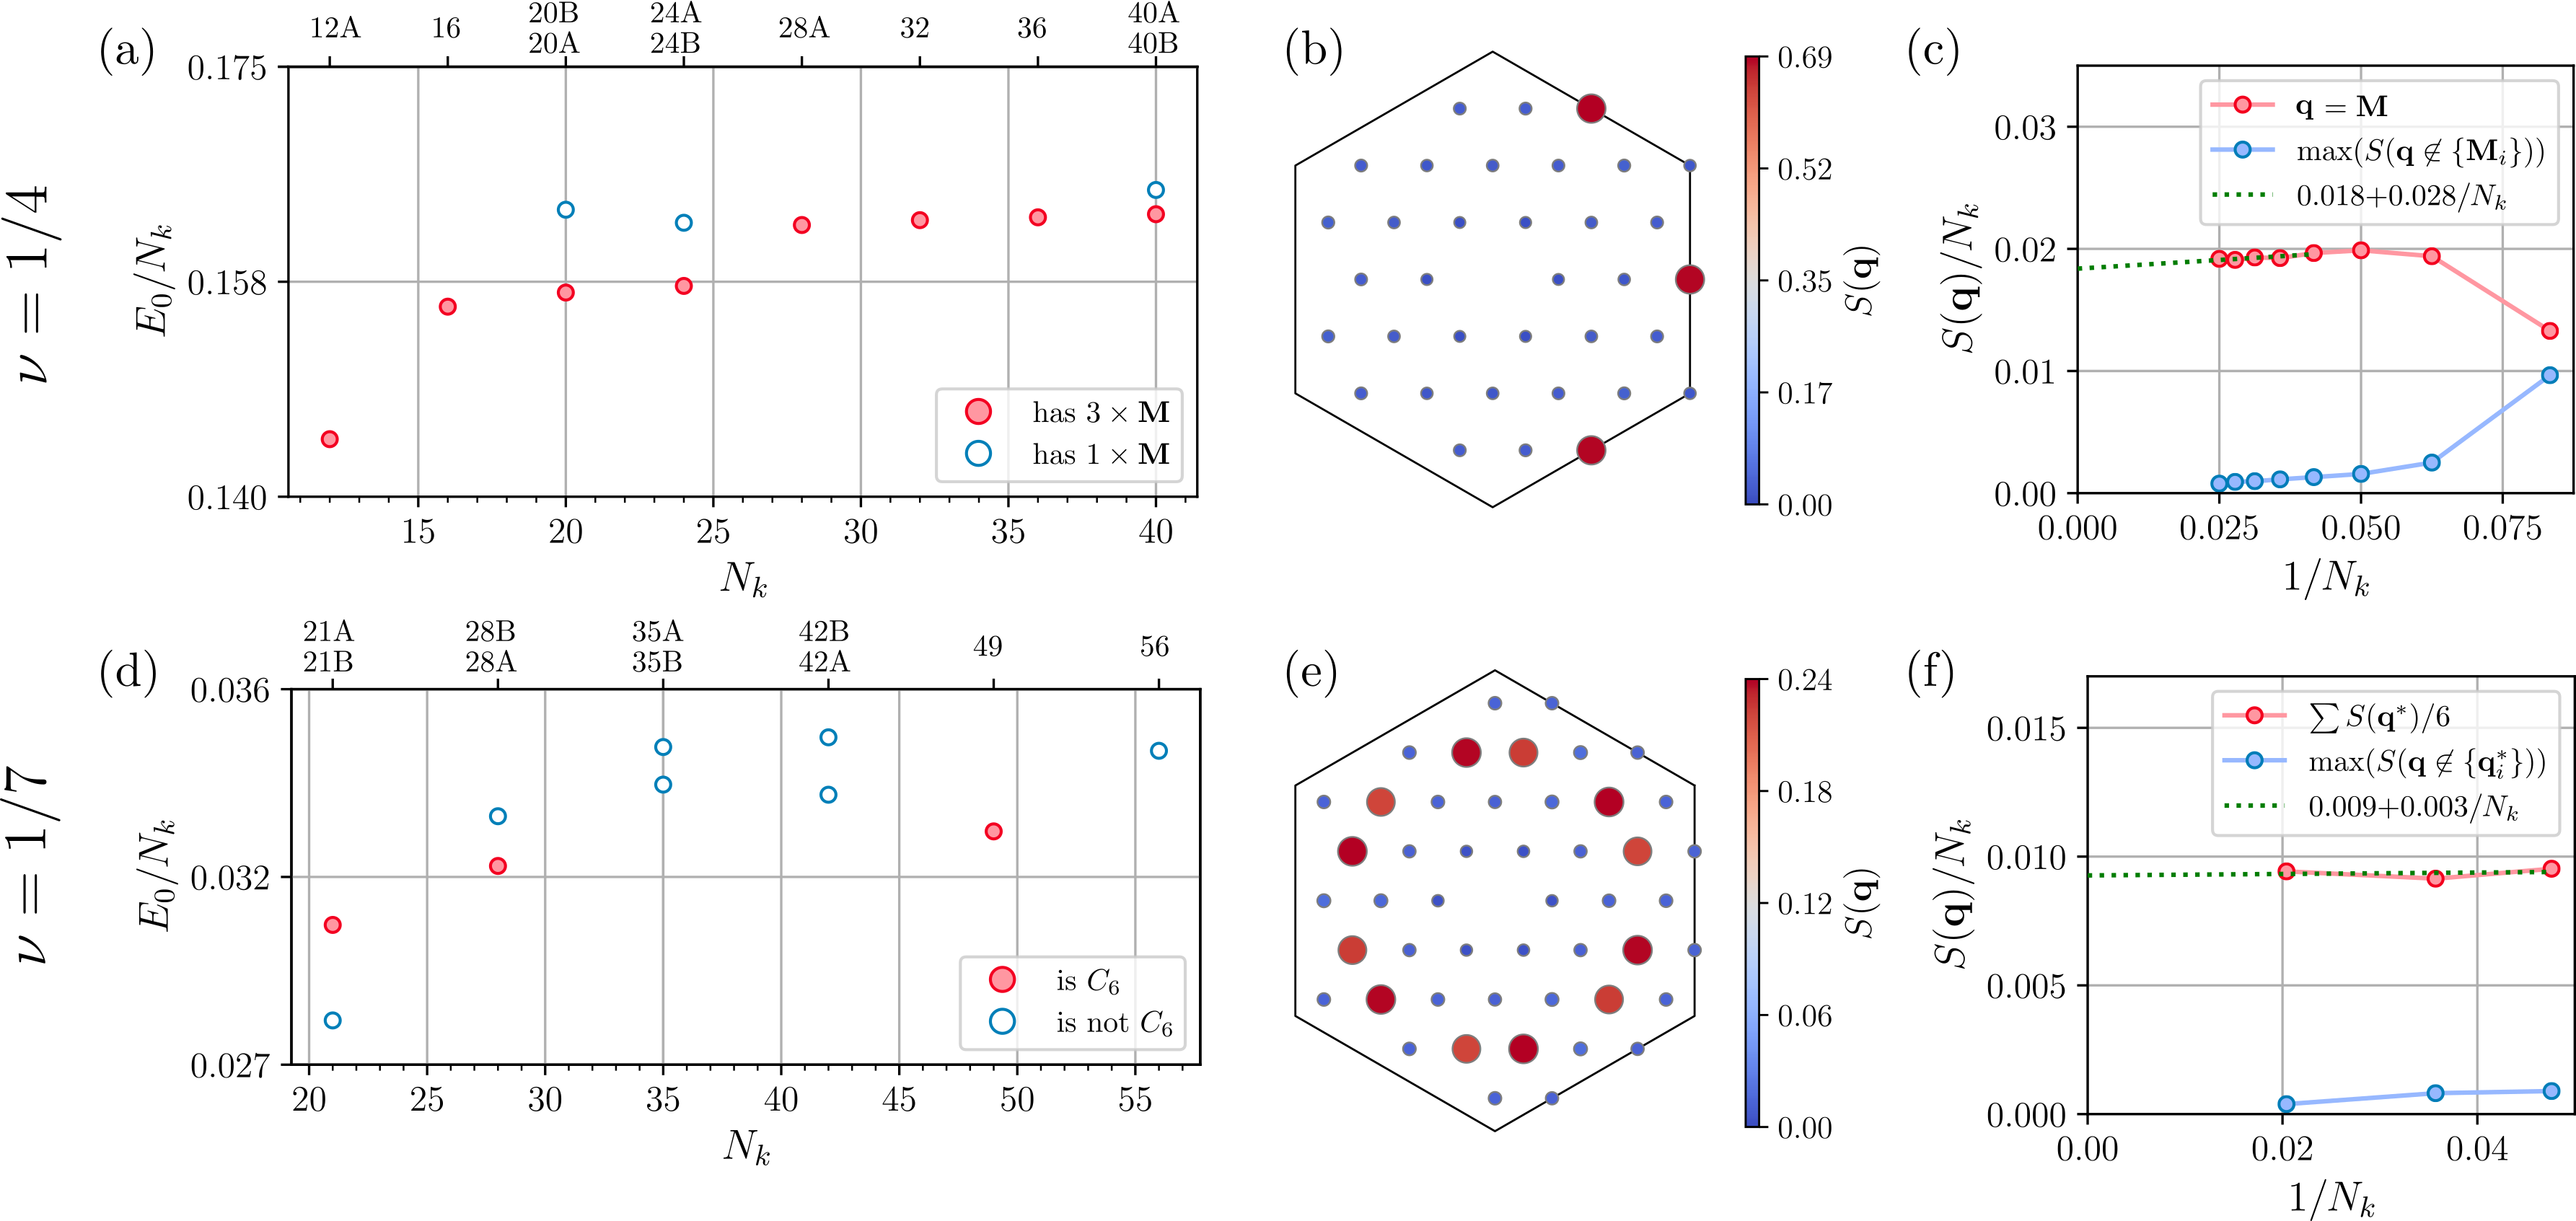
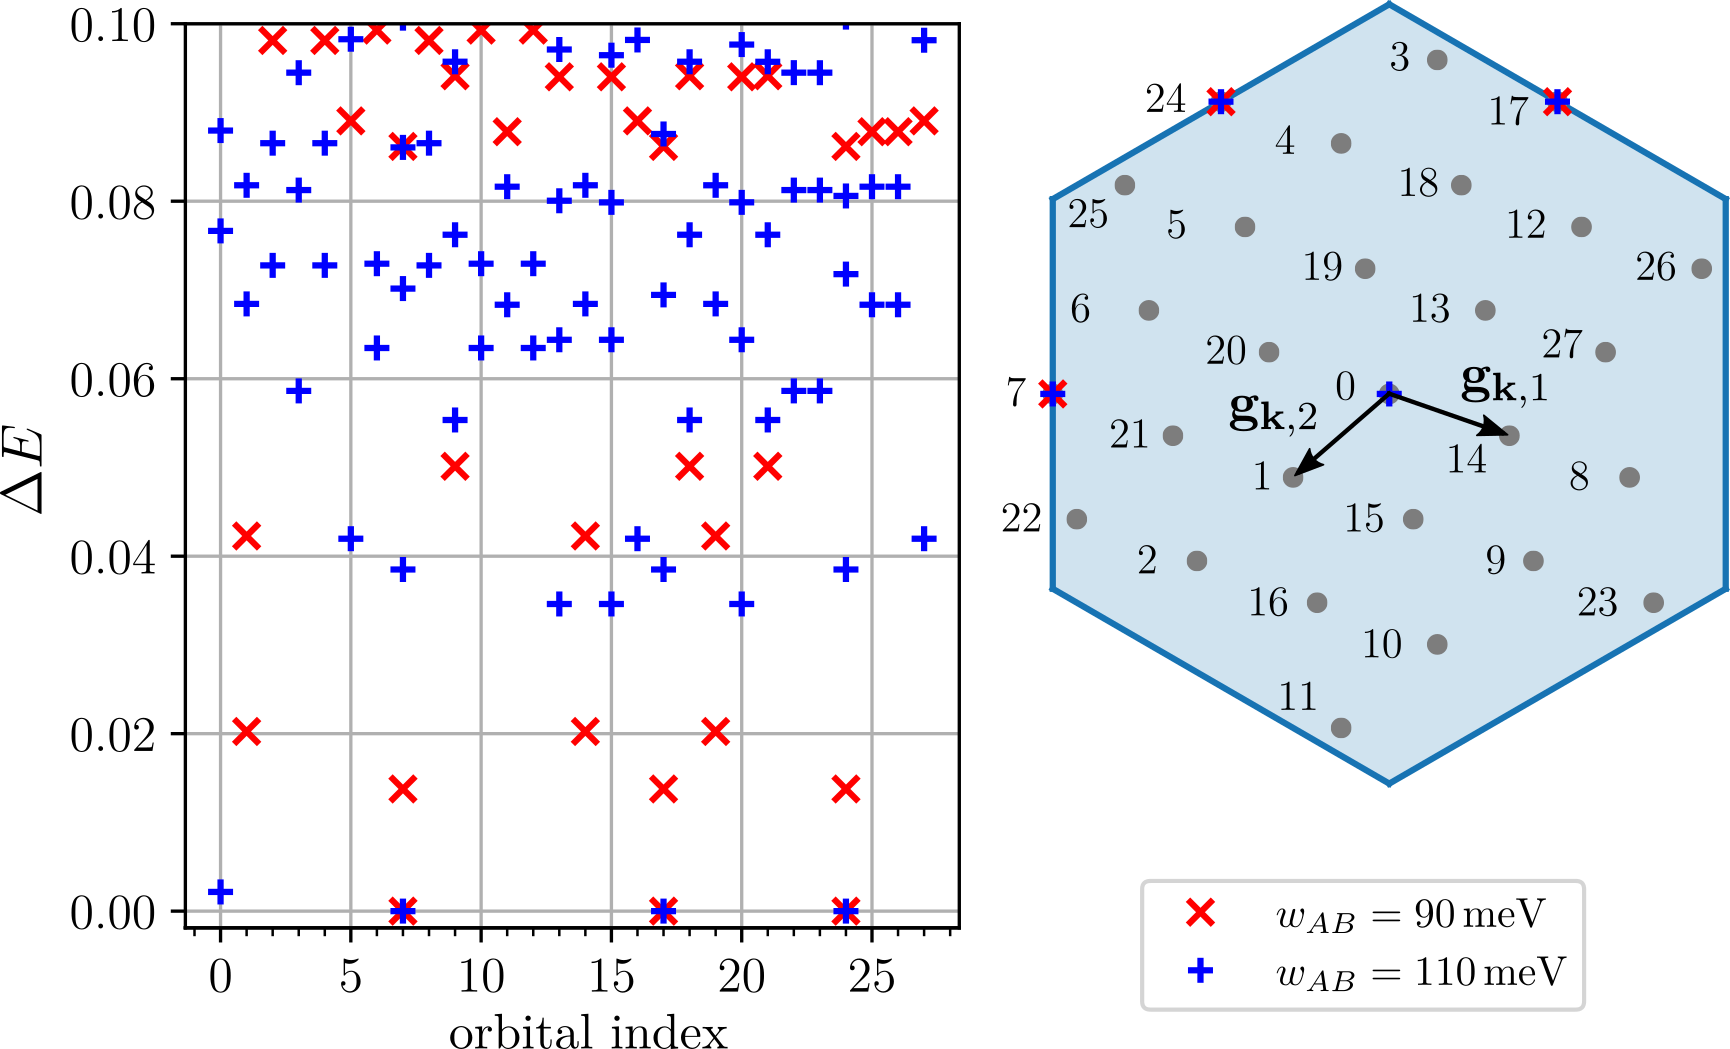
To begin with, we consider the pure interaction Hamiltonian of Eq. (1) and compute the low-lying eigenvalues and eigenvectors on various cluster geometries detailed in App. C. Figure 3(a,b) displays the obtained ground-state energies per orbital over the system size for both considered interlayer hopping amplitudes. While Fig. 3(a) is fairly featureless up to a gradual convergence of the ground-state energy with increasing system size, Fig. 3(b) signals a pronounced sensitivity to the presence of the points, with the ground-state energy being lower when the points are present. This points to a different phase than an FCI, whose ground-state energy is expected to be rather insensitive to the global cluster shape (within reasonable limits).
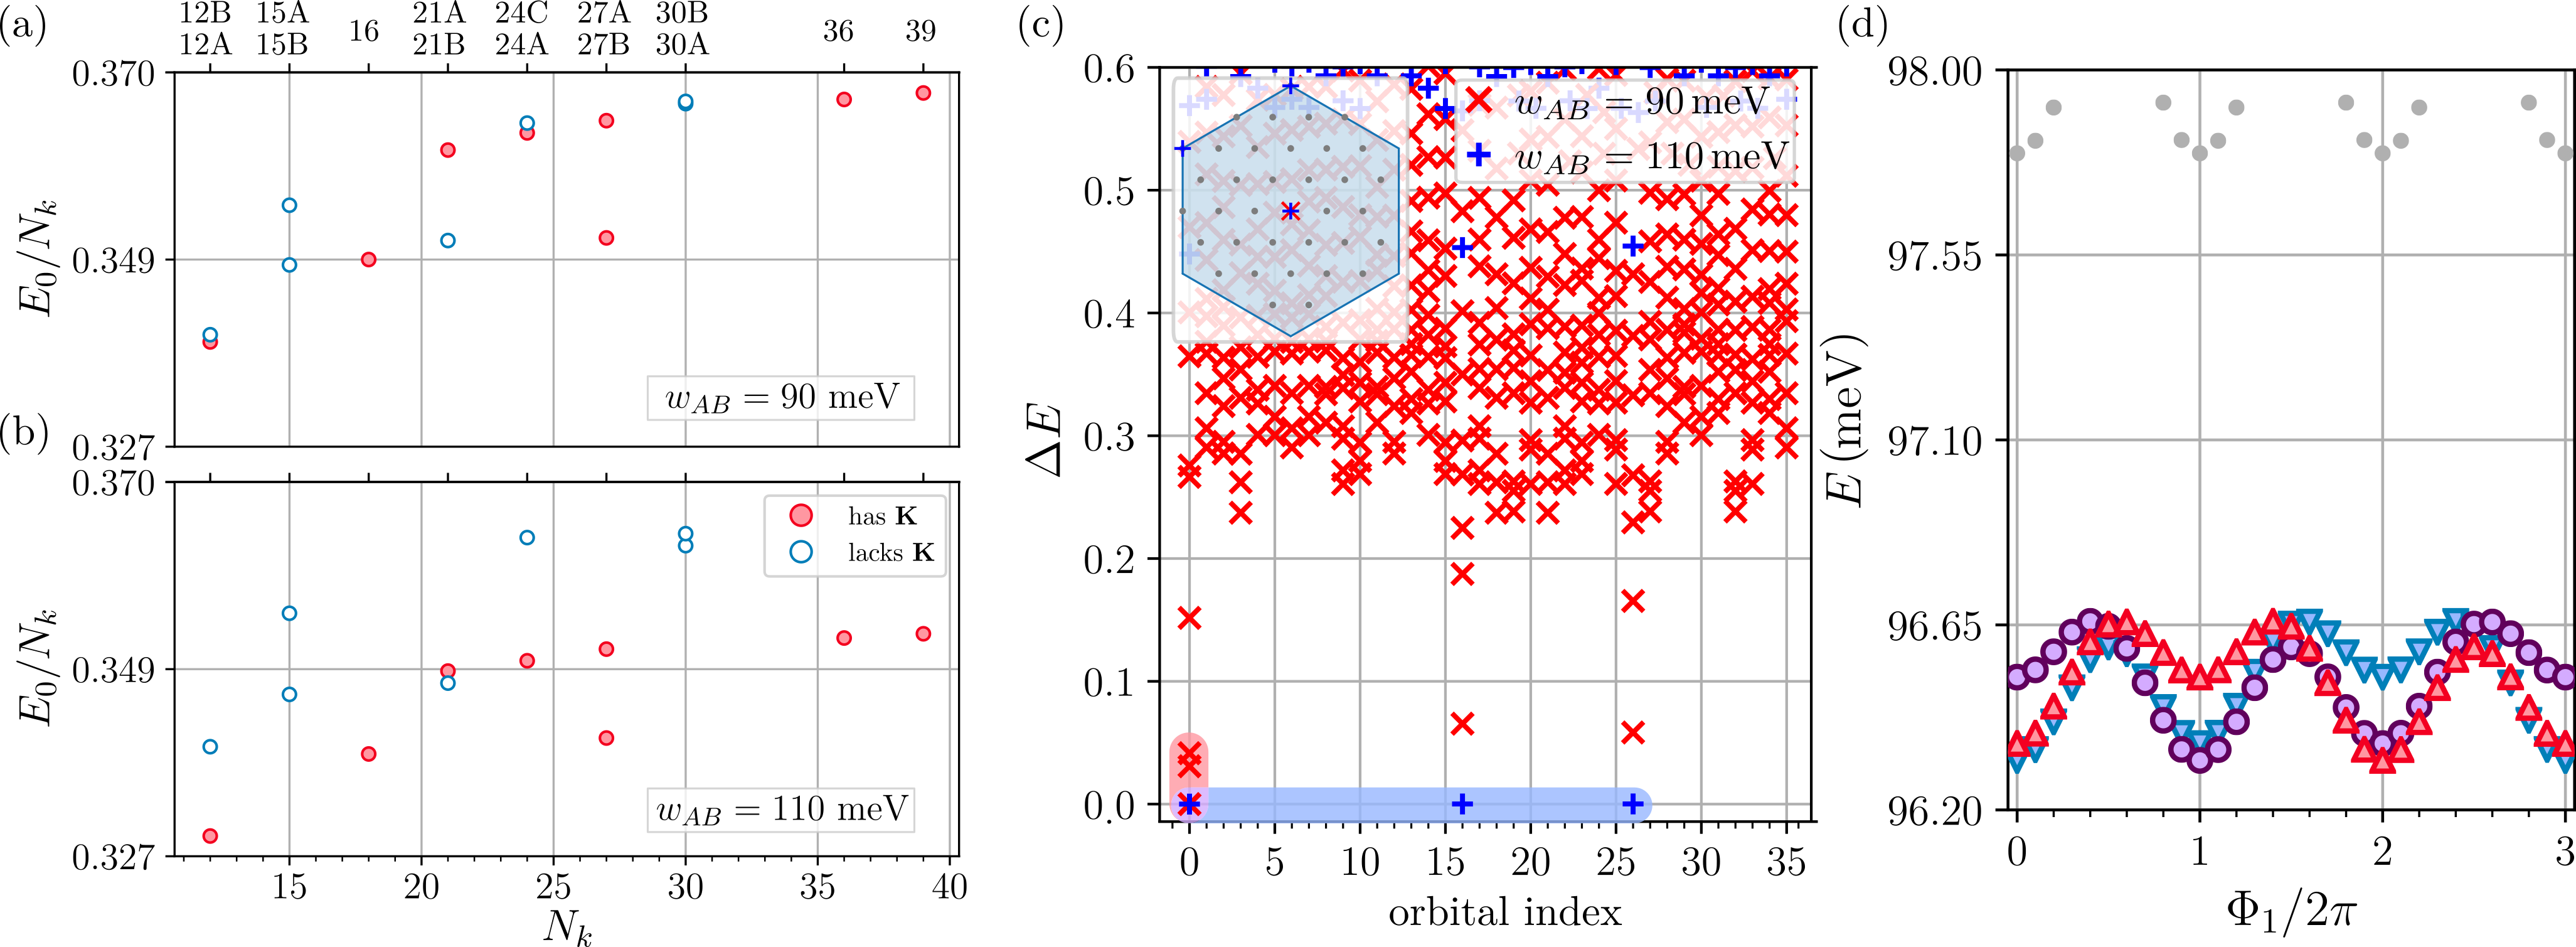
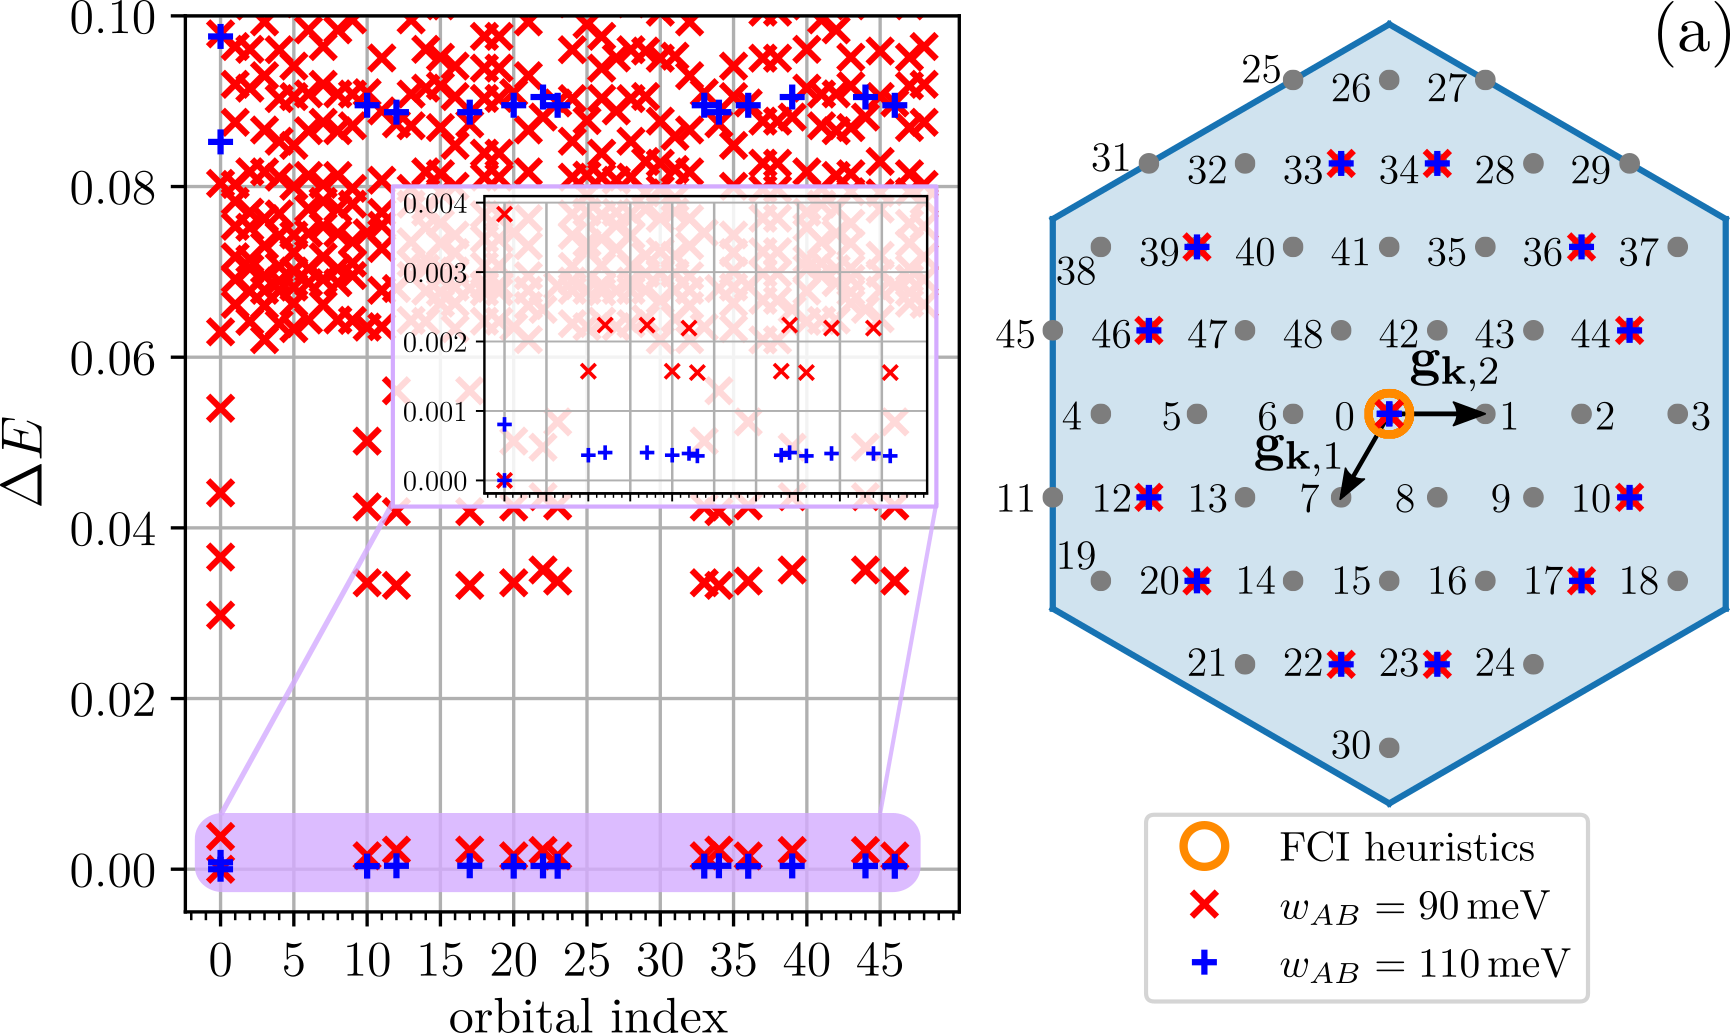
The obtained many-body spectra, such as Fig. 3(c), reveal an approximate three-fold degenerate ground-state, where the COM momentum orbitals in the ground-state manifold are found to be distinct among the two considered interlayer hopping amplitudes on multiple clusters.
While at they follow the FCI heuristics [39, 40], the ground-state momenta at are separated by the moiré Dirac point momenta (on clusters which feature these points in the MBZ). Upon inserting flux quanta, in Fig. 3(d) we observe that the three ground-states at flow into each other without mixing with higher excited states. At , the original spectrum is restored, in accordance with Laughlin-like states at filling . It should be noted that we intentionally chose a cluster with three distinct ground-state momenta in the FCI phase to enable proper spectral flow, which also features the points.
The spectral analysis and energetic considerations point towards the possibility of different types of order depending on the interlayer hopping amplitude . Where the data at suggests the formation of a topological fractional Chern insulator, in accordance with the results of Ref. 18 and Ref. 19, appears to favor order whose signatures are consistent with charge-density-waves with order momentum .

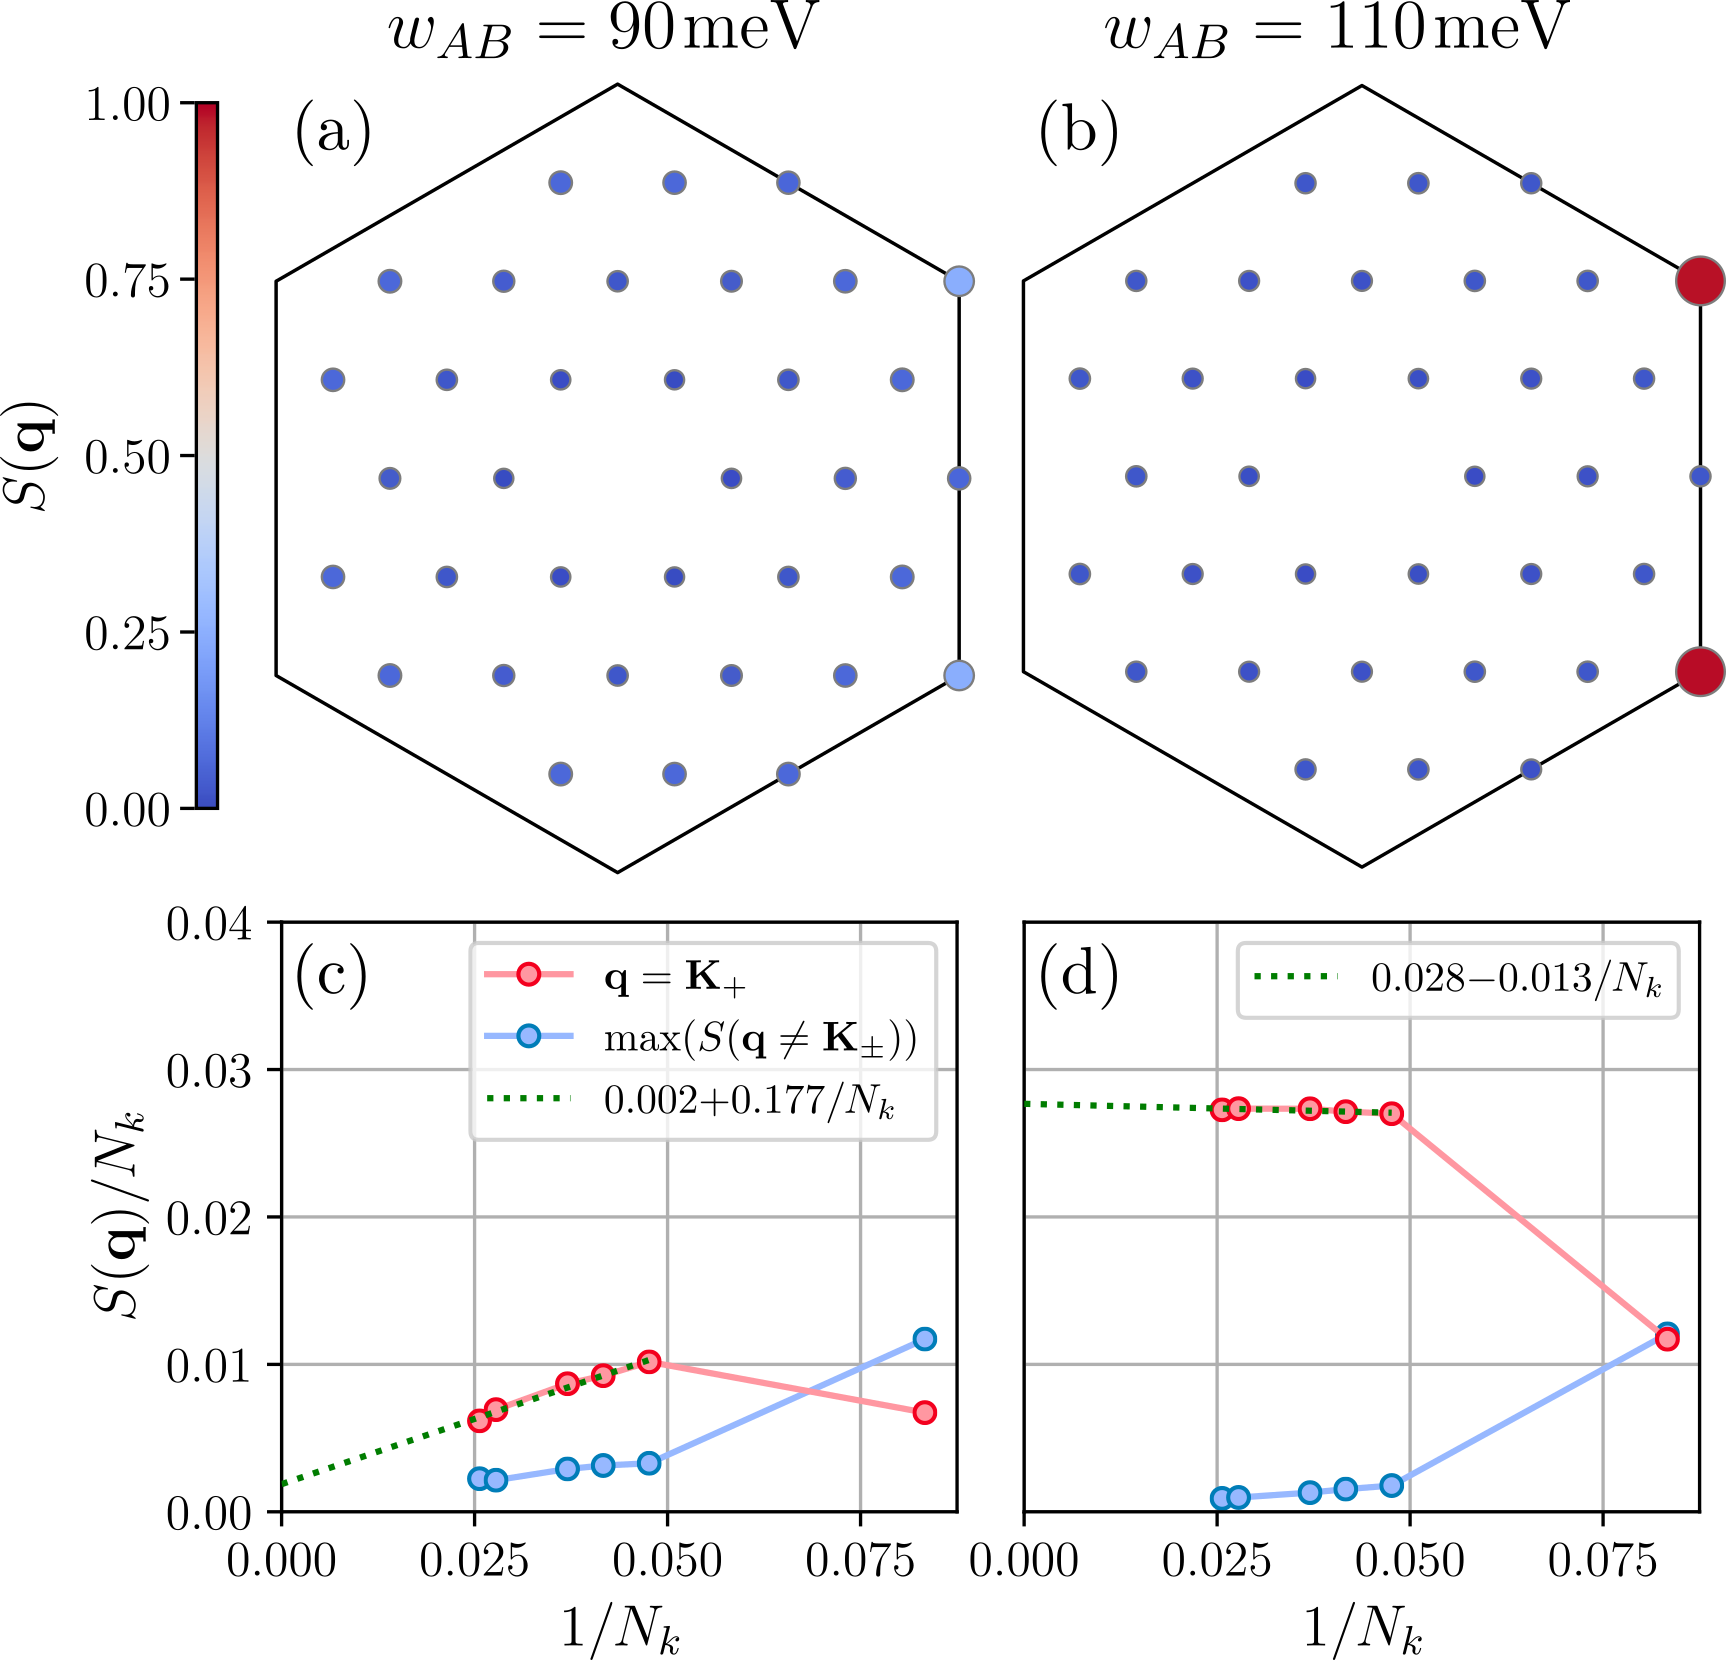
The emergence of CDW order is reflected most prominently in the charge structure factor of Eq. (4) in Fig. 4(a,b): Little spatial modulation is present for , where for the hallmark Bragg peaks of a CDW manifest at momenta . The finite size extrapolation of the peak height to the TDL in Fig. 4(c,d) shows that long-range order is stable, while the signal off the order momentum vanishes. Although the order parameter in Fig. 4(c) also extrapolates to a nominally finite value for , it is significantly smaller than in Fig. 4(d) and will most likely approach zero for larger clusters, in accordance with the expectations for an FCI state.
The -CDW can be imagined in real-space as illustrated in Fig. 5. It is the first in a series of Wigner crystal-like states that are locked to the underlying moiré triangular lattice and spontaneously break translational symmetry, thus leading to an enlargement of the moiré unit cell. At filling , the unit cell is tripled, such that each of the three degenerate ground-states corresponds to one realization on the triangular moiré lattice of Fig. 5(b).
IV.2 Interplay of Berry curvature, induced hole dispersion and kinetic energy
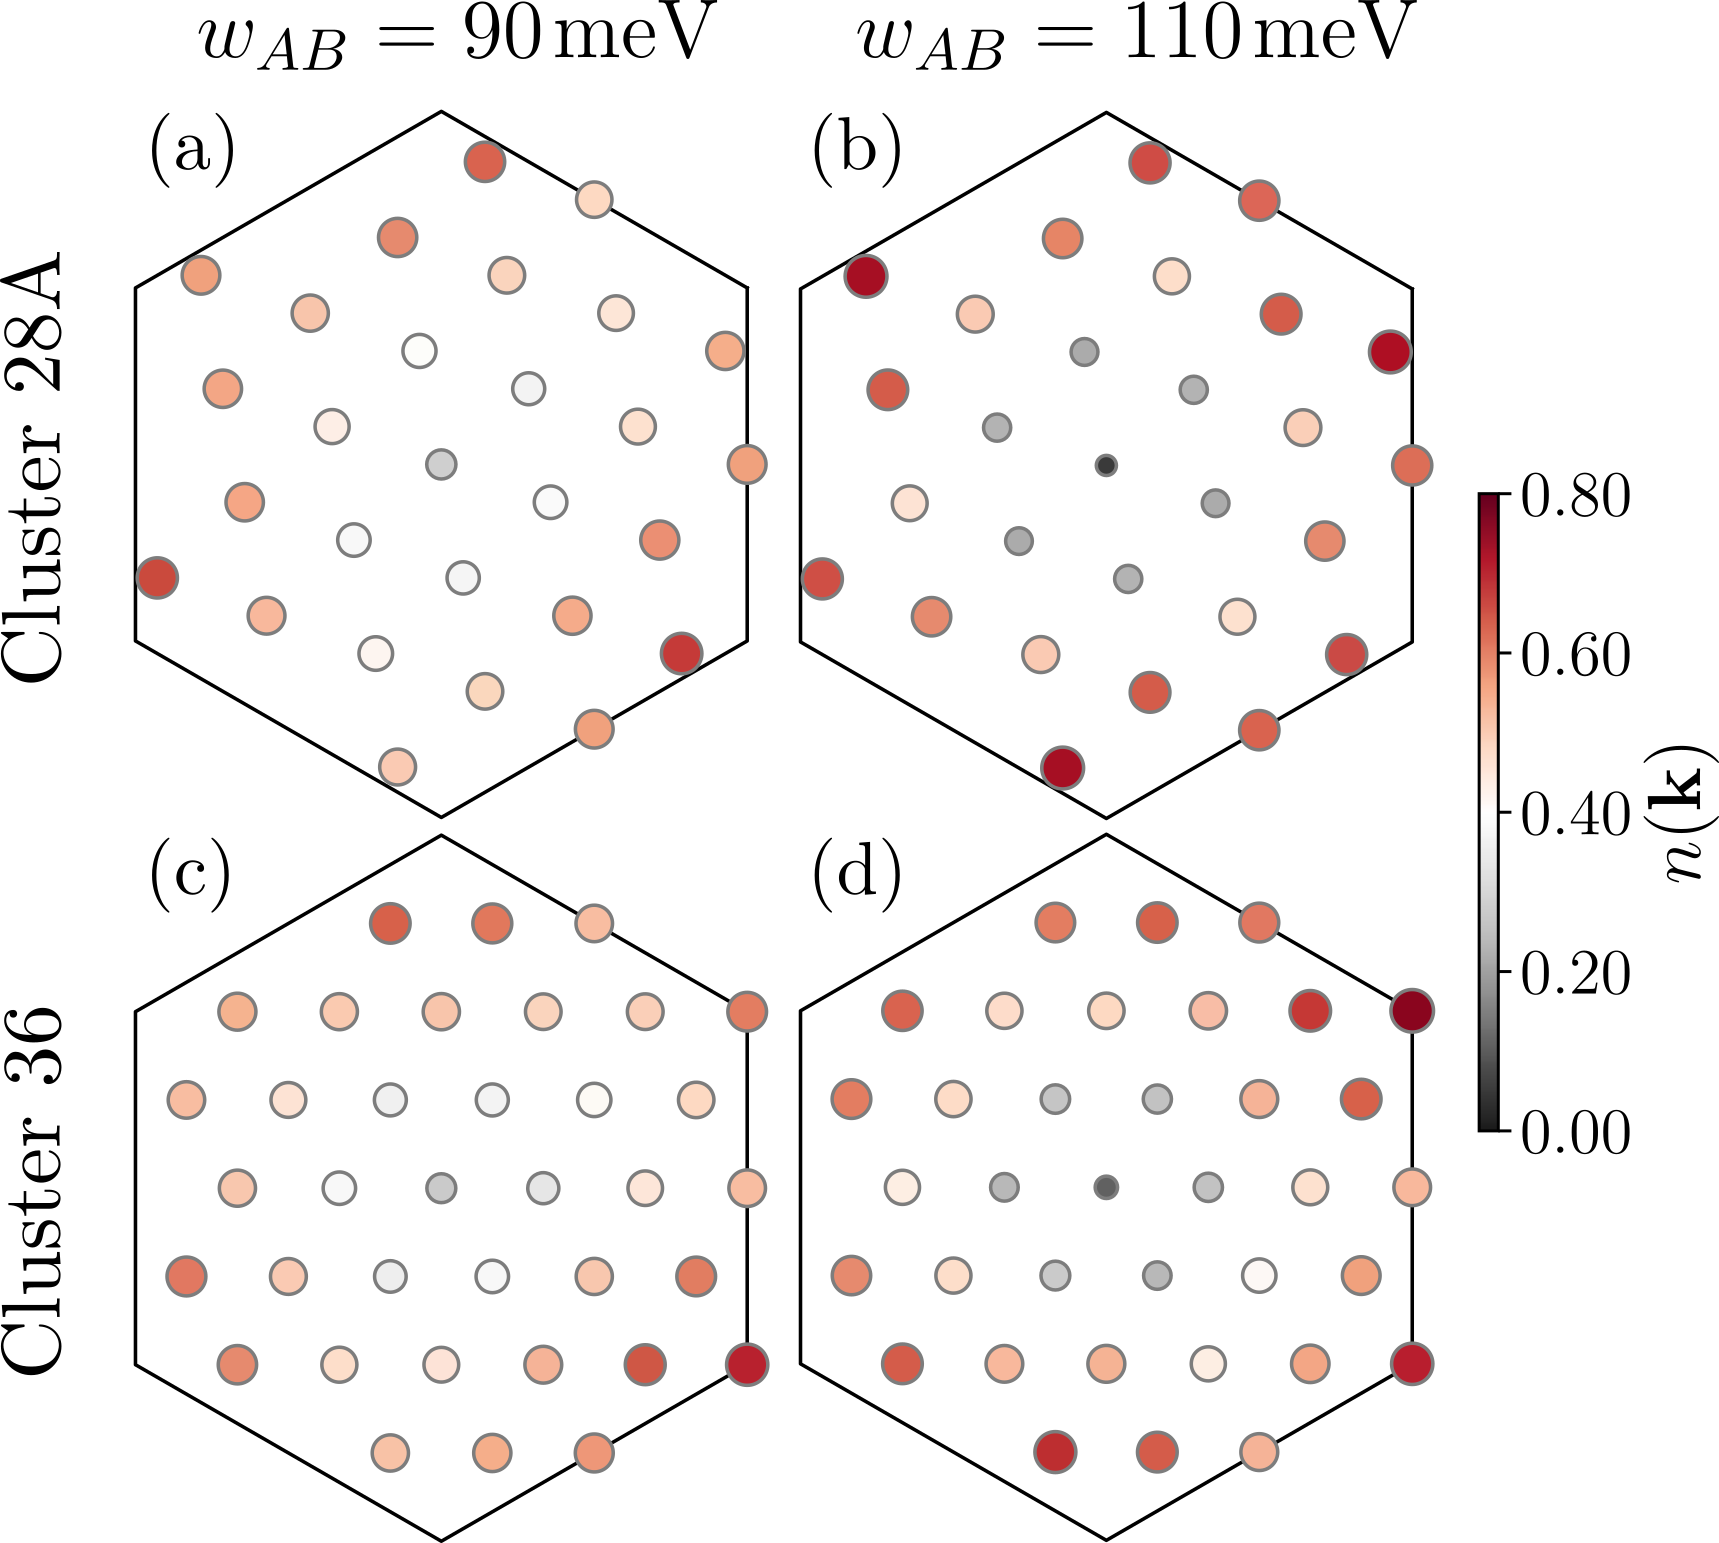
What differentiates the situation at from the one at , such that either the formation of the FCI or the CDW is favored? We can gain insight into the driving mechanism by studying the orbital occupation , which informs us about the predominant locations of the electrons in the MBZ. In the pure interaction case of Fig. 6(a) and Fig. 6(b), it tells us that the Coulomb repulsion depletes the region near and redistributes the electrons towards the border of the MBZ, an effect previously discussed in Refs. [40, 18].
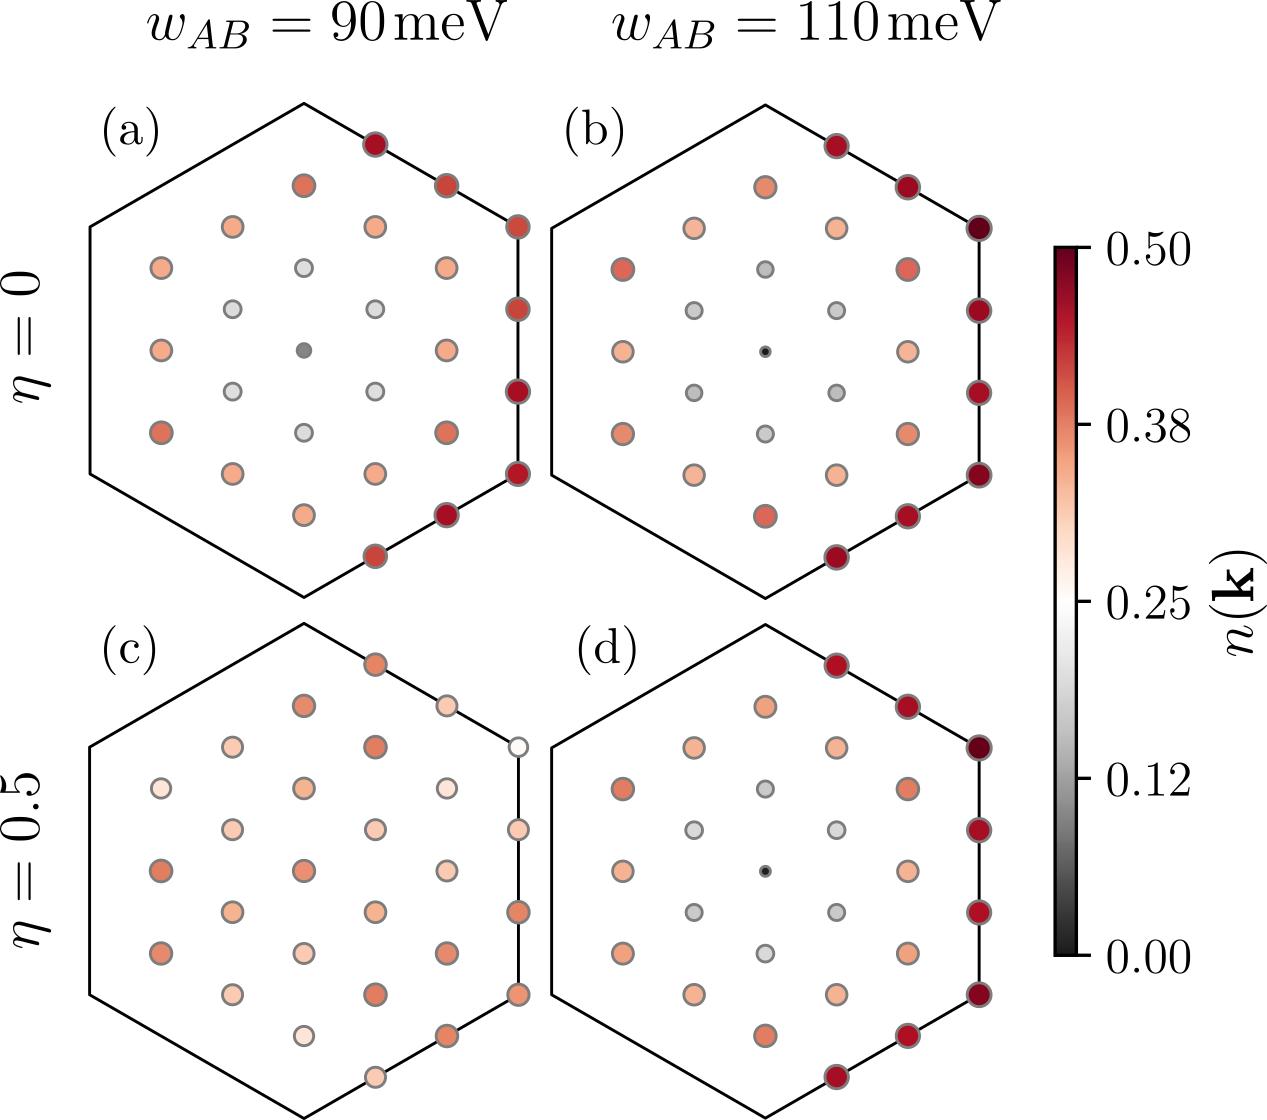
This can be intuitively understood in the hole picture, where the IHD in the lowest panels of Fig. 2 encourages holes being close to . At a hole filling fraction of , most of the inner region of the MBZ is occupied by holes, while electrons are closer to the boundary. The increased IHD bandwidth for leads to an amplified interaction driven reallocation of electrons to the outer orbitals when compared to .
The crucial difference between the two cases is however that for , most of the Berry curvature in Fig. 2(e) is concentrated close to , while the electrons arrange at the border of the MBZ. Thus they do not experience a significant effective magnetic field, which would otherwise encourage the formation of a FQH-like state, and charge order by a tripling of the unit cell is the energetically most favourable option, with the appealing real-space interpretation of minimizing the Coulomb interactions by maximizing the distance between the electrons. The large gap in the spectrum to the COM orbitals dictated by the FCI heuristics in Fig. 3(c) as well as Fig. 7(b) affirm the robustness of the -CDW. In contrast to the authors of Ref. 18 who proposed an FCI for at a reduced screening length of , we observe, for the same parameter set, clear signatures of CDW order in spectra such as Fig. 16 in App. A, as well as the structure factor on various clusters. Although the pure interaction orbital occupation is practically the same as for , the Berry curvature in the latter case is distributed more uniformly as shown in Fig. 2(a).
The rather small excitation energies to COM orbitals corresponding to the CDW and the poor degeneracy of FCI ground-states in Fig. 3(c) and Fig. 7(a) suggest a close competition between these phases on lattices that geometrically support the -CDW.
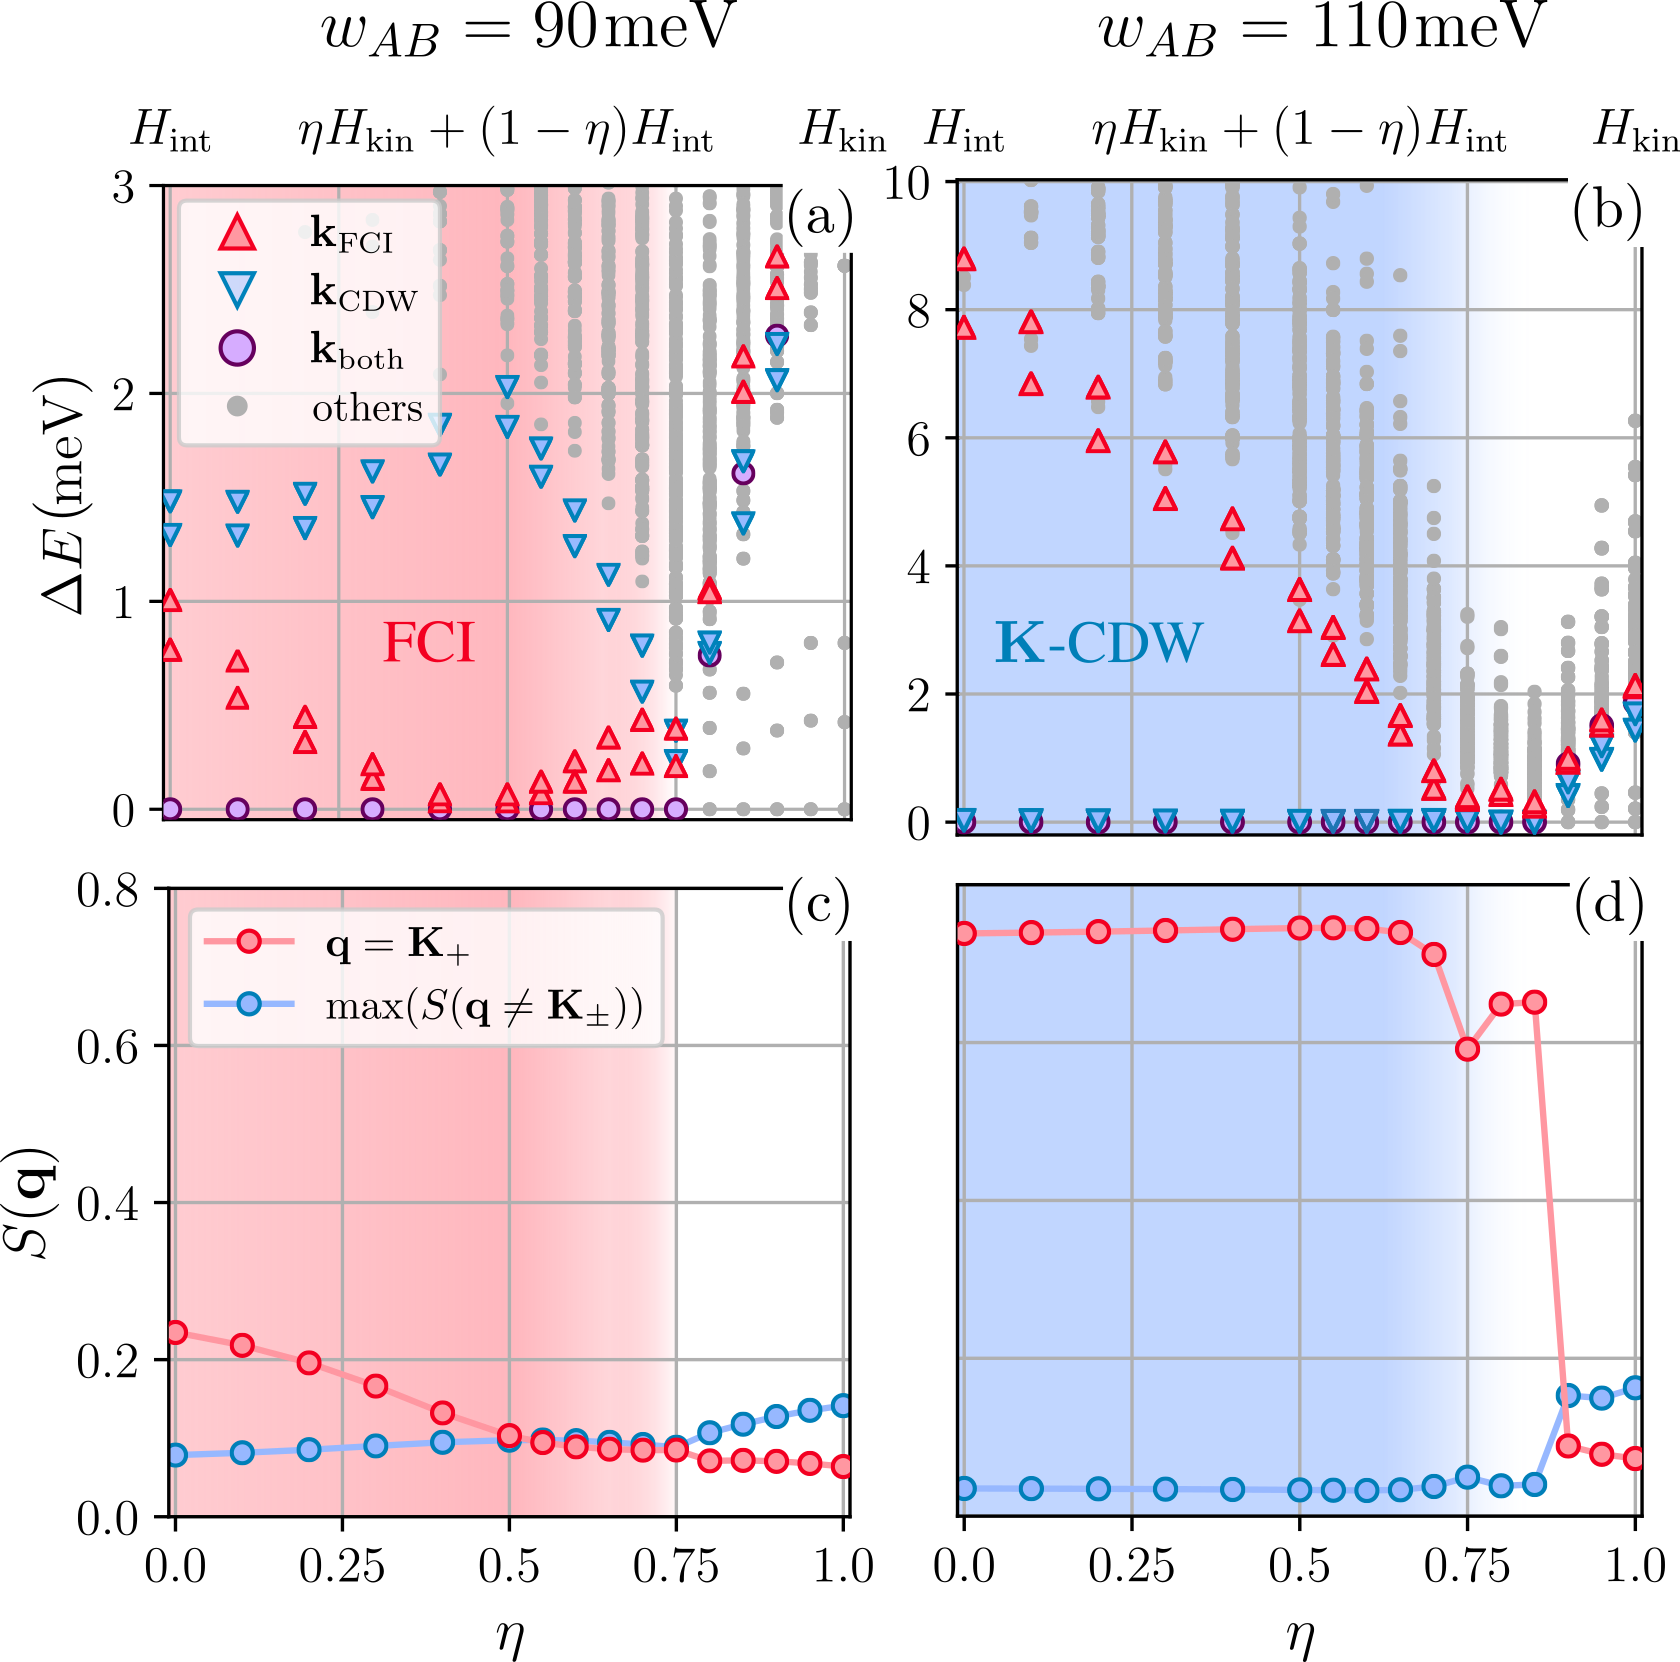
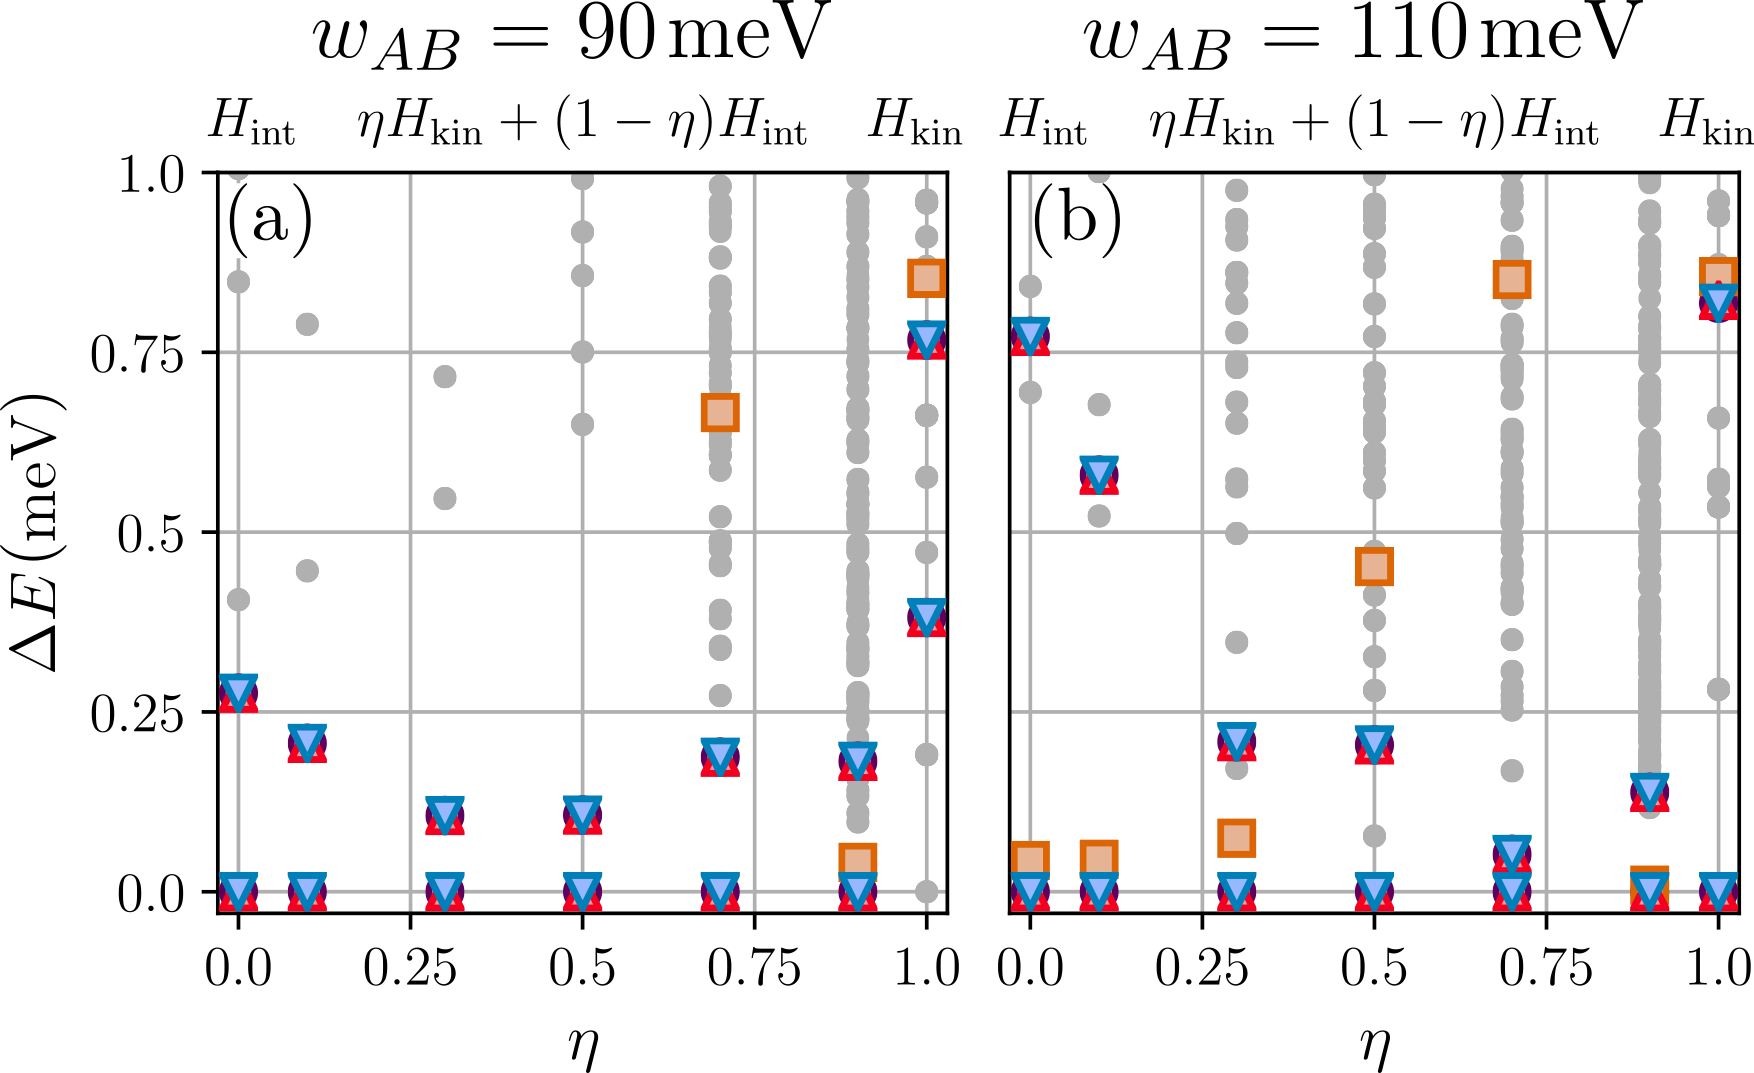
We have established that for a completely flat band an FCI is the most likely ground-state for , while the configuration favors CDW order. The effect of a finite kinetic energy bandwidth is now to be discussed by including the continuum model valence band dispersion via . As described in Sec. II, this is done by a convex combination of and controlled by the parameter . The pure interaction case is obtained for , while leads to a non-interacting Hamiltonian containing only the kinetic energy. In Fig. 7 we observe the behavior of both the spectrum and the CDW order parameter while varying from to . The inspection of Fig. 7(b) and Fig. 7(d) suggests that the long-range CDW order is gradually penalized by the kinetic energy until the spectral gap and the dominance of vanish around . This corresponds to an effective relative permittivity of , which is above experimental estimates for bilayer graphene interfaces at () [61]. A picture that might seem peculiar at first glance emerges from Fig. 7(a). Here the single-particle dispersion does not appear to immediately weaken the FCI, but the ratio of the excitation gap to the ground-state splitting improves until . This is at odds with the canonical view that a general interaction driven phase profits from a band that is as flat as possible. The origin of this curious feature may be understood in terms of the role of the single-particle dispersion in the previously developed mechanism for the manifestation of FCI or CDW states. The crucial aspect of the valence band is the minimum at while the outer momenta remain higher in energy. In a non-interacting setting, the lowest orbitals in the trough would be successively filled to accommodate all electrons and consequently form a Fermi surface. Turning on the Coulomb repulsion, the IHD shifts the electron density towards the border of the MBZ and thus, in the valence band, acts opposite to the preference of the single-particle dispersion. Such a scenario generates a sweet spot, where electrons are almost uniformly distributed across the MBZ. What is more, the electrons in the FCI state can now take advantage of the effective magnetic field, that is the Berry curvature of Fig. 2(a), across the whole MBZ.
Increasing past degrades the FCI and leads to an almost degenerate situation of FCI and CDW momentum orbitals near , from which onward the orbital occupation distribution appears to be dictated by the band structure alone. In principle, such a sweet spot may also be present in Fig. 7(b), yet upon closer inspection of the situation at , no clear signature of an FCI was observed. The reason might be that the optimal is quite far below the value at which perturbs the CDW enough for the FCI to compete. Interestingly for the CDW, as indicated by Fig. 6(d) and Fig. 7(d), and also are practically unaffected by an increase of until the start of the breakdown of CDW order at . This suggests a high degree of stability of the -CDW wave function across a large interval of kinetic energy strengths.
IV.3 Conduction band physics and complementary filling
We now investigate the similarities and differences when switching to the conduction band () and upon adding twice the amount of electrons to a single (valence or conduction) band (). The effective reflection about zero energy results in the observed energetic peak of the conduction band at in Fig. 2, which falls off towards the MBZ border. The Berry curvature in the conduction band of the same valley is related by a sign and coordinate flip to the one in the valence band (up to a slight particle-hole asymmetry). Thus the ones displayed in Fig. 2 properly represent the magnitude at the center and the border of the MBZ, which suffices for our discussion. The IHD is almost identical up to a reflection about a - path and thus has the same qualitative effect as in the valence band. In our numerical results, we first compare the data for in Fig. 8 to the same set of points in Fig. 7.
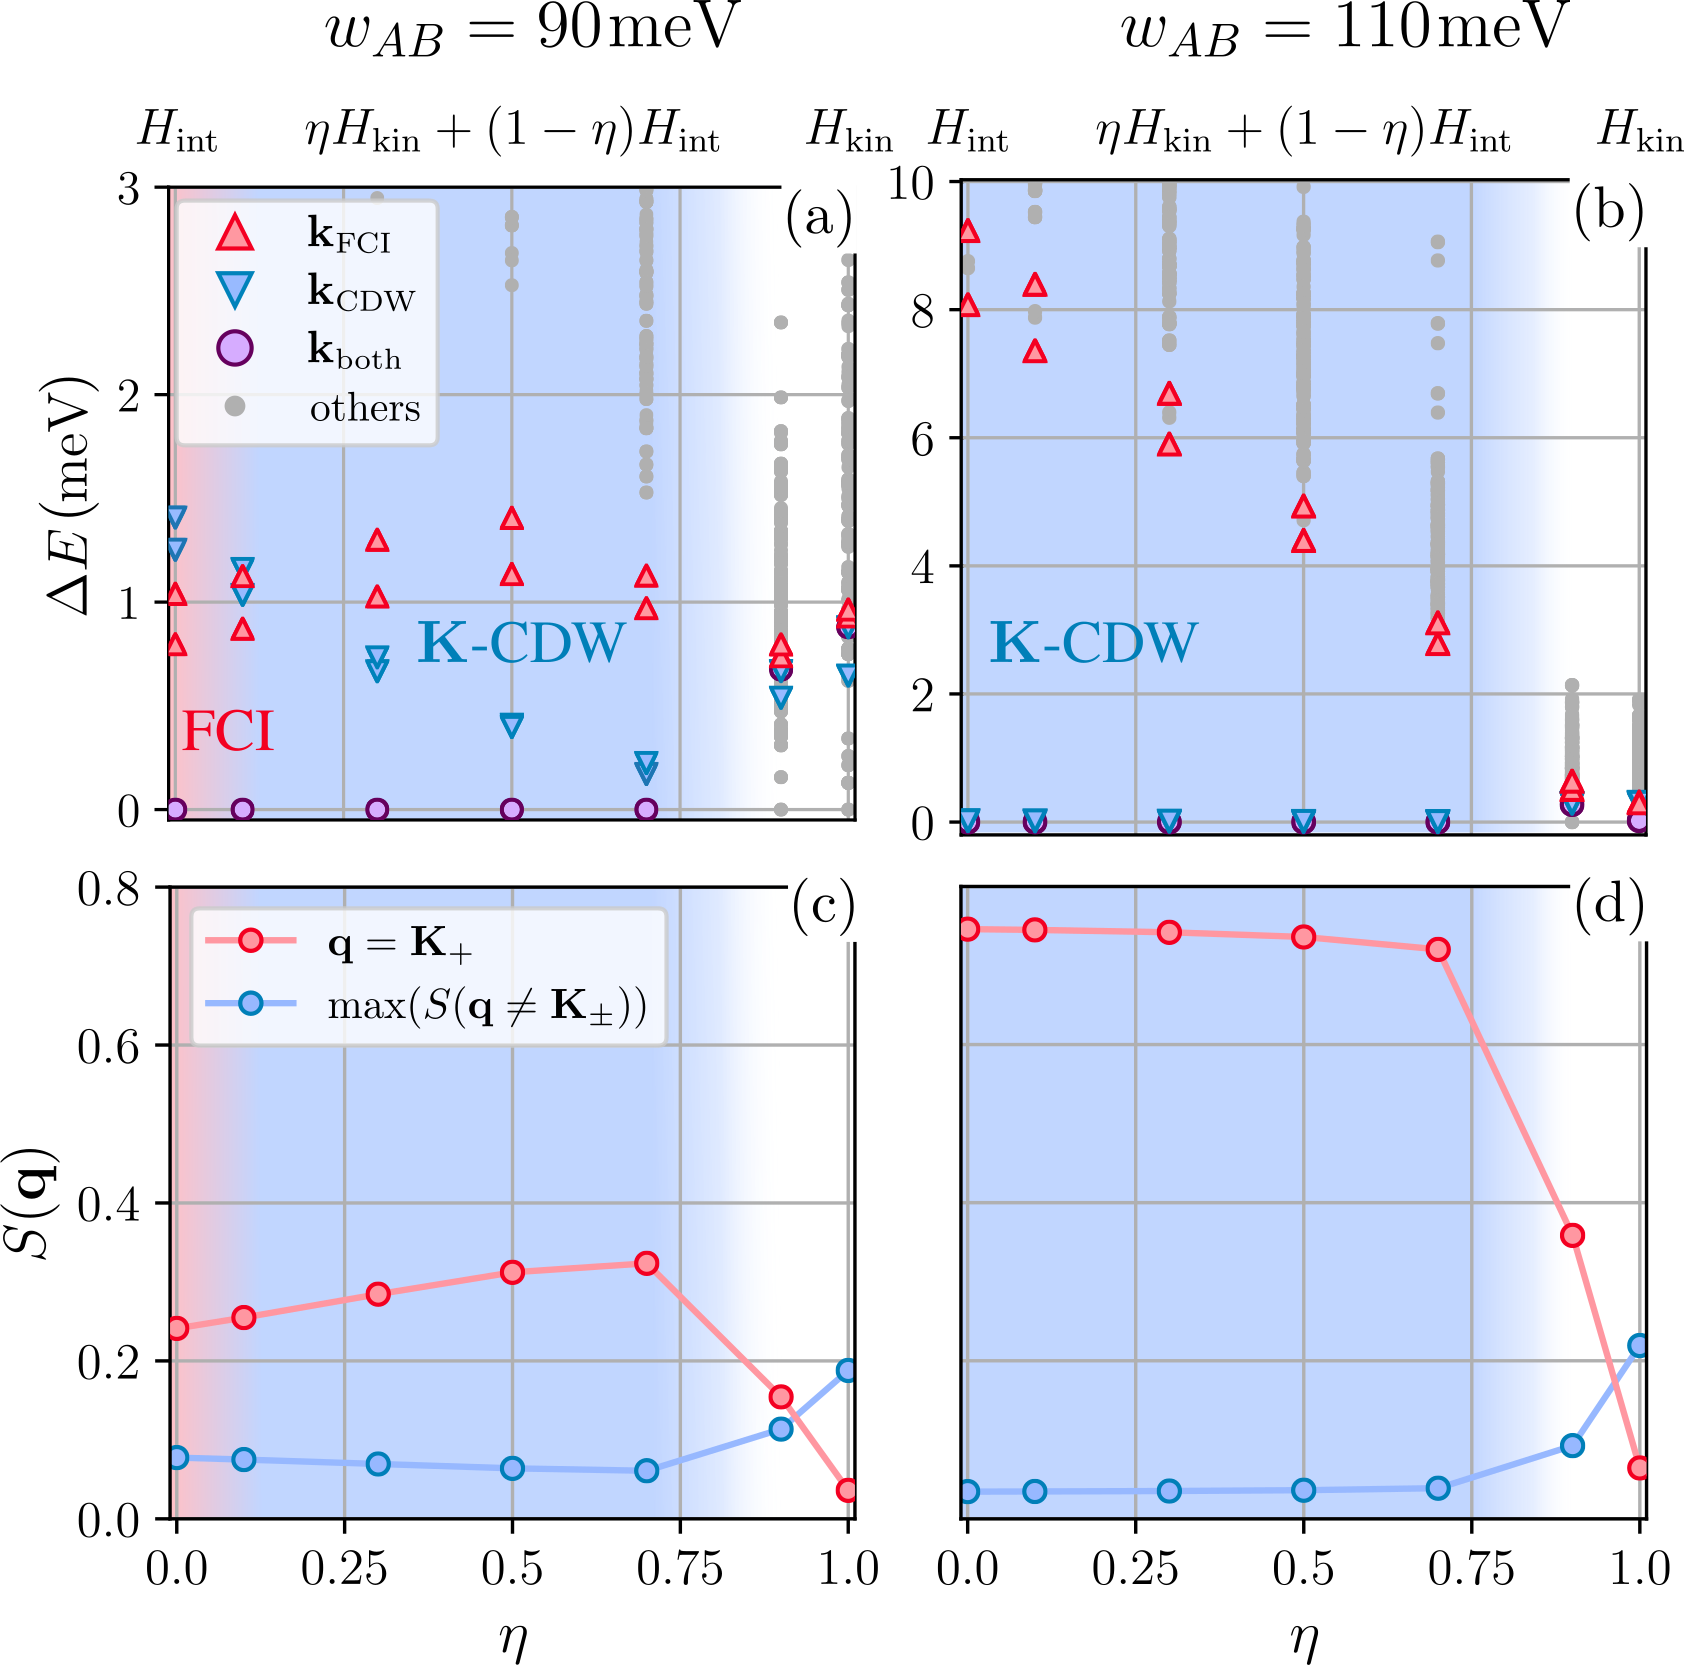
The results (FCI at , CDW at ) almost exactly coincide, which is the consequence of the time-reversal and particle-hole relations for bands from different valleys. More remarkable behavior that distinguishes the two bands is revealed when tuning . While for we arrive at results that are reminiscent of Fig. 7(b) and Fig. 7(d), depicting an even slightly more stable -CDW that is slowly disfavored by the kinetic energy, Fig. 8(a) and Fig. 8(c) show no signs of a further stabilization of the FCI. On the contrary, both, the spectra and the order parameter signal that the CDW profits from increasing until about 0.7. Therefore, although the ground-state for pure interactions appears to be an FCI, it is quickly suppressed near , which corresponds to , and the CDW stabilizes throughout an interval . Intuition is gained by realizing that the only crucial qualitative modification to the valence band situation is an essentially flipped single-particle dispersion, which favors electrons at the MBZ boundary instead of the center. It thus reinforces the effect of the IHD on the orbital occupation and no FCI sweet spot can occur as the electrons are driven away from the Berry curvature at more vigorously.
Finally, we elaborate on the () filling of the valence (conduction) band in the developed framework of the interplay between kinetic energy, Berry curvature and induced hole dispersion. In order to keep this manuscript condensed, we do not display separate results for these configurations. We find that the situation is qualitatively very similar to the filling of , albeit the FCI in the valence band at features a larger excitation gap at , it is again stabilized by the kinetic energy compared to the CDW. The conduction band results suggest the onset of a transition from the FCI towards the CDW order upon increasing the strength of the kinetic energy. However no clear separation as in Fig. 8(a) is present in the limited data for this configuration. Up to a reduction of the robustness, we find clear evidence for CDW order in both bands at . An increase of again gradually closes the excitation gap until it vanishes near . Nearly all of the observed features in the data are explainable akin to the situation at () filling. Where for low , electrons were almost exclusively located at the border of the MBZ, by the fermionic exclusion principle now twice as much weight has to be accommodated. This leads to an initially more stable FCI and a weakened CDW because more of the overall Berry curvature is experienced by the collective electron wave function. Consequently, the CDW order is destroyed faster but the general dependence on is smoothed because a lower fraction of the total weight of the wave function can be redistributed into a specific region of the MBZ.
IV.4 Evidence for charge order at lower filling

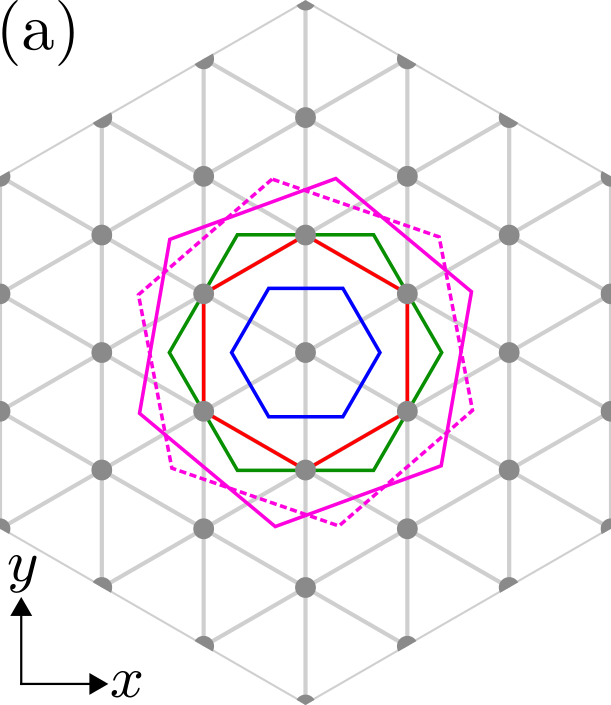
Motivated by our findings of robust CDW order at , we analyze the possibility of states with even larger interaction induced unit cells. Fig. 5 visualizes the next larger four- and sevenfold extensions of the moiré unit cell, corresponding to band fillings of and respectively. The pattern at translates exactly along the doubled moiré lattice vectors, which would imply a charge order vector of , where the index denotes the possibility of three inequivalent points in the MBZ. We thus dub this order the -WC. The WC at extends even further, such that seven individual moiré sites are contained within the WC unit cell of Fig. 5. A peculiarity here are the two possible, inequivalent realizations of this spatial modulation on the triangular lattice, which are related by an out of plane operation along a moiré lattice vector. Because the real-space translation vector of the order is even larger in magnitude than for or , the corresponding order momenta have to be located inside the MBZ. We would expect the charge order parameter to develop substantial peaks at six momenta for each realization of the WC pattern. On clusters with symmetry, only one pattern may be realized while a symmetric cluster supports superpositions of both WC orientations, which makes a total of 12 potential order momenta and a 14-fold ground-state degeneracy instead of the expected sevenfold. The order momenta and ground-state orbitals then fall into two classes, where within each the nonzero orbital and order momenta are related by a operation. This type of WC is henceforth referred to as the -WC. Because we arrive at qualitatively the same results for both considered values of , we discuss only the more pronounced situation at . In App. A, the many-body spectra for both hopping amplitudes and fillings are displayed in Fig. 17, Fig. 18(a) and Fig. 18(b).
We now take a look at the data presented in Fig. 9. Starting with the filling , a slight energetic advantage appears to be present in Fig. 9(a) for clusters that realize all three inequivalent points rather than only one. In addition to the geometric ground-state energy signature, the momentum separation of its degenerate ground-state total momenta is exactly given by the momenta . In any case, a more reliable hallmark of the -WC is found in Fig. 9(b), where clear, distinctive Bragg peaks in the charge structure factor are present for all three order momenta . The finite-size extrapolation in Fig. 9(c) assures the prevalence of the -WC in the TDL.
Considering the smaller filling of , we focus on the geometric property of rotational symmetry. Figure 9(d) highlights the lowered energy of larger clusters that are at least symmetric. On such lattices, the momentum-space spectrum shown in App. B in Fig. 18(a) or Fig. 18(b) displays a 14- or sevenfold ground-state degeneracy of orbitals separated by the six WC momenta of each -WC class. The structure factor in Fig. 9(e) again exhibits the pronounced pattern of a -WC, albeit the peak values of the two WC orientations on the cluster LABEL:cl:7.0.0.7 are slightly different in magnitude. This reflects the lack of a microscopic symmetry due to the hBN substrate, consistent with the minor energetic splitting of the ground-states depicted in the inset of Fig. 18(a). Finally, we average the order parameters at all realizations to account for the splitting into two groups of peaks on the symmetric grid and perform a finite-size extrapolation. Although the small number of data points demands the final value of the regression to be taken with a grain of salt, the remnant normalized -WC structure factor in the TDL is of the same order as for the -WC and the -CDW.
IV.5 Second hierarchy FCI at
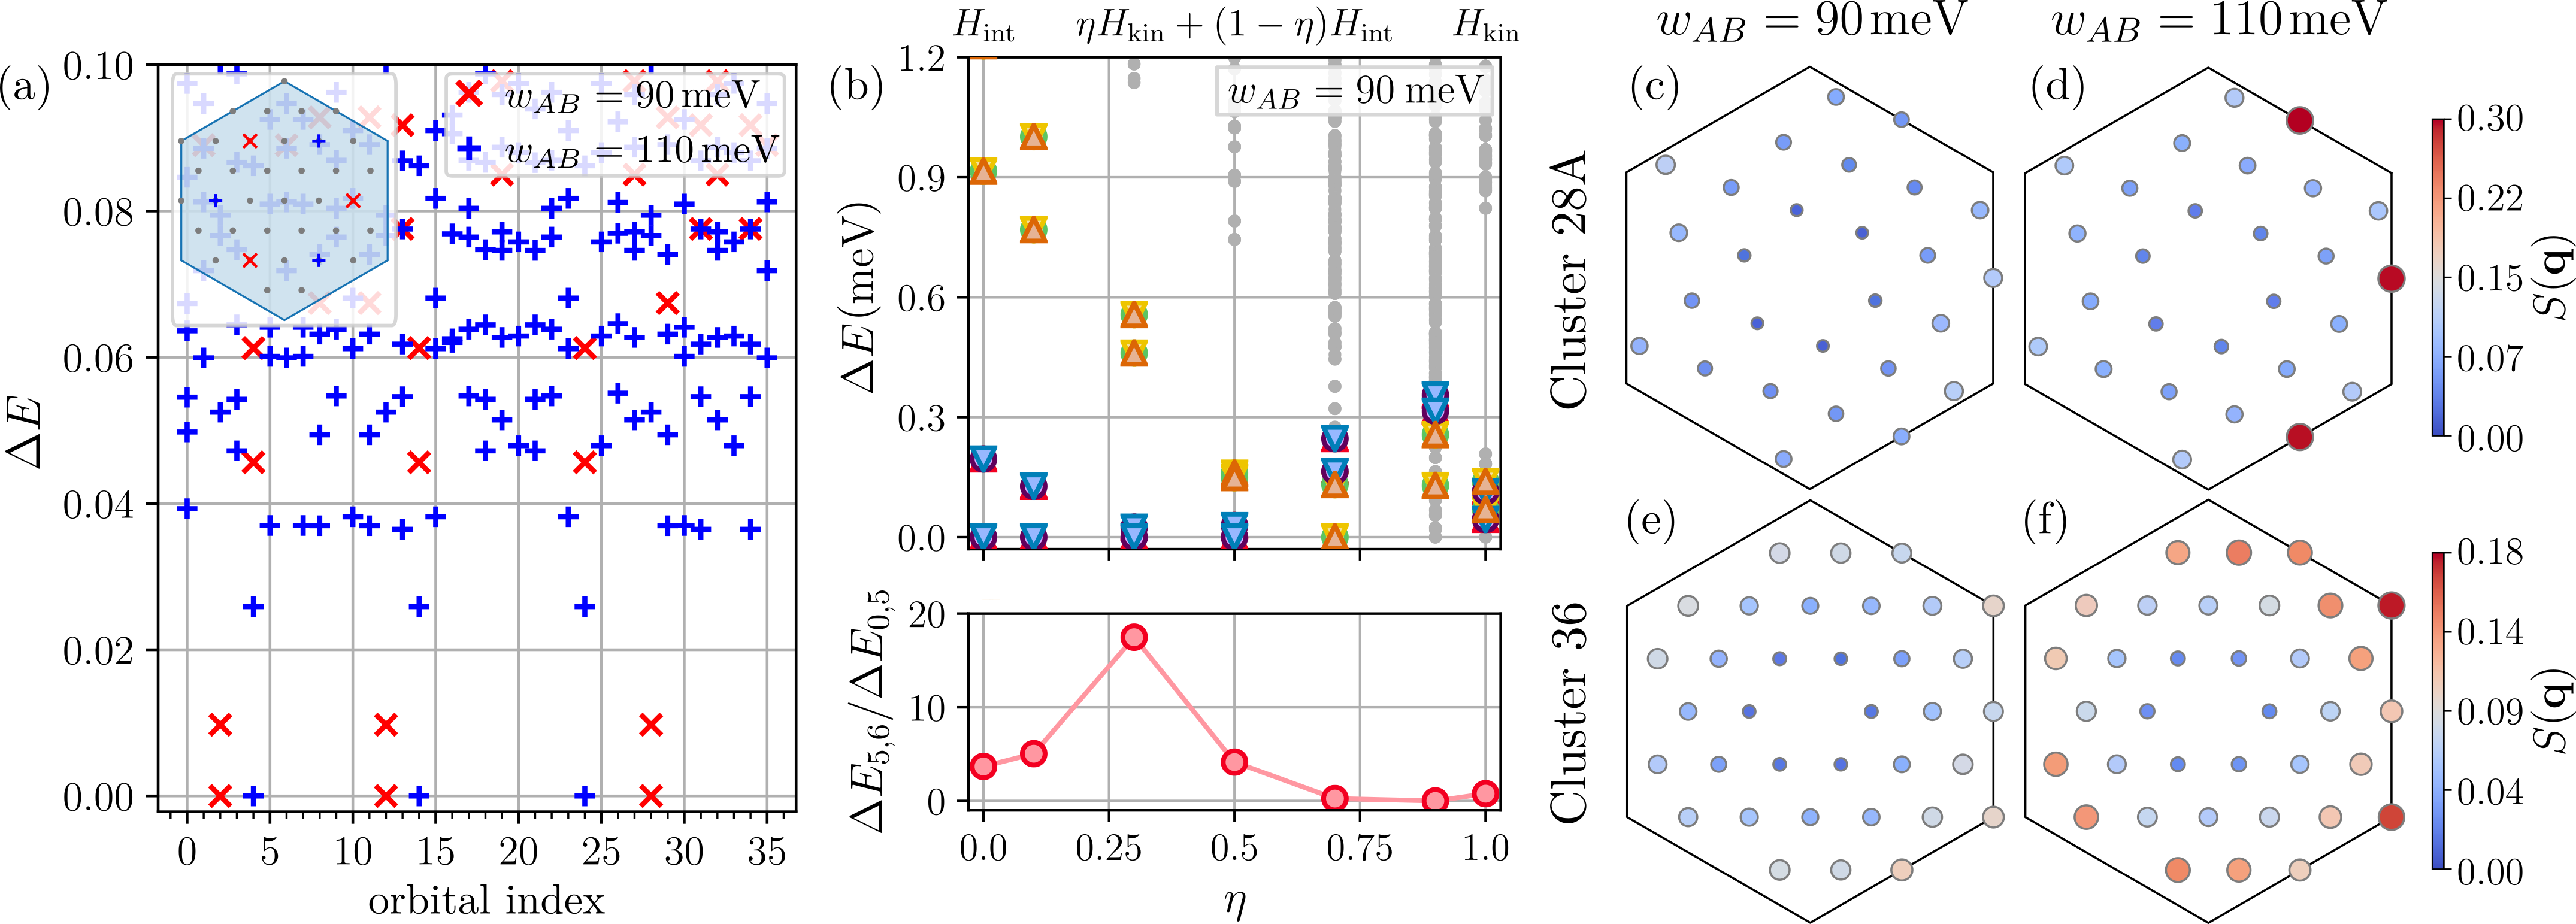
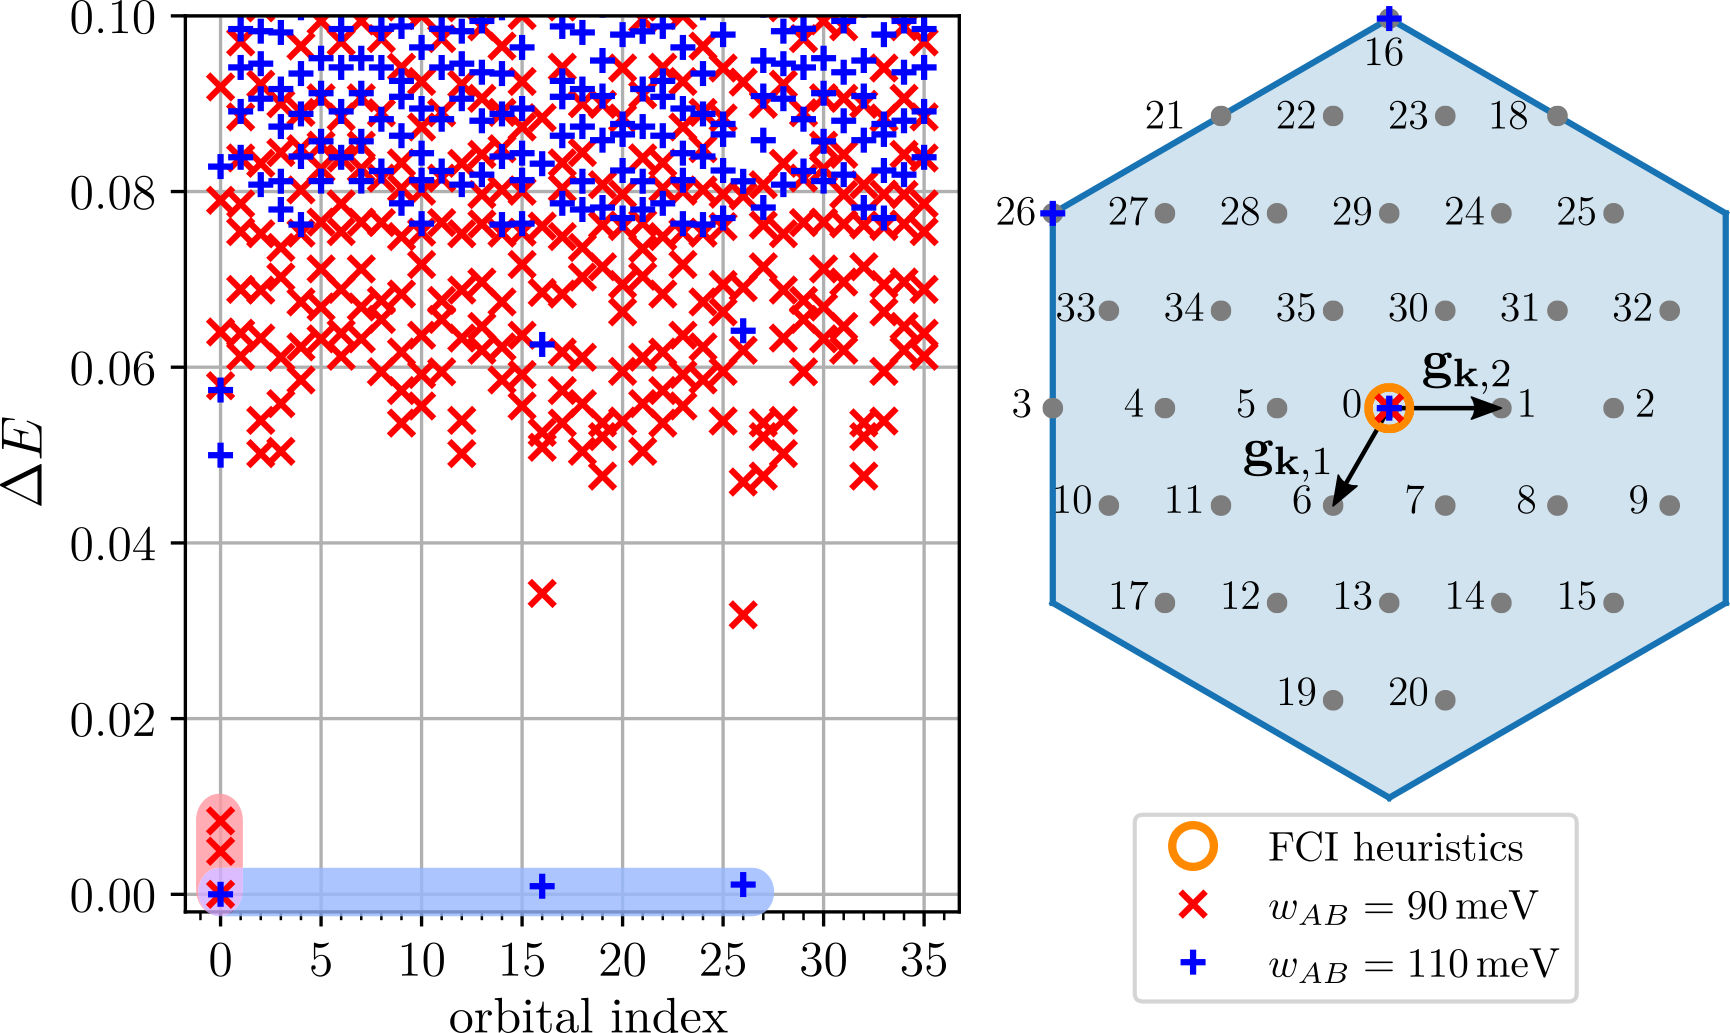
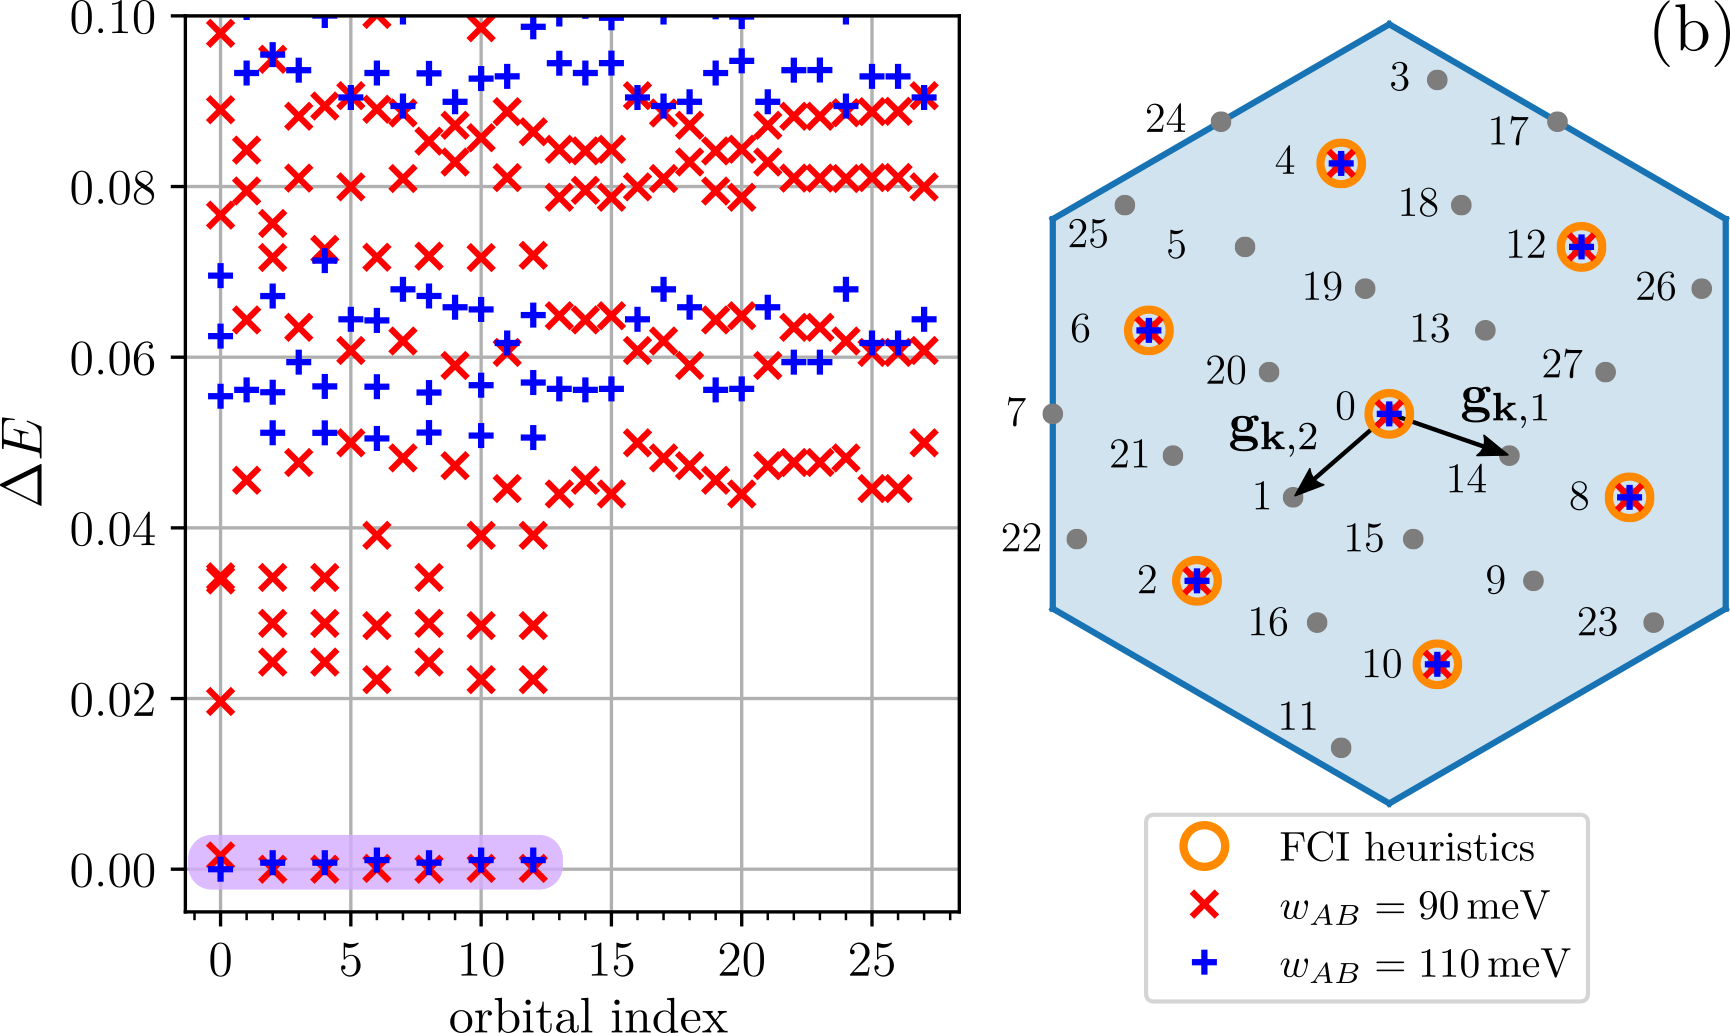
With regard to valence band fillings above , a potentially interesting filling fraction to study in more detail is as it is not only a candidate for the realization of a hierarchy FCI state [40, 62] but was also found to exhibit insulating behavior in related TMD moiré heterostructures [26]. A first look at the low-energy spectra, presented in Fig. 10(a,b), reveals manifest differences between the two considered hopping parameter values. While the five ground-states at agree with the FCI heuristics, the distribution of eigenvalues at is less obvious in its interpretation. The density correlation measurements of Fig. 10(c,d) suggest that the charge order tendency is once more increasingly pronounced at as opposed to , although the sharpness of the peaks in is significantly reduced compared to the results at . Making use of the understanding acquired in Sec. IV.2, we can further probe the nature of the ground-state via the introduction of the valence band dispersion. In accordance with preceding findings, we observe that the potential FCI ground-state manifold is stabilized by via an increase of the excitation gap to ground-state splitting ratio until , whereas the spectrum at collapses monotonically (not shown). We use the optimal convex combination for the FCI to perform the insertion of magnetic flux quanta in Fig. 10(e) and find that the ground-states exhibit the required spectral flow until . On the other hand, if we flip the single-particle dispersion and thus mimic the situation in the conduction band, at a series of 15 states separates from energetically higher states until . This profit of Berry curvature avoidance is consistent with a tendency for charge order and what is more, the developing 15-fold degeneracy matches the expected degree for the charge pattern proposed in Ref. 26 to explain the insulating state. Nevertheless, the precise real-space pattern could not be confirmed within the scope of this work, not least due to the lack of a numerically accessible larger symmetric cluster that supports the suggested pattern. Simulations on less symmetric discretizations with , , could not be found to clarify the situation at , while they did affirm the prevalence of the FCI at . We also analyzed the situation at towards the possibility of FQH-like order, however, despite some promising signatures in the location and degeneracy of ground-state orbitals, the evidence did not sustain across multiple cluster sizes.
IV.6 Numerical results for half filling
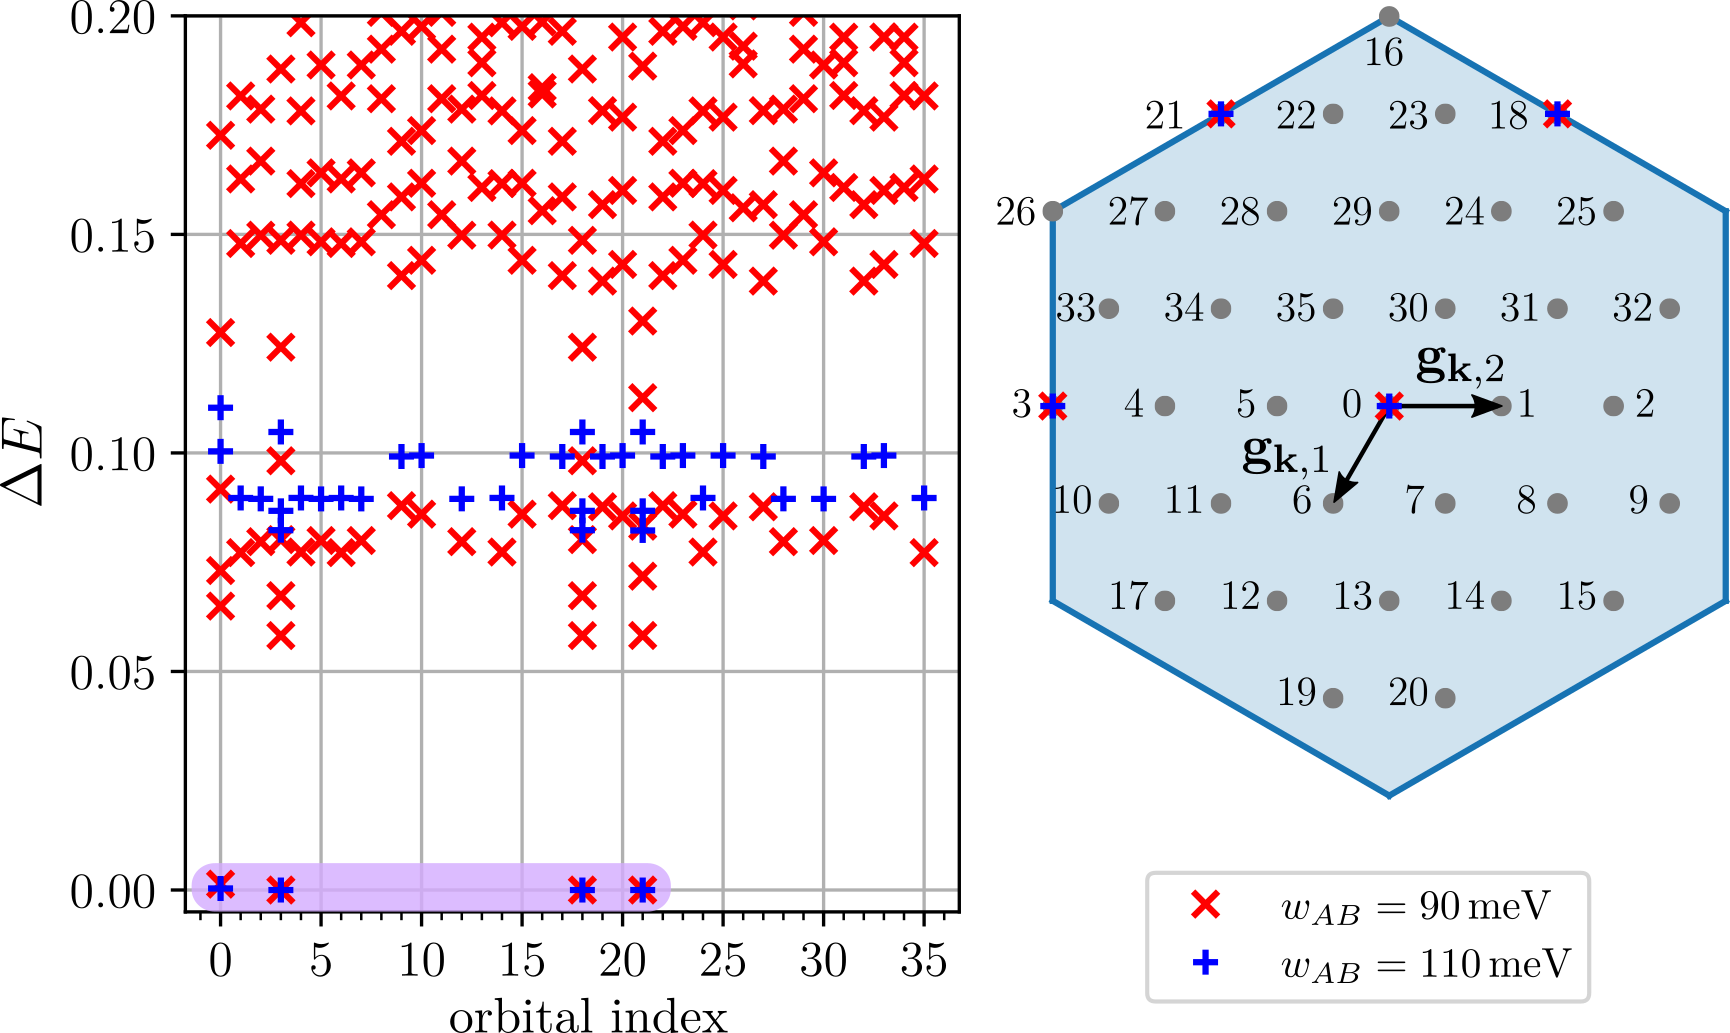
Finally, we present results at half filling . This is of particular interest in the FQH context since the investigation of a spin-polarized half filled Landau levels has produced a number of exciting theoretical proposals, such as the composite fermion Fermi sea [63], or the Moore-Read FQH state which hosts non-abelian Ising anyons [64], or variants of charge ordered phases [32]. Let us note, that here our numerical results turn out to be more ambiguous than the previously discussed fillings and the conclusive identification of the ground-state nature needs to be left to future work.
The most intriguing signatures in our data are the imminent double-degeneracies of three momentum orbitals on clusters LABEL:cl:6.0.0.6 and LABEL:cl:2.4.6.-2 at in Fig. 11(a) as well as Fig. 15 in App. A, which are reminiscent of the sixfold degenerate Pfaffian state [65]. Similar to the FCI, such a FQH-like state intimately relies on the Chern character of the band in order to facilitate the formation of what is understood to be pairs of composite fermions [66]. We attempted an analysis of the Pfaffian orbital heuristics demanding two particles in four consecutive orbitals [67, 68, 69, 39, 70, 71], but we obtained inconclusive results. While the ground-state COM orbitals on the cluster LABEL:cl:2.4.6.-2 at are consistent with the patterns "1010" and "0101" being realized in both momentum-loop directions, the same does not apply on LABEL:cl:6.0.0.6. The observed cross-cluster variability of spectral features may be related to the differences in their topological extent, which was found to have a profound impact on the ground-state splitting of FCIs in Ref. 40 and might be the reason why certain orbital patterns are a priori suppressed. Also, the pure two-body nature of the interaction may be insufficient to stabilize a Pfaffian phase in this model.
Concerning the possibility a Fermi-liquid-like state driven by the IHD, an analysis of the generated Fermi surface yields a threefold degeneracy for both clusters LABEL:cl:2.4.6.-2 and LABEL:cl:6.0.0.6, with COM orbitals at the points, except for LABEL:cl:6.0.0.6 at , where they are located slightly off the border of the MBZ. However, apart from the (partial) lack of agreement with the ground-state COM orbitals calculated by ED, the relatively miniscule energetic advantage of these configurations in the purely IHD-driven picture in conjunction with the absence of a clear Fermi surface in the orbital occupation over at this filling, discussed in Ref. 18, suggests more involved interaction effects beyond mere energetic preferences of the induced single-hole dispersion. The structure factor in Fig. 11(c–f) as well as the orbital occupations presented in Fig. 12 reveal comparable features to the case. The distribution of is shifted towards the border of the MBZ, where the situation at is once more smoother than at . Similarly, signatures in signal an increased charge order tendency for while such indications are suppressed at . Both of these observables were measured for the energetically lower and the higher lying state at the ground-state COM momenta. The results coincide qualitatively and quantitatively up to order . Although we find peaks in the structure factors at or in proximity to the and points for multiple clusters, the high degree of variability for this filling prohibits a stable finite-size extrapolation.
Similar to Sec. IV.5, we once more make use of the acquired understanding that a finite valence band dispersion supports effects from the inhomogeneous Berry curvature in order to investigate the nature of the sixfold degeneracy at and contrast it with the behavior at . According to the top panel of Fig. 11(b), the effect of at is not as apparent as for . Although the ground-state splitting () decreases until , the gap to the first excited state () also decreases. By comparing the two quantities, the bottom panel of Fig. 11(b) demonstrates a substantial improvement of the excitation gap on the energy scale of the ground-state manifold. This observation is corroborated by Fig. 13, where the quality of the ground-state manifold is once more enhanced at up to , while the order at is disfavored by the kinetic terms of the Hamiltonian. What is more, Fig. 13(b) at suggests the realization of a situation akin to for , where the three orbitals become almost doubly-degenerate.
The fact that a similar stabilization procedure to the - and -FCI applies for this configuration, hints at the quantum Hall-like nature of the phase at . In addition, the appearance of such signatures at with an increased valence band dispersion is compatible with the pronounced peak of the Berry curvature at for this hopping parameter. At the same time, the stabilization with provides further evidence against a Fermi-liquid driven by the IHD, since the valence acts opposite to the preferences of .
At a filling fraction of , another well known contender for the ground-state phase in a Landau level setting is the composite fermion liquid [63, 72]. Since this is a metallic state, its Fermi surface may be responsible for the variable degeneracy of the ground-states on different clusters and, additionally, it may also profit from an increased importance of the Chern character of the band by altering . Nevertheless, the impact of broken time-reversal and particle-hole symmetries in this model remain to be understood prior to a discussion on a more rigorous level. To sum up, although the designation of definitive ground-state orders for half filling would be too speculative based on the available data, our results contain crucial indications of the phases’ nature.
V Drafting of a tentative phase diagram
The abundance of data presented throughout Sec. IV calls for a more condensed graphical representation of the conclusive findings. Furthermore, the robustness of the different charge order patterns against a density deviation from their nominal filling has not been explored yet. In order to address both of these issues, we plot the structure factor ratio normalized to the system size for multiple clusters at fillings ranging and overlay it with the unambiguously identified correlated phases in Fig. 14. Here denotes the average contribution of momenta closest to , which are not related to by a symmetry operation. In order to counteract band-projection artifacts and for added robustness in degenerate situations, we average all related contributions prior to the computation of . As measures the sharpness of the peak in the structure factor, it is related to the correlation length of the charge density in real-space. Large suggest pronounced long-range order, whereas small values of argue against the presence of a distinct real-space order pattern.
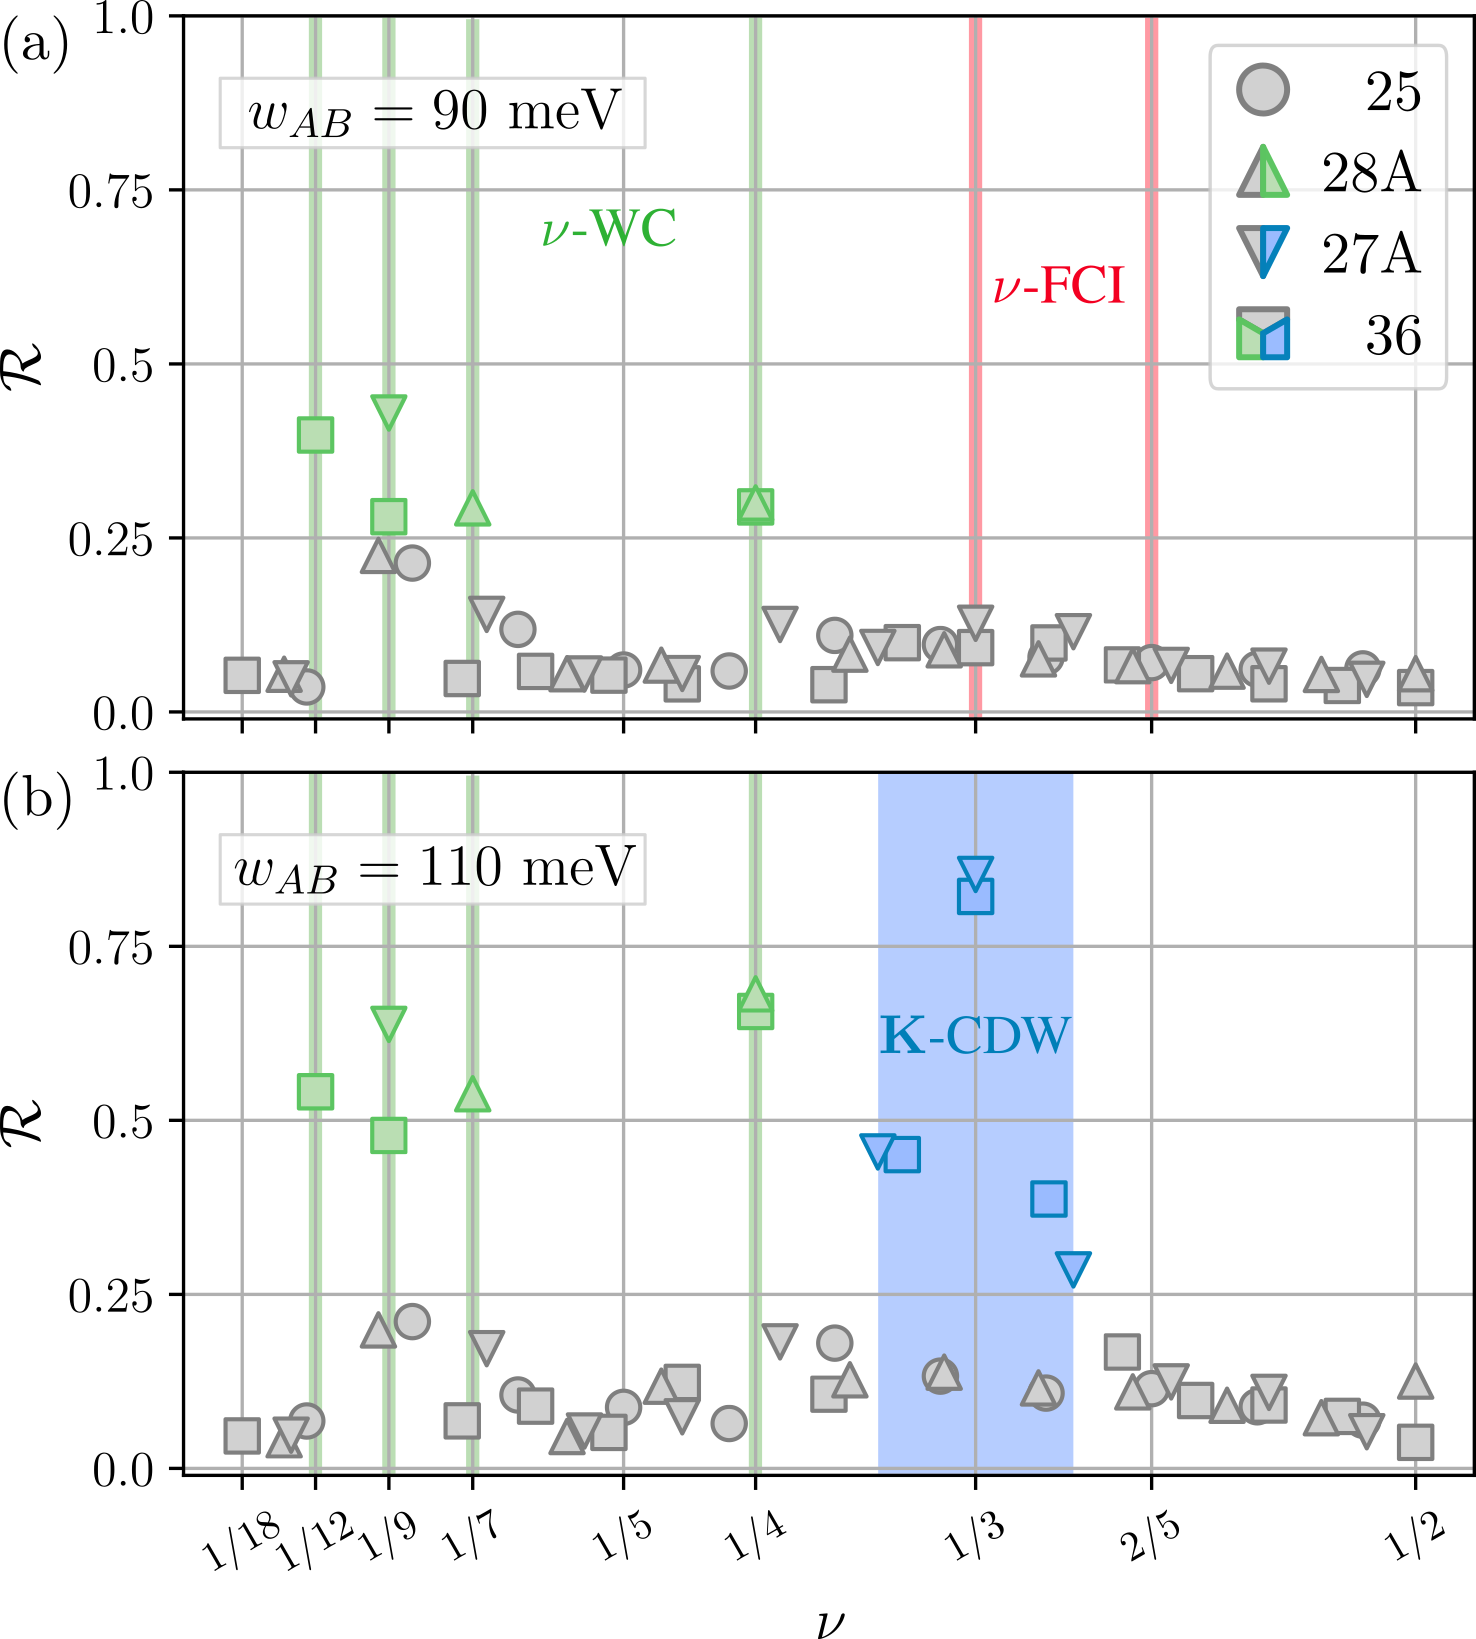
We choose to restrict to the pure interaction case of in order to avoid any bias on the charge order signatures stemming from the effects discussed in Sec. IV.2 and to keep the results applicable to the conduction band. Comparing Fig. 14(a) with Fig. 14(b), we can immediately tell that the two parameter values appear to result in similar physics at low fillings , while they differ substantially for a larger number of electrons per orbital . The series of WC-like charge order continues to even smaller fillings of and , with appropriate spectral features but also substantial peaks in . Similar to the ones at , , the abrupt reduction of their respective charge density correlation signature indicates that these charge orders manifest only at their corresponding commensurate filling fraction - highlighting their crystalline character. On the other hand, the -CDW near at appears to be robust against the introduction or removal of a few additional electrons, making it the preferred order tendency across a whole range of fillings, featuring true CDW character. Despite the composition of data from multiple clusters with different prime factorizations, the lack of pronounced charge order peaks slightly off the commensurate fillings , , , may also be rooted in the relatively coarse resolution of Fig. 14 or the chosen metric and a more CDW-like character may emerge in larger clusters. In addition to the symmetry breaking WC phases at low electron densities, the system also features topological FCI states at fillings as well as . The absence of such states at , e.g. at , , affirms the intuition gathered throughout Sec. IV.2, where the Coulomb interaction structure is found to generally prefer the arrangement of electrons at the border of the MBZ. At small fillings the electrons hence almost completely avoid the Berry curvature, rendering the situation qualitatively identical to . Concerning the (partially) inconclusive filling fractions of and , Fig. 14 attenuates the role of charge order in comparison to other, more pronounced situations.
A comparison of Fig. 14(b) with very recent experimental results for the TMD based moiré system in Ref. 26 suggests remarkable similarities with the TBLG/hBN structure discussed here. At , where the Chern character of the TBLG/hBN flat band is found to be subordinate, the experimental findings and proposed real-space order patterns at , and coincide with our theoretical predictions.
VI Conclusion
We performed an extensive exact diagonalization study of the single-band-projected TBLG/hBN many-body model at fractional fillings in the momentum-space basis. For a band filling of , we showed that the screened Coulomb interaction between electrons enables the formation of both a topological FCI but also a geometry sensitive CDW state. For and upon neglecting the single-particle dispersion, we agree with Ref. 18 and Ref. 19 on the FCI nature of the ground-state in the valence and conduction bands. However, as the interlayer hopping amplitude is increased to , we obtained solid evidence for a CDW with Dirac point order momentum that spontaneously breaks moiré translational symmetry and triples the unit cell. Signatures in the spectra and the structure factor point to the competition of these correlated insulating phases at , while clearly favors the -CDW, even for a fraction of the original screening length. This competition is further highlighted upon including the realistic kinetic energy contribution. While the opposing energetic preferences of the single-particle and the interaction induced hole dispersion in the valence band at lead to an FCI sweet spot where the electron density is smoothed across the MBZ, the flipped dispersion of the conduction band instead reinforces the tendency to occupy orbitals at the boundary and thus suppresses the FCI state in favor of the CDW. At , the kinetic energy gradually penalizes the CDW state energetically until becomes the dominant energy scale for the ground-state. The behavior at the complementary filling can be well explained by the situation at filling with twice the amount of electrons to accommodate in the MBZ. Further investigations of possible charge order at the next smaller commensurate fillings , , corresponding to a four- or sevenfold extension of the unit cell, lead to the conclusion that such a symmetry breaking correlated insulator may quite generically form in this model. Apart from the evidence for the formation of WCs, we corroborate the analogy to Landau levels beyond the state by demonstrating convincing signatures of a -FCI at . The situation at half filling turned out to be much more involved and could not be resolved unambiguously on the available cluster sizes. Nevertheless, we found qualitative similarities in the observables compared to other filling fractions, which together might contribute to a more comprehensive understanding in the future. The wealth of conclusive results is finally condensed and put into perspective in a tentative phase diagram for the filling dependence of order tendencies in TBLG/hBN, which, among other things reveals the -CDW character near , while charge order throughout the commensurate density series , , , is of WC-type, i.e. locked to the lattice at the corresponding commensurate densities.
We furthermore developed intuition on what microscopic mechanism drives the (de-) stabilization of the two phases: The interplay of the induced hole dispersion and kinetic energy, which essentially determine the electron density distribution, with the effective magnetic field due to the Berry curvature appears to be the fundamental reason the system favors one correlated phase over the other for very similar band parameters.
Our results thus promote the translational symmetry breaking charge-density-wave to a probable order tendency for the real moiré system. Our findings highlight the system’s sensitivity to microscopic model parameters even in the idealized situation of our treatment. This is in accordance with the issue of strong sample-to-sample dependence in experiments, where twist angle homogeneity, strain or pressure can directly affect the degree of interlayer orbital overlap. The recent evidence for - and (stripe) -CDWs in Ref. 22 for unaligned TBLG, at an electron filling roughly corresponding to in our flavor-polarized model, affirms the relevance of our results that charge order represent a general order tendency across multiple filling fractions to the physics of pure TBLG. The implications of our work are further extended by the agreement with recent experimental findings for a TMD based heterostructure in Ref. 26, suggesting a remarkable resemblance of these moiré systems for certain parameter regions.
Acknowledgments
We thank M. S. Scheurer for valuable discussions and comments. Moreover, we are grateful to A. Wietek and M. Schuler for providing the QuantiPy package, which simplified the incorporation of diverse simulation clusters. We acknowledge support by the Austrian Science Fund FWF within the DK-ALM (W1259-N27). The computational results presented have been achieved in part using the Vienna Scientific Cluster (VSC).
Appendix A Additional many-body spectra
This section provides an overview of exemplary many-body spectra encountered in the ED study but not included in the main text. The identified ground-state manifolds are shaded in the color of the respective symbols. The displayed results include further quasi double-degeneracies at half filling in Fig. 15 on the cluster LABEL:cl:2.4.6.-2 as well as the evidence for stable -CDW order at with the shorter screening length of in Fig. 16. The degeneracy and orbital separation in Fig. 17 clearly indicate an -WC for both considered values of . Figure 18(a) highlights the possibility for two classes of a -WC on clusters with symmetry like LABEL:cl:7.0.0.7, leading to an approximate 14-fold ground-state degeneracy with a minor energetic splitting due to the substrate induced breaking of . On the other hand, symmetric clusters similar to LABEL:cl:2.4.6.-2 in Fig. 18(b) can realize only a single variant of the translation symmetry breaking WC. The momenta of a given cluster are addressed by integers , , such that . The number of steps along until the origin is reencountered is denoted by and is related to the topological length of Ref. 40. For the displayed clusters LABEL:cl:5.0.0.5, LABEL:cl:6.0.0.6, LABEL:cl:7.0.0.7, LABEL:cl:2.4.6.-2 we obtain , , , .
q
Appendix B Derivation of the band-projected structure factor
The structure factor is generally defined as the Fourier transform of the static density-density correlation function
| (5) | ||||
with for general fermionic momentum-space density operators . In our notation, the momenta and are located inside the Brillouin zone of ordinary graphene and thus have to be folded back onto via and . Since we are interested in the dominant correlations on the moiré scale, we restrict to the measurement of . This means we consider only momentum transfers in the original MBZ and effectively drop the sum over , which would otherwise be introduced by the transformation to the band basis [see Eq. (2)]. In the continuum model, the graphene second quantized operators are indexed by valley , sublattice and momentum , which in the moiré band basis transforms to , band and as
| (6) |
The eigenvector-components are obtained from solving the single-particle eigenproblem and introduce additional form factors into the expression for the structure factor. Here it should be noted that the truncation to may give rise to slight quantitative discrepancies in the measurement, mostly for large at the border of the MBZ, depending on what contributions at the boundary of the MBZ are taken into account. Nevertheless, these are only minor effects and what is more, the inclusion of contributions was found to reproduce the qualitative aspects of the results. As we consider only spinless fermions of a single band and valley and thus neglect band indices in Eq. (7) from line 2 onward, the transformation reads
| (7) | ||||
with again denoting the form factors introduced in Eq. (2).
Appendix C Used cluster geometries
Table 1 gives an overview of all the clusters used for performing ED. Each one has a distinct ID, which it is referred to by in the main text. The geometric properties of aspect ratio, number of realizations of high symmetry momenta and the point group are the basis for choosing a viable cluster in the first place but also guide the interpretation of numerical results. The torus spans the real-space simulation cell like and , where are the moiré lattice vectors. The momentum-space discretization may then be derived as usual by finding the respective reciprocal vectors.
| ID | Torus | Aspect ratio | Number of | Point group | ||
|---|---|---|---|---|---|---|
| 12A | 12 | 1.00 | 1 | 3 | ||
| 12B | 12 | 1.33 | 0 | 1 | ||
| 15A | 15 | 1.00 | 0 | 0 | ||
| 15B | 15 | 1.67 | 0 | 0 | ||
| 16 | 16 | 1.00 | 0 | 3 | ||
| 18 | 18 | 2.00 | 1 | 1 | ||
| 20A | 20 | 1.53 | 0 | 3 | ||
| 20B | 20 | 1.76 | 0 | 1 | ||
| 21A | 21 | 1.00 | 1 | 0 | ||
| 21B | 21 | 2.33 | 0 | 0 | ||
| 24A | 24 | 1.00 | 1 | 1 | ||
| 24B | 24 | 1.73 | 1 | 3 | ||
| 24C | 24 | 1.50 | 0 | 3 | ||
| 25 | 25 | 1.00 | 0 | 0 | ||
| 27A | 27 | 1.00 | 1 | 0 | ||
| 27B | 27 | 3.00 | 1 | 0 | ||
| 28A | 28 | 1.00 | 0 | 3 | ||
| 28B | 28 | 1.75 | 0 | 0 | ||
| 30A | 30 | 1.04 | 0 | 1 | ||
| 30B | 30 | 1.20 | 0 | 1 | ||
| 32 | 32 | 1.00 | 0 | 3 | ||
| 35A | 35 | 1.56 | 0 | 0 | ||
| 35B | 35 | 1.40 | 0 | 0 | ||
| 36 | 36 | 1.00 | 1 | 3 | ||
| 39 | 39 | 1.00 | 1 | 0 | ||
| 40A | 40 | 1.14 | 0 | 1 | ||
| 40B | 40 | 1.31 | 0 | 3 | ||
| 42A | 42 | 1.68 | 0 | 1 | ||
| 42B | 42 | 1.17 | 0 | 0 | ||
| 49 | 49 | 1.00 | 0 | 0 | ||
| 56 | 56 | 1.14 | 0 | 1 | ||
References
- Cao et al. [2018a] Y. Cao, V.Fatemi, A. Demir, S. Fang, S. L. Tomarken, J. Y. Luo, J. D. Sanchez-Yamagishi, K. Watanabe, T. Taniguchi, E. Kaxiras, R. C. Ashoori, and P. Jarillo-Herrero, Nature 556, 80 (2018a).
- Cao et al. [2018b] Y. Cao, V. Fatemi, S. Fang, K. Watanabe, T. Taniguchi, E. Kaxiras, and P. Jarillo-Herrero, Nature 556, 43 (2018b).
- Yankowitz et al. [2019] M. Yankowitz, S. Chen, H. Polshyn, Y. Zhang, K. Watanabe, T. Taniguchi, D. Graf, A. D. Young, and C. R. Dean, Science 363, 1059 (2019).
- Lu et al. [2019] X. Lu, P. Stepanov, W. Yang, M. Xie, M. A. Aamir, I. Das, C. Urgell, K. Watanabe, T. Taniguchi, G. Zhang, A. Bachtold, A. H. MacDonald, and D. K. Efetov, Nature 574, 653 (2019).
- Stepanov et al. [2020] P. Stepanov, I. Das, X. Lu, A. Fahimniya, K. Watanabe, T. Taniguchi, F. H. L. Koppens, J. Lischner, L. Levitov, and D. K. Efetov, Nature 583, 375 (2020).
- Saito et al. [2020] Y. Saito, J. Ge, K. Watanabe, T. Taniguchi, and A. F. Young, Nat. Phys. 16, 926 (2020).
- Liu et al. [2020a] X. Liu, Z. Wang, K. Watanabe, T. Taniguchi, O. Vafek, and J. I. A. Li, arXiv:2003.11072 (2020a).
- Arora et al. [2020] H. S. Arora, R. Polski, Y. Zhang, A. Thomson, Y. Choi, H. Kim, Z. Lin, I. Z. Wilson, X. Xu, J.-H. Chu, K. Watanabe, T. Taniguchi, J. Alicea, and S. Nadj-Perge, Nature 583, 379 (2020).
- Christos et al. [2020] M. Christos, S. Sachdev, and M. S. Scheurer, Proceedings of the National Academy of Sciences 117, 29543 (2020).
- Scheurer and Samajdar [2020] M. S. Scheurer and R. Samajdar, Phys. Rev. Research 2, 033062 (2020).
- Khalaf et al. [2020] E. Khalaf, S. Chatterjee, N. Bultinck, M. P. Zaletel, and A. Vishwanath, arXiv:2004.00638 (2020).
- Chatterjee et al. [2020] S. Chatterjee, M. Ippoliti, and M. P. Zaletel, Skyrmion superconductivity: Dmrg evidence for a topological route to superconductivity (2020), arXiv:2010.01144 .
- Hu et al. [2019] X. Hu, T. Hyart, D. I. Pikulin, and E. Rossi, Phys. Rev. Lett. 123, 237002 (2019).
- Julku et al. [2020] A. Julku, T. J. Peltonen, L. Liang, T. T. Heikkilä, and P. Törmä, Phys. Rev. B 101, 060505(R) (2020).
- Xie et al. [2020a] F. Xie, Z. Song, B. Lian, and B. A. Bernevig, Phys. Rev. Lett. 124, 167002 (2020a).
- Sharpe et al. [2019] A. L. Sharpe, E. J. Fox, A. W. Barnard, J. Finney, K. Watanabe, T. Taniguchi, M. A. Kastner, and D. Goldhaber-Gordon, Science 365, 605 (2019).
- Serlin et al. [2019] M. Serlin, C. L. Tschirhart, H. Polshyn, Y. Zhang, J. Zhu, K. Watanabe, T. Taniguchi, L. Balents, and A. F. Young, Science 367, 900 (2019).
- Abouelkomsan et al. [2020] A. Abouelkomsan, Z. Liu, and E. J. Bergholtz, Phys. Rev. Lett. 124, 106803 (2020).
- Repellin and Senthil [2020] C. Repellin and T. Senthil, Phys. Rev. Res. 2, 023238 (2020).
- Ledwith et al. [2020] P. J. Ledwith, G. Tarnopolsky, E. Khalaf, and A. Vishwanath, Phys. Rev. Research 2, 023237 (2020).
- Andrews and Soluyanov [2020] B. Andrews and A. Soluyanov, Phys. Rev. B 101, 235312 (2020).
- Xie et al. [2020b] F. Xie, A. Cowsik, Z.-D. Song, B. Lian, B. A. Bernevig, and N. Regnault, arXiv:2010.00588 (2020b).
- Soejima et al. [2020] T. Soejima, D. E. Parker, N. Bultinck, J. Hauschild, and M. P. Zaletel, Phys. Rev. B 102, 205111 (2020).
- Kang and Vafek [2020] J. Kang and O. Vafek, Phys. Rev. B 102, 035161 (2020).
- Nuckolls et al. [2020] K. P. Nuckolls, M. Oh, D. Wong, B. Lian, K. Watanabe, T. Taniguchi, B. A. Bernevig, and A. Yazdani, Nature 10.1038/s41586-020-3028-8 (2020).
- Xu et al. [2020] Y. Xu, S. Liu, D. A. Rhodes, K. Watanabe, T. Taniguchi, J. Hone, V. Elser, K. F. Mak, and J. Shan, Nature 587, 214 (2020).
- Regan et al. [2020] E. C. Regan, D. Wang, C. Jin, M. I. B. Utama, B. Gao, X. Wei, S. Zhao, W. Zhao, Z. Zhang, K. Yumigeta, M. Blei, J. D. Carlström, K. Watanabe, T. Taniguchi, S. Tongay, M. Crommie, A. Zettl, and F. Wang, Nature 579, 359 (2020).
- Wang et al. [2020] L. Wang, E.-M. Shih, A. Ghiotto, L. Xian, D. A. Rhodes, C. Tan, M. Claassen, D. M. Kennes, Y. Bai, B. Kim, K. Watanabe, T. Taniguchi, X. Zhu, J. Hone, A. Rubio, A. N. Pasupathy, and C. R. Dean, Nature Materials 19, 861 (2020).
- Fukuyama et al. [1979] H. Fukuyama, P. M. Platzman, and P. W. Anderson, Phys. Rev. B 19, 5211 (1979).
- Yoshioka and Lee [1983] D. Yoshioka and P. A. Lee, Phys. Rev. B 27, 4986 (1983).
- Yoshioka et al. [1983] D. Yoshioka, B. I. Halperin, and P. A. Lee, Phys. Rev. Lett. 50, 1219 (1983).
- Moessner and Chalker [1996] R. Moessner and J. T. Chalker, Phys. Rev. B 54, 5006 (1996).
- Rezayi et al. [1999] E. H. Rezayi, F. D. M. Haldane, and K. Yang, Phys. Rev. Lett. 83, 1219 (1999).
- Haldane et al. [2000] F. D. M. Haldane, E. H. Rezayi, and K. Yang, Phys. Rev. Lett. 85, 5396 (2000).
- Yang et al. [2001] K. Yang, F. D. M. Haldane, and E. H. Rezayi, Phys. Rev. B 64, 081301(R) (2001).
- Neupert et al. [2011] T. Neupert, L. Santos, C. Chamon, and C. Mudry, Phys. Rev. Lett. 106, 236804 (2011).
- Tang et al. [2011] E. Tang, J.-W. Mei, and X.-G. Wen, Phys. Rev. Lett. 106, 236802 (2011).
- Sun et al. [2011] K. Sun, Z. Gu, H. Katsura, and S. Das Sarma, Phys. Rev. Lett. 106, 236803 (2011).
- Regnault and Bernevig [2011] N. Regnault and B. A. Bernevig, Phys. Rev. X 1, 021014 (2011).
- Läuchli et al. [2013] A. M. Läuchli, Z. Liu, E. J. Bergholtz, and R. Moessner, Phys. Rev. Lett. 111, 126802 (2013).
- Bergholtz and Liu [2013] E. J. Bergholtz and Z. Liu, Int. J. Mod. Phys. B 27, 1330017 (2013).
- Rahnejat et al. [2011] K. Rahnejat, C. Howard, N. Shuttleworth, S. Schofield, K. Iwaya, C. Hirjibehedin, C. Renner, G. Aeppli, and M. Ellerby, Nat. Comm. 2, 558 (2011).
- Spanton et al. [2018] E. M. Spanton, A. A. Zibrov, H. Zhou, T. Taniguchi, K. Watanabe, M. P. Zaletel, and A. F. Young, Science 360, 62 (2018).
- Lopes dos Santos et al. [2007] J. M. B. Lopes dos Santos, N. M. R. Peres, and A. H. Castro Neto, Phys. Rev. Lett. 99, 256802 (2007).
- Bistritzer and MacDonald [2011] R. Bistritzer and A. H. MacDonald, PNAS 108, 12233 (2011).
- Lopes dos Santos et al. [2012] J. M. B. Lopes dos Santos, N. M. R. Peres, and A. H. Castro Neto, Phys. Rev. B 86, 155449 (2012).
- Koshino et al. [2018] M. Koshino, N. F. Q. Yuan, T. Koretsune, M. Ochi, K. Kuroki, and L. Fu, Phys. Rev. X 8, 031087 (2018).
- Bultinck et al. [2020a] N. Bultinck, S. Chatterjee, and M. P. Zaletel, Phys. Rev. Lett. 124, 166601 (2020a).
- Moon and Koshino [2013] P. Moon and M. Koshino, Phys. Rev. B 87, 205404 (2013).
- Koshino [2015] M. Koshino, New J. Phys. 17, 015014 (2015).
- Zhang et al. [2019] Y.-H. Zhang, D. Mao, and T. Senthil, Phys. Rev. Res. 1, 033126 (2019).
- Liu et al. [2020b] Z. Liu, A. Abouelkomsan, and E. J. Bergholtz, arXiv:2004.09522v1 (2020b).
- Wu and Das Sarma [2020] F. Wu and S. Das Sarma, arXiv:2005.10254v1 (2020).
- Chen et al. [2020] G. Chen, A. L. Sharpe, E. J. Fox, Y.-H. Zhang, S. Wang, L. Jiang, B. L., H. Li, K. Watanabe, T. Taniguchi, Z. Shi, T. Senthil, D. Goldhaber-Gordon, Y. Zhang, and F. Wang, Nature 579, 56 (2020).
- Liu et al. [2020c] X. Liu, Z. Hao, E. Khalaf, J. Y. Lee, Y. Ronen, H. Yoo, D. H. Najafabadi, K. Watanabe, T. Taniguchi, A. Vishwanath, and P. Kim, Nature 583, 221 (2020c).
- Zondiner et al. [2020] U. Zondiner, A. Rozen, D. Rodan-Legrain, Y. Cao, R. Queiroz, T. Taniguchi, K. Watanabe, Y. Oreg, F. von Oppen, A. Stern, E. Berg, P. Jarillo-Herrero, and S. Ilani, Nature 582, 203 (2020).
- Bultinck et al. [2020b] N. Bultinck, E. Khalaf, S. Liu, S. Chatterjee, A. Vishwanath, and M. P. Zaletel, Phys. Rev. X 10, 031034 (2020b).
- Liu et al. [2019] S. Liu, E. Khalaf, J. Y. Lee, and A. Vishwanath, arXiv:1905.07409 (2019).
- Zhang et al. [2020] Y. Zhang, K. Jiang, Z. Wang, and F. Zhang, Phys. Rev. B 102, 035136 (2020).
- Wietek et al. [2017] A. Wietek, M. Schuler, and A. M. Läuchli, arXiv:1704.08622 (2017).
- Bessler et al. [2019] R. Bessler, U. Duerig, and E. Koren, Nanoscale Advances 1, 1702 (2019).
- Liu et al. [2013] T. Liu, C. Repellin, B. A. Bernevig, and N. Regnault, Phys. Rev. B 87, 205136 (2013).
- Halperin et al. [1993] B. I. Halperin, P. A. Lee, and N. Read, Phys. Rev. B 47, 7312 (1993).
- Moore and Read [1991] G. Moore and N. Read, Nuclear Physics B 360, 362 (1991).
- Wen [1993] X.-G. Wen, Phys. Rev. Lett. 70, 355 (1993).
- Read and Green [2000] N. Read and D. Green, Phys. Rev. B 61, 10267 (2000).
- Seidel and Lee [2006] A. Seidel and D.-H. Lee, Phys. Rev. Lett. 97, 056804 (2006).
- Bergholtz et al. [2006] E. J. Bergholtz, J. Kailasvuori, E. Wikberg, T. H. Hansson, and A. Karlhede, Phys. Rev. B 74, 081308(R) (2006).
- Bernevig and Haldane [2008] B. A. Bernevig and F. D. M. Haldane, Phys. Rev. Lett. 100, 246802 (2008).
- Wen and Wang [2008a] X.-G. Wen and Z. Wang, Phys. Rev. B 77, 235108 (2008a).
- Wen and Wang [2008b] X.-G. Wen and Z. Wang, Phys. Rev. B 78, 155109 (2008b).
- Geraedts et al. [2016] S. D. Geraedts, M. P. Zaletel, R. S. K. Mong, M. A. Metlitski, A. Vishwanath, and O. I. Motrunich, Science 352, 197 (2016).