Dependence of the old star clusters’ dynamical clock on the host galaxy gravitational field
Abstract
I report outcomes of the analysis of the parameter, which measures the level of radial segregation of blue straggler stars in old star clusters, commonly known as the dynamical clock for the long-term internal dynamical evolution. I used values available in the literature for 48 Milky Way globular clusters. I found that the relationship of and the number of central relaxation times which have elapsed () shows a non negligible dependence on the strength of the host galaxy gravitational potential, in addition to depending on the two-body relaxation mechanism. Indeed, a measured value corresponds to relatively smaller or larger values for star clusters located farther or closer to the galaxy center. From an observational point of view, this finding reveals the possibility of disentangling for the first time the dynamical evolutionary stage due to two-body relaxation and tidal effect, that affect the whole star clusters’ body concurrently.
1 Introduction
The internal dynamics of star clusters has long been addressed in the literature from numerical and observational studies (Meylan & Heggie, 1997; Heggie & Hut, 2003; Krause et al., 2020). Recently, Ferraro et al. (2018, see also references therein) found a strong correlation between , defined as the area enclosed between the cumulative radial distribution of blue straggler stars and that of a reference population, and the number of central relaxation times (=age/) of old star clusters. Because of the observed correlation between and the central relaxation time of old star clusters, has been used as a powerful dynamical clock. For the sake of the reader, I refer to a review by Ferraro et al. (2020).
Because measures the overall internal dynamical stage of an old star cluster, the evolutionary stage due to two-body relaxation and tidal effects are both included in the values. Particularly, tidal effects accelerate mass segregation and two-body relaxation by increasing the mass loss rate. As far as I am aware, the impact of tidal effects on has not been explicitly mentioned. The novelty of this work consists in disentangling observationally, for the first time, the dependence of on two-body relaxation and tidal effects, so that the dynamical evolutionary stage of a star cluster due to two-body relaxation can be estimated for star clusters in different orbits. In doing this, I evaluate the contribution of tidal effects to the measured values of .
2 Analysis and discussion
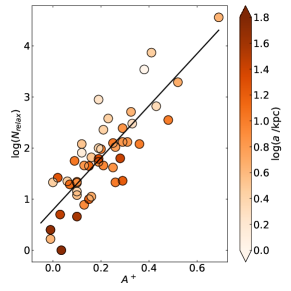
Figure 1 (left panel) reproduces the relation obtained by Ferraro et al. (2018). They have been colored according to the semi-major axis () of the cluster’s orbits around the Galactic center. I use because is more representative of the mean orbital distance of the globular clusters than the perigalactic and apogalactic distances (Piatti, 2019). A not subtle dispersion in log() at a constant value is observed, which would seem to change with , in the sense that the larger the log() value, the smaller the mean semi-major axis. Such a trend, observed in Figure 1, reveals the correlation with the semi-major axis or, in other words, that depending on the position in the Milky Way, corresponds to slightly different internal dynamic evolutionary stages.
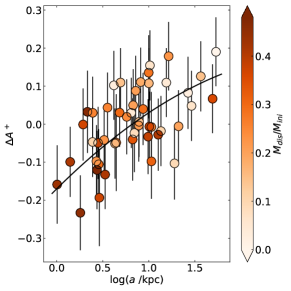
In order to show the effects of tides in the Ferraro et al. (2018)’s relation we evaluate the range of by computing the difference between the values and those located on the solid line of Figure 1 for the same values, called . The result, depicted in Figure 1 (middle panel), shows the correlation of with the positions of the globular clusters in the Milky Way. Points have been colored according to the ratio between the cluster mass lost by tidal disruption and the initial cluster mass ( ), which we use as the indicator for tidal field strength, following Piatti et al. (2019)’s results. and are interchangeable. Uncertainties in were computing by adding in quadrature those of values and the rms error of the solid line derived by Ferraro et al. (2018). Figure 1 (middle panel) also shows that 0.0 dex at the Sun’s galactocentric distance.
Figure 1 (middle panel) reveals that the scatter of points seen in Fig. 1 (left panel) on both sides of the straight line - i.e., the dispersion of values at a fixed - is not random, but caused by the dependence of on . is larger than the mean value for the corresponding for globular clusters located toward the outer Milky Way regions, and is smaller than that mean value for globular clusters located toward the inner Milky Way regions. This behavior of is expected, because is a measure of the level of spatial segregation of blue straggler stars. Similarly to other globular cluster stellar populations, they differentially experience the effects of the Milky Way gravitational field, so that they can more easily reach larger distance from the globular cluster center when the Galactic potential well is weaker, and role reversal. Therefore, parameters that measure the spatial distribution of stellar populations of globular clusters (e.g., core, tidal radii, relaxation time, etc) reflect both the internal dynamical evolutionary stage of a globular cluster and the tidal effects, concurrently. From a purely stellar dynamical point of view, a globular cluster located in the inner Milky Way region would appear dynamically accelerated, or in a more advanced internal dynamical evolutionary stage compared to a globular cluster located in the outer Milky Way regions (see Piatti & Mackey, 2018; Piatti et al., 2019). For completeness purposes I performed a quadratic least square fit between and log( /kpc), as follows:
| (1) |
I obtained = -0.170.05, = 0.240.12, and = -0.040.07, rms = 0.07, = 0.65, and a correlation coefficient = 0.60 (see solid line in Fig. 1, middle panel). I note that a linear least square fit would produce similar results with a slightly smaller correlation coefficient.
Eq. (1) can be useful to compute dynamical ages of a star clusters due to two-body relaxation, as it were not affected by tidal effects. In doing this, the calculated value must be subtracted from the observed value, and the resulting one to be entered in eq.(2) of Ferraro et al. (2018). Because 0.0 dex at the Sun’s galactocentric distance, this procedure allows to compare dynamical ages of star clusters spread throughout the Milky Way as they were located at the position of the Sun.
I also performed a linear least square fit between , and , as follows:
| (2) |
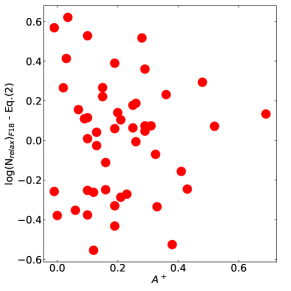
and obtained = 1.520.18, = 4.570.41, and = -0.770.15, rms= 0.39, = 0.16, and a coefficient of determination R2= 0.81. I obtained for eq.(2) a Spearman rank correlation coefficient of 0.87 and a Pearson correlation coefficient of 0.90, which represent an improvements over the values of 0.82 and 0.85 obtained by Ferraro et al. (2018), respectively, for their eq. (2). For the sake fo the reader Figure 1 (right panel) depicts the difference between values calculated from Ferraro et al. (2018)’s relation and from eq.(2) as a function of .
References
- Ferraro et al. (2020) Ferraro, F. R., Lanzoni, B., & Dalessandro, E. 2020, arXiv e-prints, arXiv:2001.07435. https://arxiv.org/abs/2001.07435
- Ferraro et al. (2018) Ferraro, F. R., Lanzoni, B., Raso, S., et al. 2018, ApJ, 860, 36, doi: 10.3847/1538-4357/aac01c
- Heggie & Hut (2003) Heggie, D., & Hut, P. 2003, The Gravitational Million-Body Problem: A Multidisciplinary Approach to Star Cluster Dynamics
- Krause et al. (2020) Krause, M. G. H., Offner, S. S. R., Charbonnel, C., et al. 2020, arXiv e-prints, arXiv:2005.00801. https://arxiv.org/abs/2005.00801
- Meylan & Heggie (1997) Meylan, G., & Heggie, D. C. 1997, A&A Rev., 8, 1, doi: 10.1007/s001590050008
- Piatti (2019) Piatti, A. E. 2019, ApJ, 882, 98, doi: 10.3847/1538-4357/ab3574
- Piatti & Mackey (2018) Piatti, A. E., & Mackey, A. D. 2018, MNRAS, 478, 2164, doi: 10.1093/mnras/sty1048
- Piatti et al. (2019) Piatti, A. E., Webb, J. J., & Carlberg, R. G. 2019, MNRAS, 489, 4367, doi: 10.1093/mnras/stz2499