Search for invisible axion dark matter of mass meV with the QUAX– experiment
Abstract
A haloscope of the QUAX– experiment composed of an oxygen-free high thermal conductivity-Cu cavity inside an 8.1 T magnet and cooled to mK is put in operation for the search of galactic axion with mass . The power emitted by the resonant cavity is amplified with a Josephson parametric amplifier whose noise fluctuations are at the standard quantum limit. With the data collected in about 1 h at the cavity frequency GHz, the experiment reaches the sensitivity necessary for the detection of galactic QCD-axion, setting the confidence level limit to the axion-photon coupling GeV-1.
I Introduction
The axion is a hypothetical particle that was first introduced by Weinberg [1] and Wilczek [2] as a consequence of the Peccei-Quinn mechanism to solve the strong problem of QCD [3, *PecceiQuinn2]. The axion is a pseudo-Goldstone boson associated with an additional symmetry of the Standard Model Lagrangian, which is spontaneously broken at an extremely high energy scale . Axions, with mass , may constitute the dark matter (DM) content in our Galaxy [5, *abbott1983, *dine1983]. Astrophysical observations and cosmological considerations suggest a favored mass range of [8, *PDG2018]. Several operating and proposed experiments rely on the haloscope concept proposed by Sikivie [10, *Sikivie2] to probe the axion existence; among them are ADMX [12, 13], HAYSTAC [14], ORGAN [15], CAPP-8T [16], CAPP-9T [17], RADES [18, *RADES2], QUAX [20, 21, 22, 23], and KLASH [24, *KLASH2, *KLASH3]. Dielectric haloscopes have also been proposed, like MADMAX [27] and BRASS [28].
The classical haloscope detection scheme consists of a resonant cavity immersed in a static magnetic field to stimulate the axion conversion into photons through the Primakoff effect. When the cavity resonant frequency is tuned to the axion mass , the expected power deposited by DM axions is given by [29, *HAYSTAC2]
| (1) |
where GeV/cm3 [31] is the local DM density and is the coupling constant appearing in the Lagrangian describing the axion-photon interaction. The second set of parentheses contains the vacuum permeability , the magnetic field strength , the cavity volume , its angular frequency , the coupling between the cavity and receiver , and the loaded quality factor , with the unloaded quality factor. Here, is a geometrical factor equal to about 0.69 for the 010 mode of a cylindrical cavity. When the cavity is not exactly tuned to the axion mass, the Lorentzian behavior needs to be taken into account, so Eq. (1) is multiplied by
| (2) |
where is the detuning from resonance.
Presently, different solutions are being devised to improve the signal-to-noise ratio. The resonant cavity design is moving towards the multiple-cell concept [17] and the employment of different materials, like superconductors (Refs. [23, 32] and Ref. [33]) or dielectrics [34, 35]. On the amplification side, state-of-the-art experiments operate at the SQL with SQUIDs [12, 36] or Josephson parametric amplifiers (JPAs) [13] while there has been an attempt to circumvent it using squeezed-state receivers [14]. Yet, it is clear that the turning point in future experiments will be the introduction of single microwave photon counters in the amplification chain [37, 38].
In this work we describe the operation of a classical haloscope of the QUAX– experiment using a copper cavity coupled to a JPA and immersed in a static magnetic field of , all cooled down with a dilution refrigerator at a working temperature . These features improve the work of Ref. [23], allowing us to exclude values of GeV-1 at 90% C.L. in a small region of 3.7 neV around eV.
II Experimental Setup
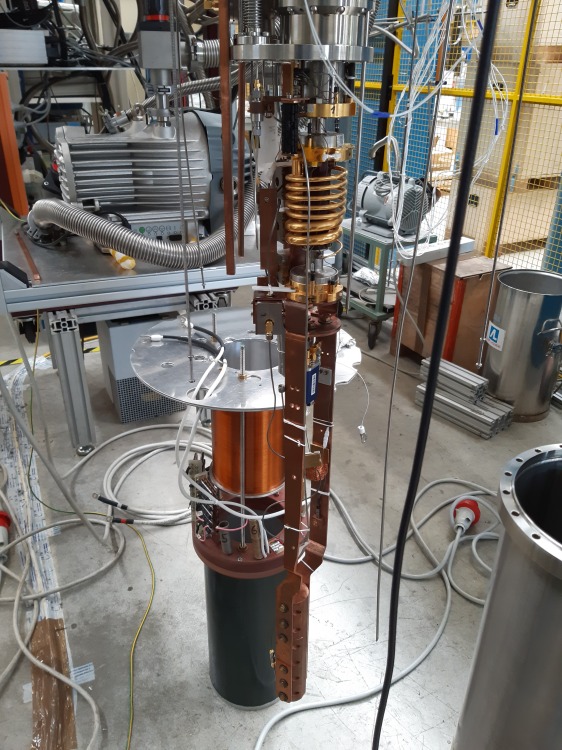
The haloscope, assembled at Laboratori Nazionali di Legnaro (LNL), is composed of a cylindrical OFHC-Cu cavity (Fig. 1), with an inner radius of 11.05 mm and length 210 mm, inserted inside the 150 mm diameter bore of an 8.1 T superconducting (SC) magnet of length 500 mm. The total volume of the cavity is . The whole system is hosted in a dilution refrigerator with a base temperature of 90 mK. Each cavity endplate hosts a dipole antenna in the holes drilled on the cavity axis. The cavity is treated with electrochemical polishing to minimize surface losses. We measure the resonant peak of the mode at 150 mK and with the magnet on, with a vector network analyzer, obtaining the frequency = 10.4018 GHz and an unloaded quality factor = 76,000, in agreement with expectations from simulation performed with the ANSYS HFSS suite [39]. During data-taking runs, the cavity is critically coupled to the output rf line and the loaded quality factor is measured to be about = 36,000.
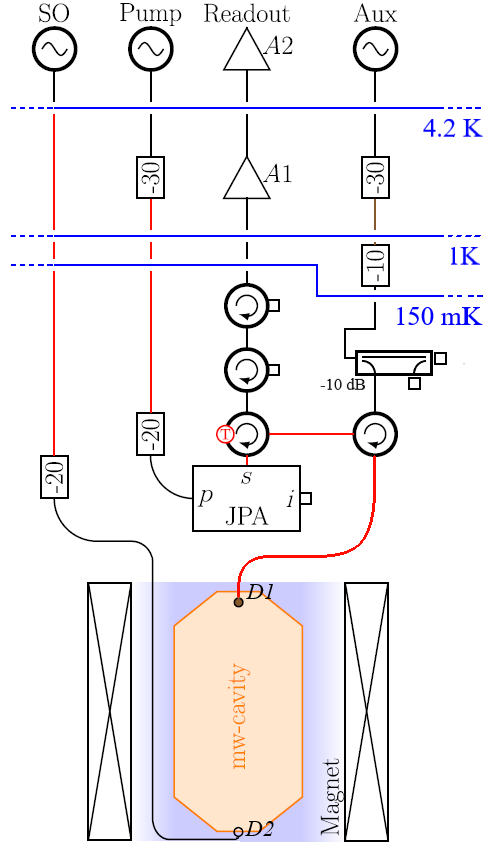
The rf setup is the same as our previous measurement [22] and is shown in Fig. 2. It consists of four rf lines used to characterize and measure the cavity signal and to determine attenuations and gains. Starting from the left of Fig. 2, the “SO” line connects the source oscillator to the fixed, weakly coupled antenna D2 and is used to inject calibration and probe signals into the cavity. The “Pump” line connects the pump-signal generator to the corresponding “p” port of a JPA amplifier. The cavity is critically coupled to the “Readout” line through antenna D1, tunable via a micrometric screw. The emitted power enters the JPA on the “s” port and is reflected, amplified, toward the HEMT cryogenic (A1) and HEMT room-temperature (A2) amplifiers. The signal is then downconverted with an I-Q mixer with a 100 MHz IF band, the phase and quadrature components of the heterodyne signal are postamplified in a 10 MHz band and finally sampled via an analog-to-digital converter (ADC) with a 2 MHz bandwidth. The “Aux” line is an auxiliary line introduced for calibration purposes. To minimize the Johnson noise contribution at the coldest stage, we insert attenuators and circulators in the rf lines. A nonoptimal attenuation of the “Aux” line with 10 dB attenuation at 1 K and 10 dB at 150 mK causes an excess Johnson noise of about 95 mK on the circulator and on the cavity (since they are thermally connected), corresponding to an effective temperature of the circulator of 273 mK at 10 GHz. We monitor the temperatures with RuO2 thermometers, one in thermal contact with the cavity and the other with the mixing chamber. Due to some unexpected behavior of the thermometers, we only estimate a temperature between 100 mK and 150 mK in the mixing chamber and between 200 mK and 250 mK on the cavity.
The JPA in our setup, first realized in [40], has noise temperature expected at the quantum limit of about 0.5 K (including 0.25 K from vacuum fluctuations) and a resonance frequency tunable between 10 and 10.5 GHz by varying the pump amplitude and frequency and by applying a small magnetic field for fine regulation. After tuning the resonance frequency of the JPA to that of the cavity we measure, a gain of 18 dB in a 10 MHz bandwidth.
III Analysis and Results
We first measure the transmittivity of the rf lines and the amplification gain as described in detail in [22]. Then we calibrate the power scale by injecting a known signal. Finally, we measure the system nois temperature resulting in K, where the errors result from the uncertainty in the calibration scale due to a limited tunability of the coupling of antenna D1 and to the temperature variation during the data-taking run. This value, within the error, is in agreement with our estimate of 0.83 K obtained from the single contributions reported in Table 1.
| Source | Gain [dB] | Noise temp. [K] | Input noise [K] |
|---|---|---|---|
| Cavity | – | 0.078 | 0.078 |
| Vacuum | – | 0.25 | 0.25 |
| JPA | 18 | 0.25 | 0.25 |
| Cables | -3 | – | – |
| HEMT (A1) | 30 | 8 | 0.25 |
| Total | 0.83 | ||
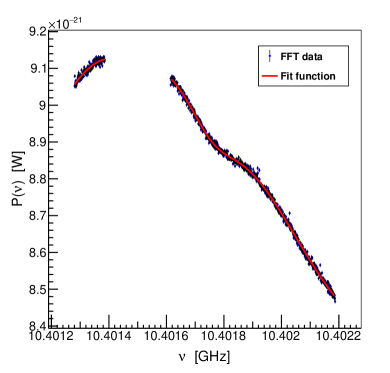
After setting the magnetic field to 8.1 T, we perform the axion search for a total time s with an ADC sampling of 2 Ms/s with the cavity tuned at a fixed-frequency of GHz. We compute the average power spectrum with a fine frequency bin of 651 Hz, corresponding to 1/16th of the expected axion-signal width [41]; we then identify and remove IF noise bins, which have a width . We exclude from our analysis a 200 kHz frequency region around the local oscillator frequency, GHz, which is affected by and pickup noise, also appearing when running the setup with the magnet off. For the same reason we also exclude a single bin in the cavity region; this has an off-resonance counterpart, symmetric with respect to the local oscillator. Performing the ratio of the left half of the spectrum to the right half, the single bin and its counterpart perfectly cancel; thus they are considered noise bins and are removed. This single bin and the 200 kHz region around LO are the only features removed from the spectrum. Finally, we considere only the region of the Lorentzian distribution of the cavity power spectrum with an expected power of at least 10% of the peak value. The resulting spectrum is shown in Fig. 3.
In order to extract the residuals, we model the system composed of the cavity and the “Readout” line with an equivalent electrical circuit. Using the transmission-line formalism, we derive the following expression of the power spectrum:
| (3) |
Note that K is the sum of the noise temperatures of the JPA and HEMT (A1) amplifiers, as reported in Table 1. Here, mK is the effective temperature of the circulator on the “Aux” line, and is the temperature of the cavity, which is left as a free parameter. Low temperatures require the use of Bose-Einstein distribution, so instead of and we use the noise temperatures and ; the tilde stands for , including the contribution from vacuum fluctuations. Therefore, the first term in the big parentheses represents the contribution of the circulator’s Johnson noise reflected by the cavity and the thermal noise emitted by the cavity itself, while the second term is the added noise of amplifiers.
Here, is the loaded quality factor, , the cavity resonance frequency and is the total gain function.
We fit the power spectrum by expressing as 2nd and 4th order polynomials in the left and right branches, respectively. Given the large number of unknown parameters we fix all known quantities to the best of our knowledge, taking into account measurement errors. The best fit is obtained for GHz
and , in reasonable agreement with our measurements. When fixing the “Aux” circulator temperature to mK, we obtain a cavity temperature mK, compatible with our expectations. The fit has and is shown by the red line in Fig. 3. Changing in an interval between 150 and 273 mK does not impact the quality of the fit and just reduces the cavity temperature down to about 100 mK in the former case.
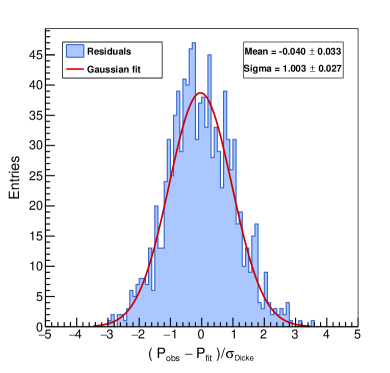
Since the expected axion signal width is of about 10 kHz in the lab frame [11, 41], with a bin width of 651 Hz a power excess is expected in about 16 consecutive bins. We normalize the residuals obtained in the fit procedure to the expected noise power W derived from the Dicke radiometer formula [42] using the system temperature K
| (4) |
where is the integration time. The distribution of the normalized residuals is shown in Fig. 4 together with the result of a Gaussian fit, showing a rms compatible with 1.
To claim a discovery candidate we require that power is in excess of 5 from the noise spectrum, corresponding to some bins in the normalized residuals. Correcting for the look-elsewhere effect, the requirement would be to find excesses greater than , where is the cumulative of the normal distribution and is the number of data bins, corresponding to an effective number of . We did not find any candidate, so we interpret our result as an exclusion test for the axion existence in this mass range. A maximum likelihood approach is used to compute the estimator from the data, with the logarithmic likelihood
| (5) |
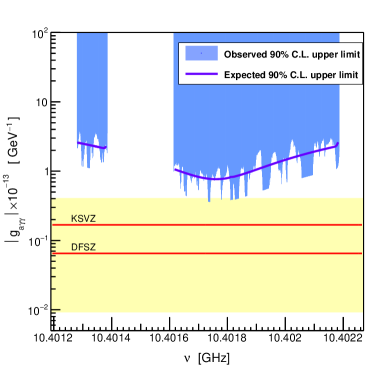
where we have assumed Gaussian statistics. The index runs over bins, are the observed residuals, are the model signals given by Eq. (1) multiplied by Eq. (2) and convoluted with the full Standard Halo Model distribution [41], and W is the most conservative noise power, obtained with the maximum temperature allowed within its error. Note that the rhs of Eq. (5) is a distribution. The estimator is then evaluated by solving , and its error is calculated as . The maximum likelihood procedure is repeated for each axion test mass, precisely times, resulting in a step size of 651 Hz. Finally, we calculate the limit to the axion-photon coupling with a 90% confidence level, power-constraining values of that underfluctuate below [43]. We show in Fig. 5 the limit as a function of the tested axion masses, shown with a colored area, together with a solid purple line showing the expected limit in the case of no signal. The reference upper limit of our search is the value at the maximum sensitivity (the minimum of the purple line of Fig. 5), at 90% C.L.
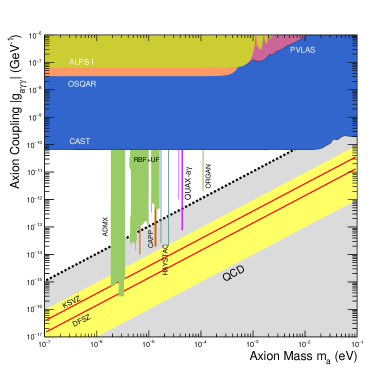
In Fig. 6 we compare the limit that we observed, in a mass window neV centered at the mass eV, with those obtained in previous searches.
IV Conclusions
We report results of the search with a haloscope for galactic axions with mass of about 43 eV in a small frequency region of 3.7 neV. By cooling the system to about 150 mK in a dilution refrigerator and employing a Josephson parametric amplifier with noise at the standard quantum limit, we set a limit on the axion-photon coupling of about a factor 2 from the QCD band. We show directly that, even at a frequency as large as 10 GHz, haloscopes will soon have the sensitivity to observe QCD axions. The total noise, estimated as twice the standard quantum limit, can be further reduced by improving the thermalization of the resonant cavity and the line filtering, and by reducing the noise contribution from the HEMT.
Acknowledgements.
We are grateful to E. Berto, A. Benato, and M. Rebeschini for the mechanical work; F. Calaon and M. Tessaro for help with the electronics and cryogenics, and to F. Stivanello for the chemical treatments. We thank G. Galet and L. Castellani for the development of the magnet power supply, and M. Zago who realized the technical drawings of the system. We deeply acknowledge the Cryogenic Service of the Laboratori Nazionali di Legnaro for providing us with large quantities of liquid helium on demand.References
- Weinberg [1978] S. Weinberg, A New Light Boson?, Phys. Rev. Lett. 40, 223 (1978).
- Wilczek [1978] F. Wilczek, Problem of Strong and Invariance in the Presence of Instantons, Phys. Rev. Lett. 40, 279 (1978).
- Peccei and Quinn [1977a] R. D. Peccei and H. R. Quinn, Conservation in the Presence of Pseudoparticles, Phys. Rev. Lett. 38, 1440 (1977a).
- Peccei and Quinn [1977b] R. D. Peccei and H. R. Quinn, Constraints imposed by conservation in the presence of pseudoparticles, Phys. Rev. D 16, 1791 (1977b).
- Preskill et al. [1983] J. Preskill, M. B. Wise, and F. Wilczek, Cosmology of the invisible axion, Phys. Lett. B 120, 127 (1983).
- Abbott and Sikivie [1983] L. Abbott and P. Sikivie, A cosmological bound on the invisible axion, Phys. Lett. B 120, 133 (1983).
- Dine and Fischler [1983] M. Dine and W. Fischler, The not-so-harmless axion, Phys. Lett. B 120, 137 (1983).
- Irastorza and Redondo [2018] I. G. Irastorza and J. Redondo, New experimental approaches in the search for axion-like particles, Prog. Part. Nucl. Phys. 102, 89 (2018).
- Tanabashi et al. [2018] M. Tanabashi et al. (Particle Data Group), Review of Particle Physics, Phys. Rev. D 98, 030001 (2018).
- Sikivie [1983] P. Sikivie, Experimental Tests of the “Invisible” Axion, Phys. Rev. Lett. 51, 1415 (1983).
- Sikivie [1985] P. Sikivie, Detection rates for “invisible”-axion searches, Phys. Rev. D 32, 2988 (1985).
- Du et al. [2018] N. Du, N. Force, R. Khatiwada, E. Lentz, R. Ottens, L. J. Rosenberg, G. Rybka, G. Carosi, N. Woollett, D. Bowring, A. S. Chou, A. Sonnenschein, W. Wester, C. Boutan, N. S. Oblath, R. Bradley, E. J. Daw, A. V. Dixit, J. Clarke, S. R. O’Kelley, N. Crisosto, J. R. Gleason, S. Jois, P. Sikivie, I. Stern, N. S. Sullivan, D. B. Tanner, and G. C. Hilton (ADMX Collaboration), Search for invisible axion dark matter with the axion dark matter experiment, Phys. Rev. Lett. 120, 151301 (2018).
- Braine et al. [2020] T. Braine, R. Cervantes, N. Crisosto, N. Du, S. Kimes, L. J. Rosenberg, G. Rybka, J. Yang, D. Bowring, A. S. Chou, R. Khatiwada, A. Sonnenschein, W. Wester, G. Carosi, N. Woollett, L. D. Duffy, R. Bradley, C. Boutan, M. Jones, B. H. LaRoque, N. S. Oblath, M. S. Taubman, J. Clarke, A. Dove, A. Eddins, S. R. O’Kelley, S. Nawaz, I. Siddiqi, N. Stevenson, A. Agrawal, A. V. Dixit, J. R. Gleason, S. Jois, P. Sikivie, J. A. Solomon, N. S. Sullivan, D. B. Tanner, E. Lentz, E. J. Daw, J. H. Buckley, P. M. Harrington, E. A. Henriksen, and K. W. Murch (ADMX Collaboration), Extended search for the invisible axion with the axion dark matter experiment, Phys. Rev. Lett. 124, 101303 (2020).
- Backes et al. [2021] K. M. Backes, D. A. Palken, S. Al Kenany, B. M. Brubaker, S. B. Cahn, A. Droster, G. C. Hilton, S. Ghosh, H. Jackson, S. K. Lamoreaux, A. Leder, K. W. Lehnert, S. Lewis, M. Malnou, R. H. Maruyama, N. M. Rapidis, M. Simanovskaia, S. Singh, D. H. Speller, I. Urdinaran, L. R. Vale, E. C. van Assendelft, K. van Bibber, and H. Wang (HAYSTAC), A quantum enhanced search for dark matter axions, Nature 590, 238 (2021).
- McAllister et al. [2017] B. T. McAllister, G. Flower, E. N. Ivanov, M. Goryachev, J. Bourhill, and M. E. Tobar, The ORGAN experiment: An axion haloscope above 15 GHz, Phys. Dark Universe 18, 67 (2017).
- Choi et al. [2020] J. Choi, S. Ahn, B. Ko, S. Lee, and Y. Semertzidis, CAPP-8TB: Axion Dark Matter Search Experiment around 6.7 eV, arXiv:2007.07468 [physics.ins-det] (2020).
- Jeong et al. [2020] J. Jeong, S. Bae, Y. K. Semertzidis, S. Youn, J. Kim, T. Seong, and J. E. Kim, Search for invisible axion dark matter with a multiple-cell haloscope, arXiv:2008.10141 [hep-ex] (2020).
- Melcón et al. [2018] A. Á. Melcón, S. A. Cuendis, C. Cogollos, A. Díaz-Morcillo, B. Döbrich, J. D. Gallego, B. Gimeno, I. G. Irastorza, A. J. Lozano-Guerrero, C. Malbrunot, P. Navarro, C. P. Garay, J. Redondo, T. Vafeiadis, and W. Wuensch, Axion searches with microwave filters: the RADES project, J. Cosmol. Astropart. P. 2018, 040 (2018).
- Arguedas Cuendis et al. [2019] S. Arguedas Cuendis et al., The 3 cavity prototypes of RADES, an axion detector using microwave filters at CAST (2019) arXiv:1903.04323 [physics.ins-det] .
- Barbieri et al. [2017] R. Barbieri, C. Braggio, G. Carugno, C. Gallo, A. Lombardi, A. Ortolan, R. Pengo, G. Ruoso, and C. Speake, Searching for galactic axions through magnetized media: The QUAX proposal, Phys. Dark Universe 15, 135 (2017).
- Crescini et al. [2018] N. Crescini, D. Alesini, C. Braggio, et al., Operation of a ferromagnetic axion haloscope at , Eur. Phys. J. C 78, 10.1140/epjc/s10052-018-6163-8 (2018).
- Crescini et al. [2020] N. Crescini, D. Alesini, C. Braggio, G. Carugno, D. D’Agostino, D. Di Gioacchino, P. Falferi, U. Gambardella, C. Gatti, G. Iannone, C. Ligi, A. Lombardi, A. Ortolan, R. Pengo, G. Ruoso, and L. Taffarello (QUAX Collaboration), Axion search with a quantum-limited ferromagnetic haloscope, Phys. Rev. Lett. 124, 171801 (2020).
- Alesini et al. [2019a] D. Alesini, C. Braggio, G. Carugno, N. Crescini, D. D’Agostino, D. Di Gioacchino, R. Di Vora, P. Falferi, S. Gallo, U. Gambardella, C. Gatti, G. Iannone, G. Lamanna, C. Ligi, A. Lombardi, R. Mezzena, A. Ortolan, R. Pengo, N. Pompeo, A. Rettaroli, G. Ruoso, E. Silva, C. C. Speake, L. Taffarello, and S. Tocci, Galactic axions search with a superconducting resonant cavity, Phys. Rev. D 99, 101101 (2019a).
- Alesini et al. [2017] D. Alesini, D. Babusci, D. Di Gioacchino, C. Gatti, G. Lamanna, and C. Ligi, The KLASH Proposal, arXiv:1707.06010 [physics.ins-det] (2017).
- Gatti et al. [2018] C. Gatti et al., The Klash Proposal: Status and Perspectives, in 14th Patras Workshop on Axions, WIMPs and WISPs (AXION-WIMP 2018) (PATRAS 2018) Hamburg, Germany, June 18-22, 2018 (2018) arXiv:1811.06754 [physics.ins-det] .
- Alesini et al. [2019b] D. Alesini et al., KLASH Conceptual Design Report, arXiv:1911.02427 [physics.ins-det] (2019b).
- Caldwell et al. [2017] A. Caldwell, G. Dvali, B. Majorovits, A. Millar, G. Raffelt, J. Redondo, O. Reimann, F. Simon, and F. Steffen (MADMAX Working Group), Dielectric Haloscopes: A New Way to Detect Axion Dark Matter, Phys. Rev. Lett. 118, 091801 (2017).
- [28] BRASS: Broadband Radiometric Axion SearcheS, http://www.iexp.uni-hamburg.de/groups/astroparticle/brass/brassweb.htm.
- Kenany et al. [2017] S. A. Kenany, M. Anil, K. Backes, B. Brubaker, S. Cahn, G. Carosi, Y. Gurevich, W. Kindel, S. Lamoreaux, K. Lehnert, S. Lewis, M. Malnou, D. Palken, N. Rapidis, J. Root, M. Simanovskaia, T. Shokair, I. Urdinaran, K. van Bibber, and L. Zhong, Design and operational experience of a microwave cavity axion detector for the range, Nucl. Instrum. Methods A 854, 11 (2017).
- Brubaker et al. [2017] B. M. Brubaker, L. Zhong, Y. V. Gurevich, S. B. Cahn, S. K. Lamoreaux, M. Simanovskaia, J. R. Root, S. M. Lewis, S. Al Kenany, K. M. Backes, I. Urdinaran, N. M. Rapidis, T. M. Shokair, K. A. van Bibber, D. A. Palken, M. Malnou, W. F. Kindel, M. A. Anil, K. W. Lehnert, and G. Carosi, First Results from a Microwave Cavity Axion Search at , Phys. Rev. Lett. 118, 061302 (2017).
- Zyla and others [Particle Data Group] P. Zyla and others (Particle Data Group), Dark matter, Prog. Theor. Exp. Phys. 2020, 083C01 (2020).
- Di Gioacchino et al. [2019] D. Di Gioacchino, C. Gatti, D. Alesini, C. Ligi, S. Tocci, A. Rettaroli, G. Carugno, N. Crescini, G. Ruoso, C. Braggio, P. Falferi, C. S. Gallo, U. Gambardella, G. Iannone, G. Lamanna, A. Lombardi, R. Mezzena, A. Ortolan, R. Pengo, E. Silva, and N. Pompeo, Microwave Losses in a DC Magnetic Field in Superconducting Cavities for Axion Studies, IEEE Trans. Appl. Supercon. 29, 1 (2019).
- Ahn et al. [2019] D. Ahn, O. Kwon, W. Chung, W. Jang, D. Lee, J. Lee, S. W. Youn, D. Youm, and Y. K. Semertzidis, Maintaining high Q-factor of superconducting YBa2Cu3O7-x microwave cavity in a high magnetic field, arXiv:1904.05111 [physics.ins-det] (2019).
- Alesini et al. [2020] D. Alesini, C. Braggio, G. Carugno, N. Crescini, D. D’Agostino, D. Di Gioacchino, R. Di Vora, P. Falferi, U. Gambardella, C. Gatti, G. Iannone, C. Ligi, A. Lombardi, G. Maccarrone, A. Ortolan, R. Pengo, C. Pira, A. Rettaroli, G. Ruoso, L. Taffarello, and S. Tocci, High quality factor photonic cavity for dark matter axion searches, Rev. Sci. Instrum. 91, 094701 (2020).
- Alesini et al. [2021] D. Alesini, C. Braggio, G. Carugno, N. Crescini, D. D’ Agostino, D. Di Gioacchino, R. Di Vora, P. Falferi, U. Gambardella, C. Gatti, G. Iannone, C. Ligi, A. Lombardi, G. Maccarrone, A. Ortolan, R. Pengo, C. Pira, A. Rettaroli, G. Ruoso, L. Taffarello, and S. Tocci, Realization of a high quality factor resonator with hollow dielectric cylinders for axion searches, Nucl. Instrum. Methods A 985, 164641 (2021).
- Matlashov et al. [2018] A. Matlashov, M. Schmelz, V. Zakosarenko, R. Stolz, and Y. K. Semertzidis, Squid amplifiers for axion search experiments, Cryogenics 91, 125 (2018).
- Lamoreaux et al. [2013] S. K. Lamoreaux, K. A. van Bibber, K. W. Lehnert, and G. Carosi, Analysis of single-photon and linear amplifier detectors for microwave cavity dark matter axion searches, Phys. Rev. D 88, 035020 (2013).
- Kuzmin et al. [2018] L. S. Kuzmin, A. S. Sobolev, C. Gatti, D. Di Gioacchino, N. Crescini, A. Gordeeva, and E. Il’ichev, Single Photon Counter Based on a Josephson Junction at 14 GHz for Searching Galactic Axions, IEEE Trans. Appl. Supercon. 28, 1 (2018).
- [39] ANSYS HFSS software, https://www.ansys.com/products/electronics/ansys-hfss.
- Roch et al. [2012] N. Roch, E. Flurin, F. Nguyen, P. Morfin, P. Campagne-Ibarcq, M. H. Devoret, and B. Huard, Widely tunable, nondegenerate three-wave mixing microwave device operating near the quantum limit, Phys. Rev. Lett. 108, 147701 (2012).
- Turner [1990] M. S. Turner, Periodic signatures for the detection of cosmic axions, Phys. Rev. D 42, 3572 (1990).
- Dicke [1946] R. H. Dicke, The measurement of thermal radiation at microwave frequencies, Rev. Sci. Instrum. 17, 268 (1946).
- Cowan et al. [2011] G. Cowan, K. Cranmer, E. Gross, and O. Vitells, Power-constrained limits (2011), arXiv:1105.3166 [physics.data-an] .