Unsupervised Behaviour Analysis and Magnification (uBAM) using Deep Learning
Abstract
SUMMARY
Motor behaviour analysis is essential to biomedical research and clinical diagnostics as it provides a non-invasive strategy for identifying motor impairment and its change caused by interventions. State-of-the-art instrumented movement analysis is time- and cost-intensive, since it requires placing physical or virtual markers. Besides the effort required for marking keypoints or annotations necessary for training or finetuning a detector, users need to know the interesting behaviour beforehand to provide meaningful keypoints. We introduce unsupervised behaviour analysis and magnification (uBAM), an automatic deep learning algorithm for analysing behaviour by discovering and magnifying deviations. A central aspect is unsupervised learning of posture and behaviour representations to enable an objective comparison of movement. Besides discovering and quantifying deviations in behaviour, we also propose a generative model for visually magnifying subtle behaviour differences directly in a video without requiring a detour via keypoints or annotations. Essential for this magnification of deviations even across different individuals is a disentangling of appearance and behaviour. Evaluations on rodents and human patients with neurological diseases demonstrate the wide applicability of our approach. Moreover, combining optogenetic stimulation with our unsupervised behaviour analysis shows its suitability as a non-invasive diagnostic tool correlating function to brain plasticity.
Unsupervised Behaviour Analysis and Magnification (uBAM) using Deep Learning
Authors: Biagio Brattoli1⋆, Uta Büchler1⋆, Michael Dorkenwald1, Philipp Reiser1, Linard Filli2,3, Fritjof Helmchen4,5, Anna-Sophia Wahl4,5,6⋆, Björn Ommer1⋆†
Equal first and last authorship
Affiliations:
1Interdisciplinary Center for Scientific Computing & Heidelberg Collaboratory for Image Processing, Heidelberg University, Germany.
2Department of Neurology, University Hospital and University of Zurich, Zurich, Switzerland.
3Spinal Cord Injury Center, Balgrist University Hospital, Zurich, Switzerland.
4Brain Research Institute, University of Zurich, Zurich, Switzerland.
5Neuroscience Center Zurich, Zurich, Switzerland.
6Central Institute of Mental Health, Heidelberg University, Mannheim, Germany
Correspondence to:
Björn Ommer (ommer@uni-heidelberg.de)
Official article: At Nature Machine Intelligence https://rdcu.be/ch6pL
KEYWORDS
Unsupervised behaviour analysis; deep learning; computer vision; artificial intelligence; sensorymotor behaviour and recovery; automatic quantification and diagnostics of sensorymotor deficits
INTRODUCTION
Motor behaviour, i.e. the dynamic change of posture, is the visible result of elaborate internal processes. The precise analysis of motor behaviour and its deviations, consequently, constitutes an essential, non-invasive diagnostic strategy1 in many fields ranging from biomedical fundamental research on animals to clinical diagnosis of patients. Behaviour is the output of coordinated internal processes of the brain including the planning and fine tuning of movements in higher brain regions, trans-ducting the signal to the spinal cord and converting it to an orchestrated muscle activation for complex movements.
A detailed analysis of skilled behaviour and its impairment is, therefore, crucial for the neuroscientific understanding of brain (dys-)function. Moreover, the objective quantification of motor impairment in patients is not only valuable to detect and classify distinct functional deficits. It can also serve as basis for individually optimised treatment strategies2. Videos of behaviour recorded during the long-term recovery after neurological diseases provide an easily available, rich source of information to evaluate and adjust drug application and rehabilitative treatment paradigms.
The main bottleneck in behavioural studies is presently that all analysis of skilled motor function depends on a time-intensive, potentially subjective, and costly manual evaluation of behaviour: Behaviour analysis has so far mainly relied on reflective physical markers placed on body joints 1, 3, 4, 5 or on tracking manually labelled virtual keypoints in video recordings of behaviour 6, 7, 8, 9, 10, 11. However, placing physical markers can be tedious and distracting, especially when working with animals. In contrast, virtual keypoints are beneficial due to their non-invasiveness, but they require substantial effort for keypoint annotation. To avoid labelling every video frame, machine learning has been employed to automatically track body-parts12, 9, 10, 11, 13. For example, DeepLabCut12 has been successfully applied to different experimental settings. Mathis et al.14, 15 show how this algorithm can be utilised for different species and behaviours. However, applying a keypoint model to novel datasets requires fine-tuning based on extra manual annotation for the specific data. Where such manual annotation is not an issue or for data for which existing models already work sufficiently well, keypoint approaches offer a simple and effective solution. This is also reflected by the recent work in the computer vision community on keypoint based models for animal posture estimation 16, 17 or on keypoint-based inference of three dimensional human body models that is not generic in its applicability to other species 18, 19, 20, 21, 22. However, the great benefit of simplicity of a posture representation based on keypoints limits a detailed analysis of arbitrary novel, e.g. impaired, behaviour: A detailed representation of a priori unknown body movements requires trained keypoints for almost every body joint, which presents an impracticable effort to supervised training. Therefore, users have to limit the keypoints to a predefined feasible subset. We argue that this introduces a problem: to select the optimal keypoints for a detailed analysis, the user needs to know what the behaviour of interest is before applying the posture detection. However, a true diagnostic tool should discover and localise deviant behaviour, rather than only confirm it. Consequently, there is a human annotator bias: the behaviour analysis is restricted to the keypoints that a user has decided for and different annotators may favour different points. Thus, it is missing features that may be relevant to fully characterise motor behaviour and draw appropriate conclusions on underlying neuronal mechanisms. Several recent works on behaviour analysis also confirm these drawbacks of using a parametric model, such as the loss of information 23, and, thus, propose approaches using non-parametric models that avoid the aforementioned prior assumptions on the data 23, 24. Compared to their method, our model is also able to compare behaviour across different subjects and over time, moreover we can identify and visually magnify the movement deviation between subjects.
We propose a fully automatic, unsupervised diagnostic support system for behaviour analysis that
can discover even subtle deviations of motor function. The approach not only extracts and classifies behaviour 25, 24, but it can also compare and quantify even small differences. Neither analysis of novel video sequences nor training of the underlying deep neural network require physical markers or supervision with tedious keypoint annotations.
This avoids a user bias of having to select appropriate keypoints for training a keypoint model and also supports an objective analysis.
Our approach automatically discovers characteristic behaviour, localises it temporally and spatially, and, above all, provides a behaviour magnification that not just highlights but also amplifies subtle differences in behaviour directly in the video: Given a novel video sequence, the approach can automatically compare the behaviour against reference videos showing healthy or impaired behaviour of other individuals, since it is invariant to inter-subject variations in appearance. Also, behaviour can be contrasted against previous videos of the same individual during a recovery process to identify the fine differences. Behaviour magnification then uses a generative neural network to synthesise a new video with the subtle deviations between healthy and impaired being amplified so they become clearly visible.
Key to our model is a disentangling of posture and appearance for image synthesis to amplify only the deviations in behaviour across individuals despite differences in appearance.
We assume a clinical or research setting with static background and controlled recording. Disentangling should not merely separate moving from static image regions. Otherwise we would merge non-moving body parts with the background, hindering analysis and magnification across different subjects. Rather we need to learn the commonalities of reference behaviour across different subjects and disentangle this from their individual deviations in appearance.
Our algorithm is promising for diverse applications in the field of biomedical research and was evaluated on rodents and human patients with disease models such as stroke and multiple sclerosis.
Our uBAM (unsupervised behaviour analysis and magnification) interface is freely available online and interactive demos are provided on
https://utabuechler.github.io/behaviourAnalysis/.
UNSUPERVISED METHOD FOR BEHAVIOUR ANALYSIS AND MAGNIFICATION
Here, we first discuss our two main methodological contributions with their possible applications: a neural network for comparative analysis of behaviour and one for magnification of differences in behaviour.
0.1 A Convolutional Neural Network for Comparing behaviour
To train a model for an objective behaviour analysis, an unsupervised learning procedure (Fig. 1) is crucial to circumvent tedious annotations and an annotator bias. The challenge is to learn a representation that can compare similar behaviour across individuals despite their difference in appearance (discussed subsequently in Fig. 2a,b). We present a deep neural network that extracts the characteristic behaviour from a video sequence without any user intervention (Fig. 1a). To train this model, we propose a surrogate task, based on 26, 27, 28, 29, where the network learns to distinguish a behaviour sequence from the same sequence with frames randomly permuted by a permutation (Fig 1b). Solving this auxiliary task requires the network to learn a representation of posture and its temporal dynamics, the behaviour . We test our posture and behaviour representation qualitatively in Fig. 2a,b and quantitatively in Supplementary Tables 1-4. Moreover, our prior work26 provides an evaluation of the proposed learning strategy from a computer vision perspective by also testing on several standard human posture benchmarks.
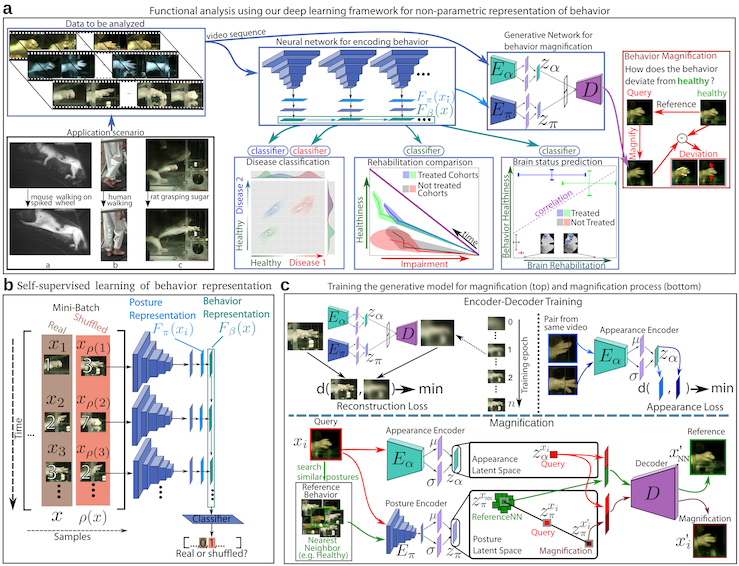
0.2 A Generative Neural Network for Behaviour Magnification
True diagnostics requires not only to discover and quantify impairment. The user also needs to understand how a behaviour deviates from some reference behaviour (e.g. healthy) to interpret the symptoms and actually understand the disorder. Thus, small deviations in behaviour that might easily be overlooked need to be magnified.
Existing methods on video magnification have mainly addressed the magnification of small motions 30, 31, 32, 33, 34, 35, 36, 37, 38 or the deviation from a predefined reference shape 39, but only within the same video 31, 30. We propose an approach for magnifying differences in behaviour even across individuals (Fig. 1c). To ease interpretation for the user, we amplify characteristic differences directly in the query video by altering its individual frames to magnify their deviation in posture from the reference. This requires to re-synthesise one subject with the appearance of another to enable a direct visual comparison of their posture (Fig. 2c) and to visually amplify the differences (discussed subsequently in section Behaviour magnification). Generative models have been very successful in image synthesis. However, standard generative models (VAE40, GAN41) in their basic form lack the ability to disentangle aspects that need to be magnified (characteristic deviations in posture) from those that should not be altered (appearance).
Therefore, we need a model that learns directly on videos of reference subjects to disentangle42 posture from appearance (for details see Methods). A suitable generative model should be able to combine any posture and appearance pairs and reconstruct a new image even if this specific combination does not exist in the dataset. In Extended Data Figure 1, 2 and 3, we compare our method with previous magnification methods.
Our unsupervised posture representation (previous section) is key for the disentanglement since it extracts a posture representation not biased by the appearance and is used to produce where is a linear layer. The trained model can then be applied to amplify behaviour deviation of a novel query sequence against reference videos (see Method).
EXPERIMENTAL EVALUATION
In this section, we evaluate our uBAM framework on different species and tasks, from subject rehabilitation to brain status correlation.
0.3 Experimental Setup for Benchmarking.
We evaluated our framework on three different species studying diverse motor functions (Fig. 1a left). Videos were recorded using a single consumer camcorder to demonstrate the low-cost and simple applicability of our approach to behaviour analysis. In Supplementary we describe the acquisition process.
Firstly, we analysed the recovery of impaired forelimb function in a rat stroke model where a stroke partially destroyed the sensorimotor cortex in one hemisphere. The resulting impact on skilled motor function was assessed in several animals grasping for a sugar pellet through a small opening. The animals were randomised in four different treatment groups (see Supplementary). Recordings (50 frames/sec, consumer camera) have been taken during the initial training of the animals before stroke and during recovery, which lasted up to 5 weeks after stroke.
Secondly, we trained mice to run on a wheel with irregular rung distance while being head-fixed. Animals were recorded (100 frames/sec with an infrared camera) before and after triggering a stroke which compromises their ability to precisely target the rungs of the wheel.
Thirdly, healthy human subjects and patients with different neurological disorders were recorded while walking on a treadmill. Patients with multiple sclerosis (MS) and hydrocephalus (HC) were analysed. MS subjects receiving a dose of fampyra and hydrocephalus patients with lumbar puncture were filmed with a standard consumer video-camera on the treadmill again 24h after the treatment. Both are routine interventions in the clinical setting and have been associated with improvements of ambulatory function43, 44, 45.
0.4 Evaluation of Behaviour Encoding.
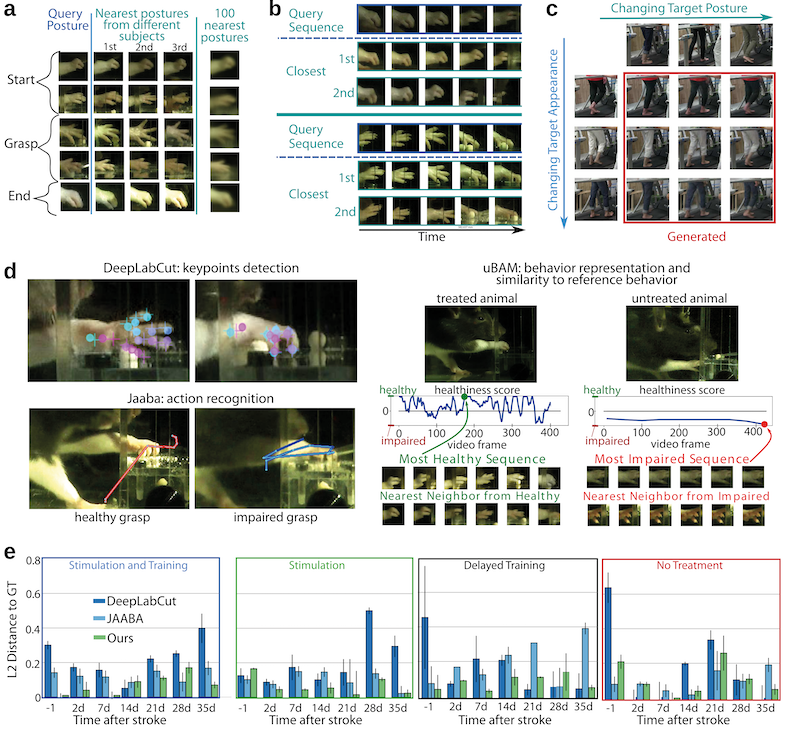
We first evaluated the capability of our learned representation (Fig. 1b, Extended Data Figure 1 and Supplementary Figure 1) to compare postures and behaviour sequences across different individuals. Therefore, we use the posture encoder to measure the similarity between a query frame and frames from videos showing other rats grasping for a sugar pellet. Fig. 2a presents the three nearest neighbours and an average over the hundred closest samples. Evidently, despite variations in appearance, similar postures are identified (see Supplementary Tab.1 for additional evaluation on the posture representation). In Fig. 2b for a query sequence, sub-sequences with similar behaviour are extracted from the videos of other rats. In Extended Data Figure 4 we compare our posture representation against a classical projection method.
0.5 Invariance to Appearance Variation.
Next, we investigated the invariance of our posture representation against appearance changes. Based on both disentangled encodings, and , we utilise our generative network from Fig. 1c to extract the posture from a frame and synthesise it with the appearance of another individual. Fig. 2c shows that posture is correctly preserved along columns and appearance along rows. This clearly demonstrates that the approach can analyse posture across individuals despite strong variations in appearance, which is also key to behaviour magnification (see also Extended Data Figure 6).
0.6 Comparing Against Keypoint-based Methods.
We compared two currently popular approaches for supervised, keypoint-based behaviour analysis (Fig. 2d), DeepLabCut12 and JAABA 25, against our approach which requires no posture annotation.
Fig. 2e shows the results of all three approaches on video data of rats grasping a sugar pellet. The data includes four cohorts of rats undergoing different rehabilitative treatments during a 35-day long recovery. Each bar in Fig. 2e represents the error from ground truth provided by experts (see Methods). In Extended Data Figure 8, we compare our representation with a state-of-the-art deep neural network specific for action recognition46.
The results produced by our model have a correlation of with the ground truth scores annotated by neuroscientists. Results from JAABA and DeepLabCut are and , respectively. The analysis shows that, compared to keypoint-based methods, our non-parametric model can extract more detailed information necessary for a fine-grained study of motor function, while avoiding tedious manual annotations.
0.7 Behaviour-based Classification of Diseases
Next, we evaluated the capability of our approach to distinguish different diseases solely based on behaviour analysis. As in the previous paragraph we also trained a linear discriminative classifier to distinguish healthy from impaired sequences. On the test data we obtained an accuracy of for the mice (intact vs. stroke) and for the humans (healthy vs. hydrocephalus/MS).
Furthermore, Fig. 3a shows our unsupervised behaviour representation from Fig. 1b directly mapped onto two dimensions using t-SNE 47 for the dataset of mice running on the wheel. Without any annotation of impairment during training, the behaviour encoding still captures important characteristics to separate healthy from impaired.
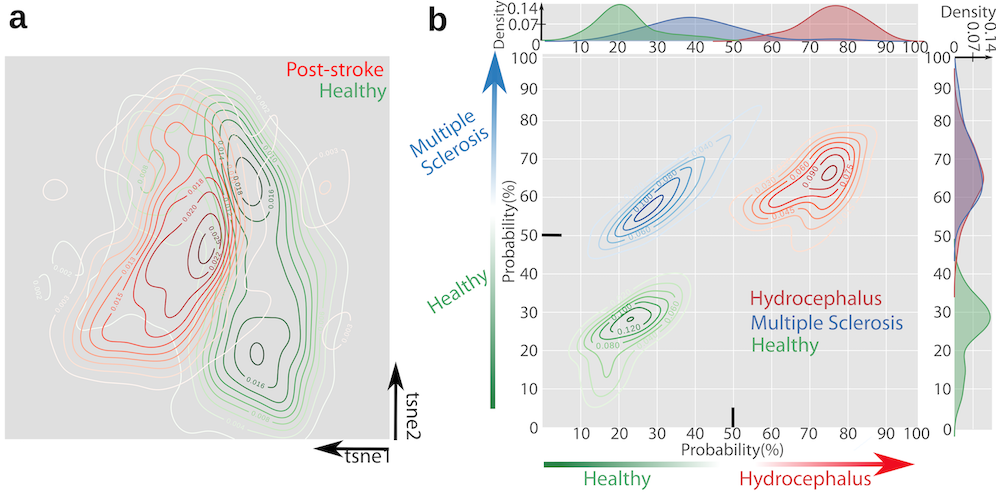
Moreover, we studied whether our approach can distinguish different diseases from another (Fig. 3b). As beforehand, for the human gait data we employ classifiers on top of our behaviour representation. Based on gait we train one classifier to recognise patients with MS and another for patients with hydrocephalus. The successful separation of the different behaviours by a simple linear classifier is only possible due to the detailed behaviour encoding extracted by our approach.
0.8 Visualising the acquirement of skilled motor function
Our approach can also quantify and visualise the subtle changes in behaviour while animals learn to perform skilled motor function, such as rats learning to grasp a sugar pellet through a slit. Fig. 4a (top) compares the grasping during 31 days of learning against the skilled behaviour acquired at the end of training, which serves as reference. Additionally, we can identify for each time point of learning how the behaviour differs from the reference: the posture representation allows to spot postures (rows in Fig 4a bottom) that are substantially over-represented in contrast to the skilled reference (red) as well as the ones that are missing (blue) at each point in time. Here the postures are mapped from the multidimensional to 1D on the y-axis using t-SNE. The result shows that non-grasping postures (bottom) are more frequent in early stages, while grasping postures (top), which precisely target the sugar pellet, are unlikely. During learning, the posture distribution then converges to the skilled reference.
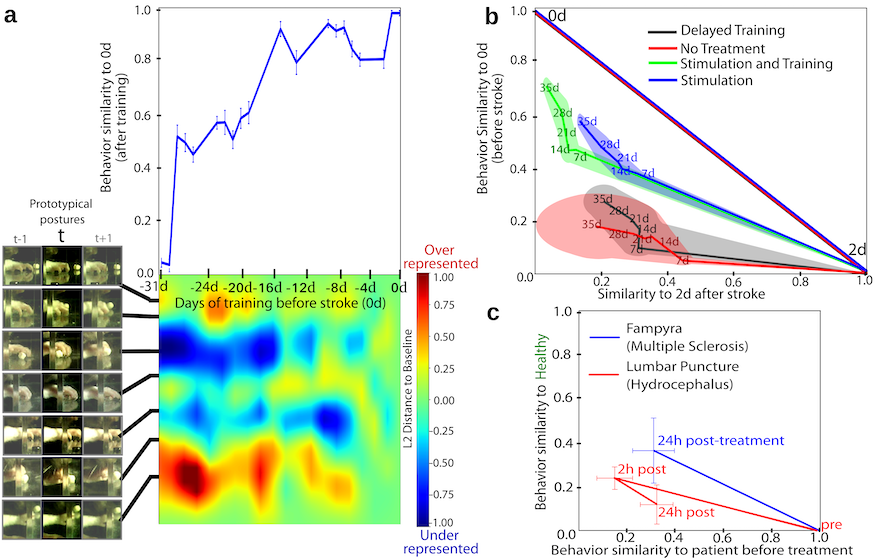
0.9 Behaviour-based Evaluation of Different Therapies
Next, we compared different therapies after stroke by measuring the change in behaviour they cause in the grasping task. Fig 4b shows the similarity per rat cohort to a healthy baseline (y-axis) and to immediately post-stroke (x-axis) for each week of recovery. The cohorts with optogenetic stimulation of the intact pyramidal tract (”brain stimulation” groups in green, blue) steadily improve during rehabilitation, reaching around similarity to the baseline behaviour and having almost no similarity (green , blue ) with the post-stroke behaviour. In contrast, groups with no treatment or only rehabilitative training in the grasping task reveal behaviour that is similar to neither reference (), suggesting an inadequate compensation differing substantially from true recovery of impaired function.
Fig 4c depicts gait improvement for patients after a disease specific treatment as similarity to pre-treatment (x-axis) and to behaviour of healthy subjects (y-axis). Fampyra, a reversible potassium channel blocker applied over a period of 14 days (2x10mg per day) yields a substantial improvement on the walking function of MS patients. Lumbar puncture leads to a major improvement within the first 2 hours for patients affected by hydrocephalus - an effect that only initially lasted for 2h due to the reduction in cerebrospinal fluid pressure.
The experiments show the behaviour encoding to be an effective tool for both, to compare different therapies after a disease and to diagnose the resulting changes in motor function.
0.10 Analysing Relations Between Behaviour and Neuronal Rewiring
Our behaviour representation is sufficiently sensitive to discover a correlation between restoration of behaviour and cortical rewiring in the impaired motor cortex.
For each treatment cohort (from Fig. 4b), Fig. 5a compares the degree of recovery by comparing the behaviour 35d post stroke against the healthy pre-stroke baseline. In addition, we counted out-sprouting nerve fibers (BDA positive, see Methods) in the peri-infarct cortex post mortem as a characteristic of plastic rewiring processes in the impaired hemisphere which are influenced by the post-stroke treatment. The plot shows a significant correlation of between our measured behaviour changes and the degree of neuronal fiber sprouting in the perilesional cortex. Hence, our non-invasive behaviour analysis is discriminative enough to provide a measurement of the degree of recovery for impaired motor function that relates to the underlying subtle neuroanatomical modifications in the brain.
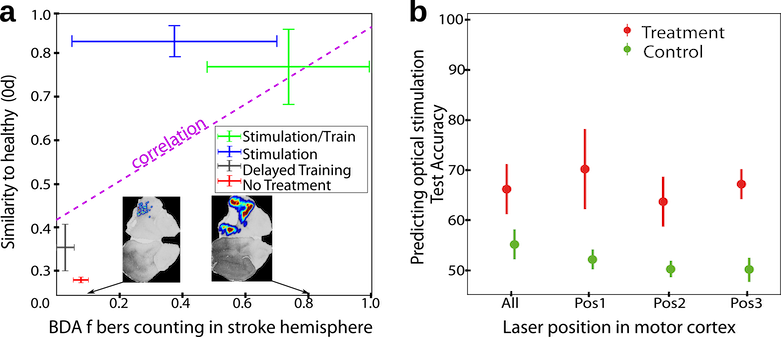
0.11 Simultaneous Optogenetic Stimulation and Behaviour Analysis
Optogenetics allows to reversibly deactivate cortical circuits in-vivo. We expressed the optical neural inhibitor ArchT in a subset of corticospinal projecting neurons in rats and compared their grasping skills with and without light-induced silencing of these distinct neurons. Control animals were treated in the same way, however lacked the expression of the neuronal silencer ArchT. Extended Data Figure 10 shows a grasp example for light on and light off selected using our classifier. As expected, the classifier (Fig. 5b) only performs at chance level for controls and is substantially better ( test accuracy per grasp) discriminating light-perturbed behaviour in animals expressing ArchT in parts of the pyramidal tract. Only for these it can recognise the light-driven modification of specific motor functions. Since such altered behaviour is not present in every try of a grasp, the goal had to be a substantial improvement over control, but not finding differences in every grasp. In fact, depending on the potency of the inhibitory opsin used and the specific neurons being silenced, optogenetic inhibition may not alter behaviour in every trial due to many compensating mechanisms. This effect for the opsin ArchT which we used here was also found by other groups in other contexts 48, 49, 50.
0.12 Behaviour Magnification
Finally, we tested our behaviour magnification as a diagnostic tool to discover variations in posture between a query and reference posture. The results demonstrate that differences barely visible between query and reference are correctly magnified by our model and can be spotted and understood more easily with the help of our highlighting and magnification. Notice that our approach does not magnify arbitrary deviations caused by differences in appearance or normal posture variations, but only those due to impaired behaviour as analysed in Extended Data Figure 2 and 3.
Consequently, our behaviour magnification can extend medical diagnostics to reveal deviations due to impairment that even the trained eye might overlook. For example, the first subject in Fig. 6b seems to show no impairment during the step, however the magnified posture reveals that the left steps are too short compared to the healthy references. The second subject has no problems with the right step, but shows difficulties in keeping the left leg straight at the beginning of the left step. The magnification in Fig. 6c reveals that the rats have especially problems with the correct supination of the paw when approaching the sugar.

DISCUSSION
A detailed analysis of motor behaviour and its impairment is crucial as a basis for understanding neural function. Current methods represent behaviour as trajectories of keypoints, thus reducing complex motor kinematics to few points that must be provided beforehand. Rather than supporting users with an automatic discovery of deviant behaviour, users need to know its characteristics before performing the analysis to define it in terms of keypoints.
We present a self-supervised deep learning approach for training a convolutional neural network that provides a fully automatic, unsupervised diagnostic behaviour analysis. A second generative network helps to interpret this analysis by magnifying characteristic differences in behaviour even across individuals. The method is provided as an open source software package called uBAM.
A possibly limiting factor of our method is the requirement of a controlled recording environment: the camera view should be roughly the same across subjects and the background mostly static. We believe these constraints to be reasonable for biomedical research and common in the lab and clinical practice. Nevertheless, our videos feature some changes in the camera viewpoint and contain other moving objects (e.g. nurses in the human data), thereby proving our model to be robust to small changes.
In order to retrieve an evaluation focused solely on the impaired subject, our model utilises a pre-processing step for extracting the corresponding region-of-interest. For our experiments we utilised simple techniques that proved to be robust in the standard clinical and lab setting. However, since our approach is independent from this pre-processing, the user is free to utilise other, potentially even supervised detection methods for their data.
This paper focused solely on analysing the behaviour of individual subjects. A further extension to study the interaction of multiple subjects would have wide applicability25, especially when investigating animal social behaviour. Moreover, it would be interesting to analyse the relation of behaviour to complex brain activity in vivo across diverse brain areas, rather than only in selected subareas of the motor cortex.
Our method is not meant to completely eliminate key-point based methods, but it rather is of complementary nature. Besides being feasible where physical markers would not or where training virtual markers is too costly, our approach can discover deviant behaviour, which is challenging with user-defined key-points that would require the relevant body-parts to be known and chosen before the actual diagnosis. After using our model for discovering the affected body-part(s), the user can complement the analysis by incorporating further studies based on virtual markers which are optimised for the affected body-parts.
Combined behaviour analysis and magnification together provide a powerful, non-invasive approach to not only support a biomedical diagnosis, but also to aid its interpretation. Moreover, due to the learned invariance to appearance differences, behaviour can be objectively compared across individuals. We believe that the proposed efficient, unsupervised, keypoint-free behaviour analysis provides a generic foundation to explore diverse novel applications in the field of biomedical research, non-invasive diagnostics, and beyond. The proposed system can assist in vivo biological experimentation and has the potential to support a better understanding of neuronal processes in the brain, their degeneration, and to discover new treatments.
METHOD DETAILS
0.13 Encoding the Behaviour Representation.
We propose a non-parametric model to extract the essential information for representing behaviour necessary for several biomedical analysis tasks (Fig. 1a middle). This deep neural network based encoding is trained using our unsupervised process summarised in Fig. 1b. Through a surrogate task we circumvent the need for manually annotated labels. For each sequence of frames , a sequence is constructed by random permutation of the frames. The network is trained to distinguish between real and permuted sequence. Solving this surrogate task, i.e. identifying the real sequence, allows the network to learn the correct execution of a movement, which is defined by the change of posture over time (behavior). Moreover, to solve the surrogate task, the network needs to ignore the appearance within frames because every frame in a sequence has the same appearance as the frames in a shuffled sequence , thus appearance is not a discriminative characteristic between the two sequences. Keeping information about appearance can only hurt the model, so the network learns to be invariant to that. On the other hand, given that nearby frames and can have only slightly different postures, the network needs to learn a fine-grained posture representation to predict the order of two consecutive frames. The network trained using our surrogate task produces then a posture encoding and behaviour encoding used in our experiments. Our model is trained on unlabelled videos from both healthy and impaired subjects. Therefore, as shown in Fig. 2a,b, the learned representation is invariant to inter-subject differences in appearance and can be employed for different types of impairment. On top of this encoding we can now train simple classifiers to recognise impaired behaviour, to distinguish different diseases from another (Fig. 3), and to measure the degree of recovery during rehabilitation (Fig. 4). These downstream classifiers are superimposed on top of our unsupervised behaviour representation and only utilise video meta information (such as time after stroke), but no manual annotation.
Architecture for Behaviour Representation. Our unsupervised training algorithm is independent from the underling network architecture, allowing to easily change architectures. We use AlexNet51 because it performs relatively well on diverse tasks and is fast to train with a single GPU. Further information can be found in the Supplementary material.
Unsupervised Training of the Generative Model. Behaviour magnification demands an approach for image generation that learns to alter posture independently from appearance. The most popular generative models are currently Generative Adversarial Networks (GANs), since they can produce very realistic images. However, GANs are not suited for magnification because they synthesise new images starting from a random vector instead of an input image. Therefore, we base our model on the autoencoder52 (AE) which reconstructs the image given as input to the network. An AE encodes the image into a low dimensional embedding which is then decoded back to the pixel space. However, a classical AE does not explicitly disentangle appearance and posture. Hence, we propose our AE composed of two encoders and to describe a frame by the appearance and posture of the subject shown in . and encode the image into the low dimensional space and , respectively. Given the two encodings, the decoder is used to reconstruct the input frame and outputs the reconstruction (Fig. 1c top-left). To produce realistically-looking images, our model is trained by minimising the reconstruction loss , which computes the distance between synthesis and the input image with being a standard perceptual loss53, i.e. based on VGG pre-trained on ImageNet. We found empirically that the perceptual loss produces sharper images in contrast to the pixel-wise L2 loss. As a side note, it has been shown that, in some cases, perceptual loss might introduce artefacts in the generated images given by the different distributions between source (ImageNet) and target data 48. However, we did not experience such artefacts on our generated images.
Additionally, we introduce a variational factor40 into our generative model, which has been proven to be beneficial for improving the visual quality40. During training, the encoder outputs the mean and standard deviation (std) for a normal distribution , from which the encoding vector is sampled for synthesising the image. To guarantee the sampling distribution to be normal, the Kullback–Leibler distance between encoder output and normal distribution is minimised.
We enforce the disentanglement of posture and appearance by introducing two additional training objectives that determine each encoder. We leverage the posture encoder from the surrogate task to produce the encoder of the generative model. is learned beforehand using our unsupervised behaviour representation (Fig. 1b) which assures the encoding to only retain posture information. Nevertheless, a linear mapping is needed to incorporate into the generative model for two reasons: reducing the dimensionality to create the bottleneck effect typical of auto-encoders; and to learn to describe a gaussian distribution through the KL-loss. Thus, we define by applying a linear layer on top of our posture representation to produce a posture encoder for disentangling appearance from posture. While the representation is fixed during the VAE training, the linear layer is trained with the reconstruction loss and . For the appearance encoder we propose the appearance loss with and two frames from the same video thus having the same appearance. This loss ensures a similar appearance encoding despite differences in posture between the two frames (Fig. 1c top-right).
Combining the above losses yields the following training objective for our generative model,
| (1) |
where and are free parameters, with in our experiments. The details of the autoencoder architecture can be found in the Supplementary material.
Evaluating the Disentanglement of Posture and Appearance. After training, we evaluated the ability of the generative model to combine appearance and posture from different subjects, which lays the foundation for cross-subject behaviour magnification and comparison. Fig. 2c presents the resulting synthesis when combining the appearance of row with the posture from column to generate . The results in Fig. 2c show that our model can transfer appearance from a subject to another, generating clean and realistic images. This is possible only if appearance and posture are correctly disentangled. In Extended Data Figure 6, we compare our method against a baseline approach, showing that disentanglement is a complex task, especially when posture annotations are not available.
Magnification Process. Using our disentanglement process, we can now magnify characteristic deviations in behaviour without altering the appearance. As visually depicted at the bottom of Fig. 1c, we magnify the deviation between a posture of a query frame and a reference posture using linear extrapolation (black line in Fig. 1c connecting , and ) to obtain the magnification ,
| (2) |
where is a predefined parameter. For high (e.g. ), the network starts to produce unrealistic images, since this extrapolation is leaving the space of realistic postures. Thus, there is no risk of introducing new behaviour because the outputs for too large are obviously unrealistic images. On the other hand, too small (e.g. ) will not amplify the deviation enough to be useful for the user. We found to be a good compromise in all our experiments. , the average posture of reference (e.g. healthy) behaviour is computed as the mean over the nearest neighbours of in the posture encoding space given all reference frames. Using the nearest neighbours guarantees that the reference posture is related to the query posture, e.g., both arise from a left step or both from a right step. The magnified image (bottom right of Fig. 1c) is produced by the decoder using the magnified posture and the appearance encoding . The magnified image and reference differ in appearance, since they show different subjects. To facilitate the visual comparison, we re-synthesise a reference with the appearance of the impaired subject and the posture of the reference (as in Fig. 2c). Fig. 6 shows several examples comparing humans (b) and rats (c) to their healthy references. The deviation between the impaired posture (second row) and the healthy reference (first row) is magnified (third row) for each frame. The differences to the healthy reference is measured (fourth row) and localised per pixel by highlighting the magnitude of deviation (fifth row) and its direction (sixth row). In Extended Data Figure 3, we measure the differences between an original frame and its magnification. The differences are consistently larger for impaired patients than for healthy subjects (two sided t-test, p=). For comparison, we perform the same evaluation using the motion magnification method of Oh et al.30. The p-values of indicates that this method magnifies healthy and impaired behaviour indiscriminately.
Intuitively, the reader could think that performing any of the previous experiments on the magnified sequences should provide even better healthy-impaired comparison. However, this is practically not the case since the small deviations are already detected by our behaviour representation which is sensitive to fine-grained postures changes. Therefore, using magnified sequences for our behaviour analysis procedure produces similar results as without.
0.14 Comparison with Key-point Based Approaches.
The evaluation in Fig. 2e compares our learned behaviour representation against two established methods on behaviour analysis.
Given the object location, JAABA extracts hand-crafted features from the video, such as locomotion and appearance. DeepLabCut (DLC) extracts keypoints after being trained on 1500 manually annotated frames of our rat dataset, which were randomly drawn across subjects pre and post stroke. By contrast, our approach has learned a non-parametric representation to measure similarity of motor behaviour. We then obtain an estimate of impairment of a query by comparing its similarity to healthy and impaired sequences. Each approach is trained to distinguish healthy and impaired sequences using the same training data and evaluated on held out test data. Extended Data Figure 7 shows how the number of annotated frames influences the performance of DLC. The features are based on 14 keypoints (see Supplementary). In Extended Data Figure 9, as complementary experiment, we compare DLC and our representation on the keypoint detection task.
Per day of rehabilitation, each grasping sequence needs to be classified as healthy or impaired by a classifier which is trained for the respective method. Since we do not have labels for each grasping sequence, but only for the entire video, this is considered a ”weak” supervision in machine learning. Moreover, we do not know the level of impairment of each animal a priori.
In Fig. 2e we utilise the Whishaw skilled reaching rating scale 54 which is a standard method to manually quantify grasping behaviour. This manual annotation technique scores several movement types of the paw (for example, pronation and supination) during the grasp, providing a complete, but tedious, analysis of grasping behaviour. Fig. 2e compares our automatic scoring with the Whishaw score by means of correlation and Euclidean distance between the two scores. In parallel, we also compare DLC and Jaaba against the same manually annotated Wishaw ground-truth scoring.
The training set is composed of sequences from pre-stroke videos (healthy) and from two days post-stroke videos (impaired). The trained classifiers then predict the healthiness for each grasping sequence on a separate test set of sequences. For each day, we computed the relative number of sequences predicted as healthy. Fig. 2e presents the difference between this predicted frequency and the ground-truth frequency of healthy grasps per day. The correlation of our model with the ground-truth is , whereas Jaaba and DeepLabCut achieve and , respectively.
Similarly to our method, JAABA uses appearance features, which boost the performance compared to a keypoints-only approach. However, JAABA features and classification are based on classical, shallow approaches, whereas our representation is learned end to end.
More information on this experiment are provided in Supplementary, ”Protocol for evaluation and comparison with DLC and Jaaba”.
0.15 Behaviour Analysis.
In this section, we describe the experiment in Fig. 3 and 4.
Unsupervised Classification of Impairment based on Behaviour. We extracted the embedding for each sequence in the mice on wheel dataset. Each high-dimensional embedding ( dimensions) was projected into a 2D plot (Fig. 3a) using tSNE47 for dimensionality reduction, which retains the pair-wise distances between sequences. For pre- and post-stroke recordings, kernel density estimation (scikit learn implementation55) produces the two separate distributions shown in Fig. 3a. Being trained without supervision, the embedding still captures characteristic features to provide a favourable separation. A linear classifier achieves an accuracy of on left-out test data confirming the visible separation in Fig. 3a. The analysis of the mice dataset is limited to a binary classification because the mice subjects did not undergo a rehabilitation process (only pre and post stroke recordings are available). Our subsequent evaluation focused on rats and humans, where the data for more fine-grained tasks is available.
Measuring the Similarity of Motor Behaviour. For all the experiments involving behaviour similarity shown in Fig. 3 and 4 we utilised a linear classifier to distinguish the impaired sequences from healthy. The parameters of the classifiers are optimised using Linear Discriminative Analysis (LDA) 56 (scikit-learn55 implementation). LDA is, in contrast to support vector machines, more suitable for measuring similarities due to its generative properties. During inference, we computed the classifier score as a measure of impairment or healthiness for every recorded sequence , excluding the training set. We then compute a single score per video by averaging the scores over all sequences of that video. We then computed the behaviour similarity between a reference (e.g. before stroke) and a query (e.g. 7 days after stroke) behaviour by calculating the overlap of the score distributions given all videos of the corresponding behaviours. Fig. 3 and 4 report the similarity of query to reference behaviour as the percentage of overlap between their score distributions. For clarification, let us assume scores close to 1 indicating healthy and close to 0 impaired. The scores of the sequences before stroke are expected to be close to 1 and of behaviour 7 days after a stroke close to 0 apart from some outliers. Therefore, the two score distributions are unlikely to overlap, thus indicating a high dissimilarity in behaviour.
Fig. 4a and 4b show the similarity of motor behaviour on the rat data. In Fig. 4a we compare every day of training (-31d until -1d) against acquired skilled behaviour (0d). The classifier is trained on -31d against 0d with sequences each. We infer the score for all sequences and normalise all scores between and (min-max normalisation). Then, in order to produce a final score per day of training, we average the scores of all sequences belonging to that day. These final scores are then shown in Fig. 4a-top. For analysing rat rehabilitation (Fig. 4b) we trained a classifier to compare the recordings during recovery against pre-stroke (0d) and post-stroke (2d) behaviour using sequences from pre-stroke and from post-stroke for training the classifier.
Fig. 3b shows for the human data the distribution of scores of two classifiers: multiple sclerosis versus healthy and hydrocephalus versus healthy using for both sequences per class. For evaluating the effect of a treatment on human patients (Fig. 4c) we compare for both diseases post-treatment behaviour against healthy (vertical axis) and against pre-treatment behaviour (horizontal axis), respectively. The classifier is trained using sequences from healthy and pre-treatment.
Learning Skilled Motor Function Changes the Distribution of Postures. Fig. 4a bottom shows the changing frequency of different postures during the initial training (31days) of rats. After computing the posture embedding for each frame in the dataset, the extracted postures are automatically sorted by projecting to one dimension using tSNE47 (vertical axis in Figure 4a, bottom). Grasping postures (middle) are separated from static postures (bottom). Kernel density estimation then yields the relative frequency of posture occurrences for each training day. Their difference from the distribution of skilled animals (0d) is displayed in colour.
0.16 Relation between Brain Function and Behaviour.
In this section we describe the method related to Fig. 5.
Neuronal Rewiring. Fig. 5a evaluates the recovery of motor-function during rehabilitation (vertical axis) and relates it to the neuronal rewiring (horizontal axis). The brain recovery is calculated by manually counting the number of BDA positive fibers post-mortem in the hemisphere affected by the stroke. For each animal, 10 brain slices were processed within 10 distinct positions with a focus on the sensorimotor cortex (from 4.68mm anterior to -5.04mm posterior to bregma with 1mm distance between slices) according to the Paxinos Rat Brain Atlas. The manual count of BDA positive fibers was determined on three consecutive slices per animal where the middle slice is selected to have the largest stroke area. To correct for variations in BDA labelling, data was normalised to the number of BDA-labelled axons in the intact corticospinal tract (CST) as described in 57. As discussed in the Results section of the main manuscript, the outcome show that our behavioural score and the fiber counting have a satisfactory correlation of .
Optogenetic Stimulation. Fig. 5b shows the test accuracy of a linear support vector machine (SVM) classifier58 when predicting whether the optical stimulation is activated during a video sequence. We split the recordings in train and test data and use the activation of the stimulus as label to train a classifier per animal and laser position using our behaviour representation as input. The test accuracy is then averaged across animals (Fig. 5b). The classifier achieves random accuracy for control group, while it reaches almost for the treatment group. The results are discussed in the main manuscript in detail.
Experimental Setup and Data Acquisition.
Information concerning the experimental setup for the optogenetic experiments in rats, single pellet grasping, BDA positive fibers as markers for neuronal plasticity, the running wheel task in mice and the acquisition of data in patients with neurological disease can be found in the supplementary.
Blinding.
For the behaviour analysis using uBAM investigators were blinded for the different treatment groups in both – human and rodent data. The biologists/clinicians only provided the code for the different patients and rodent data after completion of the uBAM behaviour analysis.
Statistics.
Mean and standard deviation have been reported for experiments involving training a classifier. The classifiers have been trained several times by randomly splitting subjects into train/test set. The Pearson correlation coefficient in Figure 5a has been computed over each pair [fiber count, fitness score] for all animal subjects. In the subsection ”Behaviour Magnification” of Results, we compute the two sided t-test for our method and Oh et al.30 by testing the null-hypothesis whether the distributions of healthy and impaired deviation scores are the same.
Acknowledgements
This work has been supported in part by the German Research Foundation (DFG) projects 371923335 and 421703927 to B.O. as well as the Branco Weiss Fellowship Society in Science and the Swiss National Foundation Grant (Nr. 192678) to ASW.
0.17 Author contributions
B.B., U.B. and B.O. developed uBAM. B.B. and U.B. implemented and evaluated the framework and M.D. and P.R. the VAE. A.S.W., L.F., and F.H. conducted the biomedical experiments and validated the results. B.B., U.B., and B.O. prepared the figures with input from A.S.W. and all authors contributed to writing the manuscript.
0.18 Data Availability.
The rats data can be downloaded at https://hci.iwr.uni-heidelberg.de/compvis_files/Rats.zip.
The Optogenetics data can be downloaded at https://hci.iwr.uni-heidelberg.de/compvis_files/Optogenetics.zip.
The mice data can be downloaded at https://hci.iwr.uni-heidelberg.de/compvis_files/Mice.zip.
The human dataset cannot be publicly released due to privacy issue. Please, contact the authors if needed.
0.19 Code Availability.
The code for training and evaluating our models is publicly available on github at the following address: https://github.com/utabuechler/uBAM (DOI: 59).
COMPETING INTERESTS
The authors declare no competing interests.
1 Extended Data Figure 1
Qualitative comparison with the state-of-the-art in motion magnification. To compare our results with Oh et al.(30), we show five clips from different impaired subjects before and after magnification for both methods. First, we re-synthesize the healthy reference behavior to change the appearance to that of the impaired subject so differences in posture can be studied directly, first row (see Method). The second row is the query impaired sequence. Third and forth rows show the magnified frame using the method by Oh et al.(30) and our approach, respectively. The magnified results, represented by magenta markers, show that Oh et al. corrupts the subject appearance, while our method emphasises the differences in posture without altering the appearance. (Details in Supplementary)
![[Uncaptioned image]](/html/2012.09237/assets/extended/ExtendedDataFigure1.png)
2 Extended Data Figure 2
Quantitative comparison with the state-of-the-art in motion magnification. a: mean-squared difference () between the original query frame and its magnification using our method and the approach proposed by Oh et al.(30). For impaired subjects, our method modifies only the leg posture, while healthy subjects are not altered. Oh et al.(30) mostly changes the background and alters impaired and healthy indiscriminately. b: Measuring the fraction of frames with important deviation from healthy reference behaviour for each subject and video sequence and plotting the distribution of these scores. c, mean and standard deviation of deviation scores per cohort and approach. (Details in Supplementary)
![[Uncaptioned image]](/html/2012.09237/assets/extended/ExtendedDataFigure2.png)
3 Extended Data Figure 3
Abnormality posture before and after magnification. We show that our magnification supports spotting abnormal postures by applying a generic classifier on our behaviour magnified frames. This doubles the amount of detected abnormal postures without introducing a significant number of false positives. In particular, we use a one-class linear-svm on ImageNet features trained only on one group (i.e. healthy) and predict abnormalities on healthy and impaired before and after magnification. The ratio of abnormalities is unaltered within the healthy cohort () while it doubles in the impaired cohort ( to ) showing that our magnification method can detect and magnify small deviations, but that it does not artificially introduce abnormalities. (Details in Supplementary)
![[Uncaptioned image]](/html/2012.09237/assets/extended/ExtendedDataFigure3.png)
4 Extended Data Figure 4
Qualitative evaluation of our posture encoding on the rat grasping dataset. Projection from our posture encoding to a 2D embedding of randomly chosen postures using tSNE. Similar postures are located close to each other and the grasping action can be reconstructed by following the circle clockwise (best viewed by zooming in on the digital version of this figure). (Details in Supplementary)
![[Uncaptioned image]](/html/2012.09237/assets/extended/ExtendedDataFigure4.png)
5 Extended Data Figure 5
Comparison with PCA of posture encoding. a: A single video clip projected onto the two most important factors of variation using PCA directly on RGB input (left) and our representation (right). Consecutive frames are connected by straight lines colourised according to the time within the video. Every four frames we plot the original frame. PCA is able to sort the frames over time automatically, showing that each cycle is overlapping with the previous one. Our representation better separates different postures thus reflected by the circular shape of the embedding. b: same as a but including more videos. Each colour represent a different subject. In this case, PCA is strongly biased towards the subject appearance. Thus it separates subjects and does not allow to compare behaviour. c: We reduce the appearance bias by normalising per video with the mean appearance. The result still shows subject separation and no similarity of posture across subjects. d: Using our posture representation and applying PCA on instead of directly on video frames shows no subject bias and only similar postures are near in the 2D space. (Details in Supplementary)
![[Uncaptioned image]](/html/2012.09237/assets/extended/ExtendedDataFigure5.png)
6 Extended Data Figure 6
Disentanglement comparison with simple baseline. We transfer posture from a subject (row) to others with different appearance (columns). a: A baseline model which uses the average video frames as appearance. The appearance is subtracted from each frame to extract the posture. b: Disentanglement using our custom VAE for extracting posture and appearance. Checking for consistency in posture along a row and for similarity in appearance along a column shows that disentanglement is a hard problem: a pixel-based representation cannot solve the task, while our model produces more detailed and realistic images. (Details in Supplementary)
![[Uncaptioned image]](/html/2012.09237/assets/extended/ExtendedDataFigure6.png)
7 Extended Data Figure 7
DeepLabCut trainset size. We train DLC models on a growing number of training samples. The model is evaluated as described in Fig. 2 of the main manuscript. Note the limited gain in performance despite annotation increasing by more than an order of magnitude. (Details in Supplementary)
![[Uncaptioned image]](/html/2012.09237/assets/extended/ExtendedDataFigure7.png)
8 Extended Data Figure 8
Comparison with R3D. Besides JAABA and DLC we also compare our method with R3D which is another non-parametric model, very popular for video classification. We extract R3D features and evaluate the representation using the same protocol as our method. Our model is more suited to behaviour analysis. More information regarding the evaluation protocol can be found in the Methods section of the main manuscript. (Details in Supplementary)
![[Uncaptioned image]](/html/2012.09237/assets/extended/ExtendedDataFigure8.png)
9 Extended Data Figure 9
Regress Key-points. We show qualitative results for the key-point regression from our posture representation to key-points and ene-to-end inferred key-points for DLC. This experiment was computed on 14 keypoints, however we only show 6 for clarity: wrist (yellow), start of the first finger (purple), tip of each finger. The ground-truth location is shown with a circle and the detection inferred by the model with a cross. Even though our representation was not trained on keypoint detection, for some frames we can recover keypoints as good as, or even better, than DLC which was trained end-to-end on the task. We study the gap in performance in more detail in the Supplementary (Supplementary Figure 3).
![[Uncaptioned image]](/html/2012.09237/assets/extended/ExtendedDataFigure9.png)
10 Extended Data Figure 10
Typical high/low scoring grasps with optogenetics. Given the classifier that produced Figure 5b, we score all testing sequences from the same animal and show two typical sequences with high/low classification scores. The positive score indicates that the sequence was predicted as light-on, the negative that it was predicted as light-off. Both sequences are correctly classified as indicated by the ground-truth (”GT”) and classifier score (”SVM-Score”). The sequence on the left shows a missed grasp, consistent with a light-on inhibitory behaviour, while the same animal performs a successful grasp in the sequence on the right for the light-off. Obviously, the classifier cannot see the fiber optics, since we cropped this area out before passing it to the classifier. (Details in Supplementary)
![[Uncaptioned image]](/html/2012.09237/assets/extended/ExtendedDataFigure10.png)
REFERENCES
References
- 1 Berman, G.J. Measuring behavior across scales. BMC biology 16, 23 (2018).
- 2 Filli, L. et al. Profiling walking dysfunction in multiple sclerosis: characterisation, classification and progression over time. Scientific reports 8, 4984 (2018).
- 3 Vargas-Irwin, C.E. et al. Decoding complete reach and grasp actions from local primary motor cortex populations. Journal of neuroscience 30, 9659–9669 (2010).
- 4 Loper, M.M., Mahmood, N. & Black, M.J. MoSh: Motion and shape capture from sparse markers. ACM Transactions on Graphics, (Proc. SIGGRAPH Asia) 33, 220:1–220:13 (2014).
- 5 Huang, Y. et al. Deep inertial poser: Learning to reconstruct human pose from sparse inertial measurements in real time. ACM Transactions on Graphics, (Proc. SIGGRAPH Asia) 37, 185:1–185:15 (2018).
- 6 Robie, A.A., Seagraves, K.M., Egnor, S.R. & Branson, K. Machine vision methods for analyzing social interactions. Journal of Experimental Biology 220, 25–34 (2017).
- 7 Dell, A.I. et al. Automated image-based tracking and its application in ecology. Trends in ecology & evolution 29, 417–428 (2014).
- 8 Peters, S.M. et al. Novel approach to automatically classify rat social behavior using a video tracking system. Journal of neuroscience methods 268, 163–170 (2016).
- 9 Arac, A., Zhao, P., Dobkin, B.H., Carmichael, S.T. & Golshani, P. Deepbehavior: A deep learning toolbox for automated analysis of animal and human behavior imaging data. Frontiers in systems neuroscience 13, 20 (2019).
- 10 Graving, J.M. et al. Deepposekit, a software toolkit for fast and robust animal pose estimation using deep learning. eLife 8, e47994 (2019).
- 11 Pereira, T.D. et al. Fast animal pose estimation using deep neural networks. Nature methods 16, 117–125 (2019).
- 12 Mathis, A. et al. Deeplabcut: markerless pose estimation of user-defined body parts with deep learning. Nature Neuroscience 21, 1281–1289 (2018).
- 13 Simon, T., Joo, H., Matthews, I. & Sheikh, Y. Hand keypoint detection in single images using multiview bootstrapping. In Proceedings of the IEEE conference on Computer Vision and Pattern Recognition, 1145–1153 (2017).
- 14 Nath, T. et al. Using deeplabcut for 3d markerless pose estimation across species and behaviors. Nature protocols 14, 2152–2176 (2019).
- 15 Mathis, M.W. & Mathis, A. Deep learning tools for the measurement of animal behavior in neuroscience. Current opinion in neurobiology 60, 1–11 (2020).
- 16 Mu, J., Qiu, W., Hager, G.D. & Yuille, A.L. Learning from synthetic animals. In Proceedings of the IEEE/CVF Conference on Computer Vision and Pattern Recognition, 12386–12395 (2020).
- 17 Li, S. et al. Deformation-aware unpaired image translation for pose estimation on laboratory animals. In Proceedings of the IEEE/CVF Conference on Computer Vision and Pattern Recognition, 13158–13168 (2020).
- 18 Sanakoyeu, A., Khalidov, V., McCarthy, M.S., Vedaldi, A. & Neverova, N. Transferring dense pose to proximal animal classes. In Proceedings of the IEEE/CVF Conference on Computer Vision and Pattern Recognition, 5233–5242 (2020).
- 19 Kocabas, M., Athanasiou, N. & Black, M.J. Vibe: Video inference for human body pose and shape estimation. In Proceedings of the IEEE/CVF Conference on Computer Vision and Pattern Recognition, 5253–5263 (2020).
- 20 Loper, M., Mahmood, N., Romero, J., Pons-Moll, G. & Black, M.J. SMPL: A skinned multi-person linear model. ACM Trans. Graphics (Proc. SIGGRAPH Asia) 34, 248:1–248:16 (2015).
- 21 Zuffi, S., Kanazawa, A., Berger-Wolf, T. & Black, M.J. Three-d safari: Learning to estimate zebra pose, shape, and texture from images ”in the wild”. In Proceedings of the IEEE/CVF International Conference on Computer Vision (2019).
- 22 Habermann, M., Xu, W., Zollhofer, M., Pons-Moll, G. & Theobalt, C. Deepcap: Monocular human performance capture using weak supervision. In Proceedings of the IEEE/CVF Conference on Computer Vision and Pattern Recognition, 5052–5063 (2020).
- 23 Batty, E. et al. Behavenet: nonlinear embedding and bayesian neural decoding of behavioral videos. In Advances in Neural Information Processing Systems, 15680–15691 (2019).
- 24 Ryait, H. et al. Data-driven analyses of motor impairments in animal models of neurological disorders. PLOS Biology 17, 1–30 (2019).
- 25 Kabra1, M., A. Robie1, A., Rivera-Alba1, M., Branson, S. & Branson, K. Jaaba: interactive machine learning for automatic annotation of animal behavior. Nature methods 10 (2012).
- 26 Brattoli, B., Büchler, U., Wahl, A.S., Schwab, M.E. & Ommer, B. Lstm self-supervision for detailed behavior analysis. In Proceedings of the IEEE/CVF Conference on Computer Vision and Pattern Recognition (2017).
- 27 Büchler, U., Brattoli, B. & Ommer, B. Improving spatiotemporal self-supervision by deep reinforcement learning. In Proceedings of the IEEE/CVF European Conference on Computer Vision (2017).
- 28 Noroozi, M. & Favaro, P. Unsupervised learning of visual representations by solving jigsaw puzzles. In Proceedings of the IEEE/CVF European Conference on Computer Vision (2016).
- 29 Lee, H.Y., Huang, J.B., Singh, M.K. & Yang, M.H. Unsupervised representation learning by sorting sequences. In Proceedings of the IEEE/CVF International Conference on Computer Vision (2017).
- 30 Oh, T.H. et al. Learning-based video motion magnification. In Proceedings of the IEEE/CVF European Conference on Computer Vision, 633–648 (2018).
- 31 Liu, C., Torralba, A., Freeman, W.T., Durand, F. & Adelson, E.H. Motion magnification. In ACM transactions on graphics (TOG), vol. 24, 519–526 (ACM, 2005).
- 32 Wu, H.Y. et al. Eulerian video magnification for revealing subtle changes in the world. ACM Transactions on Graphics 31 (2012).
- 33 Elgharib, M., Hefeeda, M., Durand, F. & Freeman, W.T. Video magnification in presence of large motions. In Proceedings of the IEEE/CVF Conference on Computer Vision and Pattern Recognition, 4119–4127 (2015).
- 34 Wadhwa, N., Rubinstein, M., Durand, F. & Freeman, W.T. Phase-based video motion processing. ACM Transactions on Graphics (TOG) 32, 80 (2013).
- 35 Wadhwa, N., Rubinstein, M., Durand, F. & Freeman, W.T. Riesz pyramids for fast phase-based video magnification. In Proceedings of the International Conference on Computational Photography, 1–10 (2014).
- 36 Zhang, Y., Pintea, S.L. & Van Gemert, J.C. Video acceleration magnification. In Proceedings of the IEEE/CVF Conference on Computer Vision and Pattern Recognition, 529–537 (2017).
- 37 Tulyakov, S. et al. Self-adaptive matrix completion for heart rate estimation from face videos under realistic conditions. In Proceedings of the IEEE conference on computer vision and pattern recognition, 2396–2404 (2016).
- 38 Dekel, T., Michaeli, T., Irani, M. & Freeman, W.T. Revealing and modifying non-local variations in a single image. ACM Transactions on Graphics (TOG) 34, 227 (2015).
- 39 Wadhwa, N., Dekel, T., Wei, D., Durand, F. & Freeman, W.T. Deviation magnification: revealing departures from ideal geometries. ACM Transactions on Graphics (TOG) 34, 226 (2015).
- 40 Kingma, D.P. & Welling, M. Auto-encoding variational bayes. In 2nd International Conference on Learning Representations, ICLR 2014, Banff, AB, Canada, April 14-16, 2014, Conference Track Proceedings (2014). URL http://arxiv.org/abs/1312.6114.
- 41 Goodfellow, I. et al. Generative adversarial nets. In Advances in Neural Information Processing Systems 27, 2672–2680 (2014).
- 42 Esser, P., Sutter, E. & Ommer, B. A variational u-net for conditional appearance and shape generation. In The IEEE/CVF Conference on Computer Vision and Pattern Recognition (CVPR) (2018).
- 43 Goodman, A.D. et al. Sustained-release oral fampridine in multiple sclerosis: a randomised, double-blind, controlled trial. The Lancet 373, 732–738 (2009).
- 44 Zörner, B. et al. Prolonged-release fampridine in multiple sclerosis: Improved ambulation effected by changes in walking pattern. Multiple Sclerosis Journal 22, 1463–1475 (2016).
- 45 Schniepp, R. et al. Walking assessment after lumbar puncture in normal-pressure hydrocephalus: a delayed improvement over 3 days. Journal of neurosurgery 126, 148–157 (2017).
- 46 Tran, D. et al. A closer look at spatiotemporal convolutions for action recognition. In Proceedings of the IEEE/CVF Conference on Computer Vision and Pattern Recognition, 6450–6459 (2018).
- 47 Maaten, L.v.d. & Hinton, G. Visualizing data using t-sne. Journal of machine learning research 9, 2579–2605 (2008).
- 48 Lafferty, C.K. & Britt, J.P. Off-target influences of arch-mediated axon terminal inhibition on network activity and behavior. Frontiers in Neural Circuits 14, 10 (2020).
- 49 Miao, C. et al. Hippocampal remapping after partial inactivation of the medial entorhinal cortex. Neuron 88, 590–603 (2015).
- 50 Carta, I., Chen, C.H., Schott, A.L., Dorizan, S. & Khodakhah, K. Cerebellar modulation of the reward circuitry and social behavior. Science 363 (2019).
- 51 Krizhevsky, A., Sutskever, I. & Hinton, G.E. Imagenet classification with deep convolutional neural networks. In Advances in neural information processing systems, 1097–1105 (2012).
- 52 Hinton, G.E. & Salakhutdinov, R.R. Reducing the dimensionality of data with neural networks. science 313, 504–507 (2006).
- 53 Johnson, J., Alahi, A. & Fei-Fei, L. Perceptual losses for real-time style transfer and super-resolution. In Proceedings of the IEEE/CVF European Conference on Computer Vision, 694–711 (Springer, 2016).
- 54 Alaverdashvili, M. & Whishaw, I.Q. A behavioral method for identifying recovery and compensation: hand use in a preclinical stroke model using the single pellet reaching task. Neuroscience & Biobehavioral Reviews 37, 950–967 (2013).
- 55 Pedregosa, F. et al. Scikit-learn: Machine learning in python. Journal of Machine Learning Research 12, 2825–2830 (2011).
- 56 Fisher, R.A. The use of multiple measurements in taxonomic problems. Annals of eugenics 7, 179–188 (1936).
- 57 Wahl, A.S. et al. Optogenetically stimulating intact rat corticospinal tract post-stroke restores motor control through regionalized functional circuit formation. Nature communications 8, 1187 (2017).
- 58 Cortes, C. & Vapnik, V. Support-vector networks. Machine learning 20, 273–297 (1995).
- 59 Brattoli, B., Buechler, U. & Ommer, B. Source code of ubam: First release (version v.1.0) (2020). URL https://github.com/utabuechler/uBAM. DOI 10.5281/zenodo.4304070.