Radio observations of the merging galaxy cluster system
Abell 3391-Abell 3395
The pre-merging system of galaxy clusters Abell 3391-Abell 3395 located at a mean redshift of 0.053 has been observed at 1 GHz in an ASKAP/EMU Early Science observation as well as in X-rays with eROSITA. The projected separation of the X-ray peaks of the two clusters is 50′ or 3.1 Mpc. Here we present an inventory of interesting radio sources in this field around this cluster merger. While the eROSITA observations provide clear indications of a bridge of thermal gas between the clusters, neither ASKAP nor MWA observations show any diffuse radio emission coinciding with the X-ray bridge. We derive an upper limit on the radio emissivity in the bridge region of . A non-detection of diffuse radio emission in the X-ray bridge between these two clusters has implications for particle-acceleration mechanisms in cosmological large-scale structure. We also report extended or otherwise noteworthy radio sources in the 30 deg2 field around Abell 3391-Abell 3395. We identified 20 Giant Radio Galaxies, plus 7 candidates, with linear projected sizes greater than 1 Mpc. The sky density of field radio galaxies with largest linear sizes of Mpc is deg-2, three times higher than previously reported. We find no evidence for a cosmological evolution of the population of Giant Radio Galaxies. Moreover, we find seven candidates for cluster radio relics and radio halos.
1 Introduction
Considerable efforts are being made to detect the Warm-Hot Intergalactic Medium (WHIM) in various bands of the electromagnetic spectrum. Detecting radio synchrotron emission from intercluster filaments or bridges could provide a new probe of the WHIM and could also shed light on mechanisms of particle acceleration and magnetic fields in a poorly studied environment (Vazza et al., 2019). The magnetic field in the WHIM is less likely to be affected by a small-scale dynamo or by outflows from galaxies and active galactic nuclei (AGN). This field could therefore be a tracer of magnetic fields from an earlier epoch in the Universe that has subsequently been merely compressed by structure formation processes (e.g. Brüggen et al., 2005; Vazza et al., 2017).
Moreover, interacting galaxy clusters produce diffuse radio sources by accelerating electrons via shocks or turbulence (e.g. Brunetti & Jones, 2014). Giant radio halos are diffuse radio synchrotron sources found in galaxy clusters that have recently suffered a merger, as indicated by a disturbed intracluster medium (ICM) or other indicators of the cluster’s dynamical state (e.g. Schuecker et al., 2001; Cassano, 2010). Cluster radio shocks or radio relics are arc-shaped, diffuse sources that appear to be related to shock waves in the ICM (Brüggen & Vazza, 2020). Moreover, there is a class of sources that trace old radio plasma from AGN that has been re-energised through processes in the ICM. Low-frequency radio observations are starting to show more of these types of sources. The common properties of these sources are the AGN origin of the plasma and their ultra-steep radio spectra. Radio phoenices and gently reenergised tails (GReETs) are examples of such sources (see e.g. van Weeren et al. (2019) for a recent review).
The cluster Abell 3395 (hereafter A3395) is double-peaked, both in its galaxy distribution (Girardi et al., 1997) as well as in its X-ray emission, first observed with the Einstein satellite (Forman et al., 1981). It is accompanied to the north by A3391 at a separation of about 3 Mpc. The mean redshift of A3395 () and A3391 () is . In between the clusters lies a galaxy group called ESO 161-IG 006 (, Alvarez et al. 2018). Both clusters have masses of around (Piffaretti et al., 2011), and X-ray temperatures of around keV (Vikhlinin et al., 2009). ASCA, ROSAT, Planck, and Suzaku observations have confirmed that A3395 and A3391 are connected by a gas bridge (Tittley & Henriksen, 2001; Planck Collaboration et al., 2013; Sugawara et al., 2017).
Diffuse radio emission from pairs of galaxy clusters is rare (Botteon et al., 2018, 2019; Govoni et al., 2019; Botteon et al., 2020). The first known bridge of low surface brightness connecting a radio halo and radio relic was found in the Coma cluster, first reported by Kim et al. (1989) and further studied afterwards (e.g. Venturi et al. 1990, Brown & Rudnick 2011). A moderate correlation between radio and X-ray brightness has also been found in the Coma bridge. This correlation suggests that the radio and X-ray emission originate from the same volume and that the correlation is not produced by projection effects.
The bridges detected so far have different sizes and are observed in systems that are believed to be in a state preceding the merger. Currently, the best examples are the merging galaxy clusters Abell 399 and Abell 401, which are separated by about 5 Mpc. Diffuse synchrotron emission was detected in the region connecting the two clusters using the Low Frequency Array (LOFAR) at MHz (Govoni et al., 2019). X-ray observations of A399-A401 have revealed a hot (6 - 7 keV) filament of plasma in the region between the two clusters (e.g. Fujita et al., 2008). Their masses are and , respectively, and so the system is more than three times as massive as the A3391/5 system. The redshift of Abell 399 is 0.0718, while that of Abell 401 is 0.0736. Here, both clusters host a radio halo. The presence of a bridge was confirmed through the Sunyaev-Zeldovich effect (Planck Collaboration et al., 2013) but it is not seen in the GaLactic and Extragalactic All-Sky MWA (GLEAM) low-frequency radio survey (Wayth et al., 2015).
Integrating the average surface brightness over the Abell 399/401 bridge region, namely mJy beam-1 (or 0.38 Jy arcsec-2), over an area of Mpc2 and excluding the emission from the two halos, Govoni et al. (2019) obtain a total flux density of mJy. This flux density corresponds to a radio power of W Hz-1 and a mean radio emissivity of W Hz-1 m-3.
Botteon et al. (2020) discovered a radio bridge in the pre-merging galaxy clusters A1758N and A1758S, which are 2 Mpc apart. The bridge is clearly detected in the LOFAR image at 144 MHz and tentatively detected at 53 MHz. The clusters A1758N and A1758S also host radio halos but the mean radio emissivity in the bridge is more than one order of magnitude lower than that of the halos. Interestingly, radio and X-ray surface brightness are found to be correlated in the bridge.
The short lifetime for relativistic electrons emitting at 140 MHz limits the maximum distance that these relativistic electrons can travel in their lifetime to 0.1 Mpc (Govoni et al., 2019). Hence, the sizes of radio bridges combined with the short cooling time of the synchrotron-emitting electrons suggest that relativistic particles are accelerated in situ. The large area filling factor, that is, a very smooth radio surface brightness, observed in the radio bridge of A399-A401 clearly disfavours shock acceleration as the main source of the observed radio emission.
The origin of radio synchrotron emission in radio bridges is not understood. Using cosmological simulations, Govoni et al. (2019) proposed that the synchrotron emission could come from electrons re-accelerated by weak shock waves provided there exists a volume-filling population of pre-accelerated electrons in the bridge. However, this would not produce a radio-X correlation because shocks cover at most 10 percent of the volume of the bridge. Also, Govoni et al. (2019) concluded that the steep radio spectrum challenges this scenario for the origin of the radio synchrotron bridge.
Recently, Brunetti & Vazza (2020) proposed that stochastic acceleration of relativistic electrons by turbulence could explain the radio emission observed in the system A399-A401. According to this model, the emission is expected to be volume-filling and with a steep spectrum111We define the spectral index as . ( -1.3). Their model also predicts a natural correlation between radio and X-ray surface brightness. Moreover, it is expected that the radio emission gets clumpier at higher frequencies.
In this paper, we present the results of our search for diffuse radio synchrotron emission in the bridge of thermal gas between A3395 and A3391 that was recently observed with eROSITA. Moreover, we present an inventory of interesting radio sources in this field around this cluster merger. The outline of this paper is as follows: In Sect. 2 we give a short overview of the eROSITA observations that are published in an accompanying paper (Reiprich et al. 2020). In Sect. 3 we describe ASKAP and MWA observations. Results are presented in Sect. 4 and we present our conclusions in Sect. 5.
Throughout this paper, we use the fiducial cosmology km s-1 Mpc-1, , and . At the mean redshift of A3395 and A3391, 1 arcsec on the sky corresponds to kpc.
2 X-ray observations
On July 13, 2019, eROSITA (extended ROentgen Survey with an Imaging Telescope Array) was successfully launched and made its way into an L2 halo orbit (Predehl et al., 2020). During its Performance Verification (PV) phase, eROSITA surveyed the A3391-A3395 system as part of its first light observations. Reiprich et al. (2020) present the first results from four eROSITA PV phase observations of A3395-A3391. These cover a total area of about 15 deg2, or about half the size of the accompanying Australian Square Kilometre Array Pathfinder (ASKAP: Johnston et al., 2008) field, with at least 30 s exposure (10 deg2 with at least 1000 s). The resulting X-ray image is shallower than the XMM-Newton observation of the A3395-A3391 system but covers a much wider area.
Also, owing to its better response to soft X-rays, in between A3395 and A3391, Reiprich et al. (2020) observe warm gas in emission in the bridge, which may constitute a WHIM detection. Emission along this bridge includes the galaxy group ESO 161-IG006, which produces only a small fraction of the total emission. While most gas in the bridge appears hot, these latter authors discover hints for cool primordial gas between the clusters. Moreover, several clumps of matter around the merging system were discovered. This is enabled by the X-ray hot gas morphologies and radio jet and lobe structures of their central AGN. Finally, Reiprich et al. (2020) discover a filamentary emission region north of and well beyond the virial radius of A3391 connecting to an apparently infalling cluster and a connected emission filament towards the south of A3395, suggesting a total length of the filament of 15 Mpc (4 degrees). The Planck SZ Y-maps, as well as galaxy density maps from DECam observations (DECam; see, e.g. Flaugher et al., 2015), appear to confirm this new filament. For more information we refer the reader to Reiprich et al. (2020).
3 Radio observations
3.1 ASKAP observations
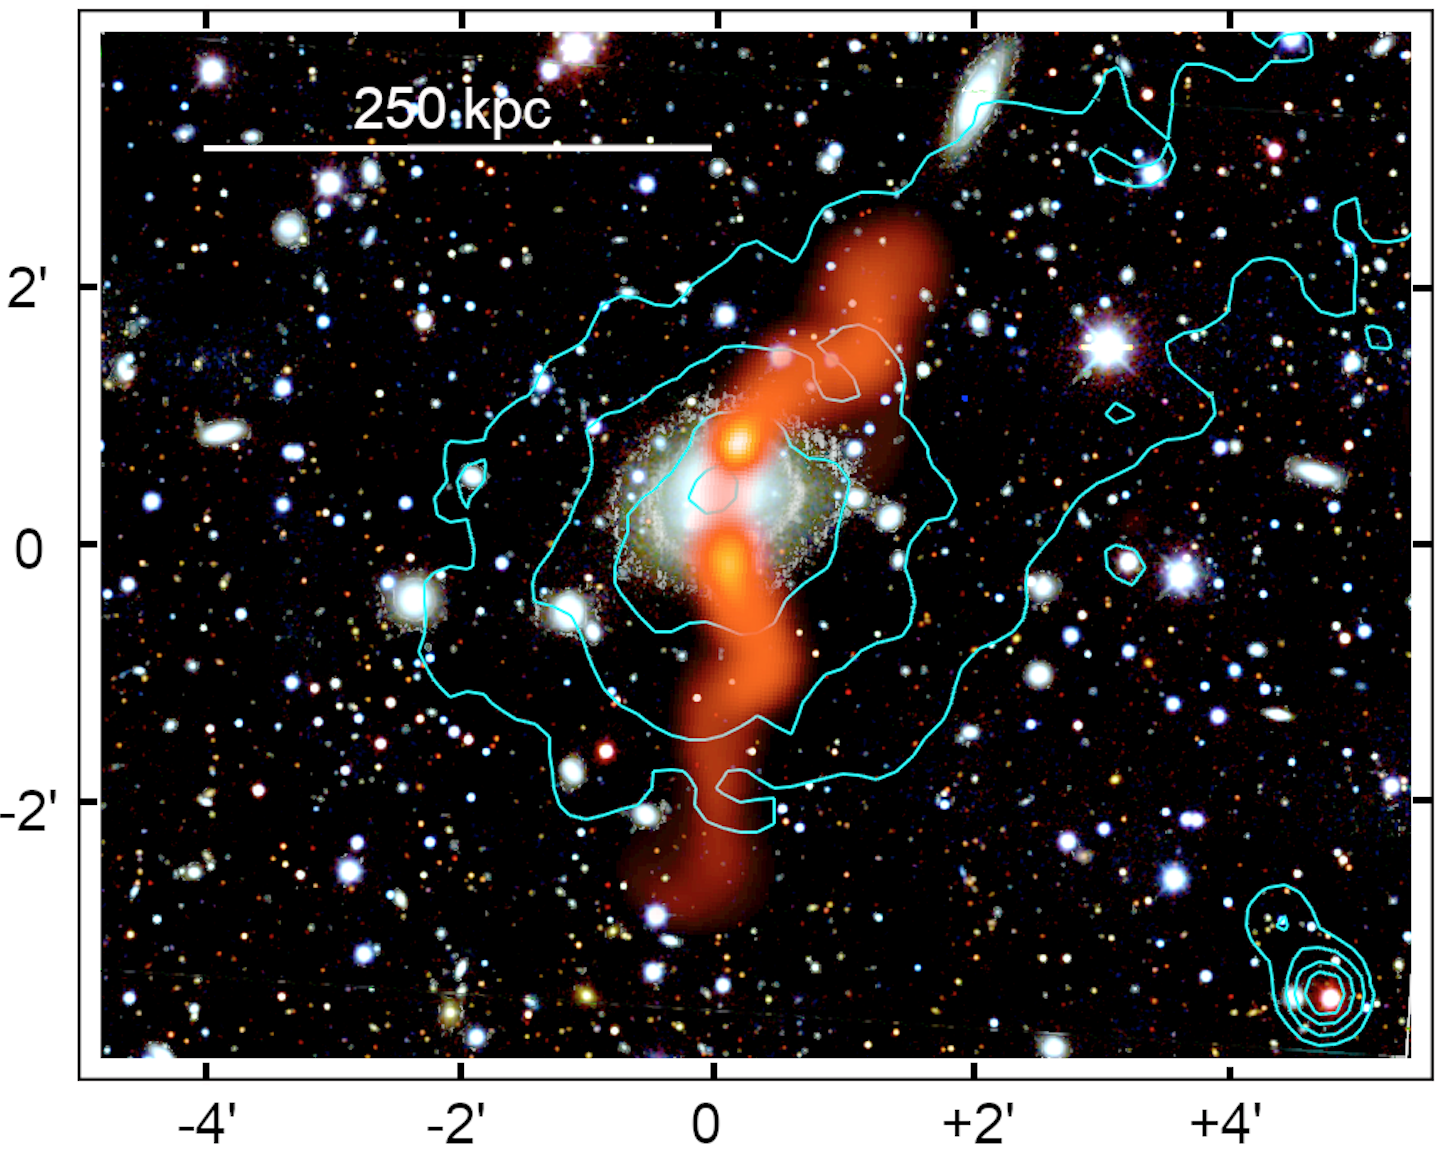
The A3391-A3395 system was observed as part of the Evolutionary Map of the Universe (EMU: Norris et al., 2011) survey Early Science observations which use the new ASKAP telescope in Australia to make a census of radio sources in the sky south of +30∘ declination; see Fig. 1 for an X-ray radio overlay. Our ASKAP observations reach a depth of 25–35 Jy/beam root mean square (rms) at a spatial resolution of 10 arcsec in the frequency range 846.5–1134.5 MHz. These latter are therefore 15 times deeper than the NRAO VLA Sky Survey (NVSS: Condon et al., 1998), and have a five times better angular resolution (we note that the A3391-A3395 field is not covered by NVSS).
The ASKAP early science data covering A3395-A3391 are from Scheduling Block (SB) 8275 observed on March 22, 2019, and are publicly available at the CSIRO ASKAP Science Data Archive (CASDA; Chapman et al., 2017). SB8275 contains 36 separate measurement sets corresponding to 36 separate beams, each with a unique phase-tracking centre. Each beam covers 1 deg2 on the sky and all beams were observed simultaneously, giving an instantaneous field of view (FOV; after accounting for beam overlap) of 30 deg2. Of the 36 ASKAP antennas, 35 were used for the observations, with a minimum baseline of 22 m and maximum baseline of 6.4 km. Each measurement set covers a bandwidth of 288 MHz with a central frequency of 990.5 MHz. These data were processed through the official ASKAP processing pipeline (ASKAPsoft; Guzman et al., 2019). The steps implemented in the ASKAPsoft pipeline will be described in an upcoming system description paper, but we refer the reader to the CSIRO ASKAPsoft documentation for further details.
ASKAP forms beams electronically through a chequerboard Phased Array Feed at the prime focus of each antenna. Individual beams are then correlated between antennas. The ASKAP correlator generates 15552 spectral-line channels, which are then averaged to 288 1-MHz channels.
Beam measurement sets are bandpass calibrated using a standard calibrator (PKS B1934–638)222Reynolds J. E., 1994, Technical report, A Revised Flux Scale for the AT Compact Array. ATNF, Epping. The calibration observations occurred in a preceding scheduling block wherein PKS B1934–638 was placed at the centre of each beam for 200 seconds. The derived bandpass solutions also account for the other fundamental interferometric calibration terms, such as the flux-density, delay, and phase-referencing solutions. One cycle of frequency-independent, direction-independent, phase-only self-calibration is also applied for each beam as part of the imaging pipeline.
Individual calibrated measurement sets are imaged and deconvolved separately with imaging weights determined by Wiener pre-conditioning. These weights have a setting equivalent to a Brigg’s robustness value of 0.0, which was determined to provide an optimal combination of resolution, sensitivity, and point spread function (PSF) quality. The -projection technique is used to account for the non-coplanarity of the sky, using a total of 557 w-planes. Multi-term deconvolution (with two terms) is used to model variation in source flux over the synthesised bandwidth and multi-scale deconvolution (with six scales) is used to improve the modelling of extended sources. Beam images are then averaged with the same weight to form a mosaic in the image plane. Primary beam correction is applied during the linear mosaic process using circular Gaussian models whose size is determined by holography observations. Although the beams differ in shape and are coma-distorted at the edge of the FOV, an average value is used for all 36 beams with an estimated error of 10%.
As part of the routine ASKAP/EMU validation procedures, a preliminary source catalogue was created from the mosaic image and compared with other large-area radio survey catalogues. For these data, compact radio sources were crossmatched with the Sydney University Molonglo Sky Survey (SUMSS: Bock et al., 1999) catalogue (Mauch et al., 2003), resulting in 111 matches. The median astrometric offset of arcsec between these matches is consistent with zero offset given the dispersion in this measurement. The median flux ratio of the ASKAP sources versus their SUMSS counterparts is 0.81 overall but is approximately 1.0 for the brightest matches. Given that this flux comparison is complicated by the large difference in spatial resolution and a modest difference in frequency (for which we assume a spectral index of -0.8) we do not interpret this result as evidence for a systematic flux error. However, there is one additional concern that contributes to the flux uncertainty in these data and that is the lack of a common restoring beam among the images. Because the individual beam images are processed independently, the beams can have different UV coverage (e.g. because of flagging or declination) and therefore different PSFs. Gaussian fits to each of the individual 36 PSFs yielded beam sizes with geometric means (i.e. ) ranging from 9.8 to 11.1 arcsec. As we were unable to propagate these individual beam sizes to the final linear mosaic image, we assumed a constant beam size of 11.2 9.5 arcsec at a position angle of 87 degrees (a geometric mean of 10.3 arcsec). The difference between the true and assumed PSF size will lead to a systematic error in integrated flux measurements, which is typically only 3% but could be as large as 10% in some places in the mosaic.
The resulting images of the beams covering A3395-A3391, as well as the full ASKAPsoft mosaic image of SB8275, show artefacts that mainly emanate from two bright and extended radio galaxies at the centres of the clusters: sources N1 and S1 (see Fig. 1 and 3). Negative bowl-like artefacts are present around the radio galaxies, with larger-scale positive and negative rings extending up to deg from their centres. The cause of these artefacts is currently being investigated and will be addressed in an upcoming technical paper (Wilber et al. in prep).
In an attempt to improve the image quality, Wilber et al. (2020) recently tested direction-dependent calibration and imaging on ASKAP early science and pilot survey observations. These latter authors report a significant reduction in artefacts around bright, compact sources after implementing further data processing via the third-generation software packages KillMS (kMS) (Tasse, 2014; Smirnov & Tasse, 2015) and DDFacet (DDF) (Tasse et al., 2018), which are officially being used for data products of the LOFAR Two-Metre Sky Survey (LoTSS; Shimwell et al., 2017). As part of their testing, Wilber et al. (2020) developed a direction-dependent ASKAP pipeline, which was used to create a mosaic image of SB8275. This direction-dependent mosaic image is referred to as the ASKAP-DD image hereafter and is used to measure flux densities of radio sources. We refer the reader to Wilber et al. (2020) and an upcoming paper, Wilber et al. in prep, for details of the ASKAP direction-dependent pipeline and specific processing steps.
Finally, the convention for naming sources discovered with EMU is EMU NA JHHMMSS.s+DDMMSS where ‘N’ will be replaced with ‘E’ for ‘early science’ or ‘P’ for ‘pilot survey’, and ‘A’ is ‘S’ for ‘source’, ‘C’ for component, or ‘D’ for ‘diffuse emission’.
3.2 Murchison Widefield Array observations
| Band | Beam | |||
|---|---|---|---|---|
| (MHz) | (mJy beam-1) | % | () | |
| MWA-2 robust tapered | ||||
| 72–103 | 88 | 12 | 9 | |
| 103–134 | 118 | 6.2 | 9 | |
| 139–170 | 154 | 6.8 | 9 | |
| 170–200 | 185 | 7.6 | 9 | |
| 200-231 | 216 | 9.2 | 9 | |
| MWA-2 robust | ||||
| 139–170 | 154 | 2.6 | 9 | |
| 170–200 | 185 | 2.8 | 9 | |
| 200-231 | 216 | 2.9 | 9 | |
| MWA-2 robust | ||||
| 170–231 | 200 | 2.1 | - | |
Notes. Only used to create lower right panel in Fig. 4.
The A3391-95 system has been observed with the Murchison Widefield Array Phase 2 (hereafter MWA-2; Tingay et al., 2013; Wayth et al., 2018) in its ‘extended’ configuration. The observations cover five frequencies: 88, 118, 154, 185, and 216 MHz, each with 30 MHz bandwidth. Full processing details for this form of MWA-2 data are described by Duchesne et al. (2020), but we briefly describe this process here. Observations for the MWA-2 are taken in two-minute snapshot observing mode, with each snapshot calibrated and imaged independently; imaged snapshots are linearly stacked to create deep mosaic images. Calibration is performed using a sky model generated from the GLEAM extra-galactic catalogue (Hurley-Walker et al., 2017) using the full-Jones Mitchcal algorithm as described by Offringa et al. (2016) and full-embedded element primary beam model (Sokolowski et al., 2017). For this work, imaging is performed with ‘Briggs’ weighting with robust parameters between and with additional Gaussian tapering applied to the 154-, 185-, and 216-MHz datasets to ensure a consistent PSF and – sampling across the full MWA band. We use the multi-scale CLEAN algorithm within the widefield imager WSClean (Offringa et al., 2014; Offringa & Smirnov, 2017) for deconvolution. We make a wideband ( MHz) image centred on 200 MHz by stacking the 185- and 216-MHz mosaics made with robust weighting with no tapering as a higher-resolution reference image but note that at this weighting a significant fraction of flux is lost for extended sources. A separate CLEAN component model and residual mosaics are also created and are used for flux-density measurements, with a factor of (dependent on the source size) applied to integrated residual flux density to account for a difference in CLEAN and dirty flux. Image details are presented in Table 1. GLEAM and MWA-2 images are shown in Fig. 4.
4 Results
In the ASKAP image (Fig. 3), a radio bridge is not detected, although the short spacings allow us to retain sensitivity up to scales of 1 degree, significantly larger than the X-ray bridge. In our image after direction-dependent calibration, artefacts on the largest scales as well as negative bowl artefacts are reduced. The noise in the image ranges from Jy to Jy per beam where the strongest artifacts emanate from the brightest cluster galaxies at the centre of Abell 3391 and Abell 3395. There does not appear to be any radio emission coincident with the bridge detected by eROSITA.
No radio bridge is seen in the MWA-2 or GLEAM data (Fig. 4). We note that the GLEAM data may show faint large-scale emission around bright, complex sources, but this is due to residual un-deconvolved sidelobes of the PSF characteristic of MWA data. As with the ASKAP data, the bright, complex radio galaxies in each cluster limit the sensitivity that can be achieved in this region. We note that MWA-2 and GLEAM data, despite the expected steep spectra of the bridge synchrotron emission, may not achieve better surface brightness sensitivity than ASKAP (Hodgson et al., 2020, though we note that for their analysis, MWA-2 are imaged at robust , reducing the surface brightness sensitivity for larger scales compared to robust used here).
At the same time, the merging cluster system contains several nearby radio galaxies with extended features that may be interacting with the intracluster environments. In the following sections we report on the upper limit of the non-detection of the radio bridge and report flux densities for radio galaxies within the cluster field.
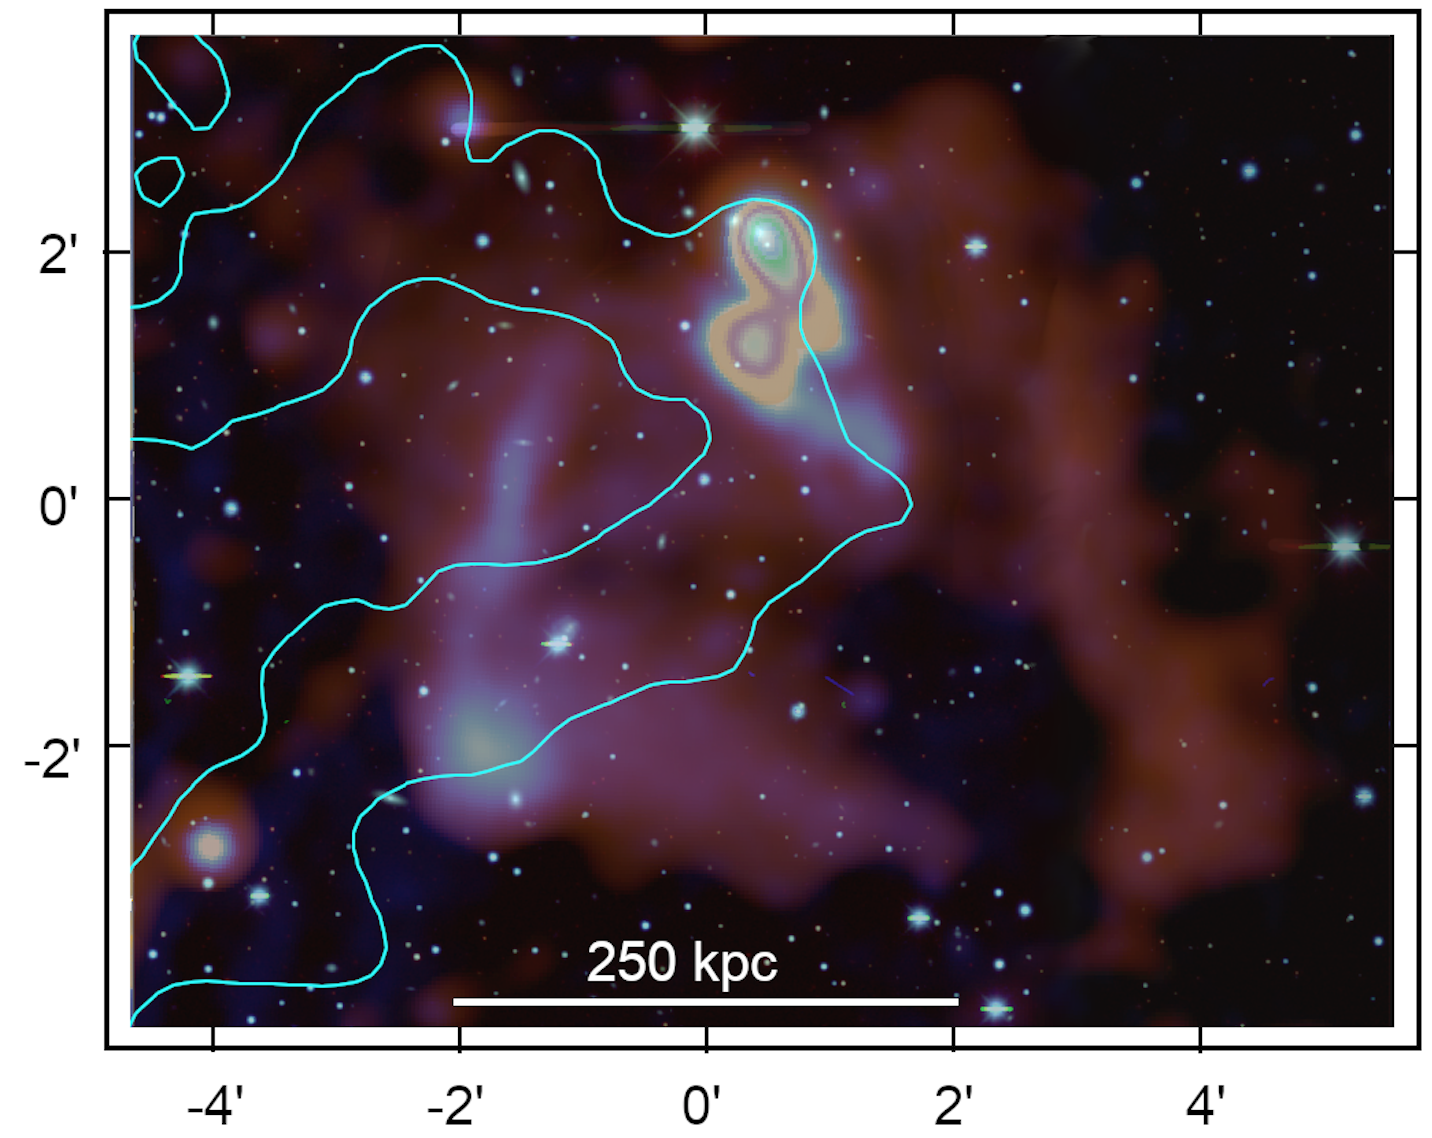
4.1 Upper limit on the radio bridge
There seems to be a consensus that the following physical conditions need to be met in order for a radio-synchrotron emission bridge to exist: (1) seed electrons (either from earlier structure formation shocks or from AGN), (2) a magnetic field, (3) an ongoing acceleration mechanism as described in Sect. 1, and finally (4) sufficient time for the acceleration to have produced a sufficient number of electrons of the required Lorentz factors.
In order to compute the flux values in the intercluster region, we placed a square box of 1120 arcsec per side on the bridge region and then compared it to 36 other such boxes outside of the bridge region. We then blanked areas with flux densities above 0.4 mJy and calculated the mean and rms in the boxes. Subsequently, we subtracted the mean of the 36 boxes outside of the bridge from the mean of the box on the bridge, and calculated the scatter in the means between the boxes (an appropriate measure of the uncertainty of the flux in each box). The mean (residual) flux in the bridge box is then 39 mJy, and the scatter between boxes is 25 mJy, meaning a non-detection. The 25 mJy scatter between boxes is approximately 7.5 times larger than the fluctuations on a smaller scale caused by large-scale ripples in the image.
The resulting upper limit on the emissivity is given by , where is the volume of the emitting region and the luminosity distance, which is Mpc. For we take the , that is, 75 mJy. The boundary of the bridge is difficult to define. If we assume that the bridge roughly follows the emission detected by eROSITA, the radius of the bridge is about 600 kpc or , and its length is about 1.3 Mpc or (see Fig. 2). If we assume a cylindrical volume of dimensions 1.3 Mpc Mpc)2, we obtain
| (1) | |||||
If we take as in Govoni et al. (2019), one would expect an emissivity at 140 MHz of W Hz-1m-3, which is a factor 1.7 higher than the emissivity derived for the A399-A401 system.
The reasons for a non-detection of synchrotron emission from the bridge region at the level of A399-401, for example, may lie in the absence of any one of the four points mentioned at the beginning of this section. If we assume that the relation between thermal gas density and magnetic field strength found in galaxy clusters is also valid in the intercluster region, we can estimate the magnetic field strength using the observed scaling (Johnson et al., 2020). In cluster centres with electron number densities of cm-3, typical field values of 1-10 G are observed. Consequently, the thermal gas density in the bridge region of A3395-A3391 is cm-3 as inferred from SZ-observations (Sugawara et al., 2017), which would correspond to a magnetic field strength of G. We note that a similar value for the electron density, cm-3 , was inferred from X-ray observations with Chandra and XMM-Newton by Alvarez et al. (2018). In comparison, the electron density inferred for the intercluster filament in the A399-A401 system is cm-3, which is very close to the estimate for A3395-A3391 (Akamatsu et al., 2017). Also, G was found by Govoni et al. (2019) in their simulations of A399-401 and G was found by Brunetti & Vazza (2020) including dynamo amplification.
From the limit on the surface brightness of Jy arcsec-2, one can derive an upper limit on the equipartition magnetic field , where (Govoni & Feretti, 2004)
| (2) | |||||
For , a proton-to-electron energy ratio of , and a source depth of kpc, we get , and consequently G. If we were to detect the bridge at the level of our upper limit then the equivalent equipartition field would be 0.9 G. This is higher than derived from our density-scaling argument, and so it is possible that the magnetic fields are simply too low to be detected.
However, we note that the electron density for A399-401 is only slightly higher, cm-3, but the observed surface brightness of its bridge requires much higher fields than the scaled values.
Brunetti & Vazza (2020) suggest that radio bridges originate from second-order Fermi acceleration of electrons interacting with turbulence. The complex dynamics of substructures associated with massive filaments connecting cluster pairs can generate turbulence even before the two clusters undergo their central merger. Specifically, they explored the role of solenoidal turbulence using a mechanism proposed by Brunetti & Lazarian (2016) where particles interact with magnetic field lines diffusing into super-Alfvenic incompressible turbulent flows.
Provided that the acceleration mechanism in A3391-A3395 is Fermi-II acceleration, the non-detection would imply that the average acceleration time for electrons is longer than the average cooling time; as shown by Brunetti & Vazza (2020), this is independent of the magnetic field in the bridge region. The implication would be that either the turbulent injection scale is larger in A3391-A3395 than in A399-A401 or the turbulent velocity is smaller. We consider the latter to be the most likely because the turbulent injection length should be similar for systems of similar sizes while the turbulent velocity can vary significantly. A smaller turbulent velocity in A3391-A3395 could be motivated by the smaller mass of the system and by the fact that these two systems are separated by a greater distance (in terms of virial radius of the clusters) than that separating A399-A401, possibly meaning that the merger is in a less advanced stage. Also, the A3391-A3395 clusters are less massive than either A1758 or A399-A401. Furthermore, as also briefly mentioned in paper 1, we cannot know the true three-dimensional distance between the systems. It is possible that A3391 and 3395 are much further apart than what is implied by their projection, as is indeed suggested by the X-ray analysis in Reiprich et al. (2020). This would likely result in lower estimates of electron densities, and might also explain the absence of giant radio halos in the constituent clusters, as the occurrence of giant radio halos depends strongly on mass (Cassano, 2010). Given their similarity to A399-A401 in other aspects (both premerging, similar gas densities in the bridge region), the A3391-A3395 system is a promising target for deeper radio observations.
For a more detailed study of the implications of the non-detection, dedicated MHD simulations are needed, such as those recently presented in Locatelli et al. (2020). These latter infer upper limits in LOFAR observations of two cluster pairs, RXCJ1659.7+3236-RXCJ1702.7+3403 and RXCJ1155.3+2324-RXCJ1156.9+2415, yielding upper limits on the magnetic field in the intercluster region of G. Using cosmological simulations, these latter authors infer primordial magnetic fields of less than 10 nG.
4.2 Other notable radio features
In addition to the absence of diffuse emission in the intercluster bridges, the environment of this unusual cluster-pair field shows a number of very interesting sources that are worth cataloguing given the potential impact of the cluster system. By no means is this a complete sample, as it was compiled by identifying extended objects by eye. The field contains a number of candidates for diffuse radio emission that will need to be followed up with deeper X-ray and radio observations. In addition, the field contains a number of Giant Radio Galaxies (GRGs) of which all but one lie in the background of this cluster pair. The exception is the FR I radio galaxy J0621–5647 in the far south, at the same as the
cluster pair. Polarisation measurements of these GRGs could be interesting for rotation-measure studies of the magnetic fields in the double cluster region (Pratley et al., 2013; Stuardi et al., 2020). Finally, there are some other notable radio galaxies that show signs of interaction with the ICM of A3391-A3395, such as the wide-angle tail source F2 as well as the radio galaxy F1. The latter shows lobes that are transversally advected, which may be caused by the galaxy falling into the cluster (see Fig. 1).
Table 3 lists the measurements of flux density, , and spectral index, , for radio sources in the A3391-A3395 cluster field. Flux density was measured within a region marking the 3 contour line using a local rms value for . To measure the spectral index of specific sources or source regions (except for S3), we convolved the ASKAP-DD image to the same resolution as our tapered MWA-2 observations. For S3, to ensure S2 and S3 were resolved enough for flux-density measurements, we use the native resolution ASKAP-DD image and the robust 0.0 MWA-2 images. We do not measure S2 directly with the MWA-2 data as the diffuse emission becomes resolved out in the robust 0.0 MWA-2 images. We used fluxtools.py to measure the flux density and error on the flux density when considering the rms. The uncertainties are calculated taking into account the image noise and flux-scale errors as follows,
| (3) |
where is the number of independent beams covering the source, is the flux-scale error for the EMU observation, and for the MWA-2 observations. The spectral index is estimated by fitting the flux densities of the sources to a power law as a function of the observed frequency.
| EMU ES | Our label | Host name | Redshift | Extent of radio lobes | ||
|---|---|---|---|---|---|---|
| name | (in Fig. 3) | LAS | LLS | Comments | ||
| [arcmin] | [kpc] | |||||
| J0626–5341 | N1 | ESO 161-IG 007 NED02 | 0.0551 | 5.35 | 346 | FR I in A3391 |
| J0626–5433 | S1 | WISEA J062649.57–543234.4 | 0.0520 | 6.07 | 372 | PKS 0625–545, in A3395 |
| J0626–5432 | S2 | – ? | – | 5.52 | – | relic/remnant in A3395 |
| J0625–5427 | S3 | WISEA J062557.04–542750.4 ? | 0.0603 | 3.25 | 229 | remnant/relic in A3395 |
| J0622–5334 | F1 | WISEA J062255.56–533434.5 | 0.0567 | 5.71 | 379 | asym. FR II?, PMN 0622–5334 |
| J0621–5241 | F2 | 2MASX J06214330–5241333 | 0.0511 | 6.21 | 374 | WAT, PKS 0620–52 |
| J0632–5404 | F3 | WISEA J063201.16–540457.4 | 0.193 | 5.80 | 1117 | FR II plume |
| Source | ASKAP-DD | rms () | MWA-2 | MWA-2 | MWA-2 | MWA-2 | MWA-2 | ASKAP-DD |
| 1013 MHz | local | 88 MHz | 118 MHz | 154 MHz | 185 MHz | 216 MHz | 1013 MHz | |
| [mJy] | [Jy/beam] | [Jy] | [Jy] | [Jy] | [Jy] | [Jy] | [Jy] | |
| N1 | 50 | |||||||
| S1 | 50 | |||||||
| S2 | 48 | - | - | c | c | c | - | |
| S3 | 48 | - | - | - | ||||
| S2S3 | 48 | |||||||
| F1 | 30 | - | ||||||
| F2 | 40 | |||||||
| F3 | 26 |
Notes. Convolved to a resolution of arcsec arcsec to match the tapered MWA-2 images, which results in an additional contribution from nearby but faint point sources. S2 and S3 are convolved together in the tapered and 88–118 MHz MWA-2 images. c Residual flux density after subtracting S3 from S2S3.
4.2.1 Source N1 (EMU ES J0626–5341)
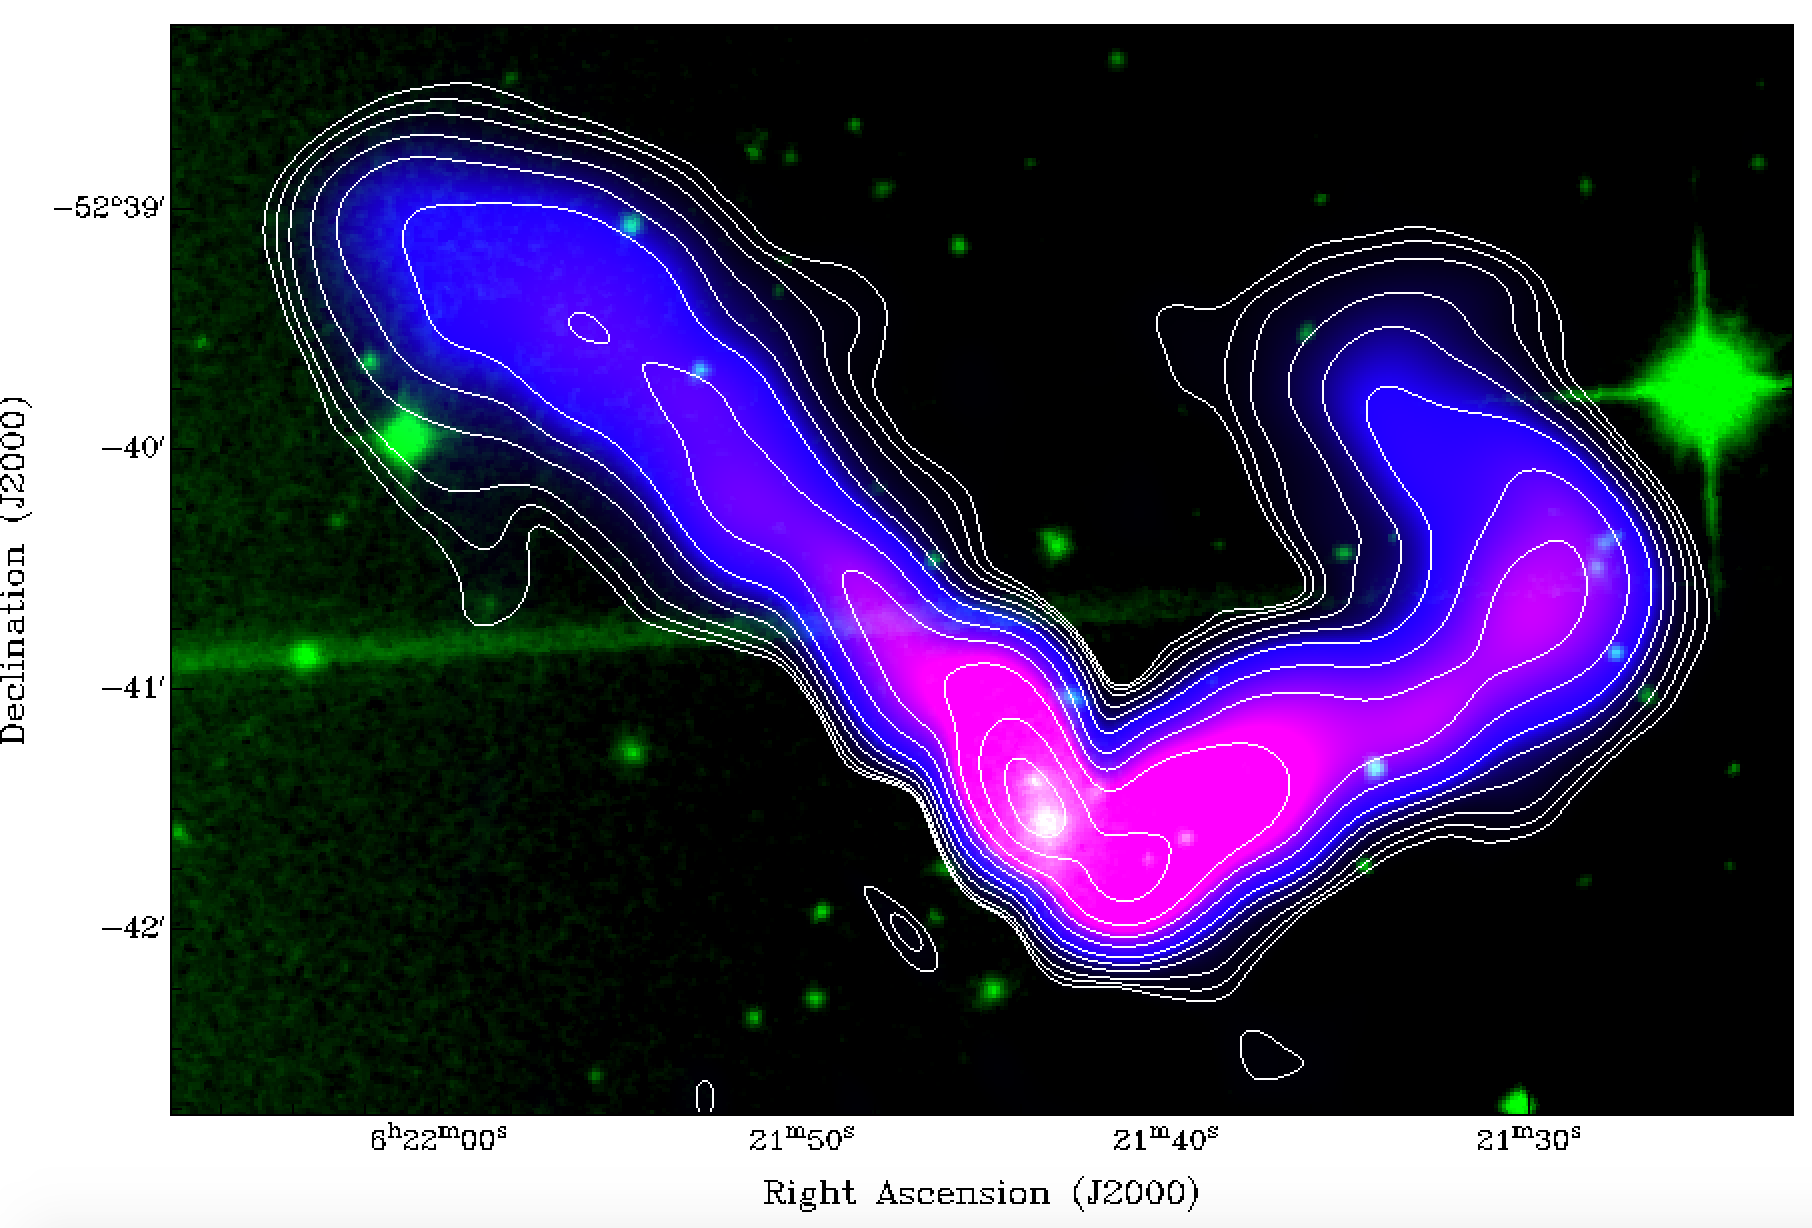
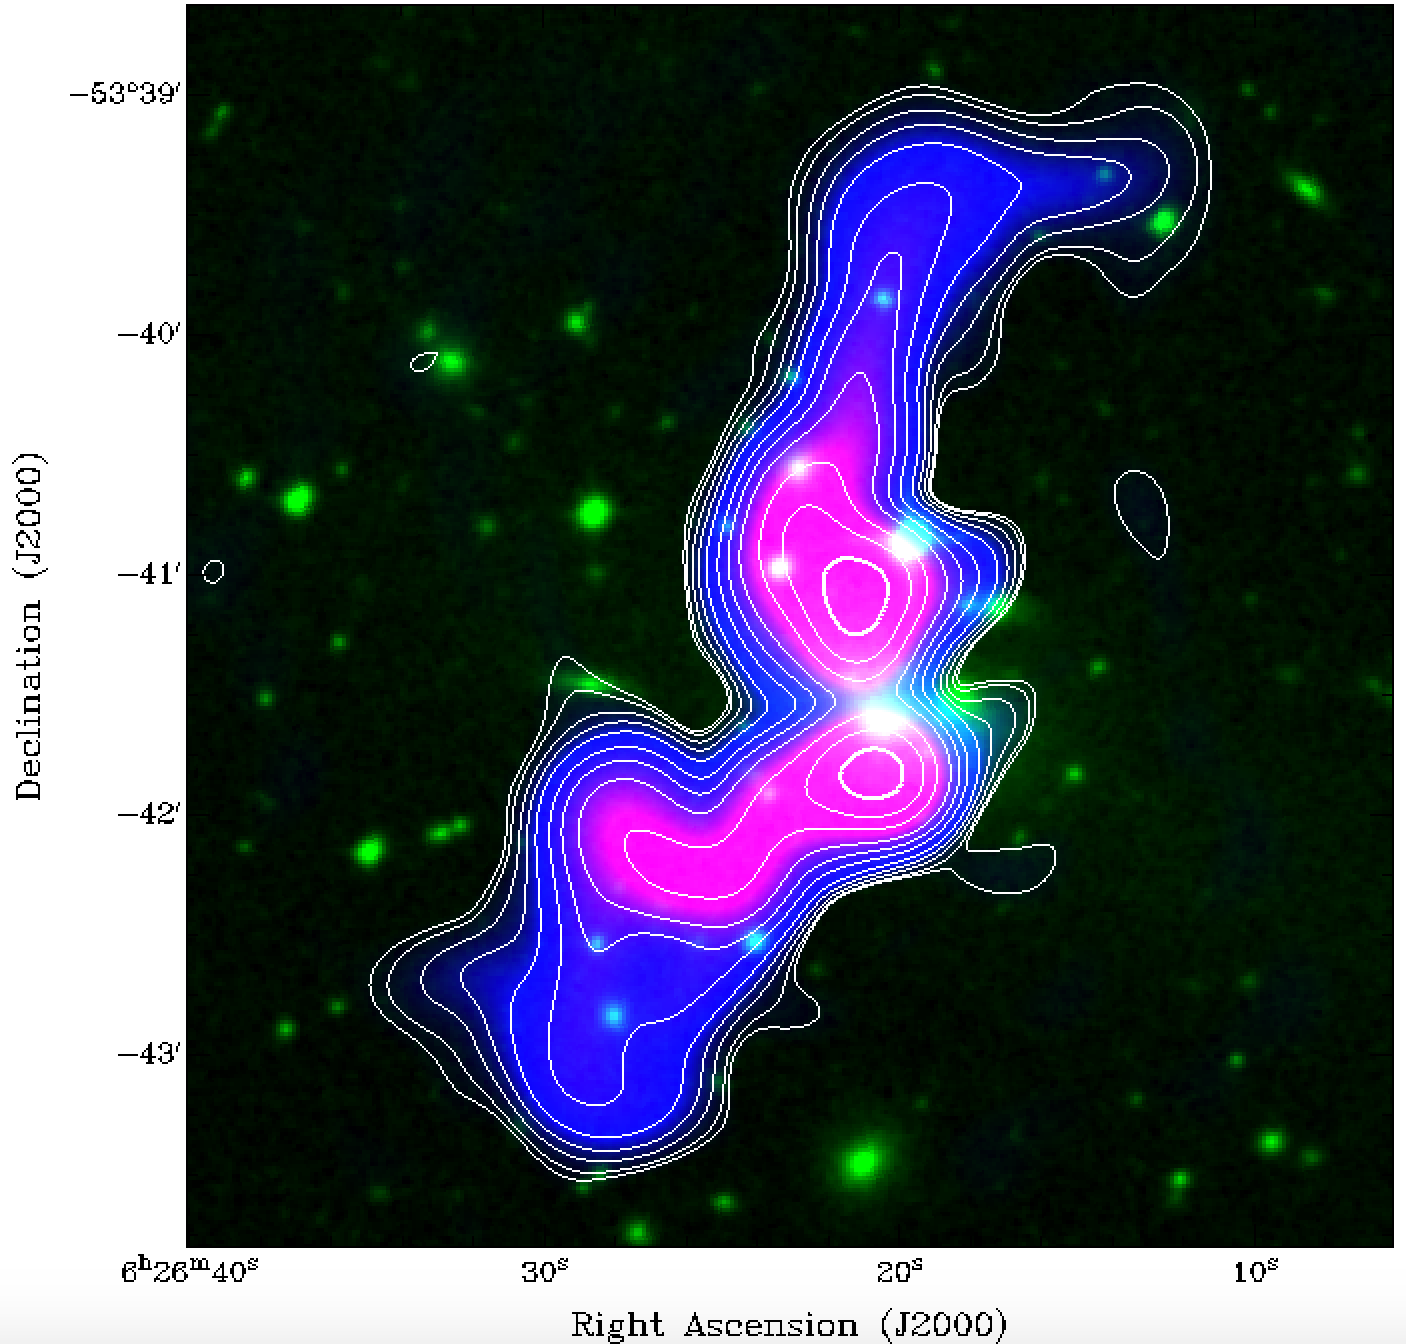
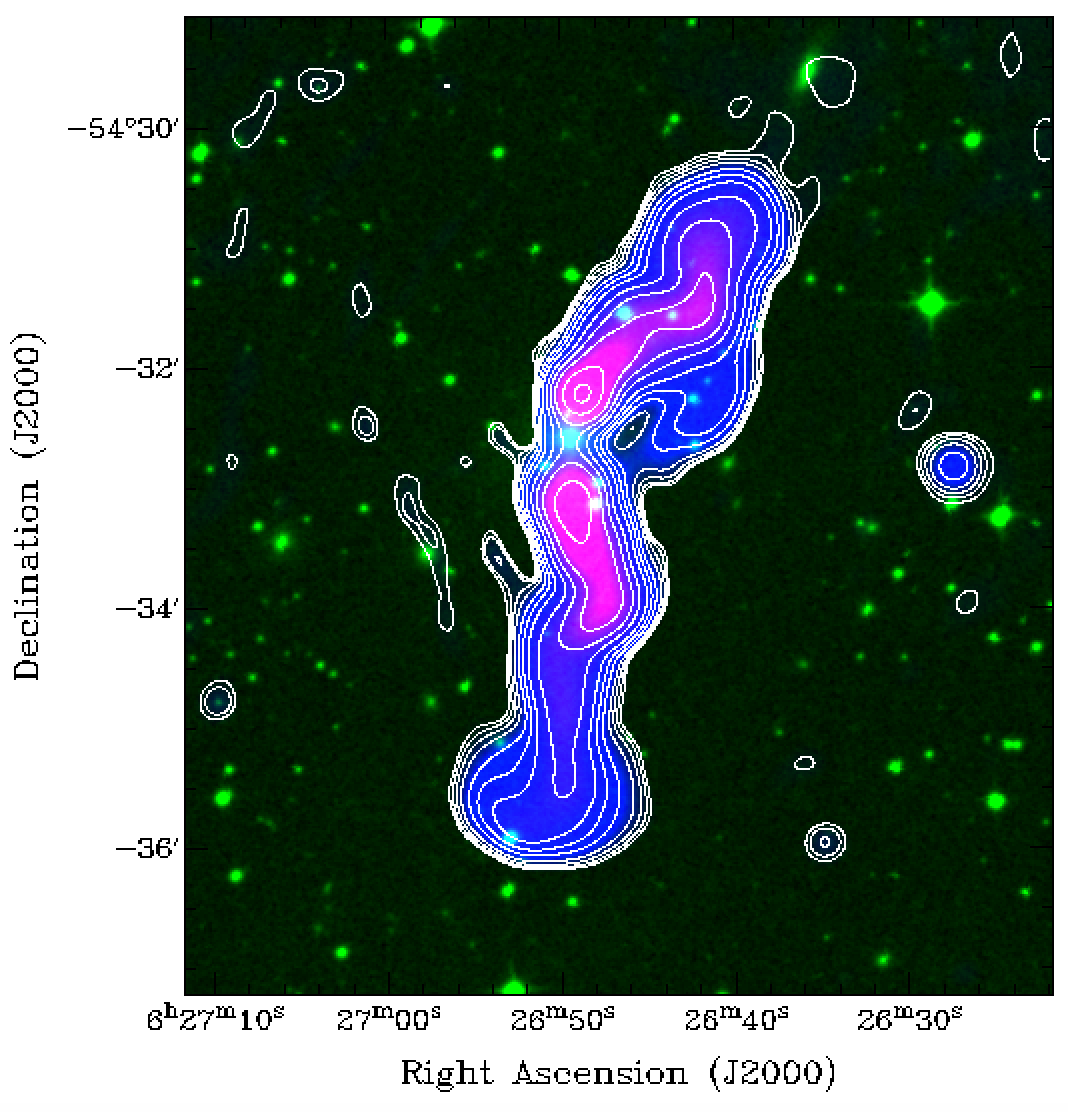
The bright radio galaxy EMU ES J0626–5341 (EMU ES: Evolutionary Map of the Universe Early Science Source) is located in the centre of the Abell 3391 cluster and extends over 4.5 arcmin (see Fig. 5). It is also located at the centre of the X-ray emission (see Fig. 7). Its host is the elliptical galaxy 2MASX J06262045–5341358 ( = 54°), which is the eastern component of ESO 161-G008, with a redshift of = 0.055. We estimate a linear projected radio size of 290 kpc. The radio lobes show numerous twists possibly due to density variations in the ICM.
4.2.2 Source S1 (EMU ES J0626–5432)
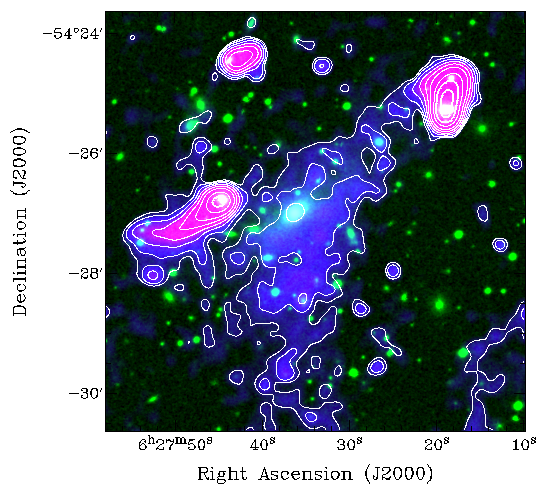
The bright radio galaxy EMU ES J0626–5432 (PKS 0625–545) is a Fanaroff-Riley class I (FR I) (Fanaroff & Riley, 1974) source located in the centre of the A3395 cluster and extends over 5.5 arcmin (see Fig. 5). Its host galaxy is WISEA J062649.57–543234.4 ( = 0.052). Radio fluxes from 145 MHz to 8.5 GHz as well as 148 GHz are listed in NED. The SUMSS 843 MHz flux is catalogued as 5 Jy and the Australia Telescope Compact Array (ATCA) 1.4 GHz flux as 3.1 Jy (Lakhchaura et al., 2011). To the south, just as it starts to exit the denser X-ray gas (see Fig. 6), the tip of the radio jet starts to expand spherically and the brightness of the emission drops. This could be the onset of the formation of an X-ray cavity. Comparison with the eROSITA data also shows that the BCG is offset from the centroid of the X-ray emission (see Fig. 7). This was studied by Lauer et al. (2014); De Propris et al. (2020) for example. In X-ray groups in COSMOS, we showed that BCGs can be offset from the group centre (Gozaliasl et al., 2019). This has also been studied in HIFLUGCS clusters (Zhang et al., 2011).
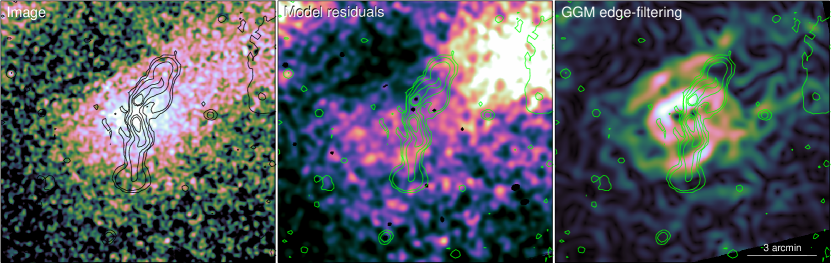
The interaction of the radio source with the surrounding ICM can be seen in more detail in a Chandra X-ray image of the region. After reprocessing the Chandra observation (OBSID 4944), images and exposure maps were created, and point sources were masked. Figure 6 shows the smoothed exposure-corrected image, the fractional difference from a model created from the radial average, and an edge-filtered X-ray image made using using the GGM algorithm (Sanders et al., 2016b, a). There is some indication of a depression in the X-ray surface brightness in the region of the round, southern tip, but it is of low significance (Lakhchaura et al., 2011). The northern tip appears to end where there is an excess of emission in the smooth model residual map. The edge-filtered map confirms that the two ends of the radio source are located where there are steep gradients in the X-ray surface brightness. There is also a clear connection between the structure within the radio source and the X-ray gradient filtered image.
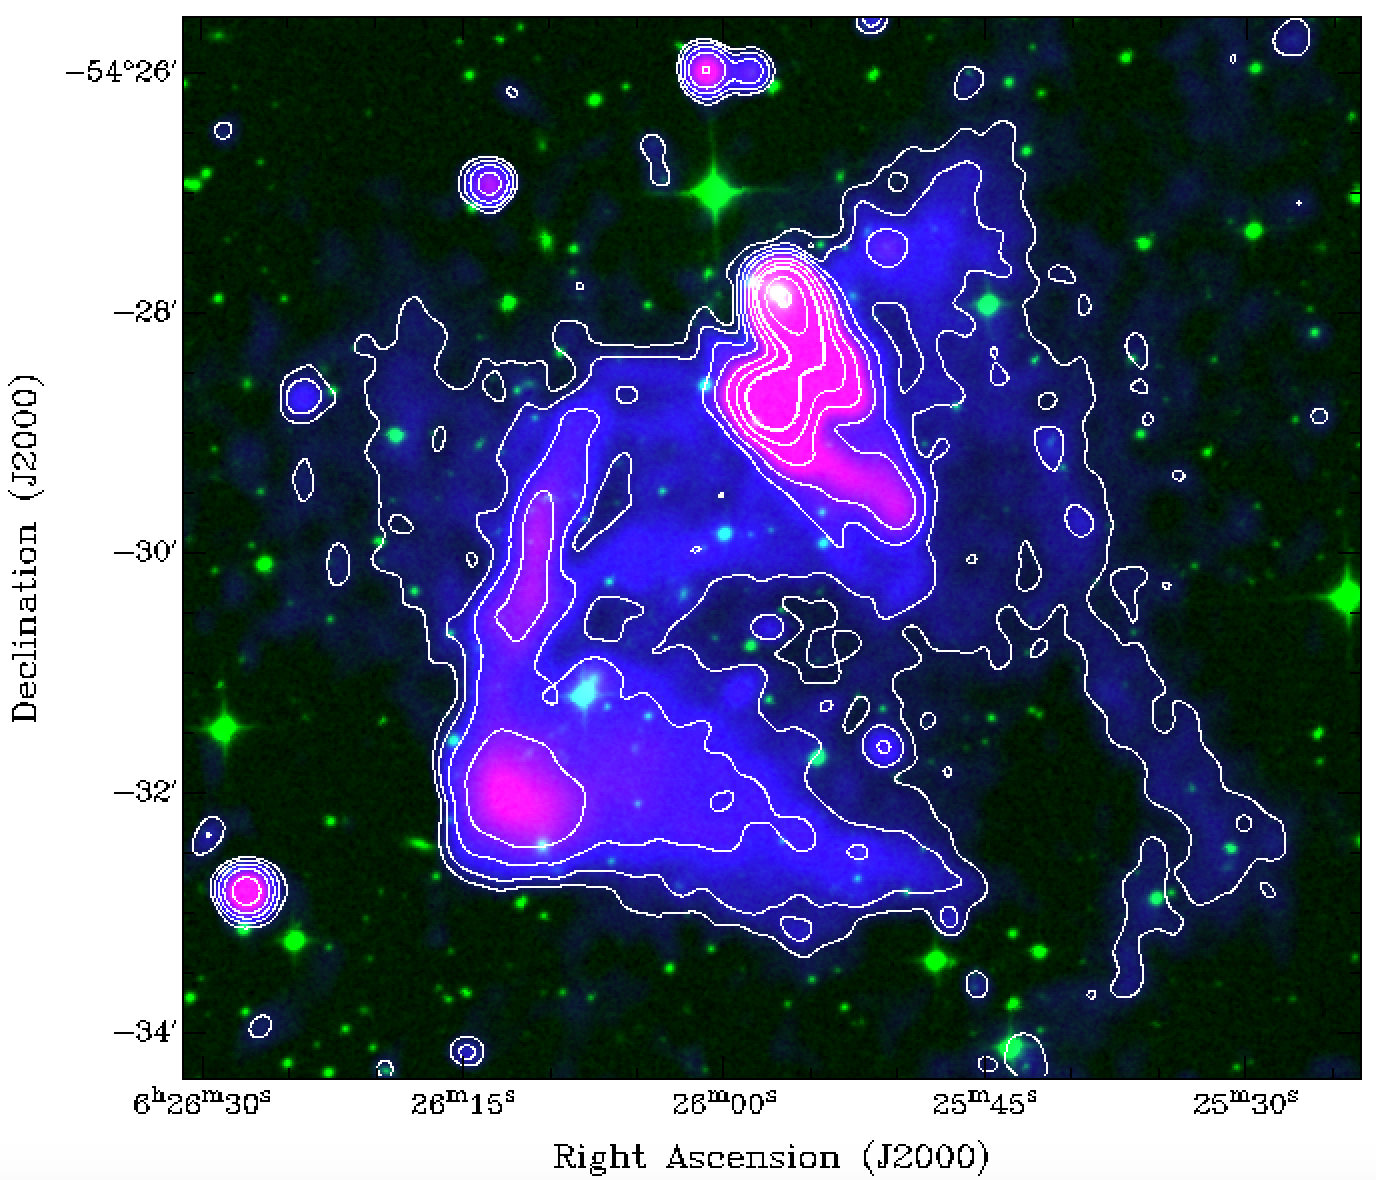
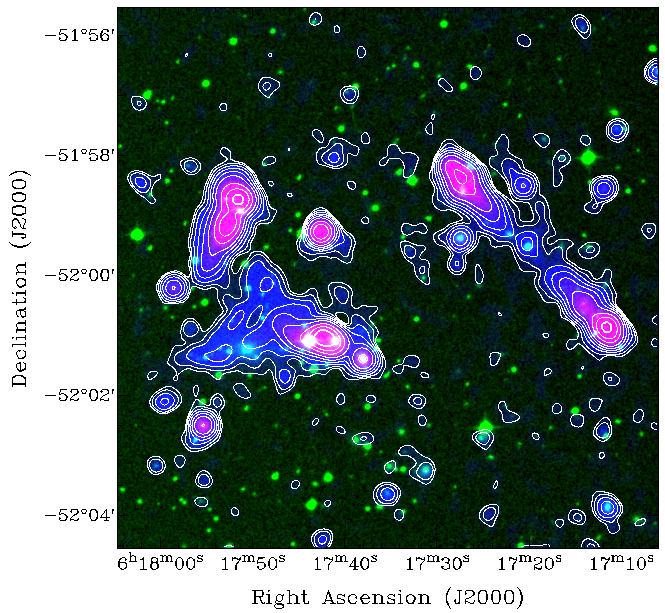
4.3 Source S2+S3
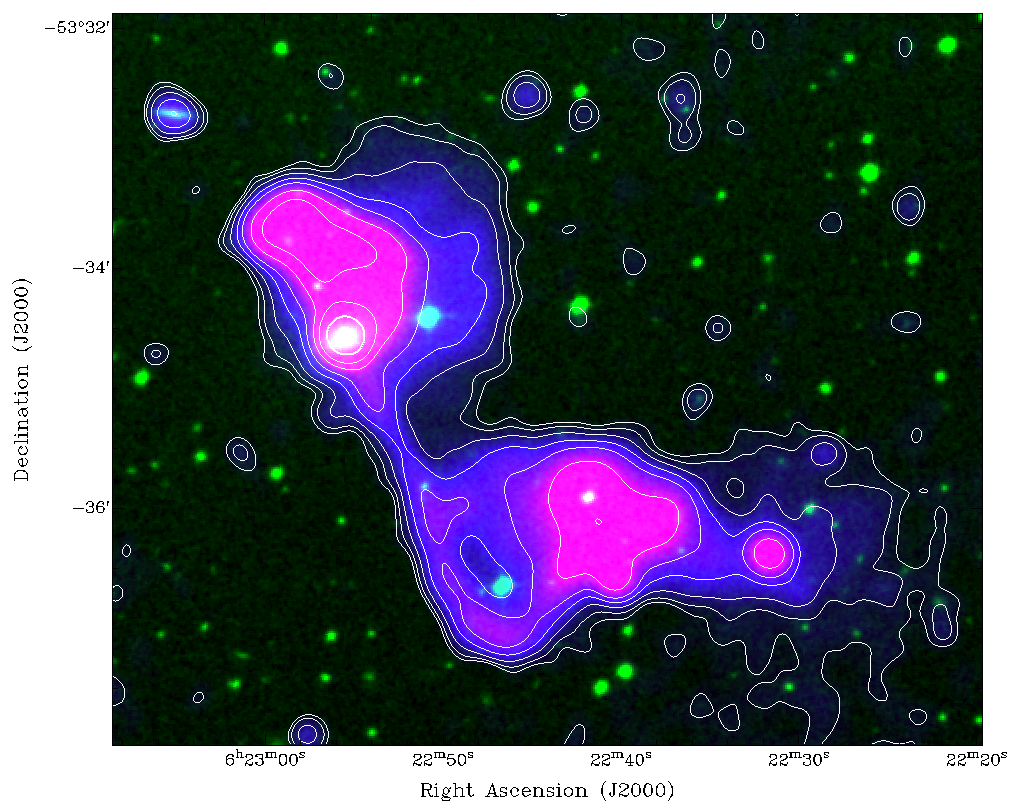
The sources S2 and S3 form a complex conglomerate of radio galaxies and interconnected diffuse emission (see Fig. 5). The integrated spectral index between 88 MHz and 1013 MHz is . Figure 5 shows an overlay of the S2-S3 complex over the optical DSS2 R-band image. The L-shaped source S2 is fed by the radio galaxy 2MASX J06261051-5432261 that fans out into two arms towards the north and the west that are roughly perpendicular to one another. The arms extend for about 4 arcmin. There are further faint filaments of emission that stretch out to the source S3.
From the brightest spot close to the galaxy 2MASX J06255706-5427502, the source S3 extends to the northwest before it turns to form a faint, linear source that extends for about 6 arcmin towards the southwest. This could be a radio relic or phoenix that shows re-acceleration of plasma that may originate from an AGN. Interestingly, the southern part of this linear feature lies in a high-temperature region as indicated by the oxygen-to-softband ratio in the eROSITA data (see Fig. 18 in Reiprich et al. 2020). It is not clear whether this region corresponds to a shock or is merely a region of higher pressure that could boost the synchrotron emission from old radio plasma that may have come from a radio galaxy.
4.4 Source F1 (EMU ES J0622–5334)
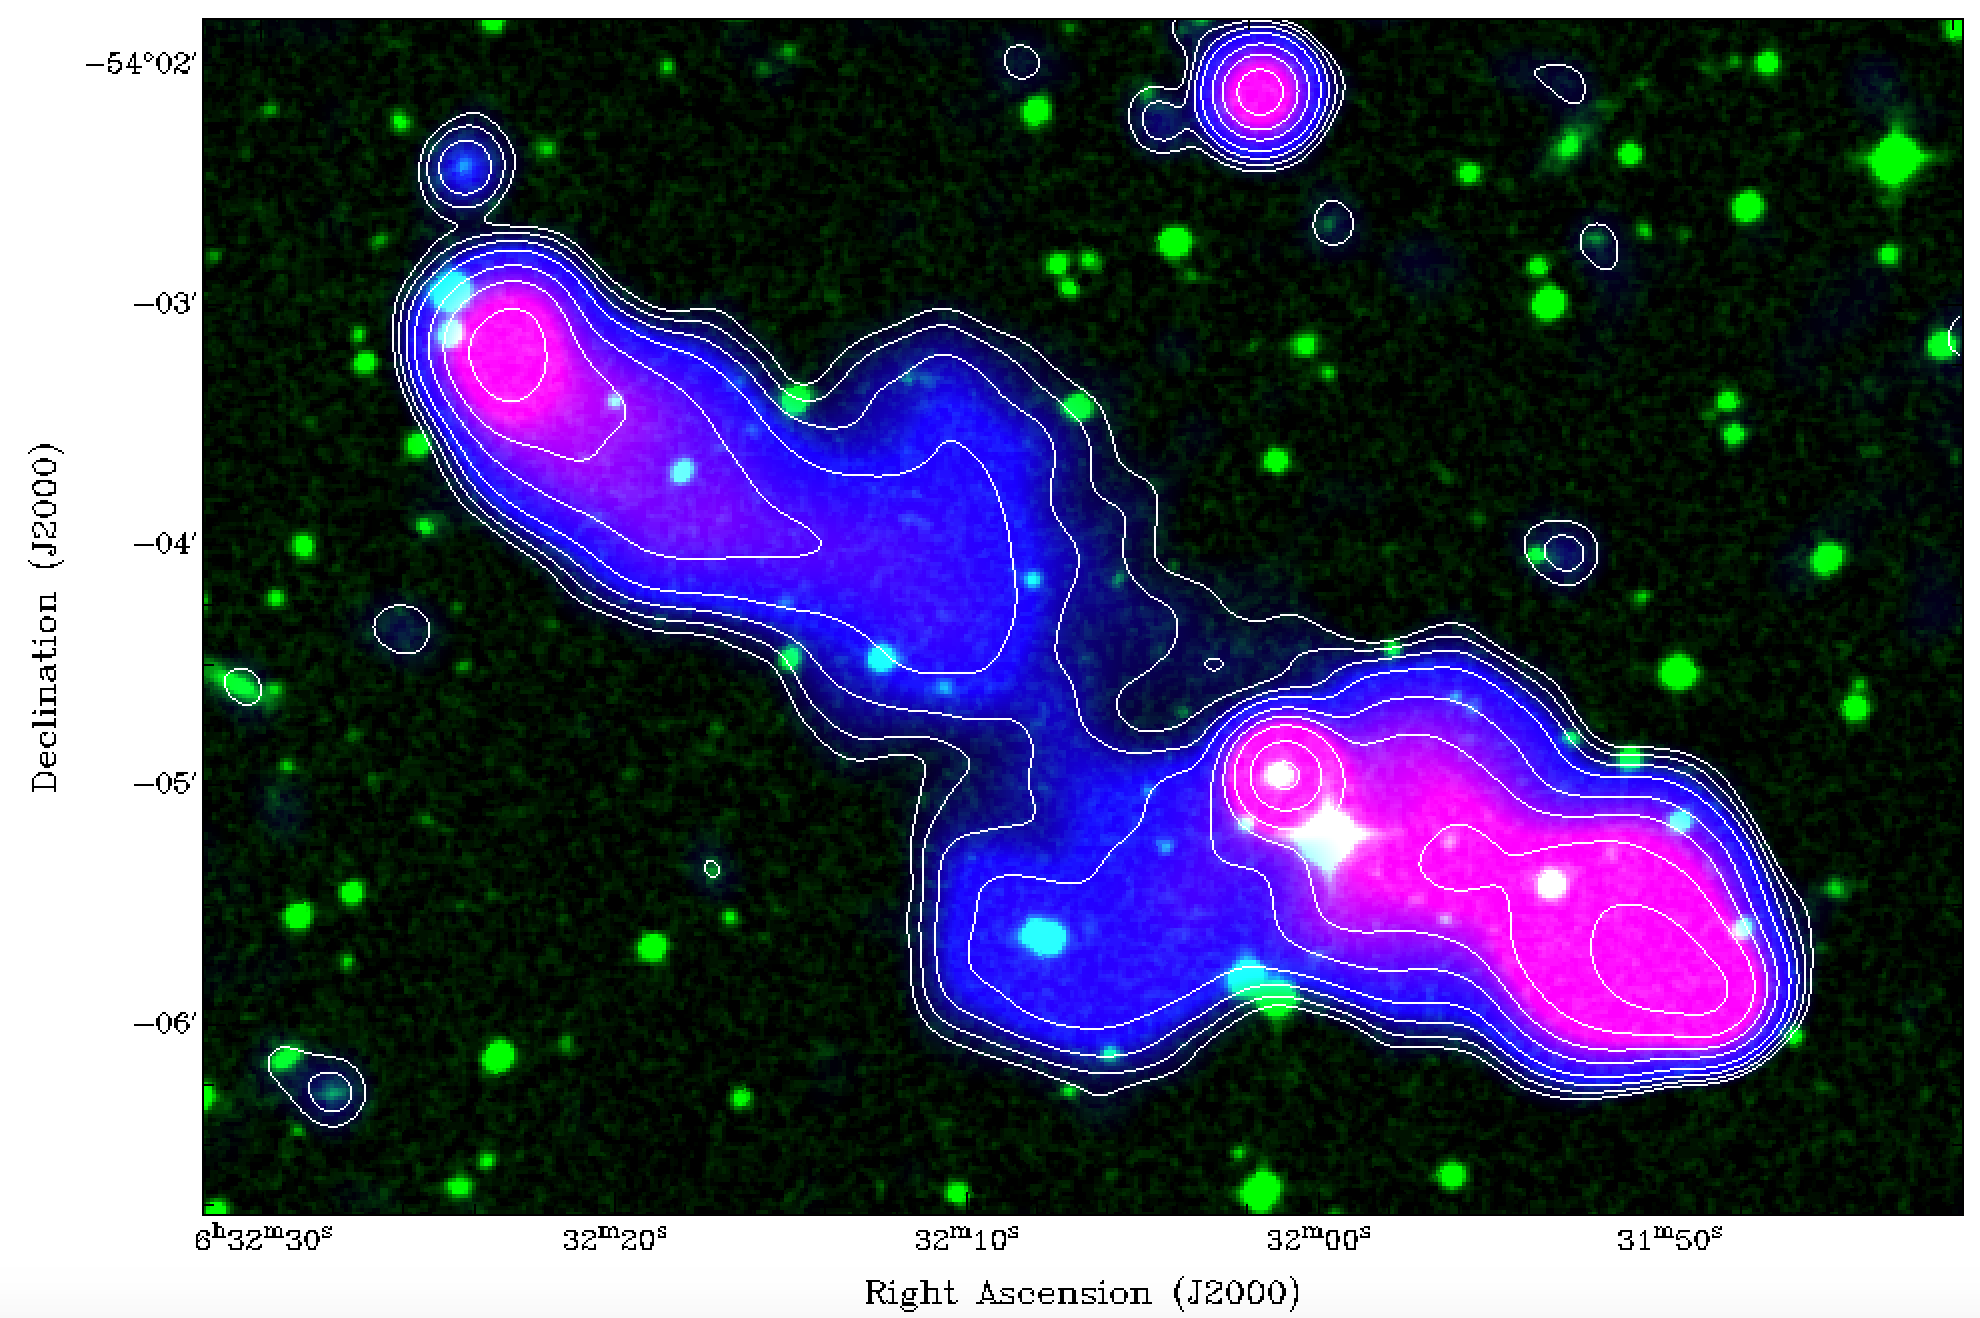
EMU ES J0622–5334 (PMN 0622–5334) is a large, rather asymmetric radio galaxy with Fanaroff-Riley class I morphology in Abell S0584 (see Fig. 5). Its host galaxy is WISEA J062255.56–533434.5 at = 0.0567. The radio lobes extend over 6 arcmin, corresponding to 400 kpc. The SUMSS 843 MHz flux of PMN 0622–5334 is catalogued as mJy, likely not including the low-surface brightness emission. The 4.85 GHz flux is catalogued as mJy (Wright et al., 1996).
4.5 Source F2 (EMU ES J0621–5241)
EMU ES J0621–5241 (PKS 0620–52) is a large wide-angle tail (WAT) radio galaxy (see Fig. 5) which is located far beyond the virial radius of A3391 and could be infalling into the system. Its host galaxy is 2MASX J06214330–5241333 at = 0.0511. It is associated with RX J0621.6–5241. The two radio lobes have extents of 4 arcmin (NE; 240 kpc) and 2.5 arcmin (NW; 150 kpc).
4.6 Source F3 (EMU ES J0632–5404)
EMU ES J0632–5404 is a GRG with an FR II morphology extending 5.8 arcmin (see Fig. 5) along a position angle of °. Its host galaxy is the quasi-stellar object (QSO) WISEA J063201.16–540457.4, 6dFGS gJ063201.2–540458, SWIFT J0632.1–5404 for which Perlman et al. (1998) measured a redshift of , while Saripalli et al. (2005) measured . Comparing both spectra we believe the former redshift (0.193) to me more reliable, and therefore find an LLS of 1.12 Mpc. Saripalli et al. (2005) measure a 843 MHz flux of 694 mJy. This source is also GLEAM J063153-540527 with a low-frequency spectral index of -0.88, and so ASKAP may show more of the extended emission as the spectrum seems to flatten above 800 MHz. The 4.85 GHz flux from PMN (source J0631-5405) is Jy, resulting in a spectral index of , in agreement with low frequencies. The host is also listed as blazar BZQ J0632-5404 by Massaro et al. (2009).
4.7 Large and Giant Radio Galaxies
Based on visual inspection of the whole 30 deg2 field for radio galaxies, we identified close to 200 objects larger than 1 arcmin. Of these, 27 are GRGs with linear projected sizes greater than 1 Mpc (7 of these are presently still candidate GRGs). Only a single one was already known, namely J0632-5404, published as SGRS J0631–5405 by Saripalli et al. (2005). A further 30 radio galaxies not listed in the present paper are larger than 700 kpc (of which 7 are candidate GRGs).
Giant Radio Galaxies are thought to reside in low-density environments where the jets face little resistance. However, about 10 percent of GRGs have now been found to reside in cluster environments. According to Dabhade et al. (2020a), about 820 GRGs larger than 0.7 Mpc are known to date. However, owing to their large extent and low surface brightness, they are notoriously difficult to detect. Using Data Release 1 of LoTSS, Dabhade et al. (2020b) found 239 GRGs (there, defined as galaxies with LLS Mpc) in 424 deg2 of sky, albeit in a frequency range of 120–168 MHz. For galaxies with LLS Mpc, we obtain a sky density of deg-2, while Dabhade et al. (2020b) found 239/424 = 0.55 deg-2, three times less than our value.
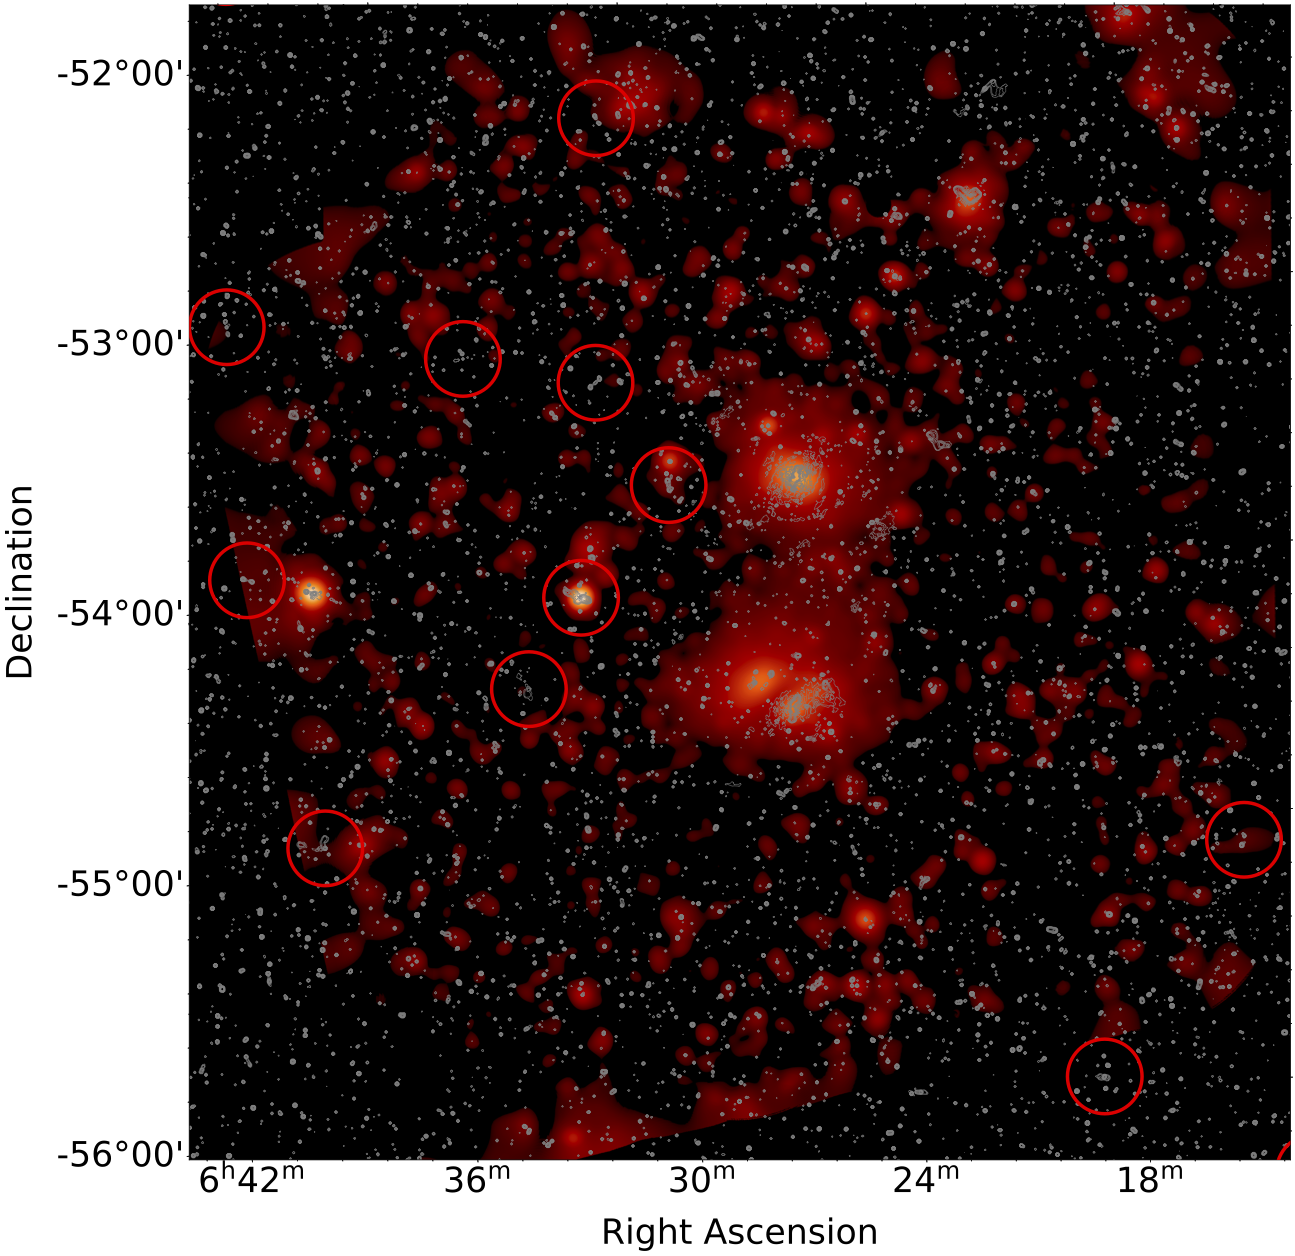
Those GRGs larger than 1 Mpc that we identify in this field are listed in Table 4. The GRGs in the area of the ASKAP field covered also by eROSITA are marked in Fig. 8, and radio-optical overlays for a subset of GRGs are shown in Fig. 9. Photometric redshifts were taken from Bilicki et al. (2016) and from Zou et al. (2019). We measured the flux densities, , of the GRGs listed in Table 4 within a region marking the 2 contour line using the local rms for . We used fluxtools.py to measure the flux density and error on the flux density when considering the rms.
During our search we also identified a number of relics and cluster halos (see Table 5). In order to identify the respective host galaxies we used optical and infrared surveys, in particular the Dark Energy Survey (DES; Abbott et al. (2020)), 2MASS (Skrutskie et al. (2006)), and WISE (Wright et al. (2010)). In the following we briefly describe some of the most remarkable objects.
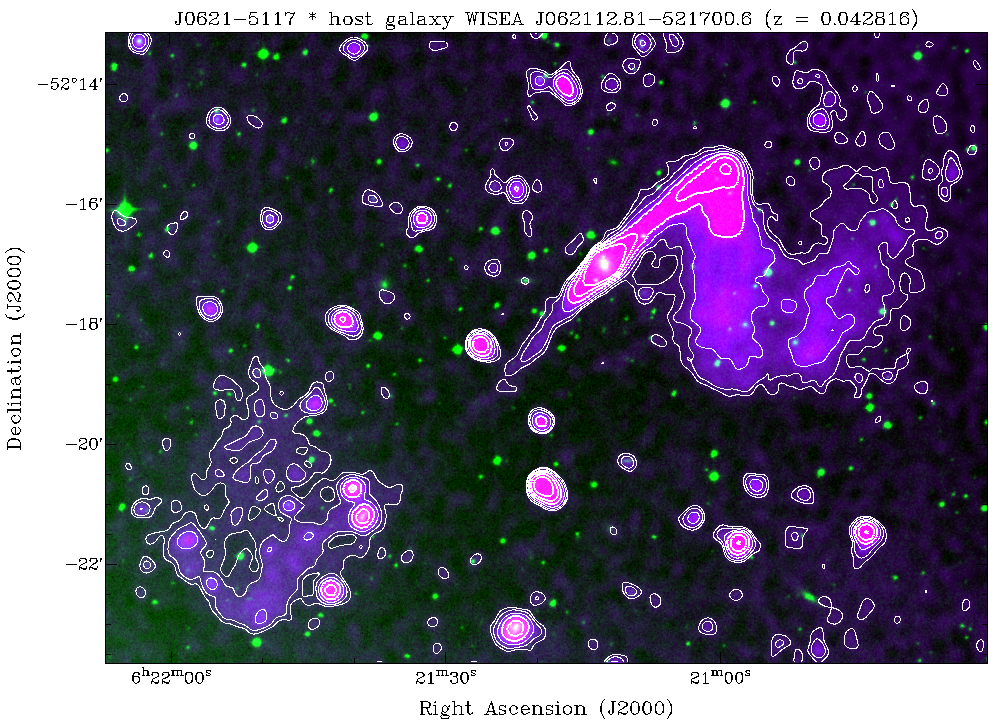
4.7.1 EMU ES J0621–5217
EMU ES J0621–5217 is an FR I-type radio galaxy with LAS arcmin with a radio core of 18.2 mJy/beam peak brightness, inner twin jets, and evidence for precession given the shape of its outermost lobes (see Fig. 9, left panel). It is highly asymmetric, likely due to projection effects, with the western lobe much brighter and closer to the core than the eastern lobe. We identify the host galaxy as WISEA J062112.81–521700.6 ( = 0.042816; 6dF Jones et al. (2009)). The projected linear extent of J0621–5217 is 760 kpc. This galaxy is located in the foreground of A3395-A3391.

4.7.2 EMU ES J0644–5152
EMU ES J0644–5152 has the largest LLS of all GRGs catalogued in this field with radio lobes extending nearly 5 arcmin and FR II morphology. Its host galaxy is SMSS J064437.48–515205.5, possibly a QSO, with a photometric redshift of as estimated from the WISE colours (see Fig. 2 in Krogager et al. 2018). We estimate its largest linear size (LLS) as 2.15 Mpc.
4.7.3 EMU ES J0639–5455
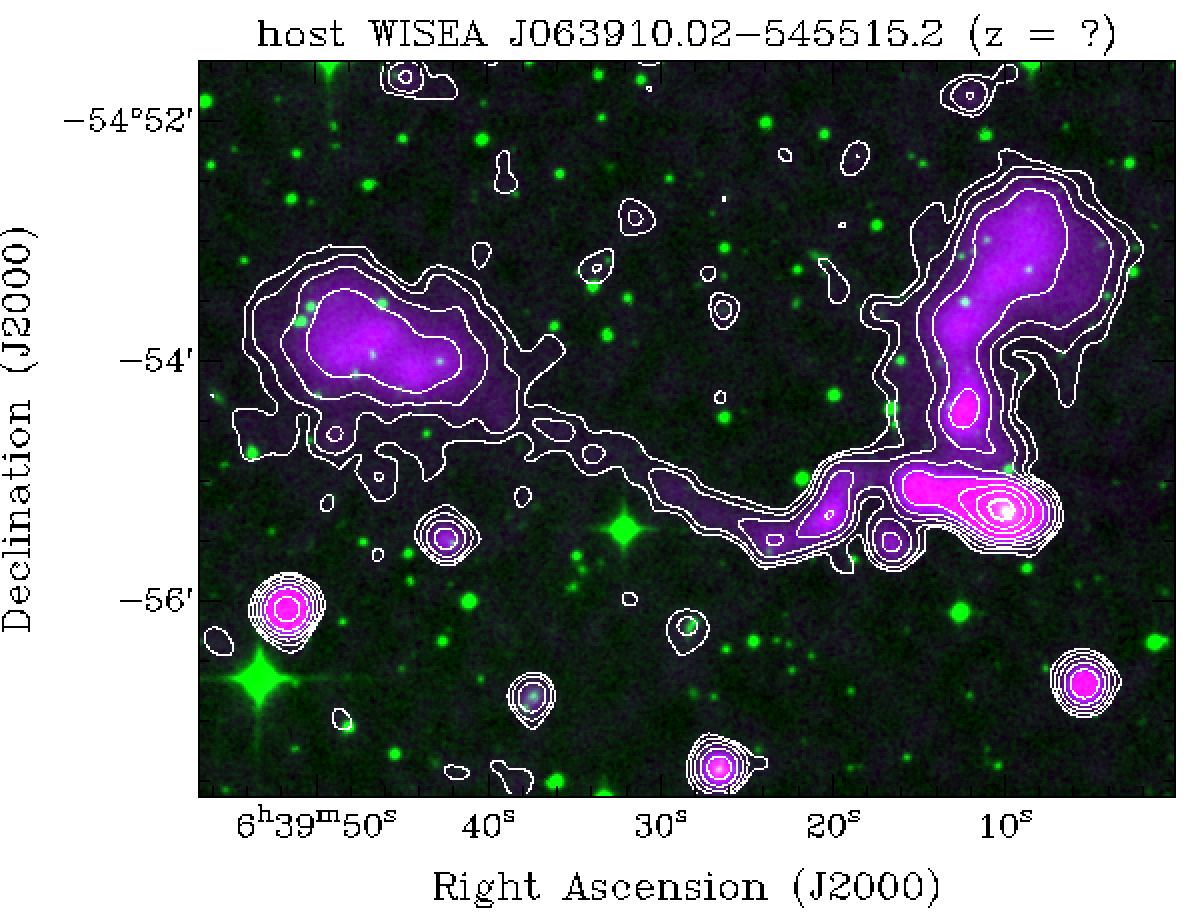
EMU ES J0639–5455 is a GRG with a rather unusual, WAT-like morphology (see Fig. 9, right panel). Its host galaxy (2MASX J06391009–5455156, WISEA J063910.02–545515.2) is located at the radio-brightest spot in the far WSW and has a photometric redshift of 0.142, thus well behind A3391-A3395 (Bilicki et al., 2016). We measure an angular extent of 7.15 arcmin, corresponding to a projected linear extent of 1.07 Mpc, a size very rarely seen for sources of this radio morphology.
4.7.4 EMU ES J0621–5647
EMU ES J0621–5647 is a FR I-type GRG, possibly extending at least 15 arcmin and possibly 32 arcmin (see Fig. 9). Higher radio sensitivity is required to confirm the presence and extent of its faint radio lobes due ESE and WNW. We identify 2MASX J06215057–5647566 as the host galaxy at a redshift of (6dF). EMU ES J0621–5647 lies at the southern edge of the ASKAP field, but at the same redshift as A3391/3395. If the outer lobes are confirmed, the LLS of J0621–5647 is 2 Mpc.
4.7.5 Summary of Giant Radio Galaxy properties
In Table 4 we list the basic properties of the 20 GRGs (LLS 1 Mpc) and 7 candidate GRGs found in the ASKAP field. Here we compare some of these properties with 213 GRGs larger than 1 Mpc as compiled from the literature by Kuźmicz et al. (2018). While the median redshift of the latter GRGs is 0.248, our 27 GRGs have a median of 0.6, albeit with the caveat that only two of them have spectroscopic redshifts.
We adjust the 1.4-GHz radio luminosities listed in Kuźmicz et al. (2018) to the ASKAP observing frequency of 1.0 GHz by assuming an average radio spectral index of , which implies a 1-GHz flux 1.3 times larger than the 1.4-GHz flux, or . While the 213 GRGs from the literature have a median [W/Hz]=25.6, our 27 GRGs have a median [W/Hz]=25.5, and the two distributions are statistically indistinguishable, ranging from 23.3 to 27.4. Consistent with the literature sample we find no trend for the median linear size or the median radio luminosity to change with redshift. Together with the fact that our much smaller sample has a much larger median redshift, we conclude that there is no evidence for cosmological evolution of the population of GRGs.
If we exclude four GRGs with complex or hybrid radio morphologies from our sample of 27 and divide the rest into three classes of radio morphology, we find median values of [W/Hz]=24.0 for the 3 FR Is, 24.5 for 7 FR IIs with remnant-type lobes, and 26.1 for the 15 clear-cut FR IIs.
4.8 Diffuse radio sources
We discovered a number of candidate diffuse radio sources in the ASKAP field which are listed in Table 5. The data are not sufficient for a reliable classification but we discuss the most interesting sources below. The diffuse sources in the cluster A3404 are the subject of a forthcoming paper and are not discussed here.
4.8.1 Abell S0592
Wilber et al. (2020) detected a giant radio halo in the nearby cluster Abell S0592 ( = 0.2216), also known as SPT CL J0553–3342 and MACS J0553.4–3342, using the same Early Science data used here. The radio halo has a diameter of about 1 Mpc and an integrated flux density of mJy. The diffuse emission is also seen in ATCA data at 2.215 GHz.
4.8.2 Abell 3395E
We find extended radio emission associated with the bright elliptical galaxy ESO 161-G008 ( = 0.0486), the central galaxy of A3395E. This could be diffuse emission from a radio halo, although image artefacts in that area make the full size of the structure difficult to assess. Three other cluster ellipticals in the area also have radio emission with significant tails: WISEA J062744.63–542644.4 (PGC 019090; = 0.044281) has a tail of 2 arcmin in length towards the east, while DES J062719.2–542515.24 ( = 0.0456) has a tail of 1 arcmin pointing north and 2MASS J06274388–5424266 ( = 0.044971) has a short tail in the NW direction. The aforementioned galaxies lie within the X-ray cocoon of the cluster, which is aligned with and centred on ESO 161-G008. There are at least 40 known cluster members within 5 arcmin of ESO 161-G008.
4.8.3 Abell 3385
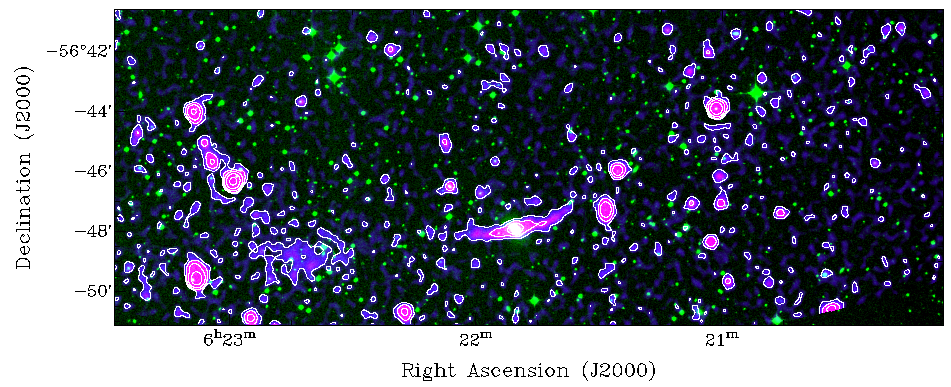
We find diffuse emission in Abell 3385 ( = 0.1245; 6df) also known as 1RXS J061747.8–520132. This emission lies right at the NW edge of the eROSITA FOV. North of the 1RXS position is a bright radio source that appears to connect to two faint strands of radio emission that run from the NW to the SE. The angular length of the filaments is 2 arcmin which corresponds to 270 kpc. The flux density of this diffuse source is mJy. This source is likely to be a radio relic. Finally, on the right (W) half of the bottom-right panel in Fig. 10 we see the regular and straight FR II source hosted by DES J061722.22-515919.1, a likely member of A3385, with , LAS, and LLS kpc.
4.8.4 Abell 3397
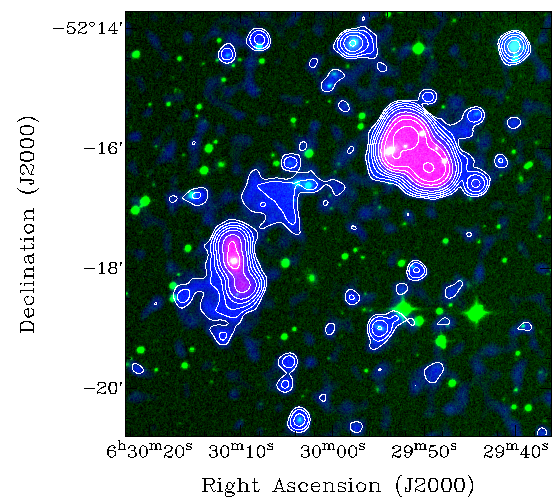
A3397 is a poorly studied galaxy cluster that is located north of A3391-A3395 with no published redshift, but the 6dF redshift survey (Jones et al., 2009) shows seven galaxies with mean measured redshift (A3397A) and four others with (A3397A) within one Abell radius (1.7) from the Abell centre (Chow-Martínez et al., 2014). One more galaxy, 2MASX J062940.23-521418.5, with a redshift measured by Lauer et al. (2014), makes a total of eight spectroscopic members of A3397A with a velocity dispersion of km s-1 based on the BIweight scale of ROBUST (Beers et al., 1990). The eROSITA image shows an extension towards the west that is indicative of a merger in the east–west direction. The X-ray image also shows an extension towards the north. An extended radio source lies on the western side of the X-ray peak with hints of diffuse emission (see Fig. 10, top right panel) and appears to be composed of several components; its LAS is 1.4 arcmin which corresponds to an LLS of 600 kpc at . The flux density of this source is Jy. The nature of the source is unclear.
4.8.5 EMU ED J0624-5414
The source sits in a patch of diffuse radio emission whose angular extent is about 4 arcmin. The redshift of WISEA J0624-5414 is . It appears as two connected bars of emission that stretch from the SE to the NW. The main blob in the northern part of the structure extends for about 1.8 arcmin before it fades quite abruptly. The flux density of this source is Jy and there is no counterpart in the eROSITA image. This source is likely to be a radio halo (see Fig. 10, upper left panel).
| EMU ES | Host name | Redshift | Extent of radio lobes | (1013 MHz) | Radio | |||
|---|---|---|---|---|---|---|---|---|
| Name | (J2000) | type | LAS | LLS | mJy | morphology | ||
| [′] | [Mpc] | |||||||
| J0644–5152 | SMSS J064437.48–515205.5 | 0.75 p | 4.89 | 2.15 | 25.6 | FR II | ||
| J0621–5647 | 2MASX J06215057–5647566 | 0.0539s | 32? | 2.0? | † | 23.3 | FR I/II remn., WAT? | |
| J0608–5409 | DES–J060805.04–540918.2 | 1.2 p | 3.7 | 1.84 | 26.2 | FR II | ||
| J0634–5309 | DES J063428.15–530928.4 | 0.34 p | 5.6 | 1.6 | † | 24.2 | FR II remn. | |
| J0612–5157 | DES–J061215.47–515738.1 | 0.7 e | 3.7 | 1.59 | 26.0 | FR I/II | ||
| J0613–5117 | DES–J061339.02-511703.5 | 1.8 e | 3.1 | 1.57 | 25.9 | FR II asym. | ||
| J0639–5136 | VHS J063919.22–513652.1 | 0.45 e | 4.16 | 1.44 | 25.5 | FR II | ||
| J0640–5257 | WISEA J064013.78–525702.2 | 0.6 e | 3.57 | 1.43 | 25.1 | FR II relic | ||
| J0633–5424 | 2MASX J06333235–5424190 | 0.165 p | 7.65 | 1.30 | 24.2 | FR I | ||
| J0613–5621 | DES J061337.62–562114.6 | 0.35 p | 4.3 | 1.27 | † | 24.5 | FR I/II remn. | |
| J0629–5341 | DES J062935.40–534124.4 | 1.65 p | 2.48 | 1.26 | 27.2 | FR II | ||
| J0636–5616 | DES J063633.92–561635.6 | 0.6 e | 3.06 | 1.23 | 25.2 | FR II | ||
| J0641–5136 | SMSS J064130.39–513602.7 | 0.395 p | 3.67 | 1.18 | 24.5 | FR I/II | ||
| J0619–5558 | DES J061909.04–555843.7 | 1.3 p | 2.33 | 1.17 | 26.9 | FR II cpx | ||
| J0630–5218 | DES J063043.12–521821.2 | 1.8 p | 2.27 | 1.15 | 26.5 | FR II | ||
| J0610–5412 | DES–J061042.30–541225.8 | 0.8 e | 2.5? | 1.13? | † | 24.5 | FR II? | |
| J0631–5317 | DES J063113.59–531719.6 | 0.45 e | 3.27 | 1.13 | 25.3 | FR II | ||
| J0615–5506 | DES–J061518.25-550647.5 | 1.015 p | 2.33 | 1.13 | 26.4 | FR II, no core? | ||
| J0632–5404 | 6dFGS gJ063201.2–540458 | 0.193 s | 5.80 | 1.12 | 25.8 | FR II plume | ||
| J0649–5501 | SMSS J064947.02–550109.6 | 0.20 p | 5.49 | 1.09 | 25.6 | FR II, X-shaped | ||
| J0640–5353 | WISEA J064024.95–535347.1 | 0.8 e | 2.38 | 1.07 | 26.3 | FR II | ||
| J0621–5638 | DES J062133.55–563822.9 | 0.321 e | 3.7? | 1.03 | † | 24.2 | FR II remn. | |
| J0625–5137 | DES–J062522.66–513750.1 | 0.6 e | 2.5 | 1.00 | 24.5 | FR II remn. | ||
| J0639–5455 | 2MASX J06391009–5455156 | 0.142 p | 7.15 | 1.07 | 24.5 | FR I | ||
| J0615–5136 | 2MASX J06153812–5136193 | 0.126 p | 7.9 | 1.07 | 24.3 | FR II relic | ||
| J0634–5644 | WISEA J063429.02-564436.0 | 1.2 e | 2.06 | 1.02 | 26.4 | FR II | ||
| J0636–5646 | DES J063630.11-564617.7 | 0.832 p | 2.32 | 1.06 | 26.4 | FR II | ||
| EMU ES | centre position | redshift | extent | ||||
|---|---|---|---|---|---|---|---|
| Name | type | [arcmin] | [kpc] | type | comments | ||
| J0617–5201 | WISEA J061750.63–520113.8 | 0.1245 | s | 4? | 550 | cluster relics | A3385 |
| J0624–5411 | WISEA J062447.61–540939.6 ? | 0.0490 | s | 2.5? | 150? | relic or halo ? | A3395 substructure |
| J0627–5426 | ESO 161-G008 | 0.0486 | s | 3? | 170? | radio halo? | A3395E |
| J0628–5448 | … | ? | 3+ | 200? | relic | in A3395 ? | |
| J0630–5216 | WISEA J063003.92–521634.0 | 0.0765 | p | 4? | ? | ? | A3397A ? |
| ” | WISEA J063002.67–521636.3 | 0.0874 | p | ” | ? | ? | A3397B ? |
| J0638–5358 | PSZ2 G263.14-23.41 | 0.2220 | s | 3 | 650 | radio halo | AS0592 |
| J0645–5413 | 2MASX J06452948–5413365 | 0.1670 | s | 5? | 850 | radio halo + NATs | A3404 |
5 Conclusions
We present 1 GHz radio observations of the pre-merging system of galaxy clusters A3391-A3395 with ASKAP/EMU. Accompanying eROSITA observations of this system yield the best large-scale X-ray characterisation of the emission bridge between A3391 and A3395 to date (Reiprich et al., submitted).
We do not detect diffuse radio emission in the X-ray bridge between these two clusters. Provided that the acceleration mechanism is Fermi-II acceleration, the non-detection implies that the turbulent velocity in this system is smaller than in the A399-401 system, possibly because of the smaller mass. This is something that can be verified with the future ATHENA X-ray mission (Nandra et al., 2013).
Moreover, we find a plethora of other interesting radio sources in a 30 deg2 field around A3391-A3395. We identified around 200 objects extending over more than 1 arcmin. Of these, we present a list of 27 that are GRGs with linear projected sizes of greater than 1 Mpc (see Table 4). This surface density is four times that found by Dabhade et al. (2020b) who find about 0.2 GRGs (LLS Mpc per deg2 based on LoTSS DR1. For galaxies with LLS Mpc, we obtain a sky density of deg-2, three times higher than previously reported (Dabhade et al., 2020b). The 1.4-GHz luminosities of our sample of GRGs are consistent with distributions found in the literature. Our sample shows no evidence in support of cosmological evolution of the GRG population.
Finally, we identify seven candidates for radio relics and halos, which we list in Table 5 together with previously published examples (Wilber et al., 2020). It will be important to follow these up with deeper observations and to make spectral index maps in order to classify the sources and understand their origin. This will be the subject of future work.
Acknowledgements.
This work is based on data from eROSITA, the primary instrument aboard SRG, a joint Russian-German science mission supported by the Russian Space Agency (Roskosmos), in the interests of the Russian Academy of Sciences represented by its Space Research Institute (IKI), and the Deutsches Zentrum für Luft- und Raumfahrt (DLR). The SRG spacecraft was built by Lavochkin Association (NPOL) and its subcontractors, and is operated by NPOL with support from the Max Planck Institute for Extraterrestrial Physics (MPE). The development and construction of the eROSITA X-ray instrument was led by MPE, with contributions from the Dr. Karl Remeis Observatory Bamberg & ECAP (FAU Erlangen-Nürnberg), the University of Hamburg Observatory, the Leibniz Institute for Astrophysics Potsdam (AIP), and the Institute for Astronomy and Astrophysics of the University of Tübingen, with the support of DLR and the Max Planck Society. The Argelander Institute for Astronomy of the University of Bonn and the Ludwig Maximilians Universität Munich also participated in the science preparation for eROSITA. The eROSITA data shown here were processed using the eSASS software system developed by the German eROSITA consortium. The Australian SKA Pathfinder is part of the Australia Telescope National Facility which is managed by CSIRO. Operation of ASKAP is funded by the Australian Government with support from the National Collaborative Research Infrastructure Strategy. ASKAP uses the resources of the Pawsey Supercomputing Centre. Establishment of ASKAP, the Murchison Radio-astronomy Observatory and the Pawsey Supercomputing Centre are initiatives of the Australian Government, with support from the Government of Western Australia and the Science and Industry Endowment Fund. We acknowledge the Wajarri Yamatji people as the traditional owners of the Observatory site. The Australia Telescope Compact Array (/ Parkes radio telescope / Mopra radio telescope / Long Baseline Array) is part of the Australia Telescope National Facility which is funded by the Australian Government for operation as a National Facility managed by CSIRO. This paper includes archived data obtained through the Australia Telescope Online Archive (http://atoa.atnf.csiro.au). This work was supported by resources provided by the Pawsey Supercomputing Centre with funding from the Australian Government and the Government of Western Australia. We acknowledge and thank the builders of ASKAPsoft. Support for the operation of the MWA is provided by the Australian Government (NCRIS), under a contract to Curtin University administered by Astronomy Australia Limited. MB acknowledges support from the Deutsche Forschungsgemeinschaft under Germany’s Excellence Strategy - EXC 2121 ”Quantum Universe” - 390833306. HA benefited from grant CIIC 90/2020 of Universidad de Guanajuato, Mexico. AB and DNH acknowledge support from the ERC StG DRANOEL 714245. AB acknowledges support from the MIUR grant FARE ”SMS”. SWD acknowledges an Australian Government Research Training Program scholarship administered through Curtin University. LR receives support from the U.S. National Science Foundation grant AST17-14205 to the University of Minnesota. The authors made use of the database CATS (Verkhodanov et al., 2005) of the Special Astrophysical Observatory.References
- Abbott et al. (2020) Abbott, T. M. C., Aguena, M., Alarcon, A., et al. 2020, Phys. Rev. D, 102, 023509
- Akamatsu et al. (2017) Akamatsu, H., Fujita, Y., Akahori, T., et al. 2017, A&A, 606, A1
- Alvarez et al. (2018) Alvarez, G. E., Randall, S. W., Bourdin, H., Jones, C., & Holley-Bockelmann, K. 2018, ApJ, 858, 44
- Beers et al. (1990) Beers, T. C., Flynn, K., & Gebhardt, K. 1990, AJ, 100, 32
- Bilicki et al. (2016) Bilicki, M., Peacock, J. A., Jarrett, T. H., et al. 2016, ApJS, 225, 5
- Bock et al. (1999) Bock, D. C. J., Large, M. I., & Sadler, E. M. 1999, AJ, 117, 1578
- Botteon et al. (2019) Botteon, A., Cassano, R., Eckert, D., et al. 2019, A&A, 630, A77
- Botteon et al. (2018) Botteon, A., Shimwell, T. W., Bonafede, A., et al. 2018, MNRAS, 478, 885
- Botteon et al. (2020) Botteon, A., van Weeren, R. J., Brunetti, G., et al. 2020, MNRAS
- Brown & Rudnick (2011) Brown, S. & Rudnick, L. 2011, MNRAS, 412, 2
- Brüggen et al. (2005) Brüggen, M., Ruszkowski, M., Simionescu, A., Hoeft, M., & Dalla Vecchia, C. 2005, ApJ, 631, L21
- Brüggen & Vazza (2020) Brüggen, M. & Vazza, F. 2020, MNRAS, 493, 2306
- Brunetti & Jones (2014) Brunetti, G. & Jones, T. W. 2014, International Journal of Modern Physics D, 23, 1430007
- Brunetti & Lazarian (2016) Brunetti, G. & Lazarian, A. 2016, MNRAS, 458, 2584
- Brunetti & Vazza (2020) Brunetti, G. & Vazza, F. 2020, Phys. Rev. Lett., 124, 051101
- Cassano (2010) Cassano, R. 2010, A&A, 517, A10
- Chapman et al. (2017) Chapman, J. M., Dempsey, J., Miller, D., et al. 2017, in Astronomical Society of the Pacific Conference Series, Vol. 512, Astronomical Data Analysis Software and Systems XXV, ed. N. P. F. Lorente, K. Shortridge, & R. Wayth, 73
- Chow-Martínez et al. (2014) Chow-Martínez, M., Andernach, H., Caretta, C. A., & Trejo-Alonso, J. J. 2014, MNRAS, 445, 4073
- Condon et al. (1998) Condon, J. J., Cotton, W. D., Greisen, E. W., et al. 1998, AJ, 115, 1693
- Dabhade et al. (2020a) Dabhade, P., Mahato, M., Bagchi, J., et al. 2020a, A&A, 642, A153
- Dabhade et al. (2020b) Dabhade, P., Röttgering, H. J. A., Bagchi, J., et al. 2020b, A&A, 635, A5
- De Propris et al. (2020) De Propris, R., West, M. J., Andrade-Santos, F., et al. 2020, MNRAS
- Duchesne et al. (2020) Duchesne, S. W., Johnston-Hollitt, M., Zhu, Z., Wayth, R. B., & Line, J. L. B. 2020, PASA, 37, e037
- Fanaroff & Riley (1974) Fanaroff, B. L. & Riley, J. M. 1974, MNRAS, 167, 31P
- Flaugher et al. (2015) Flaugher, B., Diehl, H. T., Honscheid, K., et al. 2015, The Astronomical Journal, 150, 150
- Forman et al. (1981) Forman, W., Bechtold, J., Blair, W., et al. 1981, ApJ, 243, L133
- Fujita et al. (2008) Fujita, Y., Tawa, N., Hayashida, K., et al. 2008, PASJ, 60, S343
- Girardi et al. (1997) Girardi, M., Escalera, E., Fadda, D., et al. 1997, ApJ, 482, 41
- Govoni & Feretti (2004) Govoni, F. & Feretti, L. 2004, International Journal of Modern Physics D, 13, 1549
- Govoni et al. (2019) Govoni, F., Orrù, E., Bonafede, A., et al. 2019, Science, 364, 981
- Gozaliasl et al. (2019) Gozaliasl, G., Finoguenov, A., Tanaka, M., et al. 2019, MNRAS, 483, 3545
- Guzman et al. (2019) Guzman, J., Whiting, M., Voronkov, M., et al. 2019, ASKAPsoft: ASKAP science data processor software
- Hodgson et al. (2020) Hodgson, T., Johnston-Hollitt, M., McKinley, B., Vernstrom, T., & Vacca, V. 2020, PASA, 37, e032
- Hurley-Walker et al. (2017) Hurley-Walker, N., Callingham, J. R., Hancock, P. J., et al. 2017, MNRAS, 464, 1146
- Johnson et al. (2020) Johnson, A. R., Rudnick, L., Jones, T. W., Mendygral, P. J., & Dolag, K. 2020, ApJ, 888, 101
- Johnston et al. (2008) Johnston, S., Taylor, R., Bailes, M., et al. 2008, Experimental Astronomy, 22, 151
- Jones et al. (2009) Jones, D. H., Read, M. A., Saunders, W., et al. 2009, MNRAS, 399, 683
- Kim et al. (1989) Kim, K. T., Kronberg, P. P., Giovannini, G., & Venturi, T. 1989, Nature, 341, 720
- Krogager et al. (2018) Krogager, J. K., Gupta, N., Noterdaeme, P., et al. 2018, ApJS, 235, 10
- Kuźmicz et al. (2018) Kuźmicz, A., Jamrozy, M., Bronarska, K., Janda-Boczar, K., & Saikia, D. J. 2018, ApJS, 238, 9
- Lakhchaura et al. (2011) Lakhchaura, K., Singh, K. P., Saikia, D. J., & Hunstead, R. W. 2011, ApJ, 743, 78
- Lauer et al. (2014) Lauer, T. R., Postman, M., Strauss, M. A., Graves, G. J., & Chisari, N. E. 2014, ApJ, 797, 82
- Massaro et al. (2009) Massaro, E., Giommi, P., Leto, C., et al. 2009, A&A, 495, 691
- Mauch et al. (2003) Mauch, T., Murphy, T., Buttery, H. J., et al. 2003, MNRAS, 342, 1117
- Nandra et al. (2013) Nandra, K., Barret, D., Barcons, X., et al. 2013, arXiv e-prints, arXiv:1306.2307
- Norris et al. (2011) Norris, R. P., Hopkins, A. M., Afonso, J., et al. 2011, PASA, 28, 215
- Offringa et al. (2014) Offringa, A. R., McKinley, B., Hurley-Walker, N., et al. 2014, MNRAS, 444, 606
- Offringa & Smirnov (2017) Offringa, A. R. & Smirnov, O. 2017, MNRAS, 471, 301
- Offringa et al. (2016) Offringa, A. R., Trott, C. M., Hurley-Walker, N., et al. 2016, MNRAS, 458, 1057
- Perlman et al. (1998) Perlman, E. S., Padovani, P., Giommi, P., et al. 1998, AJ, 115, 1253
- Piffaretti et al. (2011) Piffaretti, R., Arnaud, M., Pratt, G. W., Pointecouteau, E., & Melin, J. B. 2011, A&A, 534, A109
- Planck Collaboration et al. (2013) Planck Collaboration, Ade, P. A. R., Aghanim, N., et al. 2013, A&A, 550, A134
- Pratley et al. (2013) Pratley, L., Johnston-Hollitt, M., Dehghan, S., & Sun, M. 2013, MNRAS, 432, 243
- Predehl et al. (2020) Predehl, P., Andritschke, R., Arefiev, V., et al. 2020, A&A, submitted
- Sanders et al. (2016a) Sanders, J. S., Fabian, A. C., Russell, H. R., Walker, S. A., & Blundell, K. M. 2016a, MNRAS, 460, 1898
- Sanders et al. (2016b) Sanders, J. S., Fabian, A. C., Taylor, G. B., et al. 2016b, MNRAS, 457, 82
- Saripalli et al. (2005) Saripalli, L., Hunstead, R. W., Subrahmanyan, R., & Boyce, E. 2005, AJ, 130, 896
- Schuecker et al. (2001) Schuecker, P., Böhringer, H., Reiprich, T. H., & Feretti, L. 2001, A&A, 378, 408
- Shimwell et al. (2017) Shimwell, T. W., Röttgering, H. J. A., Best, P. N., et al. 2017, A&A, 598, A104
- Skrutskie et al. (2006) Skrutskie, M. F., Cutri, R. M., Stiening, R., et al. 2006, AJ, 131, 1163
- Smirnov & Tasse (2015) Smirnov, O. M. & Tasse, C. 2015, MNRAS, 449, 2668
- Sokolowski et al. (2017) Sokolowski, M., Colegate, T., Sutinjo, A. T., et al. 2017, PASA, 34, e062
- Stuardi et al. (2020) Stuardi, C., O’Sullivan, S. P., Bonafede, A., et al. 2020, A&A, 638, A48
- Sugawara et al. (2017) Sugawara, Y., Takizawa, M., Itahana, M., et al. 2017, PASJ, 69, 93
- Tasse (2014) Tasse, C. 2014, A&A, 566, A127
- Tasse et al. (2018) Tasse, C., Hugo, B., Mirmont, M., et al. 2018, A&A, 611, A87
- Tingay et al. (2013) Tingay, S. J., Goeke, R., Bowman, J. D., et al. 2013, PASA, 30, 7
- Tittley & Henriksen (2001) Tittley, E. R. & Henriksen, M. 2001, ApJ, 563, 673
- van Weeren et al. (2019) van Weeren, R. J., de Gasperin, F., Akamatsu, H., et al. 2019, Space Sci. Rev., 215, 16
- Vazza et al. (2017) Vazza, F., Brüggen, M., Gheller, C., et al. 2017, Classical and Quantum Gravity, 34, 234001
- Vazza et al. (2019) Vazza, F., Ettori, S., Roncarelli, M., et al. 2019, A&A, 627, A5
- Venturi et al. (1990) Venturi, T., Giovannini, G., & Feretti, L. 1990, AJ, 99, 1381
- Verkhodanov et al. (2005) Verkhodanov, O. V., Trushkin, S. A., Andernach, H., & Chernenkov, V. N. 2005, Bulletin of the Special Astrophysics Observatory, 58, 118
- Vikhlinin et al. (2009) Vikhlinin, A., Burenin, R. A., Ebeling, H., et al. 2009, ApJ, 692, 1033
- Wayth et al. (2015) Wayth, R. B., Lenc, E., Bell, M. E., et al. 2015, PASA, 32, e025
- Wayth et al. (2018) Wayth, R. B., Tingay, S. J., Trott, C. M., et al. 2018, PASA, 35
- Wilber et al. (2020) Wilber, A. G., Johnston-Hollitt, M., Duchesne, S. W., et al. 2020, arXiv e-prints, arXiv:2006.01833
- Wright et al. (1996) Wright, A. E., Griffith, M. R., Hunt, A. J., et al. 1996, ApJS, 103, 145
- Wright et al. (2010) Wright, E. L., Eisenhardt, P. R. M., Mainzer, A. K., et al. 2010, AJ, 140, 1868
- Zhang et al. (2011) Zhang, Y. Y., Andernach, H., Caretta, C. A., et al. 2011, A&A, 526, A105
- Zou et al. (2019) Zou, H., Gao, J., Zhou, X., & Kong, X. 2019, ApJS, 242, 8