ALMA Survey of Orion Planck Galactic Cold Clumps (ALMASOP): Detection of extremely high density compact structure of prestellar cores and multiple substructures within
Abstract
Prestellar cores are self-gravitating dense and cold structures within molecular clouds where future stars are born. They are expected, at the stage of transitioning to the protostellar phase, to harbor centrally concentrated dense (sub)structures that will seed the formation of a new star or the binary/multiple stellar systems. Characterizing this critical stage of evolution is key to our understanding of star formation. In this work, we report the detection of high density (sub)structures on the thousand-au scale in a sample of dense prestellar cores. Through our recent ALMA observations towards the Orion molecular cloud, we have found five extremely dense prestellar cores, which have centrally concentrated regions 2000 au in size, and several cm-3 in average density. Masses of these centrally dense regions are in the range of 0.30 to 6.89 M⊙. For the first time, our higher resolution observations (0.8 320 au) further reveal that one of the cores shows clear signatures of fragmentation; such individual substructures/fragments have sizes of 800 -1700 au, masses of 0.08 to 0.84 M⊙, densities of cm-3, and separations of au. The substructures are massive enough () to form young stellar objects and are likely examples of the earliest stage of stellar embryos which can lead to widely ( 1200 au) separated multiple systems.
1 Introduction
Stars form from the gravitational collapse of dense molecular cloud cores in the interstellar medium. Characterization of the dense cores is therefore of great importance for gaining insights into the initial conditions and evolutionary stages in star formation. Starless cores, which are condensations of matter without any embedded young stellar objects (YSOs), are considered as the earliest phase of star formation. A subset of the starless cores, called prestellar cores, are gravitationally bound and will presumably collapse to form YSOs (André et al., 2014). The evolution of prestellar cores to YSOs, and whether they form single or multiple stellar systems, however, is far from being understood.
While extensive efforts have been made previously to investigate the physical and chemical properties of starless and prestellar cores with single element telescopes (e.g., Caselli, 2011), the densest and presumably innermost 1000 au of such cores are yet to be characterized due to the limited angular, hence spatial, resolution. This scale is however crucial for testing theories of fragmentation to form multiple systems.
To this end, survey observations of starless cores in nearby molecular clouds (including, for example, Perseus, Ophiuchus, and Chamaeleon) with modern (sub)millimeter interferometers, such as the Combined Array for Research in Millimeter-wave Astronomy (CARMA), the Submillimeter Array (SMA), and the Atacama Large Millimeter and submillimeter Array (ALMA) were conducted (e.g Schnee et al., 2010, 2012; Dunham et al., 2016; Kirk et al., 2017). In these survey observations, very few localized sources were recovered because of the insensitivity of interferometers to small fluctuations in extended emission. Among those detected sources, some turned out to be protostellar, while others remained starless with no additional substructure in their (sub)millimeter continuum emission. Such results suggest that the density profiles of starless cores are predominantly flat, consistent with the earlier suggestions (e.g., Ward-Thompson et al., 1994, 1999; Shirley et al., 2000; Caselli et al., 2019). A profile having nearly constant density at small radii ( few 1000 au) is reminiscent of the “flat zone” in Bonnor-Ebert spheres (Ebert, 1955; Bonnor, 1956).
Meanwhile, observations indicate that the multiplicity fraction and the companion star fraction are highest in Class 0 protostars and decrease in more evolved protostars (Chen et al., 2013; Tobin et al., 2016). This implies that multiple systems may develop at an even earlier phase. Indeed, some theoretical works suggest that substructures in prestellar cores can be produced by turbulent fragmentation at a scale of 1000 au, which will form wide-multiple stellar systems (Offner et al., 2010), and these should be visible using sensitive interferometers (Offner et al., 2012). However, none of the observational surveys described in the previous paragraph found secondary/multiple substructures within dense cores at a scale of 1000 au. Although a few studies report cases of substructure and fragmentation in specific starless cores (e.g., Kirk et al., 2009; Chen & Arce, 2010; Nakamura et al., 2012; Takahashi et al., 2013; Pineda et al., 2015; Friesen et al., 2014; Ohashi et al., 2018; Tatematsu et al., 2020) they are associated with high-density condensation, and not related to the substructures (1000 au scale) in the central dense region of prestellar cores.
In a recent ALMA survey, Tokuda et al. (2020) reported the presence of very low mass ( M⊙ , cm-3) substructure toward starless cores at a scale of 1000 au; these substructures are not massive enough to produce multiple stars. In another observational effort to study the inner dense region of the prestellar core L1544 (Caselli et al., 2019), no substructures were detected inside the central dense region ( au with cm-3) of the core, where stellar multiplets are expected to potentially develop.
Recently, we performed a survey (ALMA Survey of Orion Planck Galactic Cold Clumps or ALMASOP; Dutta et al., 2020) with ALMA, in which we targeted 72 cores toward the Orion Molecular Clouds (distance 400 pc; Kounkel et al., 2018). An overview of the ALMASOP is presented in Dutta et al. (2020). Among the 72 targets in ALMASOP observations, 23 were previously classified as (candidate) starless cores. While all these starless cores were detected in the SCUBA-2 observations (with a core scale of pc or 20000 au), only 16 of them are detected by the ALMASOP ACA observations (scale pc or 6000 au). In this letter, we highlight the detection of a central compact dense structure toward a sample of five cores and the discovery of substructures within one of them using the ALMA 12-m array.
2 Observations
The observations of ALMASOP (project ID:2018.1.00302.S. ; PI: Tie Liu) were carried out with ALMA in Cycle 6 toward 72 fields during 2018 October to 2019 January. The observations were executed in four blocks in three different array configurations: 12m C43-5 (TM1), 12m C43-2 (TM2), and 7m ACA, resulting in a resolution ranging 034 - 5.5″in the 1.3 mm band. The correlator was configured into four spectral windows with 1.875 GHz bandwidth, which provides a spectral resolution of 1.129 MHz, corresponding to velocity resolutions between 1.465 and 1.563 km s-1. We adopted this coarse velocity resolution to facilitate efficient continuum observations and to maximize the spectral line coverage. The spectral set-up covers the continuum emission at 233.0 GHz and 216.6 GHz, and offers simultaneous coverage of the molecular lines CO (2-1), (2-1), (3-2), SiO (5-4) and other hot corino tracers as well (see Hsu et al., 2020). The remaining details of the observational parameters are presented in Dutta et al. (2020).
The calibrated visibility data were obtained using CASA 5.4 (Common Astronomy Software Applications package; McMullin et al., 2007) pipeline script as delivered by the observatory. The visibility data for different configurations and executions corresponding to the 72 sources were then separated into continuum and spectral data, and imaged jointly. The 1.3 mm continuum images of the sources are generated through CASA’s tclean task with the ‘automask’ on, the hogbom deconvolver, and a robust weighting of 0.5.
3 Results
3.1 Detection of compact dense structure inside prestellar cores
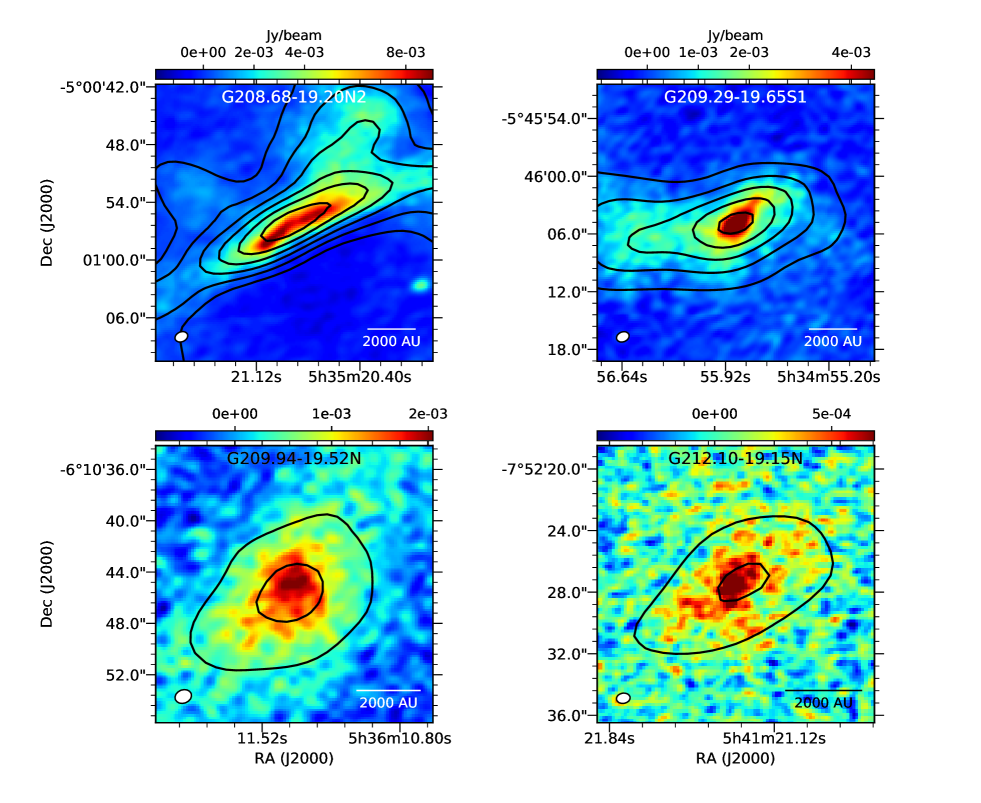
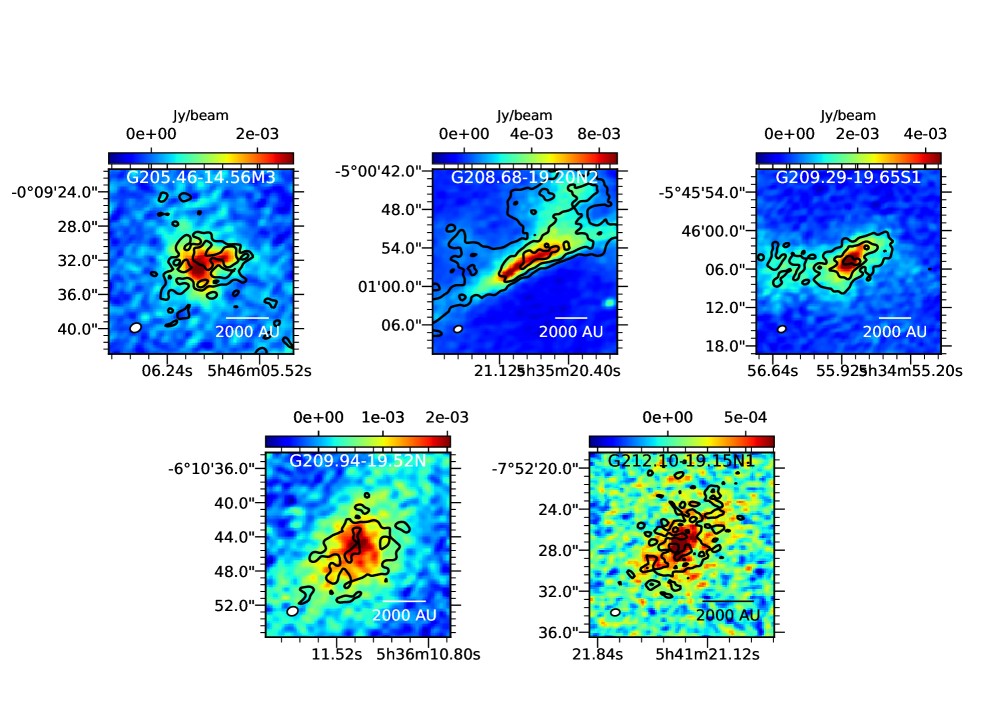
We present in Fig. 1 and Fig. 2 (c) the detection of the 1.3 mm (dust) continuum emission in contours toward the five targets (G208.68-19.20N2, G209.29-19.65S1, G209.94-19.52N, G212.10-19.15N1, and G205.46-14.46M3 (G205-M3 hereafter)) with the ALMA ACA+TM2 configurations at a resolution of 12. As introduced in Section 1, 16 of the 23 candidate starless cores were detected by the ACA observations at a resolution of 6″and the 5 targets are among the 16 cores. Compared with the other 11 detections, the 5 cores discussed in this paper have further compact dense features within the structures seen by the ACA. However, their dust emission is not like the YSOs, which have point-like compact emission features as imaged using ALMA-TM1 configuration ( 03).
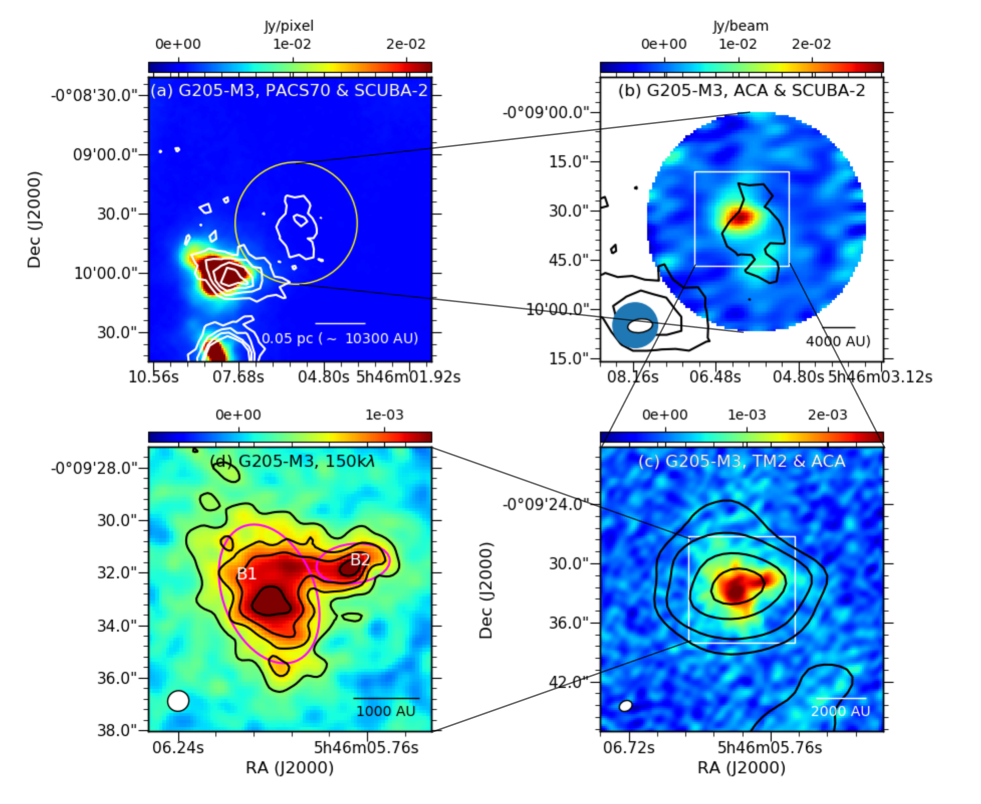
None of the five cores displays an outflow signature when observed in CO (=2-1), its isotopologue lines and SiO (=5-4) (Dutta et al., 2020). Neither near-infrared nor mid-infrared emission is present within these targets based on our archival search111(https://irsa.ipac.caltech.edu/irsaviewer/). Meanwhile, toward the central region of these five cores, CO appears fully depleted while traces well the 1.3 mm (dust) continuum (see Fig. 3). This is in accordance with their intense emission and high []/[] abundance ratio of seen by the NRO 45m telescope at a larger ( pc to 0.1 pc) scale (Kim et al., 2020). All these lines of evidence suggest that the five cores are genuinely chemically evolved prestellar cores. Note that, all of these sources were earlier classified as ‘starless’ by Yi et al. (2018), although Kirk et al. (2016) using JCMT survey results classified G205-M3 as YSO because of the presence of a YSO (Megeath et al., 2012; Stutz et al., 2013) within the very extended (″) envelope surrounding the core. The nearest YSO is ″ away from the position of G205-M3 core (see Fig 2, panel 1), and therefore not directly associated.
The flux density of the observed structure toward each of the five cores can be estimated from 2-dimensional (2D) Gaussian fitting. We have neither gas nor dust temperature measurements on the observed angular scales. Nevertheless, given their prestellar nature, we assume the temperature of the compact component is at most 10 K and can go as low as 6.5 K (Crapsi et al., 2007; Keto & Caselli, 2010). By adopting a (dust) specific absorption coefficient (per mass, with a gas-to-dust mass ratio of 100) = 0.009 cm2 g-1 at the observing wavelength for grains with thick icy mantles after 105 yr of coagulation (Ossenkopf & Henning, 1994), we infer the source masses. The effective radius of the cores () is estimated as , where ‘major’ and ‘minor’ correspond to the two axes of the ellipse obtained from the 2D Gaussian fitting, and the gas column density can be found as . By assuming a spherical geometry, the gas volume density can also be calculated from , where (=2.8) is the molecular weight per hydrogen molecule (Kauffmann et al., 2008), and is the proton mass. The mass, size, column density, and volume density of the cores inferred from both the ACA observations and the ACA+TM2 observations are presented in Table 1.
| Source | RA | DEC | FWHM | Sν(1.3 mm) | Mgas | nH2 | NH2 | Diameter | aaJeans lengths (LJ) calculated at 10 K; at 6.5 K the values will be lower | (FWHM) bb Virial parameters calculated at 10 K with FWHMs obtained by Kim et al. (2020); at 6.5 K the values will be lower; see section 4.3 for details |
|---|---|---|---|---|---|---|---|---|---|---|
| (J2000) | (J2000) | () | (mJy) | (M☉) | (cm-3) | (cm-2) | (au) | (au) | - (km s-1) | |
| ACA results | ||||||||||
| G205.46-14.56M3* | 05:46:05.99 | -00:09:32.37 | 79.8 | 0.76-1.69 | 3067 | 1561 | 0.68 (0.40) | |||
| G208.68-19.20N2 | 05:35:20.72 | -05:00:54.09 | 724.0 | 6.93-15.36 | 5735 | 1325 | 0.17 (0.49) | |||
| G209.29-19.65S1 | 05:34:56.04 | -05:46:05.28 | 266.0 | 2.55-5.64 | 5087 | 1826 | 1.12 (0.97) | |||
| G209.94-19.52N | 05:36:11.39 | -06:10:45.93 | 129.1 | 1.24-2.74 | 4059 | 1868 | 0.83 (0.57) | |||
| G212.10-19.15N1 | 05:41:21.27 | -07:52:27.01 | 47.1 | 0.45 - 1.00 | 3337 | 2306 | 1.80 (0.55) | |||
| Combined ACA+TM2 results | ||||||||||
| G205.46-14.56M3* | 05:46:05.96 | -00:09:32.45 | 53.2 | 0.51-1.13 | 2146 | 1119 | 0.71 (0.40) | |||
| G208.68-19.20N2 | 05:35:20.76 | -05:00:55.21 | 325.0 | 3.11-6.89 | 3087 | 781 | 0.21 (0.49) | |||
| G209.29-19.65S1 | 05:34:55.84 | -05:46:04.81 | 98.6 | 0.94 - 2.09 | 2205 | 856 | 1.32 (0.97) | |||
| G209.94-19.52N | 05:36:11.38 | -06:10:45.65 | 89.3 | 0.86-1.89 | 3344 | 1680 | 0.99 (0.57) | |||
| G212.10-19.15N1 | 05:41:21.28 | -07:52:27.50 | 31.8 | 0.30 - 0.67 | 2264 | 1568 | 1.83 (0.55) | |||
| Substructure in G205-M3 | ||||||||||
| B1 | 05:46:06.008 | -00.09.32.812 | 39.4 | 0.38-0.84 | 1755 | 1014 | 0.79 (0.40) | |||
| B2 | 05:46:05.795 | -00.09.31.659 | 8.8 | 0.08-0.19 | 820 | 730 | 1.76 (0.40) | |||
3.2 Substructures in the prestellar core G205-M3
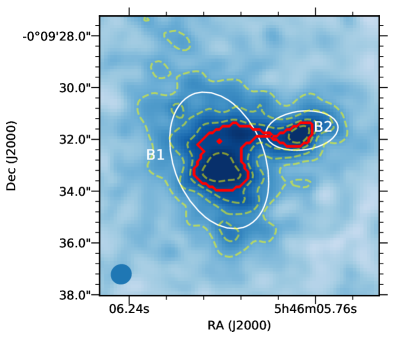
G205-M3 is the only core where we detect substructures at a scale of 1000 au inside the compact dense structure of the core (also see section 4.1.1). We show in Fig. 2 the (dust) continuum images of the G205-M3 core. Different –tapering of the visibility data has been employed to highlight the intricate features of the core seen at different angular scales. The G205-M3 core size in SCUBA-2 observation (beam size ) is on the order of 0.05 pc or 10000 au (Yi et al., 2018). The core is detected by ACA (beam , see Fig. 2(b)) with an overall size on the order of 4000 au and moreover, the faint substructure can be readily discerned. At a higher (12) resolution (see Fig. 2(c)) an asymmetric structure can be seen with an average core size of au. Further zooming into the source with an angular resolution of 08 ( corresponding to a uv-taper of 150 k; Fig. 2-d), the inner 2000 au region of G205-M3 is then resolved into two noticeable substructures. These substructures are named B1 and B2 ( see Fig 2 -panel d). These substructures were also identified using a dendrogram analysis, see Fig. 4. They were fitted simultaneously with 2D Gaussian fitting. The two components are, respectively, 55 35 and 28 15 in size and separated roughly by 1200 au (3″). The masses of B1 and B2 are 0.38-0.84 M⊙ and 0.08-0.19 M⊙, respectively, if a (dust) temperature range of 6.5-10 K is assumed, with larger masses associated with the lower temperatures. Their corresponding volume densities, considering a spherical geometry, are listed in Table 1.
4 Discussion
Summarizing the results, a series of observations of increasingly better resolution and sensitivity has revealed increasingly compact, denser structures in a small subset of starless cores. In this section, we discuss the physical properties, the stability, and the dynamical state of these structures.
4.1 Detection of compact structures
In the ACA/ALMA maps, the flux densities of G205-M3 enclosed in apertures with an equivalent radius of 04, 11, 22, 57, and 149 centered at the peak position of B1 are 1.4 mJy, 7.5 mJy, 24.8 mJy, 52.2 mJy,and 99.5 mJy respectively. Assuming the gas temperature and dust property are uniform within these scales, we find the corresponding enclosed masses will scale as , which hints at a density profile of between 300 au and 10000 au scale. Using similar method, for other cores (except G208-N2) the masses scale as , and therefore their density profiles vary as . The actual density profile could be even steeper if the dust temperature decreases toward the center of the core. These structures are thus not consistent with Bonnor-Ebert spheres unless the inner region of constant density is very small (Dunham et al., 2016). Such systems are generally very close to the initiation of collapse or they have begun to collapse. Based on their statistical analysis on the lifetime of starless cores, Dunham et al. (2016) and also Kirk et al. (2017) argued that only evolved cores with short lifetime ( year) can be detected by interferometers. Therefore, the five cores detected at high resolution ( 12) likely represent an evolved starless stage, just before the onset of star formation.
Such dense regions can be compared with the well known prestellar core ‘kernel’ in L1544 (Caselli et al., 2019). The average and peak densities of the five prestellar cores are at least 10 times higher than that of the L1544 core, although the sizes of the regions are comparable.
4.1.1 Search for substructures at 1000 au scale
Do the five cores have substructures inside the compact dense regions? We use different methods, e.g., uv-tapering of the image, slicing along possible substructure features to identify the intensity variation, and the dendrogram technique. This helps us identify the real and prominent substructures which are not related to imaging artifacts (e.g., Caselli et al., 2019) and weak substructure features. Prominent signatures of substructures are found only towards G205-M3 (section 3.2). Among the other four cores, the G208-N2 core appears elongated and similar to a filamentary structure (More details of this core will be presented by Hirano et al. in preparation). However, the intensity fluctuations along the apparent substructures are at most comparable to the noise level, therefore we see no evident signs of substructure towards G208-N2. Similarly, we do not find substructures toward the other remaining cores, and their detailed physical evolutionary status and density structure will be described in a future work (Sahu et al. in preparation).
4.2 Thermal stability
Assuming first an isothermal molecular core, being supported only by its thermal pressure against gravity without considering non-thermal gas motions, one can estimate the Jeans length scale beyond which gravitational collapse would prevail. The Jeans length is defined by: , where is the gravitational constant, is mass density and is the isothermal sound speed, , with (Kauffmann et al., 2008). Yi et al. (2018) found that at the scale of the SCUBA-2 observation, these five cores are unstable based on the Jeans analysis. We find similar results for the dense structures seen at the ACA (6′′) and TM2( scales (see Table 1). The dense structures in the five cores have sizes significantly greater than their correspondingly Jeans lengths, implying that they are Jeans unstable.
The adopted gas temperature is a major uncertainty in the above analysis. While we have adopted a gas temperature of 10 K for all sources, Kim et al. (2020) found from and line observations that under LTE conditions the gas temperatures of the five cores are in the range of 10.8-17.3 K at larger scales with an average density (cm-3). Nevertheless, the cores remain unstable even if we adopt a gas temperature of 20 K. In fact, the temperatures of the central compact dense regions are likely to be lower than 10 K given their high density. A good example is L1544, for which Caselli et al. (2019) assumed a core temperature to be 6.5 K for its high density (cm-3). The average density of the central dense regions in our core sample is at least ten times higher than L1544 and a gas temperature of 6.5 K is therefore viable. At this temperature all the core structures detected by ACA are Jeans unstable, further highlighting their prestellar nature.
4.3 Dynamical state
We particularly focus on the dynamical state towards the G205-M3 core, where substructures are detected. To assess the dynamical state of the regions, we use molecular line data to determine thermal and non-thermal contributions, using , where , with the mass of the observed molecule, and are the thermal and non-thermal components, respectively. The non-thermal contributions could include infall, rotation, and streaming motions, but they are usually attributed to turbulence. Ideally, we would use the line data on the scales of the substructures, but our velocity resolution is insufficient. We instead consider information from NH3 with an FWHM linewidth () of 0.88 km s-1(Cesaroni & Wilson, 1994) on a scale of 40 arcseconds ( au) and from N2D+ with km s-1 on a scale of 8000 au. Using , we obtain km s-1 for NH3 and 0.17 km s-1 for N2D+. If we assume K, km s-1 for NH3 and 0.053 km s-1 for N2D+, resulting in km s-1 for NH3 or for N2D+, with the smaller value more likely relevant to the individual cores and indicating nearly equal contributions from turbulence and thermal broadening. The isothermal sound speed, is 0.19 km s-1 at K, indicating that the turbulence is supersonic, with Mach number of 2 based on NH3 or transonic, with Mach number of 0.8 based on N2D+. Taken at face value, these results suggest that the turbulence has decayed on small scales. The effective sound speed, , is 0.247 km s-1, using the data from N2D+.
The fate of the substructures can be assessed from their virial parameters. The parameter . where is the kinetic energy and is the gravitational potential energy, and for a wide range of geometries and density structures (Kauffmann et al., 2013). The virial parameter can be written as . Taking the sizes and masses and the effective sound speed of 0.247 km s-1, we obtain to for B1 and to for B2. This calculation suggests that the substructures are close to being gravitationally bound, even if all the non-thermal component is entirely due to turbulence. Other motions, such as infall, may be present. It is at least plausible that the sub-structures are collapsing to form separate objects. Using a similar calculations, we found that the four other dense cores are also close to being gravitationally bound (see Table 1). This again supports the evolved prestellar nature of the cores.
4.4 Substructures toward G205-M3 and stellar multiplicity
We have detected, for the first time, substructures within the central compact dense region ( 2000 au) of the prestellar core G205-M3. What will be the fate of these kinds of substructures?
If the substructures are in free-fall, they are likely to form separate objects that could be members of a wide binary. They are unlikely to coalesce before they collapse. The minimum time to coalesce is the crossing time. Using the projected separation of 1148 au ( also see the appendix section) and the effective sound speed of 0.247 km s-1, we calculate yr yr, where is the projected separation in au and is in km s-1. This estimate assumes that there is no separation along the line of sight and that they are headed on a collision course. In contrast, the free- fall time is (where, with =2.8), for a minimum H2 number density (n) of 1.9 cm-3, yr, which is much shorter than . On the other hand, a binary system will be bound if the internal energy: , where is the reduced mass of the two bodies. Considering the mass of B1 and B2 substructures/sub-cores, the system will be bound for a velocity difference () of 0.8-1.2 km s-1. From the low resolution spectral data ( ), we find that the velocity difference is at most 1.465 km s-1. Therefore, it is very plausible that the sub-cores may eventually form a wide binary system. Notably, Karnath et al. (2020) reported substructures associated with protostellar candidates. Those substructures appear to trace an early stage of protostellar evolution, during which substructures are associated with collapsing fragments and individual components may be optically thick hydrostatic cores. The detected structures toward the prestellar core (G205-M3) are therefore not some transient features; they likely persist into the protostellar phase as well.
4.5 Physical explanations for fragmentations
In the ‘gravoturbulent fragmentation’ (Palau et al., 2018) scenario fragmentation takes place in a self-gravitating turbulent medium. In this case, the density is determined by enhancements created by turbulence (e.g., Padoan & Nordlund, 2002; Fisher, 2004; Goodwin et al., 2004; Offner et al., 2010). Based on this theory, Offner et al. (2012) predicted that prestellar core fragmentation can be observable at 1000 au scale. It is plausible that fragmentation towards the G205-M3 core represents such a case. However, the non-detections of sub-cores in other prestellar cores possibly imply a younger stage than the G205-M3 core, and they may fragment in a later period of their evolution.
5 Summary
We present 1.3 mm dust continuum observations using different configurations of ALMA, resulting in different synthesized beams to study five highly dense (cm-3) prestellar cores in the Orion molecular cloud. We found that in addition to detection using the ALMA-ACA-configuration (), these cores are also detected using the ALMA-TM2-configuration () which imply that the cores have a centrally dense region of size au. No NIR/MIR emission has been detected towards these cores, signifying that the cores are starless/prestellar in nature. The cores are found to be gravitationally unstable, and at the onset of star formation We found two substructures of sizes ranging from 800-1700 au and masses M⊙ towards the core G205-M3. Considering that the free fall time is shorter than the coalescence time of the substructures, and they are likely bound within a separation of 1200 au, we speculate that this core will produce a wide binary or multiple star system.
References
- André et al. (2014) André, P., Di Francesco, J., Ward-Thompson, D., et al. 2014, in Protostars and Planets VI, ed. H. Beuther, R. S. Klessen, C. P. Dullemond, & T. Henning, 27, doi: 10.2458/azu_uapress_9780816531240-ch002
- Bonnor (1956) Bonnor, W. B. 1956, Monthly Notices of the Royal Astronomical Society, 116, 351, doi: 10.1093/mnras/116.3.351
- Caselli (2011) Caselli, P. 2011, in The Molecular Universe, ed. J. Cernicharo & R. Bachiller, Vol. 280, 19–32, doi: 10.1017/S1743921311024835
- Caselli et al. (2019) Caselli, P., Pineda, J. E., Zhao, B., et al. 2019, The Astrophysical Journal, 874, 89, doi: 10.3847/1538-4357/ab0700
- Cesaroni & Wilson (1994) Cesaroni, R., & Wilson, T. L. 1994, A&A, 281, 209
- Chen & Arce (2010) Chen, X., & Arce, H. G. 2010, ApJ, 720, L169, doi: 10.1088/2041-8205/720/2/L169
- Chen et al. (2013) Chen, X., Arce, H. G., Zhang, Q., et al. 2013, ApJ, 768, 110, doi: 10.1088/0004-637X/768/2/110
- Crapsi et al. (2007) Crapsi, A., Caselli, P., Walmsley, M. C., & Tafalla, M. 2007, A&A, 470, 221, doi: 10.1051/0004-6361:20077613
- Dunham et al. (2016) Dunham, M. M., Offner, S. S. R., Pineda, J. E., et al. 2016, The Astrophysical Journal, 823, 160, doi: 10.3847/0004-637X/823/2/160
- Dutta et al. (2020) Dutta, S., Lee, C.-F., Liu, T., et al. 2020, arXiv e-prints, arXiv:2010.14507. https://arxiv.org/abs/2010.14507
- Ebert (1955) Ebert, R. 1955, ZAp, 37, 217
- Fisher (2004) Fisher, R. T. 2004, The Astrophysical Journal, 600, 769, doi: 10.1086/380111
- Friesen et al. (2014) Friesen, R. K., Di Francesco, J., Bourke, T. L., et al. 2014, The Astrophysical Journal, 797, 27, doi: 10.1088/0004-637X/797/1/27
- Goodwin et al. (2004) Goodwin, S. P., Whitworth, A. P., & Ward-Thompson, D. 2004, Astronomy & Astrophysics, 423, 169, doi: 10.1051/0004-6361:20040285
- Hsu et al. (2020) Hsu, S.-Y., Liu, S.-Y., Liu, T., et al. 2020, ApJ, 898, 107, doi: 10.3847/1538-4357/ab9f3a
- Karnath et al. (2020) Karnath, N., Megeath, S. T., Tobin, J. J., et al. 2020, ApJ, 890, 129, doi: 10.3847/1538-4357/ab659e
- Kauffmann et al. (2008) Kauffmann, J., Bertoldi, F., Bourke, T. L., Evans, N. J., I., & Lee, C. W. 2008, A&A, 487, 993, doi: 10.1051/0004-6361:200809481
- Kauffmann et al. (2013) Kauffmann, J., Pillai, T., & Goldsmith, P. F. 2013, ApJ, 779, 185, doi: 10.1088/0004-637X/779/2/185
- Keto & Caselli (2010) Keto, E., & Caselli, P. 2010, MNRAS, 402, 1625, doi: 10.1111/j.1365-2966.2009.16033.x
- Kim et al. (2020) Kim, G., Tatematsu, K., Liu, T., et al. 2020, ApJS, 249, 33, doi: 10.3847/1538-4365/aba746
- Kirk et al. (2016) Kirk, H., Johnstone, D., Di Francesco, J., et al. 2016, ApJ, 821, 98, doi: 10.3847/0004-637X/821/2/98
- Kirk et al. (2017) Kirk, H., Dunham, M. M., Francesco, J. D., et al. 2017, The Astrophysical Journal, 838, 114, doi: 10.3847/1538-4357/aa63f8
- Kirk et al. (2009) Kirk, J. M., Crutcher, R. M., & Ward-Thompson, D. 2009, ApJ, 701, 1044, doi: 10.1088/0004-637X/701/2/1044
- Kounkel et al. (2018) Kounkel, M., Covey, K., Suárez, G., et al. 2018, The Astronomical Journal, 156, 84, doi: 10.3847/1538-3881/aad1f1
- McMullin et al. (2007) McMullin, J. P., Waters, B., Schiebel, D., Young, W., & Golap, K. 2007, in Astronomical Society of the Pacific Conference Series, Vol. 376, Astronomical Data Analysis Software and Systems XVI, ed. R. A. Shaw, F. Hill, & D. J. Bell, 127
- Megeath et al. (2012) Megeath, S. T., Gutermuth, R., Muzerolle, J., et al. 2012, The Astronomical Journal, 144, 192, doi: 10.1088/0004-6256/144/6/192
- Nakamura et al. (2012) Nakamura, F., Takakuwa, S., & Kawabe, R. 2012, ApJ, 758, L25, doi: 10.1088/2041-8205/758/2/L25
- Offner et al. (2012) Offner, S. S. R., Capodilupo, J., Schnee, S., & Goodman, A. A. 2012, Monthly Notices of the Royal Astronomical Society: Letters, 420, L53, doi: 10.1111/j.1745-3933.2011.01194.x
- Offner et al. (2010) Offner, S. S. R., Kratter, K. M., Matzner, C. D., Krumholz, M. R., & Klein, R. I. 2010, The Astrophysical Journal, 725, 1485, doi: 10.1088/0004-637X/725/2/1485
- Ohashi et al. (2018) Ohashi, S., Sanhueza, P., Sakai, N., et al. 2018, ApJ, 856, 147, doi: 10.3847/1538-4357/aab3d0
- Ossenkopf & Henning (1994) Ossenkopf, V., & Henning, T. 1994, A&A, 291, 943
- Padoan & Nordlund (2002) Padoan, P., & Nordlund, Å. 2002, ApJ, 576, 870, doi: 10.1086/341790
- Palau et al. (2018) Palau, A., Zapata, L. A., Román-Zúñiga, C. G., et al. 2018, ApJ, 855, 24, doi: 10.3847/1538-4357/aaad03
- Pineda et al. (2015) Pineda, J. E., Offner, S. S. R., Parker, R. J., et al. 2015, Nature, 518, 213, doi: 10.1038/nature14166
- Rosolowsky et al. (2008) Rosolowsky, E. W., Pineda, J. E., Kauffmann, J., & Goodman, A. A. 2008, ApJ, 679, 1338, doi: 10.1086/587685
- Schnee et al. (2010) Schnee, S., Enoch, M., Johnstone, D., et al. 2010, The Astrophysical Journal, 718, 306, doi: 10.1088/0004-637X/718/1/306
- Schnee et al. (2012) Schnee, S., Sadavoy, S., Di Francesco, J., Johnstone, D., & Wei, L. 2012, ApJ, 755, 178, doi: 10.1088/0004-637X/755/2/178
- Shirley et al. (2000) Shirley, Y. L., Evans, Neal J., I., Rawlings, J. M. C., & Gregersen, E. M. 2000, ApJS, 131, 249, doi: 10.1086/317358
- Stutz et al. (2013) Stutz, A. M., Tobin, J. J., Stanke, T., et al. 2013, ApJ, 767, 36, doi: 10.1088/0004-637X/767/1/36
- Takahashi et al. (2013) Takahashi, S., Ho, P. T. P., Teixeira, P. S., Zapata, L. A., & Su, Y.-N. 2013, The Astrophysical Journal, 763, 57, doi: 10.1088/0004-637X/763/1/57
- Tatematsu et al. (2020) Tatematsu, K., Liu, T., Kim, G., et al. 2020, ApJ, 895, 119, doi: 10.3847/1538-4357/ab8d3e
- Tobin et al. (2016) Tobin, J. J., Kratter, K. M., Persson, M. V., et al. 2016, Nature, 538, 483, doi: 10.1038/nature20094
- Tokuda et al. (2020) Tokuda, K., Fujishiro, K., Tachihara, K., et al. 2020. https://arxiv.org/abs/2006.06361
- Ward-Thompson et al. (1999) Ward-Thompson, D., Motte, F., & Andre, P. 1999, MNRAS, 305, 143, doi: 10.1046/j.1365-8711.1999.02412.x
- Ward-Thompson et al. (1994) Ward-Thompson, D., Scott, P. F., Hills, R. E., & Andre, P. 1994, Monthly Notices of the Royal Astronomical Society, 268, 276, doi: 10.1093/mnras/268.1.276
- Yi et al. (2018) Yi, H.-W., Lee, J.-E., Liu, T., et al. 2018, The Astrophysical Journal Supplement Series, 236, 51, doi: 10.3847/1538-4365/aac2e0
Appendix A Dendrogram analysis
In addition to visual identification of substructures towards the prestellar core G205-M3 (see Fig 2, panel d), we also show the identification of the substructures with the dendrogram analysis, which is often employed in identifying and labeling clumpy structures (Rosolowsky et al., 2008; Pineda et al., 2015). We ran the dendrogram algorithm with min_value =4 (minimum intensity considered in the analysis) and min_delta= 2(minimum spacing between isocontours). Two substructures are clearly identified and presented in Fig. 4 (red contours). The separation between the blobs, B1 & B2 as obtained from the dendrogram analysis, based on the peak position of the blobs is 1148 AU. If we consider the position of the peaks of B1 and B2 as obtained from Gaussian fittings (presented in Table 1) then the separation is given by 1360 140 AU, considering the fitting uncertainties. So, in general we consider the separation 1200 AU, as mentioned in the text.
The image presented in Fig. 4 corresponds to the combined data of ALMA (ACA, TM2 & TM1 configurations) with a uv-taper of 150 k ( 08). The dust emission of the five dense prestellar cores which were detected in ALMA-TM2 (1.2″), resolved out at the highest observing resolution (ALMA-TM1; 03). So, to identify the substructures from the dust continuum images, we applied a range of uv-tapering on the combined ALMA data from 100 k to 200 k (corresponds to resolution from 06 to 1.0″). The substructures of G205.46-14.56M3 appear most prominent in ALMA combined data at 08 - 1.0″resolution (with uv-taper of 100 - 150 k), but at higher resolutions (beyond 200 k) their emission was resolved out.