2020 May 29 \Accepted2020 December 15 \Publishedpublication date \SetRunningHeadAstronomical Society of JapanUsage of pasj00.cls \KeyWordsgalaxies: ISM — galaxies: star formation — ISM: molecules — radio lines: galaxies — radio lines: ISM
CO Multi-line Imaging of Nearby Galaxies (COMING). IX. CO(J = 2–1)/CO(J = 1–0) line ratio on kiloparsec scales
Abstract
While molecular gas mass is usually derived from CO( = 1–0) — the most fundamental line to explore molecular gas — it is often derived from CO( = 2–1) assuming a constant CO( = 2–1)/CO( = 1–0) line ratio (). We present variations of and effects of the assumption that is a constant in 24 nearby galaxies using CO data obtained with the Nobeyama 45-m radio telescope and IRAM 30-m telescope. The median of for all galaxies is 0.61, and the weighted mean of by CO( = 1–0) integrated-intensity is 0.66 with a standard deviation of 0.19. The radial variation of shows that it is high (0.8) in the inner 1 kpc while its median in disks is nearly constant at 0.60 when all galaxies are compiled. In the case that the constant of 0.7 is adopted, we found that the total molecular gas mass derived from CO( = 2–1) is underestimated/overestimated by 20%, and at most by 35%. The scatter of a molecular gas surface density within each galaxy becomes larger by 30%, and at most by 120%. Indices of the spatially resolved Kennicutt–Schmidt relation by CO( = 2–1) are underestimated by 10–20%, at most 39% in 17 out of 24 galaxies. has good positive correlations with star-formation rate and infrared color, and a negative correlation with molecular gas depletion time. There is a clear tendency of increasing with increasing kinetic temperature (). Further, we found that not only but also pressure of molecular gas is important to understand variations of . Special considerations should be made when discussing molecular gas mass and molecular gas properties inferred from CO( = 2–1) instead of CO( = 1–0).
1 Introduction
Molecular gas is a crucial component in the interstellar medium (ISM) because star formation is the main physical process in the universe, and stars form from cold molecular gas. Therefore, it is essential to understand the properties of molecular gas to investigate galaxies and their evolution. CO( = 1–0) line has been used as a tracer for cold molecular gas (e.g., [Solomon87]; [Young91]) because H molecule cannot be directly observed in cold environments due to no electric dipole moment. Since the = 1 energy level of a CO molecule is low ( K, where is energy gap and is the Boltzmann constant), CO is easily excited to the = 1 level and emit CO( = 1–0) line even in cold conditions. In addition, the critical density of CO( = 1–0) is a few hundred cubic centimeters in an optical thick region. This value is quite lower than that of other molecular gas tracers. Furthermore, CO is an abundant molecule in the ISM except hydrogen and helium, has large dissociation energy, and its abundance ratio is nearly uniform in molecular clouds. Thus, CO( = 1–0) is the most useful line to study the bulk of cold molecular gas. Molecular gas surface density () in galactic disks is usually derived from the following equation with the integrated intensity of CO( = 1–0), ,
| (1) | |||||
where is the inclination angle of the galactic disk, is the CO-to-H conversion factor that converts into column density of H. Helium in molecular gas contributes the factor of 1.36 and the other factor 3.20 represents the unit conversion of K km s into pc. The product of in units of pc (K km s) corresponding to cm (K km s) is also widely used as the CO-to-H conversion factor that converts into [or luminosity of CO( = 1–0) into molecular gas mass] usually denoted as “” (e.g., [Bolatto13]; [Leroy13]; [Schruba19]).
When the atmosphere is extremely dry, which is common at sites of short-millimeter and submillimeter telescopes, the observation efficiency of CO( = 1–0) for the local universe is usually lower than that with CO( = 2–1). This is because the rest frequency of CO( = 1–0), 115 GHz, is close to the O absorption band at 118 GHz, and the CO( = 2–1) attenuation caused by water vapor is small at its rest frequency of 230 GHz in such sites. Thus, CO( = 2–1) is often used to observe molecular gas instead of CO( = 1–0) (e.g., [Leroy09], hereafter L09; [Druard14]; [Sun18]). In this case, is derived from the following equation instead of equation 1 by assuming the integrated-intensity ratio of CO( = 2–1)/CO( = 1–0) (hereafter, ),
| (2) | |||||
where is the integrated intensity of CO( = 2–1). The value of 0.7–0.8 is usually assumed to be a constant (e.g., L09; [Leroy13]).
Although CO( = 2–1) is used as a proxy of CO( = 1–0), the energy of CO = 2 level ( K) is higher than that in the typical cold molecular clouds ( K). Therefore, it is possible that CO molecules are not well excited to reach the = 2 level based on molecular gas properties (e.g., [Penaloza17]). Molecular gas traced by CO( = 2–1) is warmer and/or denser than that traced using CO( = 1–0). is influenced by the physical conditions of molecular gas.
The systematic variations of have been reported in previous observations of molecular gas in the Milky Way. For nearby giant molecular clouds (GMCs), while is medium (–0.8) in the ridges of GMCs, it exceeds unity in interfaces of H\emissiontypeII regions and OB associations, and it is relatively low in the peripheries of GMCs () ([Sakamoto94]; [Nishimura15]). GMCs with active star formation tend to show high while those with quiescent star formation show low ratios. In large scales of the Milky Way, decreases from 0.75 at 4 kpc to 0.5 at 8 kpc as a function of the Galactocentric radius ([Sakamoto95]; [Sakamoto97]). Further, a gradient appears across spiral arms; it gradually increases toward the downstream of arms. In addition, shows higher values that are close to unity in the Galactic center compared with the Galactic disk ([Oka98]; [Sawada01]).
For external galaxies, a pioneering study by Braine92 reported that there is a moderate positive correlation between and infrared (IR) color, and they attempted to infer molecular gas properties from around the center of nearby galaxies. High (0.9 with the scatter of ) was reported in the Large Magellanic Cloud (LMC), and positions where is high do not always coincide with massive star-formation regions (Sorai01). It was argued that it reflects dense molecular gas, which is ready to form stars and is not due to warmed gas by radiations from massive stars, whereas the low metallicity environment in LMC may also influence . In several nearby galaxies, the median of in disks is approximately constant () and increases () in the center similar to that in the Milky Way (L09), while some galaxies show a nearly constant in the entire galaxy including the center (e.g., M 33; Druard14). Leroy13 reported the median of 0.66 with standard deviations of for approximately 30 nearby galaxies. Based on this result, some studies using CO( = 2–1) data assumed the constant and converted the intensity of the line into that of CO( = 1–0) to derive molecular gas mass and its surface density.
A detailed study to understand as a probe of molecular gas properties in the extragalactic field reported that while typical is , it is relatively high (0.8–0.9) in the leading side (the downstream) of the spiral arms and low (0.4–0.6) in the inter-arms for M 51 as well as the Milky Way (Koda12). In addition, they found that increases as surface density of star-formation rate () and star-formation efficiency (SFE) in this galaxy. They also suggested that high is relevant to warm molecular gas by active star formation and compressed molecular gas before star formation. With regard to and star formation activity, it was found that the correlation of with IR color is better than that of with far-ultraviolet (FUV), and far IR intensities in M 83 (Koda20). It was argued that these are attributed to warm molecular gas heated by dust, UV photons, and cosmic ray from supernovae, considering high in the downstream of arms where many massive stars are seen.
As described above, has systematic variations within and among galaxies, and it reflects molecular gas conditions such as temperature. Hence, it would be possible that molecular gas mass, its related quantities and relations derived from CO( = 2–1) with assumed constant are misled (e.g., Momose13) although there remains the uncertainty of the CO-to-H conversion factor. It is better to test the validity of the assumption that is constant, and its effect on derived quantities and relations which are relevant to molecular gas, especially for many types of galaxies. Furthermore, the causes of variations should be investigated with physical properties of molecular gas.
The largest CO-mapping survey for nearby galaxies in the world, CO Multi-line Imaging of Nearby Galaxies (COMING; Sorai19111See also https://astro3.sci.hokudai.ac.jp/~radio/coming/, hereafter S19) was carried out using the receiver FOur-beam REceiver System on the 45-m Telescope (FOREST; Minamidani16) installed on the Nobeyama 45-m telescope. COMING mapped 147 nearby galaxies in CO, CO, and CO = 1–0 lines. The addition of other CO-mapping surveys such as Kuno07 (hereafter, K07) and L09 enable us to investigate spatial variations in many types of nearby galaxies and the effects of the assumption for a constant in a large area of galaxies. With those CO data, we verify the assumption of fixed . The key questions in this paper are as follows: (i) How does the assumption of a constant affect molecular gas mass itself and its relevant relations? Is the assumption that is a constant reasonable?; (ii) What changes ? How does vary depending on molecular gas properties?
The remainder of the paper is organized as follows. In section 2, the samples of this study, analysis of CO cubes, intensity accuracy of CO considering calibration and pointing, and ancillary data sets are explained. The spatial distribution, statistics, and radial distribution of are described in the first half of section 3. In the latter half of the section, we report effects of the constant on molecular gas mass, its scatter within a galaxy, and the – relation (i.e., the molecular gas Kennicutt–Schmidt relation). To investigate the relation of and molecular gas properties, the correlations of representative quantities and are examined in the first half of section 4. We attempted to derive the intrinsic properties of molecular gas, number density, and kinetic temperature from CO( = 1–0), CO( = 2–1), and CO( = 1–0) for COMING galaxies and compared them with . These discussions and implications are described in the latter half of section 4. Finally, the conclusions of this paper are provided in section 5.
2 Data sets
Samples in this study. galaxy P.A. Res. CO(1–0) ref. [Mpc] [deg] [deg] [kpc] (1) (2) (3) (4) (5) NGC 337 18.9 44.5 119.6 1.6 S19 NGC 628 9.02 7 20 0.74 S19 NGC 2146 27.7 62 43.5 2.3 S19 NGC 2798 29.6 60.7 158.7 2.4 S19 NGC 2841 14.60 73.7 152.6 1.2 S19 NGC 2903 9.46 67 155 0.78 S19 NGC 2976 3.63 64.5 25.5 0.30 S19 NGC 3034 3.53 81 68 0.34 S19 NGC 3077 3.81 38.9 63.8 0.31 S19 NGC 3184 8.7 21 174 0.72 K07 NGC 3198 13.40 71.5 145.0 1.1 S19 NGC 3351 10.7 41 168 0.88 K07 NGC 3521 14.20 63 19 1.2 S19 NGC 3627 9.04 52 176 0.75 S19 NGC 3938 17.9 20.9 154.0 1.5 S19 NGC 4214 2.93 30 65 0.24 S19 NGC 4254 16.5 42 66 1.4 K07 NGC 4321 16.5 27 138 1.4 K07 NGC 4536 16.5 64.2 54.5 1.4 S19 NGC 4559 7.31 63.1 36.8 0.60 S19 NGC 4569 16.5 64 22 1.4 K07 NGC 4579 16.5 41.7 92.1 1.4 S19 NGC 4736 4.3 40 61 0.4 K07 NGC 5055 9.04 61 98 0.75 S19 NGC 5194 7.7 20 176 0.63 K07 NGC 5457 7.2 18 42 0.59 K07 NGC 5713 19.5 33 157 1.6 S19 NGC 6946 5.5 40 118 0.5 K07 NGC 7331 13.90 75.8 167.7 1.1 S19 {tabnote} (1) Adopted distance. (2) Inclination angle of the disk. (3) Position angle of the major axis of the disk for the redshifted side (against the north direction, the positive values correspond to the counterclockwise direction). (4) The linear scale corresponded to the angular resolution of \timeform17” along the major axis of the disk. (5) References of CO( = 1–0) data. References of , , P.A. are the same as in S19 or K07.
2.1 CO data and their analysis
CO( = 1–0) data used in this paper were taken from COMING firstly. Refer to sections 3 and 4 in S19 for details about the settings of observations, calibration, and data reduction for COMING. In addition, Nobeyama CO Atlas of Nearby Spiral Galaxies (K07) is used as the second reference of CO( = 1–0) data. Since the samples of K07 includes galaxies with large appearances, it makes it possible to discuss variations of in large area of galaxies. For the CO( = 2–1) reference, we use HERA CO-Line Extragalactic Survey (HERACLES; L09) carried out with the IRAM 30-m telescope.
The CO( = 1–0) data obtained by K07 and CO( = 2–1) data obtained by L09 were convolved to match the angular resolution of \timeform17”, which is the original resolution of COMING. Before measurements of , the coordinates for all CO cubes were matched and regridded so that the grid size becomes \timeform8”. Then, velocity channels were binned so that the velocity resolution is 20 km s. These processes were performed to improve signal-to-noise ratio (). After that, the baseline was subtracted.
The method of baseline subtraction is the same as COMING Auto-Reduction Tool (COMING ART; see section 4.2 in S19 for detail), however, signal channels are defined by CO( = 2–1), not by CO( = 1–0) because CO( = 2–1) data achieves a much better sensitivity than that of CO( = 1–0). That is, the result that whether the channel is a ‘signal’ or ‘noise’ for each channel of CO( = 2–1) in a position was applied to that of CO( = 1–0) at the channel of the same velocity in the position. This methodology does not induce any biases for CO( = 1–0) and CO( = 2–1) integrated-intensities because the sensitivities of the CO( = 2–1) data are much better than those of CO( = 1–0). The threshold to evaluate each channel as a ‘signal’ or a ‘noise’ is set as 3 , where is the root mean square (R.M.S.) measured in the defined emission-free velocity range beforehand.
The samples in this study consist of 29 galaxies that are overlapped between S19 K07, and L09. They are listed in table 2. For the overlapped galaxies between S19 and K07 (NGC 2903, NGC 3351, NGC 3521, NGC 3627, NGC 5055), we used S19 data except for NGC 3351 because the baseline of the S19 data for this galaxy is heavily undulated.
2.2 Intensity accuracy of CO data regarding calibration and pointing error
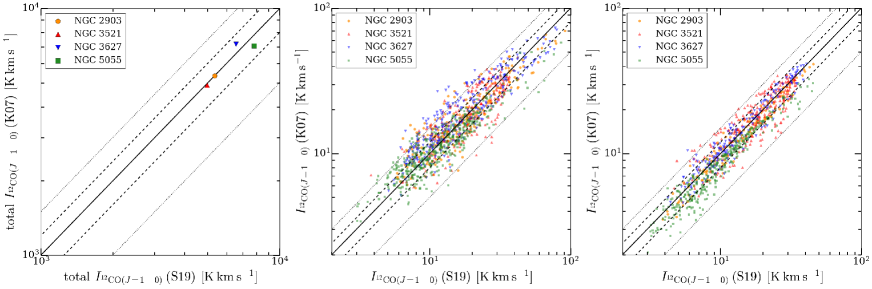
Intensity accuracy of CO data is important to study because its contrast is relatively small (usually –1.0) as argued in Koda et al. (\yearciteKoda12, \yearciteKoda20). Therefore, calibration and pointing error is an issue in this paper. We demonstrated how intensity of CO( = 1–0) data is accurate with overlapped 4 galaxies (NGC 2903, NGC 3521, NGC 3627, NGC 5055) between S19 and K07. Although NGC 3351 is an overlapped galaxy, the baseline of this galaxy is heavily undulated and thus, we excluded this galaxy to test intensity consistency. Both S19 and K07 data was regridded and the baseline was subtracted in the same way described in the last subsection.
We firstly tested consistency of total integrated-intensity within the whole disk (i.e., total flux) for S19 and K07 data and integrated intensity at position-to-position in the original resolution (17) and grid size (8). The left and center panel of figure 1 shows correlations of total integrated-intensities and integrated intensities at each pixel, respectively. The threshold was set to be 5 in the central panel. The difference of total integrated-intensity is at most . The scatter of intensity at position-to-position is in the R.M.S. level within each galaxy. Hence, calibration error of CO( = 1–0) used in this paper is up to 10% and intensity accuracy including pointing error and calibration error is 25% at the original resolution.
In section 3.3 and 4.1, we use convolved CO data so that the spatial resolution and grid size are fixed to 1.5 kpc and 650 pc, respectively. In addition, we stacked spectra within concentric annuli in disks and galactic structures in analyses of section 4.2. Thus, we next tested consistency of convolved S19 and K07 data to match the resolution of 1.5 kpc and grid size of 650 pc. The right panel of figure 1 shows consistency of integrated intensity between S19 and K07 for convolved data. The scatter at position-to-position in this case is in each galaxy. Therefore, intensity error combining calibration and pointing error in section 3.3 and 4.1 is 15%. Since in stacking analysis, spectra are stacked in a large area (galactic components and concentric annuli whose width is where is -band isophotal radius at 25 mag arcsec), intensity error due to pointing error will be negligible.
We would like to note that intensity accuracy of CO( = 1–0) against CO( = 1–0) is relatively good because CO( = 1–0) data was taken simultaneously with CO( = 1–0) in COMING observations. In addition, since COMING applied the On-The-Fly (OTF) mode in their observation, while observation in K07 applied the Position-Switch, calibration and pointing accuracy of S19 would be better than that of K07.
We could not test how calibration/pointing error of CO( = 2–1) data is in the same way of S19 and K07 because there is no available archival data of the line. However, L09 mentioned that daily variations of CO( = 2–1) intensity at high regions is 20%. Therefore, intensity error of CO( = 2–1) combining calibration and pointing error is 20%, which is quite better than that of CO( = 1–0). Assuming the fraction of contribution by pointing error is the same as the CO( = 1–0) case, calibration error of CO( = 2–1) will be %. Hence, there will be also calibration error of % in CO( = 2–1) data, which is common in short millimeter-wave observations. Similarly, intensity error due to calibration/pointing error in convolved CO( = 2–1) data will be %. To summarize above descriptions, error due to calibration error is 13%, due to calibrationpointing error at original angular resolution is 32%, and at fixed spatial resolution and grid size is 19%, respectively.
2.3 Data in other wavelengths
Star-formation rate (SFR) was derived from FUV and 22- band intensity based on the following equation by Casasola17 and Leroy08 that adopted the Kroupa initial mass function (IMF; Kroupa01) as with the method in other COMING papers (e.g., Muraoka19; Takeuchi et al. 2020 in prep.):
| (3) | |||||
where and are intensities of the 22- and FUV band. The FUV maps were obtained with the GALEX Ultraviolet Atlas of Nearby Galaxies (GildePaz07) and were retrieved from the NASA/IPAC Extragalactic Database (NED). The 22- maps obtained with the WISE band 4 were retrieved from the NASA/IPAC Infrared Science Archive.
In addition, the IR color that represents dust temperature is used as an indicator of ISM conditions. To measure the IR color in many galaxies as much as possible, we used the intensity ratio of the 70- to 160- band obtained with Herschel/PACS. This filter selection reduces the sample number of galaxies because of a lack of samples in the far-infrared range.
3 Results
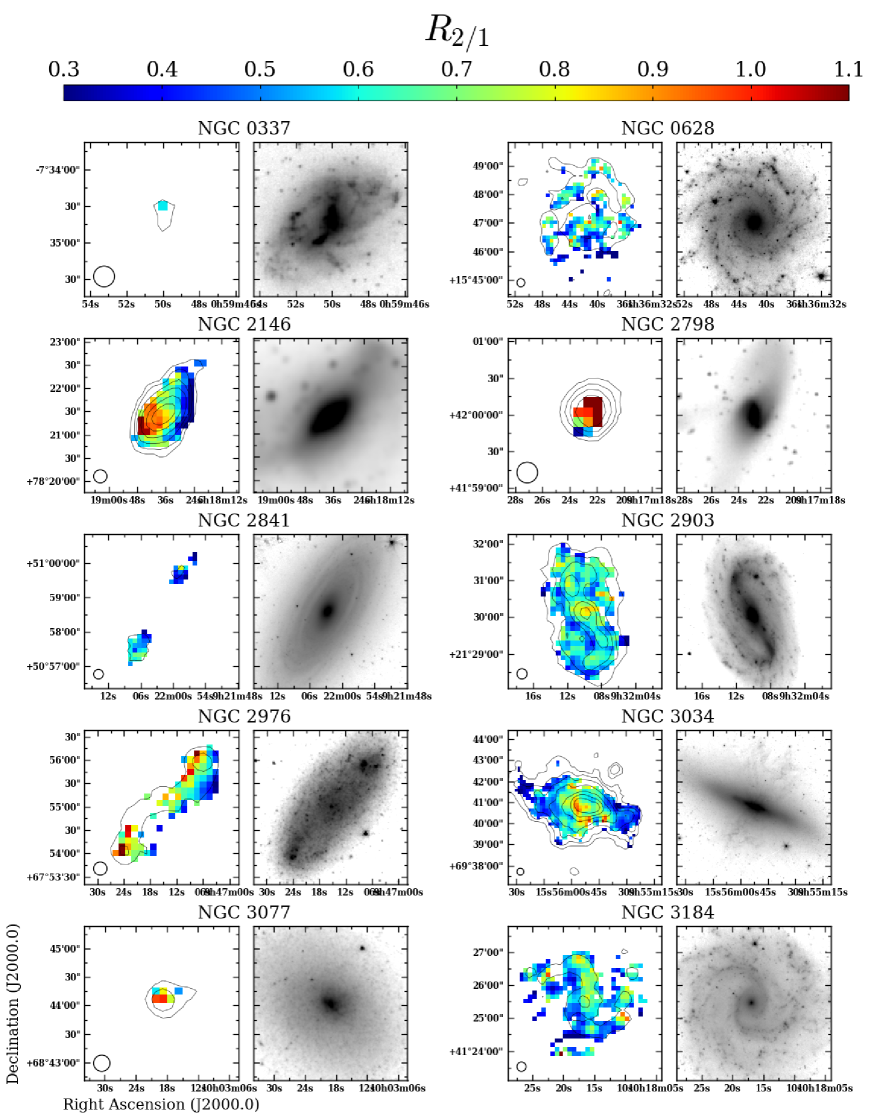
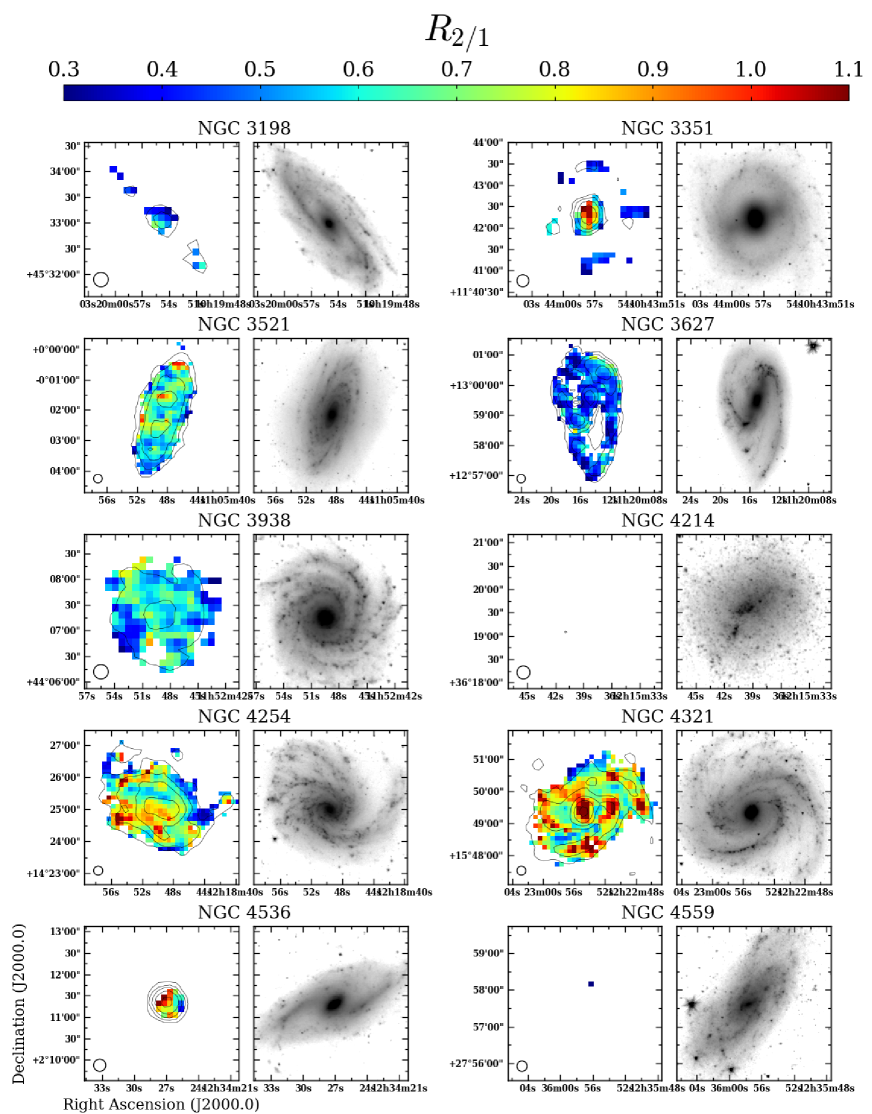
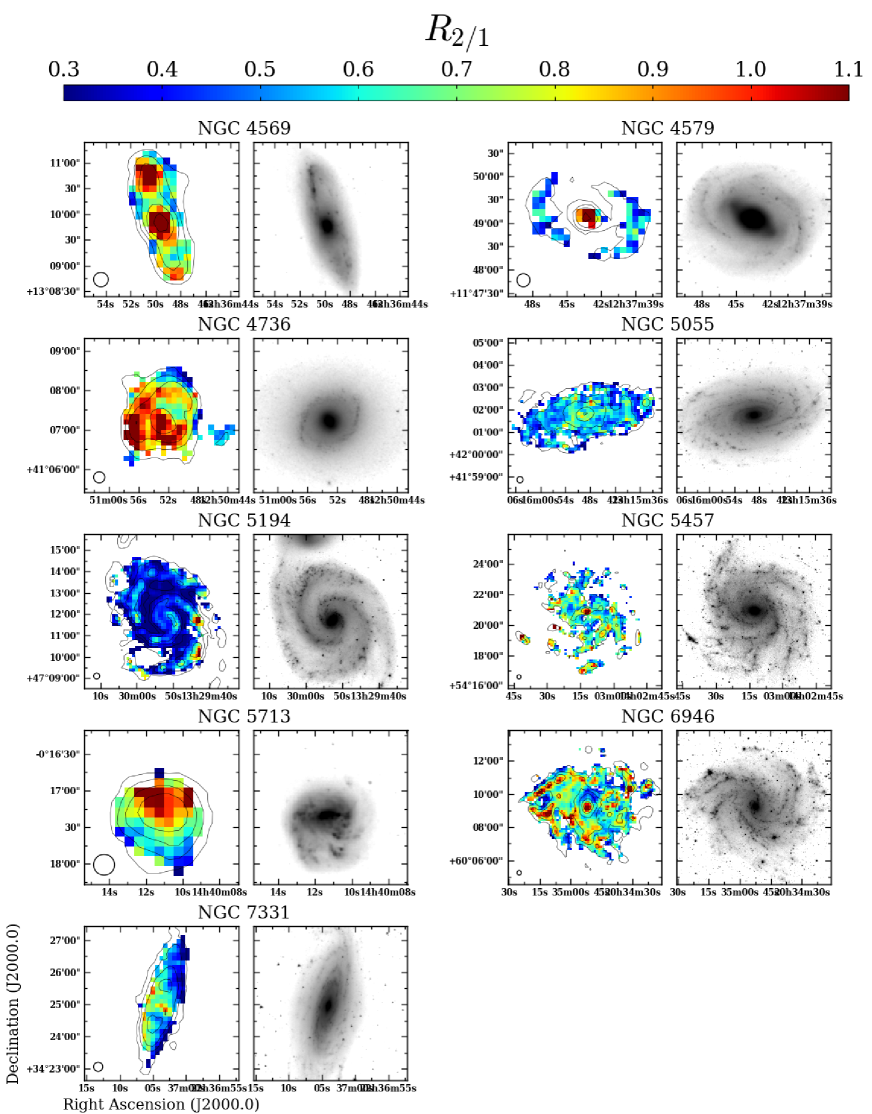
3.1 Maps, histograms, statistics, and radial distribution of
Figure 2 shows the maps for our sample galaxies in the original resolution of COMING (\timeform17”). Here, error of is derived from that of and based on propagation of their error. Each galaxy shows various . For example, NGC 2798 and NGC 4736 show higher () in large area. is low () in most positions of NGC 2841 and NGC 3627. Some galaxies have significant variations within each galaxy. NGC 2146 and NGC 5713 show an gradient from to 0.4. In NGC 4321, is clearly high () in the center and bar ends, low () in inter-arms, and intermediate (0.7–0.8) in arms. In NGC 3351 and NGC 4579, is low in the ring-like structure, whereas is high in the center.
Some galaxies show gradation of from a side to the other (e.g., NGC 2146, NGC 2798, NGC 5713, NGC 7331). We tested these gradations are due to the systematic pointing offset between CO( = 1–0) and CO( = 2–1) observations with spectra at some doubtful positions and residual maps of the first moment maps derived from the lines. According to the test, there is no indication of systematic pointing offset. Gradations of may be caused by interactions (e.g., NGC 2146, NGC 2798, NGC 5713) or appearance of disk due to three-dimensional warp (NGC 7331).
Note that the result for NGC 5194 is not consistent with Koda12. They reported that intensities of CO( = 1–0) data obtained in K07 (the original map is from Nakai94) for this galaxy is times higher than that of Koda11. They argued that a calibration error in the data of Nakai94 was caused by difficulties in the calibration method at that time.
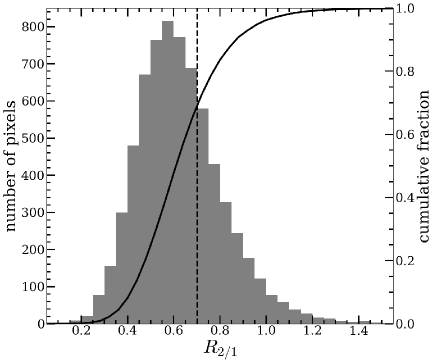
Figure 3 shows the histogram of and the cumulative distribution function for all pixels in all galaxies in the samples. As shown in the figure, the constant value of 0.7 assumed in many cases so far is rather large. The peak of the histogram is in the range of 0.55–0.60; the most frequently appearing value of is lower than 0.7. Cumulative fraction also indicates is quite higher in our samples (cumulative fraction at is %). This is significant even considering error of 13% due to calibration error of CO data. The median, mean weighted by CO( = 1–0) integrated-intensity, and standard deviation of combined for all galaxies are 0.61, 0.66, and 0.19, respectively.
The median we obtained () is slightly lower than the value () reported in Leroy13, while this difference would not be significant considering error due to calibration error is 13% (section 2.2). If this difference is significant, this discrepancy may have originated from differences in observed areas. Most CO( = 1–0) data Leroy13 used are from Usero15, which observed specific positions in a galaxy where CO( = 2–1) is strong. Their observed areas in each galaxy usually include the center of the galaxy where tends to be high as mentioned in the next paragraph. These results and statistics of such as median, , and weighted mean, , for each galaxy are summarized in table 3.1 with some properties of galaxies related to star formation. The relations between and these properties of galaxies are discussed in section 4.1. The histograms of for each galaxy are shown in Appendix 1.
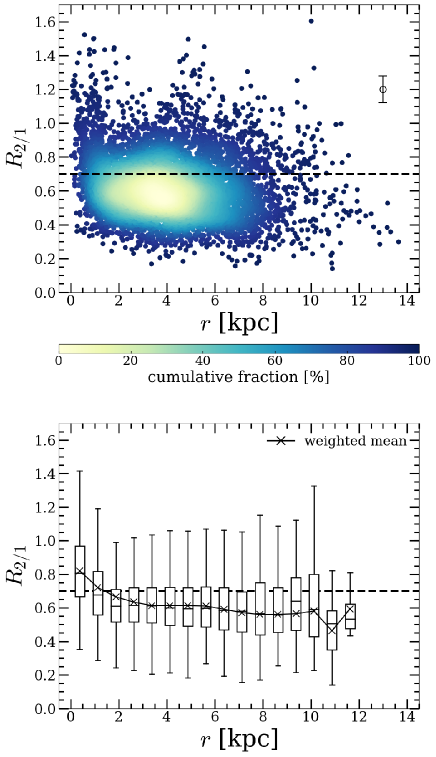
Figure 4 shows as a function of the galactocentric radius for all galaxies. Both the median and weighted mean of in the disk region ( kpc) are nearly constant at 0.60. Although in the disk is lower than 0.7, it tends to exceed 0.7 in central regions. Both the median and weighted mean is 0.83 in the inner 0.75 kpc (the innermost bin of the bottom panel of figure 4). The usually assumed constant value of 0.7 for is common only for the transition region of the galactic center and the disk (1 kpc 2 kpc).
Statistics of and properties of the samples. galaxy [] [] [] (1) (2) (3) (4) (5) (6) (7) all 0.61 0.66 0.19 — — — — NGC 337 — — — — — — — NGC 628 0.54 0.54 0.14 17.5 0.962 1.82 0.363 NGC 2146 0.66 0.73 0.23 113 27.9 0.406 1.22 NGC 2798 0.99 1.0 0.33 44.0 17.8 0.248 1.45 NGC 2841 0.51 0.50 0.12 4.34 0.287 1.51 0.210 NGC 2903 0.59 0.62 0.11 21.8 1.93 1.13 — NGC 2976 0.67 0.67 0.20 3.13 0.527 0.594 0.483 NGC 3034 0.56 0.67 0.15 23.2 3.75 0.617 1.43 NGC 3077 — — — — — — — NGC 3184 0.55 0.56 0.14 14.5 0.756 1.91 0.307 NGC 3198 0.46 0.47 0.10 6.37 0.915 0.697 0.493 NGC 3351 0.48 0.73 0.21 19.4 3.20 0.608 0.765 NGC 3521 0.61 0.63 0.12 31.2 2.17 1.43 0.423 NGC 3627 0.46 0.46 0.10 39.0 2.96 1.32 0.543 NGC 3938 0.56 0.56 0.11 20.5 1.43 1.44 0.409 NGC 4214 — — — — — — — NGC 4254 0.70 0.72 0.17 39.8 3.27 1.21 0.483 NGC 4321 0.76 0.83 0.18 26.7 2.00 1.33 0.421 NGC 4536 0.79 0.84 0.24 54.7 11.5 0.474 1.18 NGC 4559 — — — — — — — NGC 4569 0.76 0.89 0.25 27.5 1.63 1.69 0.420 NGC 4579 0.50 0.63 0.20 20.1 0.890 2.25 0.396 NGC 4736 0.84 0.88 0.24 20.8 2.90 0.718 0.870 NGC 5055 0.54 0.56 0.11 18.2 0.87 2.11 0.330 NGC 5194 0.40 0.41 0.16 — 2.98 — 0.436 NGC 5457 0.62 0.64 0.18 15.3 0.89 1.72 0.336 NGC 5713 0.72 0.80 0.24 61.3 9.35 0.656 0.804 NGC 6946 0.67 0.71 0.17 29.6 1.85 1.60 0.491 NGC 7331 0.53 0.55 0.17 18.3 1.11 1.65 0.426 {tabnote} (1) Median of . (2) Mean of weighted by integrated intensity of CO( = 1–0) averaged over the pixels where is significantly measured (cf. figure 2). (3) Standard deviation of . (4)–(5) Mean surface density of molecular gas and SFR. The area used to derive these means are the same as column (2). (6) Mean depletion time derived as total molecular gas mass over total SFR within the area used in column (2). (7) Mean IR color derived as total luminosity of 70 over that of 160 within the area used in column (2). ∗*∗*footnotemark: There are few or no pixels to measure . ††{\dagger}††{\dagger}footnotemark: Archival data is not available. ‡‡{\ddagger}‡‡{\ddagger}footnotemark: There may be calibration error of CO data. §§\S§§\Sfootnotemark: Not derived due to the possibility of calibration error.
3.2 Effects of on molecular gas mass derived from CO( = 2–1)
As effects originated from the assumption that is a constant, we report that how molecular gas mass is underestimated or overestimated and how the scatter of molecular gas surface density within a galaxy changes. We adopted the standard CO-to-H conversion factor of (Bolatto13) for the entire area of all galaxies based on the widely used method.
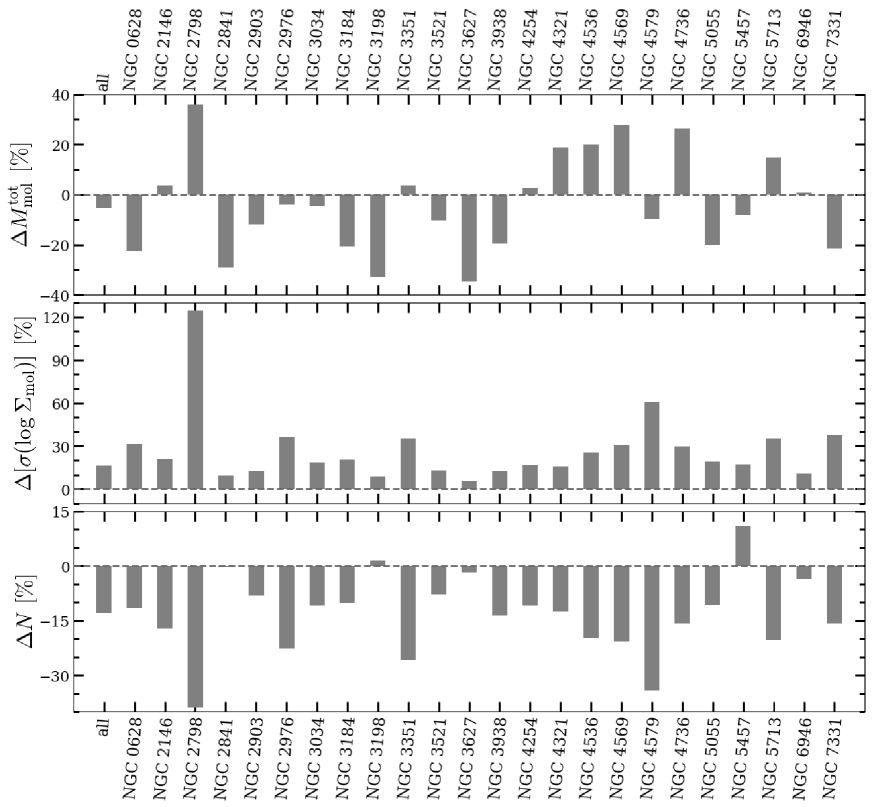
The top panel of figure 5 shows how the total molecular gas mass within a galaxy changes (rate of change in total molecular gas mass; ) when the molecular gas mass is derived from CO( = 2–1) with the of 0.7 compared with the case wherein is derived from CO( = 1–0). For instance, % indicates that the total molecular gas mass derived from CO( = 2–1) is underestimated by 20%. NGC 337, NGC 3077, NGC 4214, and NGC 4559 are omitted because cannot be significantly measured in most positions in these galaxies (figure 2) and NGC 5194 is omitted due to the possibility of the calibration problem as mentioned in section 3.1.
As deviates from 0.7 (table 3.1), the total molecular gas mass within a galaxy is underestimated or overestimated when the molecular gas mass is derived from CO( = 2–1) assuming the constant of 0.7. For instance, the total molecular gas mass is underestimated by % for galaxies that show low (; e.g., NGC 2841, NGC 3198). Further, it is overestimated by % when is high (; e.g., NGC 2798, NGC 4569, NGC 4736). For the most deviated galaxy, the molecular gas mass is underestimated by % in NGC 3627.
The middle panel of figure 5 shows the change rate of standard deviation for , , in each galaxy when is assumed to be the constant. is positive for all galaxies and exceeds 30% in some galaxies (NGC 628, NGC 2798, NGC 2976, NGC 3351, NGC 5713, and NGC 7331), and the highest one reaches 120% (NGC 2798). When the scatter of , , is relatively large () or when deviates from 0.7, tends to be large. In contrast, when is small, is also small (e.g., NGC 3627). These results indicate that not only the total molecular gas mass but also molecular gas surface density and its relevant quantities in positions-to-position are misled by the assumption of the constant . This becomes an issue when spatially resolved data are used, which has been the standard recently.
3.3 Effects of on the Kennicutt–Schmidt relation derived from CO( = 2–1)
Fitted parameters of the K–S relation. galaxy [%] [%] (1) (2) (3) (4) (5) (6) all NGC 337 — — — — — — NGC 628 NGC 2146 NGC 2798 NGC 2841 NGC 2903 NGC 2976 NGC 3034 NGC 3077 — — — — — — NGC 3184 NGC 3198 NGC 3351 NGC 3521 NGC 3627 NGC 3938 NGC 4214 — — — — — — NGC 4254 NGC 4321 NGC 4536 NGC 4559 — — — — — — NGC 4569 NGC 4579 NGC 4736 NGC 5055 NGC 5457 NGC 5713 NGC 6946 NGC 7331 {tabnote} (1) Index of the K–S relation derived from CO( = 1–0). (2) Index of the K–S relation derived from CO( = 2–1) and the constant of 0.7. (3) Change rate of index. (4) Intercept of the K–S relation derived from CO( = 1–0). (5) Intercept of the K–S relation derived from CO( = 2–1) and the constant of 0.7. (6) Change rate of intercept. ∗*∗*footnotemark: The spatial resolution is different from 1.5 kpc (cf. table 2).
Next, we investigate how the Kennicutt–Schmidt (K–S) relation (Schmidt59; Kennicutt89) changes when the molecular gas surface density is derived from CO( = 2–1) and the fixed compared with that derived from CO( = 1–0). The molecular K–S relation is described as
| (4) |
where is the index and is the intercept on the double-logarithmic plot. Several studies suggested that this relation, in particular , reflects the processes of star formation in galaxies (e.g., Elmegreen02; Krumholz05; Komugi06; Tan10; Takeuchi, T., T. et al. 2020 in preparation). Therefore, we focused on how changes in this study.
When the spatial resolution is changed, the result of the K–S relation also changes (Onodera10). Thus, we smoothed CO cubes and maps so that the spatial resolution is the same value of 1.5 kpc for all galaxies except for NGC 337, NGC 2146, and NGC 5713. Since the original spatial resolution of these three galaxies is larger than 1.5 kpc (table 2), we did not smooth them. We also regridded CO cubes and maps to fix spatial sampling (i.e., pixel size) for all galaxies. The pixel size is set to 650 pc which is slightly smaller than the Nyquist sampling. For convolved and regridded data, pixels whose of integrated-intensities does not reach 4.5 were masked. We made K–S plots from CO( = 1–0) by adopting the standard of for the entire area of all galaxies according to the widely used method. The K–S plots from CO( = 2–1) are obtained by converting CO( = 2–1) intensity into that of CO( = 1–0) with the constant of 0.7, which is the same method employed in previous studies about the K–S relation with CO( = 2–1) (e.g., Bigiel08).
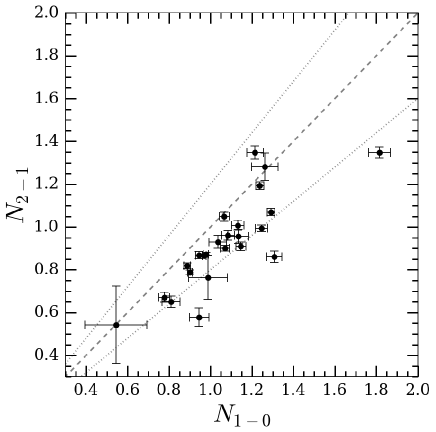
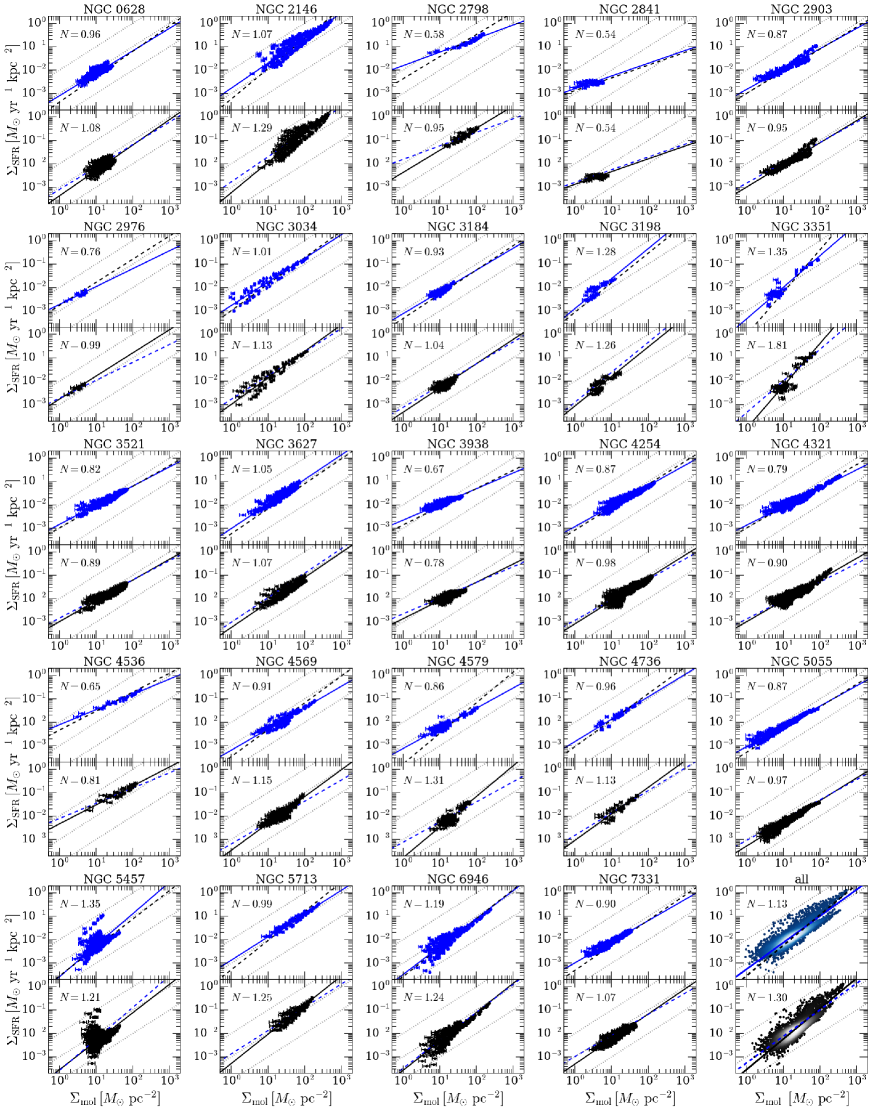
We fitted the K–S relation with the ordinary least-squares (OLS) bisector method (Isobe90) and derived and of the relation made with CO( = 1–0) and CO( = 2–1), respectively. Indices derived from CO( = 1–0) and CO( = 2–1) (hereafter, and , respectively), intercepts from the two CO lines (similarly, and , respectively), and their rates of change ( and ) are listed in table 3.3. The bottom panel of figure 5 indicates the change rate of indices; figure 6 shows the correlation plot of against . The K–S plots of each galaxy are shown in figure 7. We could not fit the K–S relation for NGC 337, NGC 3077, NGC 4214, and NGC 4559 because the number of pixels at which is significantly measured is not enough. Therefore, these four galaxies were excluded from the K–S relation of all compiled galaxies in the samples (the last panel in figure 7).
We find that indices decrease typically by 10–20%, up to 39%, when the relation is derived from CO( = 2–1) with the constant in 17 galaxies. The K–S relation using molecular gas surface density derived by this method produces a lower index than that derived by CO( = 1–0) for most galaxies. This tendency is the same as Momose13 that discussed the discrepancy between their super-linear slope of the K–S relation derived by CO( = 1–0) and the linear slope derived by CO( = 2–1) reported in Bigiel08. The significant change () of the index is shown in NGC 2798, NGC 2976, and NGC 3351. In these galaxies, within a galaxy tends to be relatively larger than others (table 3.1). When the variation of in a galaxy is small (e.g., NGC 3198, NGC 3627), is small (). The differences of the K–S relation for all sample galaxies also shows a lower index ().
We interpret these underestimated indices of the K–S relation derived from CO( = 2–1) as follows. is often higher than 0.7 when and are high (the top right on the K–S plot), while is prone to be lower than 0.7 when and are low (the bottom left on the K–S plot). Here, we mean that “” is derived from CO( = 1–0). As a result, molecular gas surface density derived from CO( = 2–1) with the fixed of 0.7 is overestimated (data points move to right in the plot) where and are high, and it is underestimated (data points move to left in the plot) where and are low (we examine correlations of , , and in section 4.1; figures 8 and 9). This becomes prominent in galaxies whose is large, as seen in the plot of NGC 2798, NGC 3351, and NGC 4579 of figure 7. We note that indices are underestimated even if is assumed as the mean or median of in a galaxy.
When the K–S relation is derived from higher- CO lines such as CO( = 3–2), the same tendency of lower indices is seen (Morokuma17). Dense gas tracers also produce nearly linear K–S relations, whereas CO( = 1–0) produces super-linear relations (e.g., Gao07; Kennicutt89). According to these results, it seems that indices of the K–S relation become low when the relation is derived from the molecular gas, that is more related to star-formation activity. We conclude that the K–S relation, the basic relation of molecular gas with star formation, will be misinterpreted, in addition to total molecular gas within a galaxy and surface density of molecular gas when CO( = 2–1) is used as a molecular gas tracer with a fixed . Previous studies of the K–S relation using molecular gas surface density derived from this method would underestimate their indices.
4 Discussion
4.1 Correlations of with basic properties of galaxies
To investigate how changes depending on basic properties of galaxies such as , correlations of with representative quantities are examined in this section. The spatial resolution and grid spacing are fixed to be 1.5 kpc and 650 pc except for NGC 337, NGC 2146, and NGC 5713, similar to the K–S relation case (these three galaxies were analyzed with their original resolution as shown in table 2).
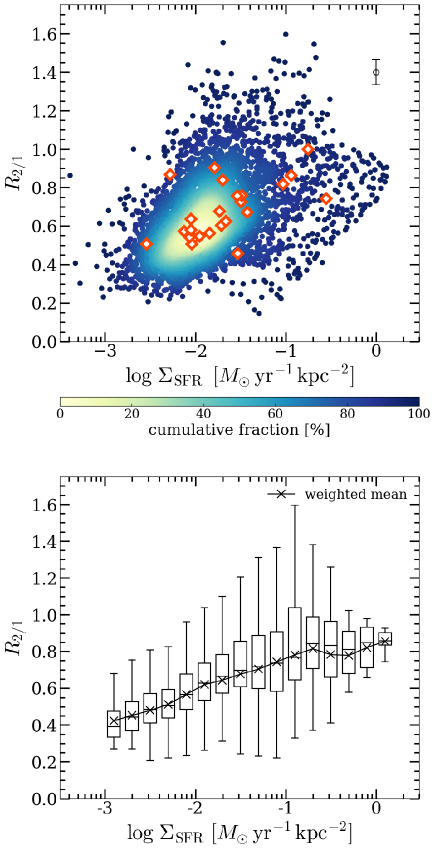
First, we describe the correlation of with . The top panel of figure 8 shows the correlation plot of against for spatially resolved data and integrated data over the pixels where is significantly measured (table 3.1, figure 2). The bottom panel of the figure shows the box plot for the top panel binned with 0.2 dex and the mean weighted by CO( = 1–0) integrated-intensity in each bin. The Spearman’s rank correlation coefficient () for the spatially resolved case and the integrated one are 0.47 and 0.51, respectively. Although the scatter is rather large, and in each bin clearly increase from to as increases. This result is consistent with Koda12 and Koda20, whereas the spatial resolution of the former is approximately twice higher than ours. From this result, possibilities are as follows: one main physical factor to change can be star-formation feedback (i.e., high is a result and high is a cause) or becomes high because the molecular gas is dense and as a result, the star-formation rate is high (i.e., high-density condition is a cause and high and high are results). Otherwise, this correlation might be just mere coincidence.
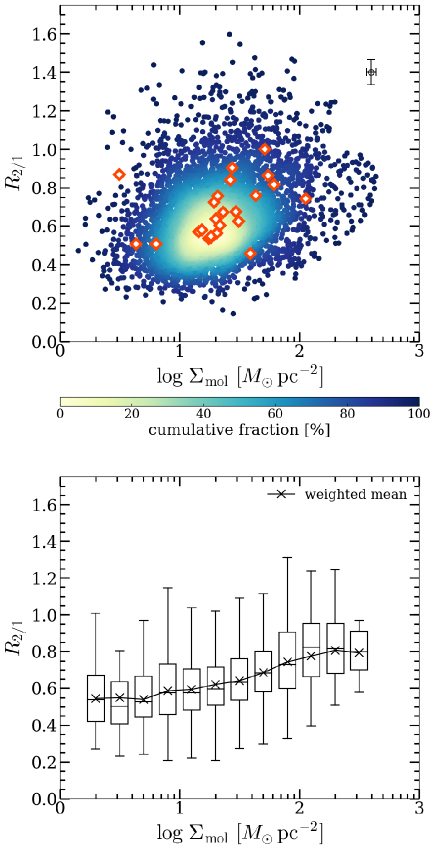
Second, we investigate the dependence of on as shown in figure 9. Mean is derived by the same method of that for mean case. loosely increases from to as increases according to the bottom panel, while there seems to be no clear tendency according to the scatter plot in the top panel. The for the spatially resolved and global result is 0.28 and 0.51, respectively. Since the tendency of against is clearer than that against , the lower indices of the K–S relation using molecular gas mass derived from CO( = 2–1) (discussed in section 3.3) are mainly due to fluctuated by rather than .
Third, the correlation between and the depletion time of molecular gas () is examined. The is derived as the following equation:
| (5) |
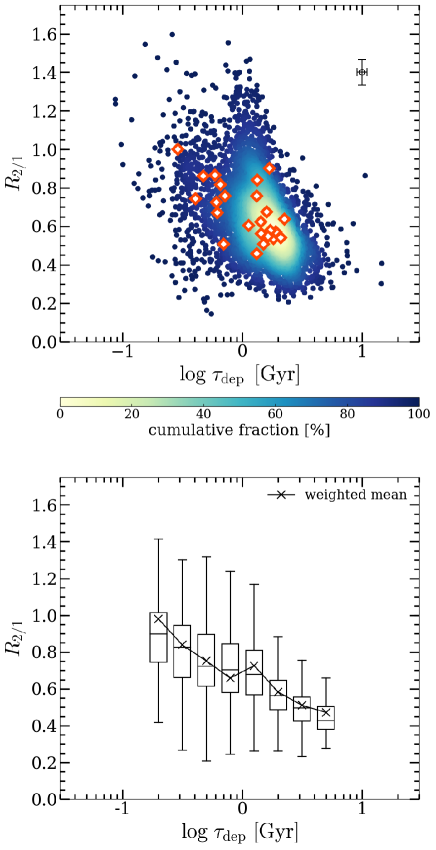
Figure 10 shows the relation between and in the same way as figure 8. Mean is derived by dividing total molecular gas mass by total SFR within the pixels where is significantly measured. Both the top and bottom panels show significantly decreased as increases. This relation is also consistent with Koda12 (note that their horizontal axis is proportional to SFE that is equivalent to the reciprocal number of ). The for the spatially resolved and integrated case is and , respectively. and decrease from to when increases from Gyr to Gyr. Therefore, may be related to an efficient conversion from molecular gas into stars because of the dense condition (e.g., Muraoka16; Yajima19). As another possibility, molecular gas is easily warmed by active star formation (heat source) with poor molecular gas (low heat capacity) when is short. These possibilities are relevant to the dense or warm conditions of molecular gas likely mentioned in the case.
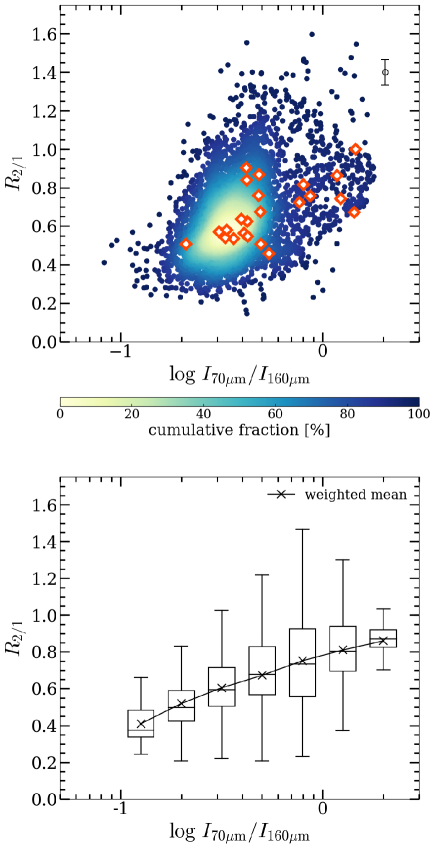
Finally, the correlation of with IR color is examined. The IR color is derived from Herschel/PACS 70- and 160- intensity ratios. Usually, the peak of spectral energy distribution (SED) for cool dust, which is dominant in ISM, is around the 160- band. Therefore, this band selection well reflects dust temperature, especially in the present case of lacking data of the long-wavelength side for most of the sample galaxies. Cool dust temperature may also be a good probe of ISM conditions. Since there is no archival data of PACS for NGC 2903, we do not derive IR color for this galaxy. Figure 11 shows the correlation between and IR color and the box plot in the same manner as figure 8. The mean IR color is derived from the ratio of total intensity of to that of within the pixels where is significantly measured. The of the spatially resolved and integrated case is 0.39 and 0.49. Both and increase from to as IR color increases (corresponding dust temperature is from K to K) similarly to the case. The tendency is consistent with Koda20. However, the correlation coefficient between and IR color is higher than that for and in their paper, whereas it is not higher (0.47 and 0.39) in our results. This difference may be originated from far IR band selection and sample selection because their resolution is comparable to ours (their resolution is 1.2 kpc and ours is 1.5 kpc).
4.2 and physical properties of molecular gas
4.2.1 and CO( = 1–0)/CO( = 1–0) ratio
In this section, we investigate how properties of molecular gas themselves (such as density and temperature) change . We obtained CO( = 1–0) maps of the COMING galaxies in our samples. Therefore, the number density of molecular gas, , and the kinetic temperature of molecular gas, , can be derived with a non-local thermodynamic equilibrium (non-LTE) analysis with integrated-intensity ratios of the three lines (Scoville74; Goldreich74).
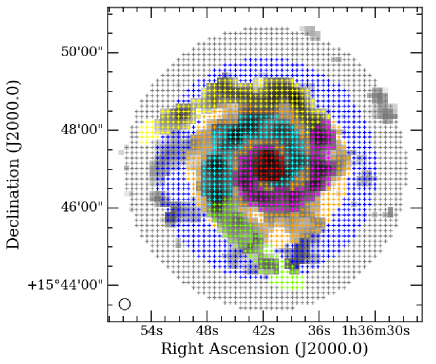
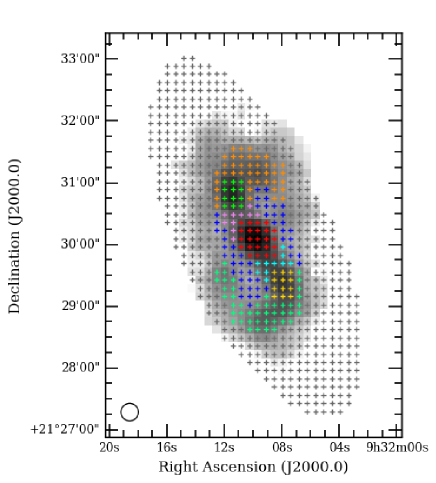
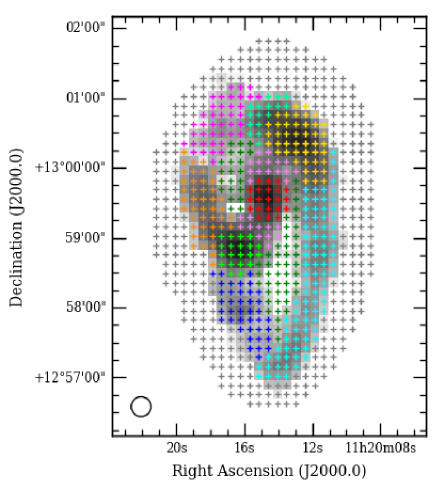
Since CO( = 1–0) emission is weak compared with CO lines, we measured the integrated intensity with the velocity-alignment stacking analysis (Schruba11; Morokuma15) within concentric annuli or galactic structures such as arms and the bar. We determined galactic structures for NGC 628, NGC 2903, and NGC 3627 because the structures of these three galaxies can be clearly seen in the integrated-intensity maps of the CO lines. The determined structures are shown in figures 12–14. For other galaxies, the regions for spectra stacking are determined as concentric annuli whose width is . To align spectra along the velocity axis, we used the first-moment maps of H\emissiontypeI obtained by The H\emissiontypeI Nearby Galaxy Survey (THINGS; Walter08) if a galaxy was observed in the survey. The H\emissiontypeI first-moment maps enable us to stack spectra even in outer disks. When H\emissiontypeI data is not available, the first-moment maps of CO( = 2–1) are used.
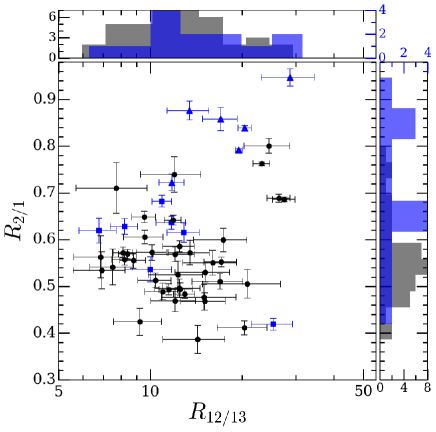
Integrated intensities, integrated-intensity ratios, and full width at half maximum (FWHM) of stacked spectra are summarized in Appendix 2. The 3 lower limit of CO( = 1–0)/CO( = 1–0) integrated-intensity ratio (hereafter, denoted as ) is adopted when of CO( = 1–0) integrated-intensity is lower than 3 . Prior to the non-LTE analysis, we discuss the relation of and as a bare observed quantity. Figure 15 shows the correlation plot of against .
Regions where of CO( = 1–0) is poor (derived as only the upper limit of integrated intensity) even with stacking are mainly inter-arms and outer disks. Since the area where CO( = 1–0) is emitted is much smaller than that of CO lines in such regions, a different beam-filling factor may be effective, i.e., the line ratio is no longer a probe of molecular gas properties.
In figure 15, it appears that there are two components (or groups): one is that both and are high and the other is not so high () with various (–20). The former largely includes central regions of galaxies with active star formation (mean within inner or within the region defined as “center” is higher than 0.1 yr kpc; NGC 2146, NGC 2903, NGC 3034, NGC 3351, NGC 4536, and NGC 5713). The latter corresponds to galactic disks and centers with quiescent star formation (mean in the region is lower than the value above). The same tendency of decreasing with increasing can be seen in results of another survey (Cormier18). It is likely that systematic differences of molecular gas properties between the central region and the disk influencing and are seen in the figure. Among galactic structures in disks (arms, inter-arms, and bars etc.), tends to be relatively low in bars and inter-arms, and high in arms and bar ends, although the contrast of is low (see results of stacked spectra for NGC 628, NGC 2903, and NGC 3627 in Appendix 2). In addition, the tendency of and among these structures roughly follow the disk-phase feature (i.e., decreases as increases). Previous studies about suggested that high indicates low (Meier04), high (Paglione01), or low abundance of CO due to selective photodissociation (e.g., Davis14). Since is also high in galactic centers with active star formation, both high and high conditions are possible.
4.2.2 Non-LTE analysis using
To compare with intrinsic molecular gas properties, and are derived with the non-LTE analysis. In this study, we made use of the 1D non-LTE radiative transfer code RADEX (vanderTak07). Settings for RADEX are based on those in Yajima19.
Input parameters for calculations are , , column density of CO of all energy levels (), that of CO (), and FWHM of a GMC’s spectrum (). To derive and from column density of H with observed , abundance ratios of [CO]/[H], [CO]/[CO], and were basically adopted as (Pineda08), 70 (the solar neighborhood value; Milam05), and cm (K km s) (Bolatto13), respectively. For the central region of galaxies, [CO]/[CO] and were also adopted as 40 and cm (K km s), respectively, to reflect the environment of galactic centers (e.g., Meier01; Oka01). The escape probability of photon was calculated based on the Sobolev approximation (Sobolev60).
The FWHM of GMCs was estimated by assuming that in a region is proportional to the FWHM of the stacked spectrum in the region as described below. This is because molecular gas is a continuous medium and GMCs do not have a rigid boundary. Thus, internal kinematics of GMCs is likely to be influenced by dynamics of surrounding gas (i.e., large-scale dynamics), especially in bar ends and bars where large velocity dispersion can be seen. In addition, since our velocity resolution is 20 km s and our spatial resolution is a kpc order, which are much wider than the typical velocity width of GMCs and much larger than the typical size of them, FWHM of a stacked spectrum, , reflects velocity dispersion among molecular clouds within the beam. This is a good indicator of large-scale dynamics of molecular gas.
At first, of a stacked spectrum within the entire disk in each galaxy was measured (hereafter, this is denoted as ) and the of 5.0 km s was adopted corresponding to . This velocity of 5.0 km s as the standard of in the entire disk was determined based on the typical FWHM of GMCs in the disk of the Milky Way (e.g., Heyer09). Next, the of 20 km s was adopted corresponding to of the galaxy center (hereafter, denoted as ). This 20 km s is based on FWHM of GMCs found in the central region of galaxies and the Milky Way (e.g., Oka01; Leroy15). Then, the for each region (i.e., each annulus or galactic structure) was calculated by linearly interpolating or extrapolating with its , , and . That is, the for region () is determined by the following equation:
| (6) |
where
| (7) | |||||
| (8) |
and is the FWHM of the stacked spectrum in the region. The reason why the for the innermost region is fixed to be 20 km s is mainly reflects not velocity dispersion in a large scale but the velocity gradient due to the rigid rotation of the galactic disk. High-resolution observations support increasing as close to the galactic center in inner disks (e.g., Sun20). Note that is not monotonically increases towards the center in outer disks. Since in outer disks is almost constant, is also constant (see the result of NGC 5055 in Appendix 2).
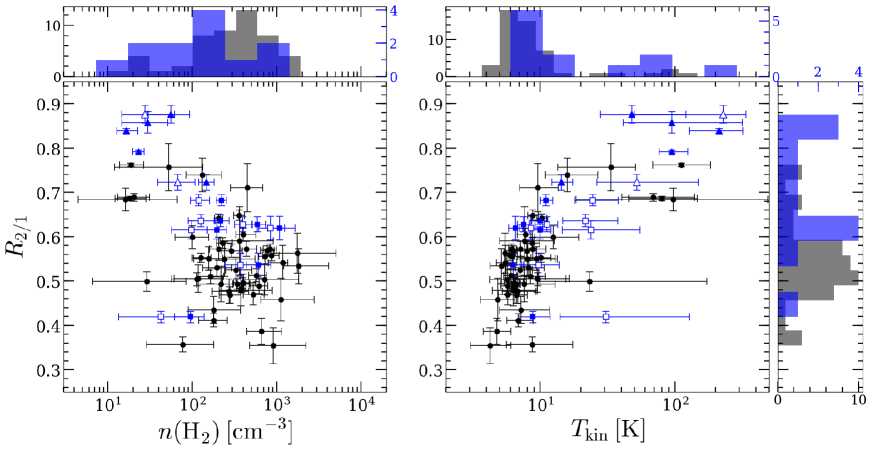
Derived , , and ancillary results of excitation temperature for CO( = 1–0), CO( = 2–1), and CO( = 1–0) [, , ], and optical depth of these lines [, , ] are listed in table Acknowledgments. Errors of and are derived from errors of and . Namely, four pairs of [, ] are obtained from and (where and are errors of and , respectively). Errors of , toward the positive direction are adopted as , where is and derived from and , and is and derived from and . Errors of , toward the negative direction are adopted as . Errors of other ancillary quantities such as intrinsic intensities and excitation temperature are nearly the same factor of errors for and . There are no solutions of RADEX calculations in several regions. These are caused by the low of CO( = 1–0) even with stacking. It is also possible that the one-zone model adopted for RADEX is not valid because the area seen in CO( = 1–0) is much smaller than those seen in CO( = 1–0) and CO( = 2–1). Based on these RADEX results, we examined the dependence on and as shown in figure 16.
There is a clear tendency that increases with , while seems to decrease with increasing . The Spearman’s rank correlation for and is 0.67 with a -value of and that for and is ; however, it is not statistically significant with the significance level of 5% (-value is 0.06). In addition, the tendency of increased with is not changed even when different [CO]/[CO] and for galactic centers {[CO]/[CO] = 40 and cm (K km s)} are adopted. The result indicates that the variations of in galaxies seen in kpc-scale resolutions reflect the temperature of molecular gas. As discussed in section 4.1, the positive correlation between and indicates that varies depending on or [high enhances and or high ) induces high and ]. Based on the results of the non-LTE analysis, the correlation implies the former case. Radiation feedback from stars warms dust and molecular gas directly and/or dust warms molecular gas; therefore, becomes high, as suggested by Koda20.
Moreover, it seems that there are two phases of molecular gas. One is relatively dense (10–10 cm) and cold (5–10 K) with . Its correlation of with is tight and steep but no clear correlation with . The other is the diffuse (20–300 cm), warm (30–200 K) with high , and it is loosely correlated with and . The former corresponds to results for disk regions and galactic centers with quiescent star formation (low and low indicated by black markers and blue squares in figure 15). The latter is the central regions of galaxies with active star formation (high and high ) indicated by blue triangles in the figure. Differences of molecular gas properties in disks and galactic centers are tested with the Kolmogorov–Smirnov test (i.e., for black and blue histograms in figure 16). It is confirmed that the hypothesis that and are the same between the disks and galactic centers is rejected at the significance level of 5%; however, that for cannot be rejected at the same level (-value is 0.15). In short, differences of molecular gas phases in disks and centers are clearly seen in and physical properties planes, especially for , at the kpc-scale resolutions.
The relation between and seems inconsistent with other studies for GMCs (Sakamoto94; Nishimura15; Penaloza18), although the negative correlation of with is not statistically significant. For instance, is high in not only warm environments but also dense regions such as ridges and filaments in molecular clouds in these studies. The discrepancy is because spatial scale is quite different between ours (kpc scale) and theirs (order of pc scale), and dynamic range of characteristic is much wider for cloud-scale studies than galactic-scales. If observations with such high spatial resolution for galaxies is conducted, high with high would appear. Furthermore, observations for molecular clouds in the Milky Way do not contain high and high environments (common in galactic centers with active star formation) that show warm and diffuse conditions via non-LTE calculations. Thus, the discrepancy possibly originated from observed environments (represented on the – plane). Related to it, this negative correlation would be produced by data distribution of the bimodality of molecular gas properties seen in figure 15.
Moreover, studies of molecular gas in other galactic centers support our results of high with warm diffuse molecular gas seen in central regions with active star formation. For example, Meier00 suggested that there are two phases of molecular gas: warm diffuse layers and cold dense clumps in the starburst nucleus of IC 342. In addition, low- CO lines, in particular CO( = 2–1), are dominantly emitted in such warm diffuse molecular gas. Israel03 modeled properties of molecular gas in the center of IC 342 and Maffei 2 (this galaxy also has the modest starburst nucleus) with transitions of CO from = 1 to = 4; those of CO from = 1 to = 3 and [C \emissiontypeI]. Further, they argued the existence of the warm diffuse molecular gas of –150 K and cm associated with the photon-dominated region (PDR), and the cold dense clumps of –20 K and cm. It was also suggested that this warm diffuse molecular gas accounts for approximately 2/3 of the total molecular gas. Our results of physical properties with high reflect such hot diffuse molecular gas related to PDR.
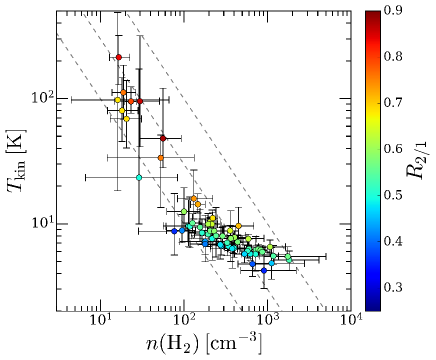
Figure 17 shows distribution on the – plot. Most of molecular gas is nearly under the pressure equilibrium of a few K cm. This figure indicates that both and pressure of molecular gas are important for variations of in galaxies. That is, even when pressure is so high ( K cm), is not always high (–0.6) as long as is low ( K). Similarly, is not always very high () even when is high ( K) as long as pressure is not relatively high ( K cm).
Our results of and molecular gas properties suggest an issue of molecular gas mass derived from CO( = 2–1) according to fluctuated and as follows. Some studies reported that is lower in galactic centers, (ultra-) luminous infrared galaxies, and mergers than that in disks (i.e., hosting active star formation; e.g., Oka01; Narayanan11; Papadopoulos12; Sandstrom13222Sandstrom13 assumed the constant to derive molecular gas mass from CO( = 2–1), however, the tendency of lower CO-to-H conversion factors in galactic centers can also be seen in CO( = 1–0)-based studies.; Yasuda et al. 2020 in prep). In these systems, should be higher than in normal disks considering our results (e.g., figure 4, 8, 11, 16, and 17). In addition, the recent synthetic observation of CO( = 1–0) and CO( = 2–1) in a 3D magneto-hydrodynamics simulation (Gong20) shows that is low in the environments where is high. Hence, the molecular gas mass derived from CO( = 2–1) is more overestimated in active star-formation environments when the constant and are adopted because . When increases and decreases, the fluctuation of is amplified. Based on the reported variations of so far, active star-formation environments lead to more overestimated molecular gas if CO( = 2–1), constant , and fixed are used compared with the CO( = 1–0) case.
5 Conclusions
We present the variations of CO( = 2–1)/CO( = 1–0) line ratio () within and among galaxies, the effects of the assumption that is a constant on the derivation of molecular gas mass, and the properties of molecular gas reflecting variations of in 24 nearby galaxies on kpc scales. The main conclusions of this paper are as follows:
-
(1)
The median and mean weighted by CO( = 1–0) integrated-intensity for spatially resolved data of galaxies in our samples are 0.61 and 0.66, respectively, with the standard deviation of 0.19. varies from 0.4 to 0.9 among and within galaxies. While in the galactic centers (inner kpc) is typically higher (), the median of in disks (exterior to kpc) is nearly constant at 0.60.
-
(2)
The total molecular gas mass within a galaxy derived from CO( = 2–1) is underestimated or overestimated by % for most galaxies, and at most by 35%, when is assumed to be the constant of 0.7. In addition, the scatter of molecular gas surface density () by CO( = 2–1) within a galaxy increases in all galaxies. Its change rate exceeds % in some galaxies, and it is 120% in the highest case when the constant is adopted. This increased scatter of is serious for mapping (spatially resolved) observations.
-
(3)
The indices of the Kennicutt–Schmidt relation using molecular gas surface density derived from CO( = 2–1) and become lower by 10–20%, up to 39% compared with that using CO( = 1–0) for 17 galaxies out of 24. This is because tends to be higher than 0.7 when and are high while is often lower than 0.7 when and are low. Underestimated indices are prominent when the scatter of within a galaxy is large.
-
(4)
has positive correlations with and IR color and the negative correlation with depletion time of molecular gas. These suggest that becomes high by warmed molecular gas from stars (stars influence on molecular gas properties and ). Otherwise, is high because molecular gas is dense; as a result, star formation is active (molecular gas properties influence on star formation activity and ). There is no clear tendency between and .
-
(5)
Comparing with CO( = 1–0)/CO( = 1–0) line ratio () measured within each galactic structure or concentric annulus, there seems to be two components; one is both and are high, and the other is relatively low with various . The former corresponds to molecular gas in galactic centers with active star formation (mean within inner or the region defined as “center” is higher than 0.1 yr kpc) and the latter corresponds to that in disk regions and centers of galaxies with quiescent star formation (mean in the region is lower than the above value).
-
(6)
According to the non-LTE analysis, there is a clear tendency that increases with ; however, and show a rather negative correlation but it is not statistically significant. This suggests that variations of on kpc scales imply the temperature of molecular gas. The dependence of on would appear when the spatial resolution is higher. Stellar radiation feedback influences molecular gas properties and . The bimodality caused by differences of properties between galactic centers and disks seen on the – plane can also be seen on the – and – plots. Molecular gas in the centers is warm and diffuse, and its has relatively loose correlations between and . The disk phase molecular gas is cold, relatively dense, and its is tightly correlated with ; however, it has no relation with .
-
(7)
Not only but also pressure of molecular gas is important to understand variations in galaxies. Namely, even when pressure is so high ( K cm), is not always high (–0.6) as long as is low ( K). Likewise, even when is high ( K), is not always very high () as long as pressure is not relatively high ( K cm).
-
(8)
Considering variations of the CO-to-H conversion factor , molecular gas mass in active star-formation environments such as galactic centers and (U)LIRGs is more overestimated when it is derived from CO( = 2–1) and the constant of 0.7. This is because molecular gas mass is , decreases, and increases [where is integrated intensity of CO( = 2–1)]. As a result, fluctuations of are amplified.
Acknowledgments
We are grateful to the anonymous referee for the constructive, meaningful comments and suggestions that significantly improve the manuscript. We also thank the staff of Nobeyama Radio Observatory for their help in our observations with the 45-m radio telescope and the continuous efforts to improve the performance of the instruments. This work has been partially supported by JSPS Grants-in-Aid for Scientific Research (17H01110, 18K13593, 19H05076). This work has also been supported in part by the Sumitomo Foundation Fiscal 2018 Grant for Basic Science Research Projects (180923), and the Collaboration Funding of the Institute of Statistical Mathematics “New Development of the Studies on Galaxy Evolution with a Method of Data Science”. The Nobeyama 45-m radio telescope is operated by Nobeyama Radio Observatory, a branch of National Astronomical Observatory of Japan. This work made use of HERACLES, ‘The HERA CO-Line Extragalactic Survey’ (Leroy et al. 2009). This research has made use of the NASA/IPAC Extragalactic Database, which is operated by the Jet Propulsion Laboratory, California Institute of Technology, under contract with the National Aeronautics and Space Administration. This research has made use of the NASA/ IPAC Infrared Science Archive, which is operated by the Jet Propulsion Laboratory, California Institute of Technology, under contract with the National Aeronautics and Space Administration. This research also made use of APLpy, an open-source plotting package for Python (Robitaille12). We would like to thank Editage (www.editage.com) for English language editing.
Derived physical properties of molecular gas with the non-LTE analysis. galaxy region (1) (2) (3) (4) (5) (6) (7) (8) NGC 628 center inner arm1 inner arm2 outer arm2 inter-arm1 center NGC 2146 center ring1 ring2 center — — — — — — — — NGC 2841 ring2 ring3 ring4 NGC 2903 center northern bar southern bar northern bar end southern bar end northern arm southern arm inter-arm — — — — — — — — outer disk center NGC 2976 center — — — — — — — — ring1 ring2 ring3 NGC 3034 center ring1 ring2 center — — — — — — — — NGC 3198 center ring1 center NGC 3351 center ring1 ring2 center NGC 3521 center ring1 ring2 ring3 center
(Continued.) galaxy region (1) (2) (3) (4) (5) (6) (7) (8) NGC 3627 center bar northern bar end southern bar end western arm eastern arm offset stream southern arm arm-bar end inter. region center NGC 3938 center ring1 ring2 ring3 center NGC 4536 center center — — — — — — — — NGC 4579 center — — — — — — — — ring1 ring2 center — — — — — — — — NGC 5055 center ring1 ring2 ring3 ring4 ring5 ring6 center NGC 5713 center — — — — — — — — ring1 — — — — — — — — ring2 center — — — — — — — — NGC 7331 center ring1 ring2 ring3 center {tabnote} (1) Number density of molecular gas. (2) Kinetic temperature of molecular gas. (3) Excitation temperature of CO( = 1–0). (4) The same as (3) but for CO( = 2–1). (5) The same as (3) but for CO( = 1–0). (6) Optical depth of CO( = 1–0). (7) The same as (6) but for CO( = 2–1). (8) The same as (6) but for CO( = 1–0). Results of (1)–(8) are obtained from the one-zone model of RADEX. In annuli cases, regions of each annulus are named ‘ring1’, ‘ring2’… in order from the galactic center. Adopted and [CO]/[CO] are different to reflect environments in galactic centers.