Almost medium-free measurement of the Hoyle state direct-decay component with a TPC
Abstract
- Background
-
The structure of the Hoyle state, a highly -clustered state at 7.65 MeV in , has long been the subject of debate. Understanding if the system comprises of three weakly-interacting -particles in the 0s orbital, known as an -condensate state, is possible by studying the decay branches of the Hoyle state.
- Purpose
-
The direct decay of the Hoyle state into three -particles, rather than through the ground state, can be identified by studying the energy partition of the 3 -particles arising from the decay. This paper provides details on the break-up mechanism of the Hoyle stating using a new experimental technique.
- Method
-
By using beta-delayed charged-particle spectroscopy of using the TexAT (Texas Active Target) TPC, a high-sensitivity measurement of the direct 3 decay ratio can be performed without contributions from pile-up events.
- Results
-
A Bayesian approach to understanding the contribution of the direct components via a likelihood function shows that the direct component is at the 95% confidence level (C.L.). This value is in agreement with several other studies and here we can demonstrate that a small non-sequential component with a decay fraction of about is most likely.
- Conclusion
-
The measurement of the non-sequential component of the Hoyle state decay is performed in an almost medium-free reaction for the first time. The derived upper-limit is in agreement with previous studies and demonstrates sensitivity to the absolute branching ratio. Further experimental studies would need to be combined with robust microscopic theoretical understanding of the decay dynamics to provide additional insight into the idea of the Hoyle state as an -condensate.
pacs:
Valid PACS appear hereI. Introduction. Near-threshold states in have a large effect on the formation of elements. Through the triple-alpha process, the synthesis bottleneck associated with the instabilities of the A=5 and 8 isobars is overcome. This reaction is enhanced by several orders of magnitude by the existence of a state just above the 3 threshold known as the Hoyle state. The structure of the state has been an area of interest since its discovery Dunbar et al. (1953). While the fact that the Hoyle state is a highly-clustered 3 structure is common knowledge, the exact nature of the clustering is a subject of debate to this date, and has ramifications for other light few-body systems involved in nucleosynthesis. It has been suggested that the Hoyle state may be the manifestation of a new state of matter known as an -condensate Tohsaki et al. (2001). When the average nuclear density drops below 1/3 of its normal value, the lowest-energy state is a bosonic cluster of -particles, a state with some properties similar to a Bose-Einstein condensate. Such a hypothesis has received extensive study in the past decade theoretically, but experimental observables for such an exotic state are extremely difficult to obtain Smith et al. (2020a). One relevant observable is the direct 3-body decay of the Hoyle state, i.e. bypassing the (g.s) intermediate. If an -condensate were to exist, this branching ratio can be predicted using a simple formulation of the -condensate wavefunction in conjunction with two- and three-body tunneling calculations. This value is very small and is estimated at 0.06 % Smith et al. (2017, 2019) although extracting a value is highly model dependent. The latest high-sensitivity experiments Smith et al. (2017); Dell’Aquila et al. (2017); Rana et al. (2019) can only provide upper limits for this value and the best limit currently lies at 0.019% Rana et al. (2019). Beyond this point, one reaches the limitations of background associated with the use of silicon detector arrays Smith (2017). Recent indirect methods predict a branching ratio of 0.00057 Smith et al. (2020b), a factor of 45 lower than the current limit, indicating the magnitude of the improvement likely needed to directly measure the direct decay channel.
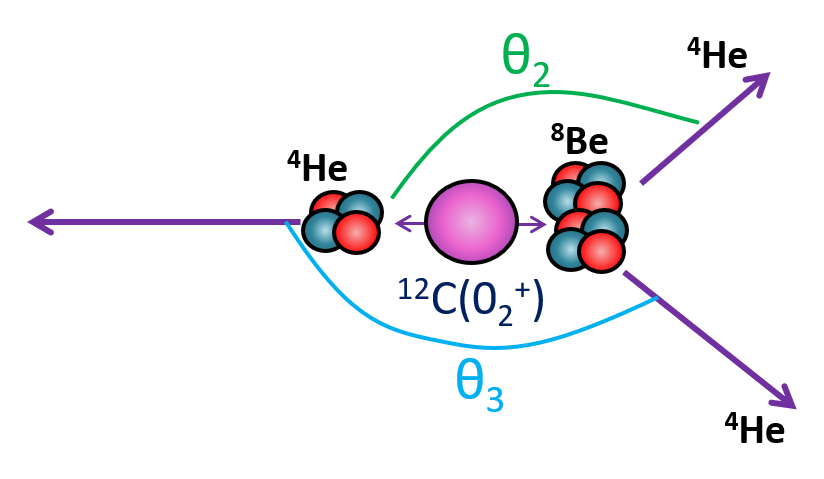
One may differentiate between the decay mechanisms, sequential and direct, by the energy-partition of the 3 -particles. The sequential decay mechanism restricts the energy of one of the -particles (in the center-of-mass frame) to roughly 50% due to the well-constrained momentum and energy conservation associated with . Direct decays have no such energy restriction and can occupy the full available phase space for three-body decays. The most-likely direct decay components correspond to when all -particles share the energy equally.
II. Experimental setup To study the role of the direct decay to the Hoyle state decays, excited states in were populated using the -delayed charged-particle spectroscopy technique Bishop et al. (2020) using the TexAT (Texas Active Target) TPC (Time Projection Chamber) Koshchiy et al. (2020). A beam was produced using the K500 cyclotron at the Cyclotron Institute at Texas A&M University. This beam was created via the interaction of an 11 MeV/nucleon primary beam undergoing a reaction in a gas cell. The beam of interest was then selected using MARS (Momentum Achromatic Recoil Spectrometer) Tribble et al. (1989) and delivered into the TexAT. TexAT is a general-purpose TPC using Micromegas (MICRO MEsh GASeous) + THick Gas Electron Multipliers (THGEM) amplification and segmentation. The signals induced on the Micromegas are digitized at 10 MHz by the GET (General Electronics for TPCs) Pollacco et al. (2018) and written to disk. This experiment was performed in the ‘2p-mode’ made available by GET whereby two half-events are taken to disk. The first half of the event corresponds to the implanting of the into TexAT. The second half corresponds to the decay of into 3 -particles. For decays that proceed via the ground-state or first-excited state, the second half of the event is absent but the partial half event is still taken to disk. As discussed in further detail for this experimental setup, this allows for one-at-a-time implant and decay spectroscopy using 20 Torr CO2. Details of the experimental setup and analysis of the data are provided in depth in Ref. Bishop et al. (2020).
III. Almost medium-free branching ratio measurements of the Hoyle state decay. Unlike observables extracted from heavy-ion reactions, the use of decay to populate the Hoyle state provides direct access to an almost medium-free determination of a direct 3-body decay. Furthermore, this route takes maximal advantage of the characteristics of TPCs to remove the contributions from pile-up events and other effects that contribute to the limit currently achieved using solid-state arrays. The intrinsic limitations for identifying different decays inside a TPC correspond to low-energy scattering of the particles in the fill gas and limited segmentation/thresholds which influence the accuracy of track reconstruction of the decay-particles. In order to identify any rare direct decays in the data set, each track was fitted with three arms, one for each decay -particle. The initial parameters for these arms were seeded by a Hough transform Duda and Hart (1972) and the decay vertex was identified by a combination of using the stopping point of the implanting beam and the highest energy deposition point of the decay tracks. Due to scattering effects in the gas, these tracks may deviate from their original momentum vector introducing an uncertainty in the measured final momentum vector. In order to minimize this uncertainty, we employed a technique that ensures exact momentum conservation between the three -particles Bishop et al. (2020); Smith and Bishop (2019). As a consequence, the uncertainty in the length of the longest track was reduced and the ability to identify direct decay improved. Our procedure to identify direct decays makes use of two experimental parameters, one using two extracted angles and the other making use of standard Dalitz plots. These are described, and shown below.
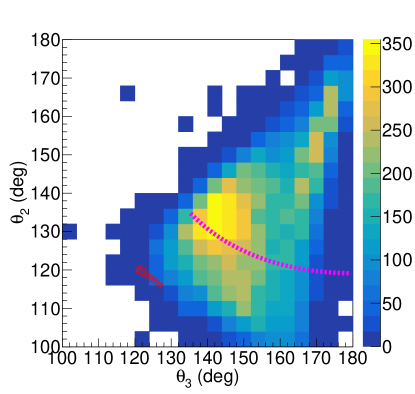
a. Angular decay information The angles between the most-energetic -particle and the two others (as shown in Fig. 1), are determined by a fitting procedure to the 3 -particle tracks. The results (after kinematic fitting) from the data are shown in Fig. 2, overlaid with the locus for sequential and direct decay. The events for direct decay would be centered on ( for an equal-energy partition. While the dominance of sequential decay is clear, additional information is required for clear identificiation of any direct decays.
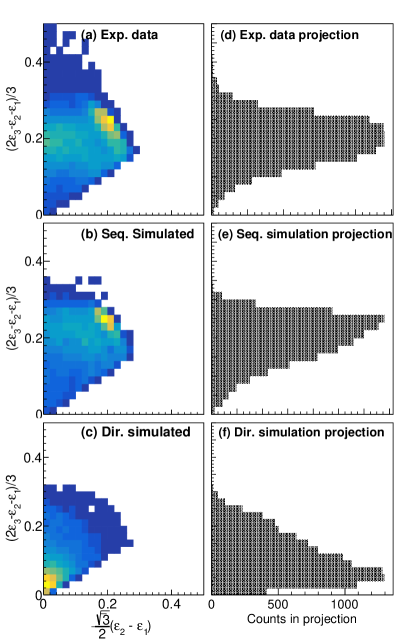
b. Dalitz formulation The Dalitz plot affords a convenient way to show the population of the available phase space in three-body decays. By taking linear combinations of the partial -particle energies in the center-of-mass frame, , such that , the energy partition of the 3 -particles can be represented on a 2-dimensional plot. Figure 3 shows how the linear combinations of these three parameters can differentiate sequential and direct decay. Here, the direct decay component is simulated using the DDP2 (Direct Decay Phase space + Penetrability) model Smith et al. (2019) that weights an otherwise uniform population of phase space by the three-body penetrabilities. The Dalitz population within this model reconstructed with TexAT is shown in Fig. 3c. This preferentially populates the center of the Dalitz plot where all the -particles have similar energies. It is therefore practically identical to the DDE (Direct Decay Energy-sharing) model where the -particles have identical energies, smeared only by the uncertainty principle Smith et al. (2020a, 2019). The experimental data, shown in Fig. 3 demonstrate the dominance of the sequential decay (as per Fig. 3b).
c. Branching ratio measurement Taking the angular information and location on the Dalitz plot, the was evaluated for each event for both sequential and direct decay (incorporating the varying contribution of the direct component across the Dalitz plot). This was formulated as follows:
| (1) |
where is determined for either the direct or sequential case and is the experimental error determined via the Monte Carlo simulation (). The kinematics for sequential decay constrain to the locus as shown in Fig. 2. For direct decay, the equal -particle energy constraint is slightly relaxed so that the highest-energy -particle fractional energy cannot exceed which generates a small region around , shown in Fig. 2 by the dash-dotted red line. As with the sequential case, the shortest distance to this locus is found. This value was also combined with from the Dalitz plot measurement, defined as:
| (2) |
where and are the Dalitz plot co-ordinates for each event, is the expected Dalitz co-ordinate for sequential decay and (=0.059) is the experimental error determined via the width of the projection of the experimental data shown in Fig. 3d. The expected is however the experimentally-observed value is slightly offset at 0.2 which is used for the formulation. This offset is also replicated in the GEANT4 simulations (Fig. 3e) and is attributed to a combination of energy-loss uncertainties at the low energies causing a slight systematic shift as well as threshold effects inside the TPC which cannot be fully corrected for. This effect is dominant for small -particle energies and, as such, does not greatly affect the center of the Dalitz plot where the -particles have a sufficiently large energy ( keV each). The global is then defined as the sum of and .
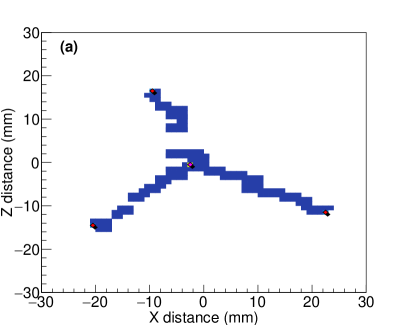
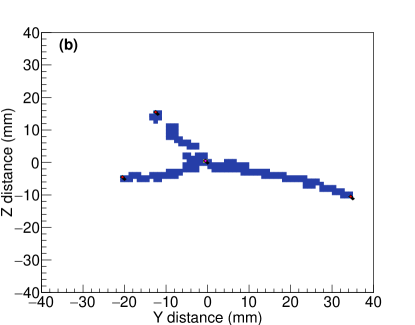
A total of 19019 Hoyle decay events were taken as the cleanest unbiased subset of data whereby the implanted beam stops sufficiently centrally in the TexAT sensitive area such that no -particle may escape and such that the beam stops in the central region of the Micromegas where the detector has no multiplexing Koshchiy et al. (2020). Therefore, the decay vertex can be much more confidently identified, thereby improving the fitting and energy-partition determination. By selecting the most direct-looking events (where ) and manually checking these 224 events had the decay vertex and corresponding decay arms correctly identified, a double-check was possible to ensure that sequential events were not erroneously misidentified as direct decays. A small subset of events (9), after manual checks, still had -values that indicated that the event was more direct-looking than sequential-looking and corresponded to good Hoyle-state decays. An example event of which is shown in Fig. 4a in contrast to an example sequential event in Fig. 4b. Due to the finite resolution afforded by small-angle scattering and longitudinal straggling effects, it may still be that these events are statistically outlying sequential decays rather than direct decays. To determine the relative probabilities, the values were converted into p-values, . These describes the probabilities that if the event was either direct or sequential, it would produce the observed values. For direct decays, the intensity distribution of the DPP2 is applied at this point.
The probability that an event is sequential is given via:
| (3) |
where is the direct 3 branching ratio. Similarly, the probability this event is direct is given by:
| (4) |
The event-by-event probabilities were then used to create a log-likelihood distribution as a function of the 3 branching ratio:
| (5) |
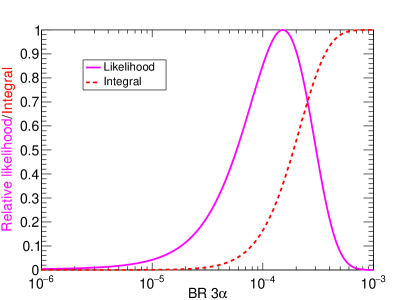
which is representative of the product of the probability of each event being direct or sequential. This was then used to generate the likelihood function and the 95% C.L. can be set from the integral of this likelihood function. These plots are shown in Fig. 5. At the 95% C.L., one can determine that the 3 branching ratio is .
Similarly, one may also use the likelihood function to set a lower limit for the direct decay. As mentioned above, there are a small number of good candidate direct decay events that require a reasonable branching ratio in order to explain their presence that cannot be explained by being a solely sequential decay that is a statistical outlier. From our data, this lower branching ratio is at 95% C.L.
The overall upper-limit is driven mainly by counting statistics with the obtained likelihood function matching well the Poisson distribution with around the peak of the likelihood function. As such, one requires an increase in the statistics of a factor of 4 for a two-fold reduction in the upper limit ( 80,000 counts). The influence of straggling in the gas and other finite-resolution effects are not the dominant contribution to the likelihood function as the overall separation between direct and sequential events is sufficient – this is apparent when looking at the ratio of the probabilities for sequential and direct decays for direct-looking events (as shown in Fig.4a).
It can be seen that the preferred (most likely) branching ratio is 0.01 and, given the use of a TPC in this experiment, one can be sure that this small number of events corresponds to real 3 decays, being a combination of real direct-decays and contributions from the so-called ‘ghost peak’ in Refsgaard et al. (2018). This ghost peak appears when one has a near-threshold resonance when the penetrability factor rises faster than the steeply-dropping but still long-tailed form (i.e. Breit-Wigner) of resonance line-shapes Barker and Treacy (1962). A non-zero branching ratio was also predicted in previous studies Smith et al. (2017, 2020a) although the ability to determine these as direct-looking rather than pileup on an event-by-event basis was not possible.
IV. Conclusion An almost medium-free measurement of the Hoyle direct decay to three -particles has been performed with a TPC. With 95% C.L., the direct branching ratio is . Contributions to the direct-looking events may correspond to a sizeable contribution from the ghost peak Refsgaard et al. (2018) and analyzing these events show that they are genuine 3-decays and are not pileup events as experienced with previous experiments that measured a similar upper-limit. The preferential branching ratio seen here is in agreement with predictions from Faddeev calculations Ishikawa (2014). The strength of this work relies on the use of a TPC and removal of uncertainties related to pile-up, a problem that plagued all previous measurements. More sensitive experimental studies of the direct component of the Hoyle state decay will also require a better theoretical understanding of the 3-particle dynamics at the microscopic level in general and the contribution of the sequential decays to the ghost state in particular.
V. Acknowledgments This work was supported by the U.S. Department of Energy, Office of Science, Office of Nuclear Science, under award no. DE-FG02-93ER40773 and by National Nuclear Security Administration through the Center for Excellence in Nuclear Training and University Based Research (CENTAUR) under grant number DE-NA0003841. G.V.R. also acknowledges the support of the Nuclear Solutions Institute.
References
- Dunbar et al. (1953) D. N. F. Dunbar, R. E. Pixley, W. A. Wenzel, and W. Whaling, Phys. Rev. 92, 649 (1953).
- Tohsaki et al. (2001) A. Tohsaki, H. Horiuchi, P. Schuck, and G. Röpke, Phys. Rev. Lett. 87, 192501 (2001).
- Smith et al. (2020a) R. Smith, J. Bishop, J. Hirst, T. Kokalova, and C. Wheldon, Few-Body Systems 61, 14 (2020a).
- Smith et al. (2017) R. Smith, Tz. Kokalova, C. Wheldon, J. E. Bishop, M. Freer, N. Curtis, and D. J. Parker, Phys. Rev. Lett. 119, 132502 (2017).
- Smith et al. (2019) R. Smith, J. Bishop, C. Wheldon, and Tz. Kokalova, Journal of Physics: Conference Series 1308, 012021 (2019).
- Dell’Aquila et al. (2017) D. Dell’Aquila, I. Lombardo, G. Verde, M. Vigilante, L. Acosta, C. Agodi, F. Cappuzzello, D. Carbone, M. Cavallaro, S. Cherubini, A. Cvetinovic, G. D’Agata, L. Francalanza, G. L. Guardo, M. Gulino, I. Indelicato, M. La Cognata, L. Lamia, A. Ordine, R. G. Pizzone, S. M. R. Puglia, G. G. Rapisarda, S. Romano, G. Santagati, R. Spartà, G. Spadaccini, C. Spitaleri, and A. Tumino, Phys. Rev. Lett. 119, 132501 (2017).
- Rana et al. (2019) T. Rana, S. Bhattacharya, C. Bhattacharya, S. Manna, S. Kundu, K. Banerjee, R. Pandey, P. Roy, A. Dhal, G. Mukherjee, V. Srivastava, A. Dey, A. Chaudhuri, T. Ghosh, A. Sen, M. Asgar, T. Roy, J. Sahoo, J. Meena, A. Saha, R. Saha, M. Sinha, and A. Roy, Physics Letters B 793, 130 (2019).
- Smith (2017) R. Smith, Experimental measurements of break-up reactions to study alpha clustering in carbon-12 and beryllium-9, Ph.D. thesis, University of Birmingham (2017).
- Smith et al. (2020b) R. Smith, M. Gai, M. W. Ahmed, M. Freer, H. O. U. Fynbo, D. Schweitzer, and S. R. Stern, Phys. Rev. C 101, 021302(R) (2020b).
- Bishop et al. (2020) J. Bishop, G. V. Rogachev, S. Ahn, E. Aboud, M. Barbui, P. Baron, A. Bosh, E. Delagnes, J. Hooker, C. Hunt, H. Jayatissa, E. Koshchiy, R. Malecek, S. Marley, R. O’Dwyer, E. Pollacco, C. Pruitt, B. Roeder, A. Saastamoinen, L. Sobotka, and S. Upadhyayula, Nuclear Instruments and Methods in Physics Research Section A: Accelerators, Spectrometers, Detectors and Associated Equipment 964, 163773 (2020).
- Koshchiy et al. (2020) E. Koshchiy, G. V. Rogachev, E. Pollacco, S. Ahn, E. Uberseder, J. Hooker, J. Bishop, E. Aboud, M. Barbui, V. Z. Goldberg, C. Hunt, H. Jayatissa, C. Magana, R. O’Dwyer, B. Roeder, A. Saastamoinen, and S. Upadhyayula, Nuclear Instruments and Methods in Physics Research Section A: Accelerators, Spectrometers, Detectors and Associated Equipment 957, 163398 (2020).
- Tribble et al. (1989) R. Tribble, R. Burch, and C. Gagliardi, Nuclear Instruments and Methods in Physics Research Section A: Accelerators, Spectrometers, Detectors and Associated Equipment 285, 441 (1989).
- Pollacco et al. (2018) E. Pollacco, G. Grinyer, F. Abu-Nimeh, T. Ahn, S. Anvar, A. Arokiaraj, Y. Ayyad, H. Baba, M. Babo, P. Baron, D. Bazin, S. Beceiro-Novo, C. Belkhiria, M. Blaizot, B. Blank, J. Bradt, G. Cardella, L. Carpenter, S. Ceruti, E. D. Filippo, E. Delagnes, S. D. Luca, H. D. Witte, F. Druillole, B. Duclos, F. Favela, A. Fritsch, J. Giovinazzo, C. Gueye, T. Isobe, P. Hellmuth, C. Huss, B. Lachacinski, A. Laffoley, G. Lebertre, L. Legeard, W. Lynch, T. Marchi, L. Martina, C. Maugeais, W. Mittig, L. Nalpas, E. Pagano, J. Pancin, O. Poleshchuk, J. Pedroza, J. Pibernat, S. Primault, R. Raabe, B. Raine, A. Rebii, M. Renaud, T. Roger, P. Roussel-Chomaz, P. Russotto, G. Saccà, F. Saillant, P. Sizun, D. Suzuki, J. Swartz, A. Tizon, N. Usher, G. Wittwer, and J. Yang, Nuclear Instruments and Methods in Physics Research Section A: Accelerators, Spectrometers, Detectors and Associated Equipment 887, 81 (2018).
- Duda and Hart (1972) R. O. Duda and P. E. Hart, Commun. ACM 15, 11 (1972).
- Smith and Bishop (2019) R. Smith and J. Bishop, Physics 1, 375 (2019).
- Refsgaard et al. (2018) J. Refsgaard, H. O. U. Fynbo, O. S. Kirsebom, and K. Riisager, Physics Letters B 779, 414 (2018).
- Barker and Treacy (1962) F. Barker and P. Treacy, Nuclear Physics 38, 33 (1962).
- Ishikawa (2014) S. Ishikawa, Phys. Rev. C 90, 061604(R) (2014).