Checklist for responsible deep learning modeling of medical images based on COVID-19 detection studies
Abstract
The sudden outbreak and uncontrolled spread of COVID/̄19 disease is one of the most important global problems today. In a short period of time, it has led to the development of many deep neural network models for COVID/̄19 detection with modules for explainability. In this work, we carry out a systematic analysis of various aspects of proposed models. Our analysis revealed numerous mistakes made at different stages of data acquisition, model development, and explanation construction. In this work, we overview the approaches proposed in the surveyed Machine Learning articles and indicate typical errors emerging from the lack of deep understanding of the radiography domain. We present the perspective of both: experts in the field - radiologists and deep learning engineers dealing with model explanations. The final result is a proposed checklist with the minimum conditions to be met by a reliable COVID/̄19 diagnostic model.
Keywords COVID-19 lungs computed tomography X-ray explainable AI deep learning
1 Introduction
COVID/̄19 is a fast spreading disease of highly contagious nature caused by the SARS-CoV-2 virus from the coronavirus group. At the end of January 2020, the World Health Organization (WHO) declared a global health emergency and one and a half months later, a pandemic. By September 25, 2020, 32,110,656 confirmed cases and 980,031 deaths had been documented. From a public health perspective, due to the lack of proper medicines, early detection of COVID/̄19 and patient isolation are crucial. Hospitals are crowded with the exponentially growing number of patients as available resources are limited.
Currently, reverse transcription polymerase chain reaction (RT/̄PCR) is the gold standard used to diagnose COVID/̄19 infection [1]. However, the results of RT/̄PCR can be affected by sampling errors and low viral load [1]. As a result, these tests suffer from high rates of false negatives (with sensitivity of 71% [2] or 69% [3]) and may need to be conducted two or more times before the results are finally confirmed [4].
In many articles, chest imaging is considered a suitable tool for early COVID/̄19 screening [5, 6]. The point is that sensitivity of computed tomography (CT) scan tests can reach 98%, which is much higher than RT/̄PCR tests [7]. Moreover, due to the fact that on CT images ground-glass opacities are visible earlier than pulmonary consolidation [8], radiologists can assess the stage of COVID/̄19. Unfortunately, CT scanners are not widely available. Study [9], indicate that distinguishing between COVID/̄19 and viral pneumonia is a challenging task. However, it is worth noticing that the overall process of undertaking chest imaging to getting the first results is much shorter than in case of RT/̄PCR. The screening takes approximately 15 seconds [10] (in terms of X/̄ray) to 21.5 [11] minutes on average (for CT) to complete. Taking the sample for RT/̄PCR test is a fast procedure. The difference is not the time of undertaking the test/screening but the time needed to get the first results. In case of RT/̄PCR, it may take from several hours up to several days [12] as nucleic acid amplification must happen before the start of samples’ analysis. The issue is important as the patient has to be isolated until receiving the test result.
In addition, X/̄rays are cheaper, more available worldwide, and less harmful than CTs because the radiation dose is smaller. Due to the existence of portable devices, X/̄ray imaging can be performed in isolated rooms, so the risk of infection is significantly decreased [13]. Nonetheless, especially on X/̄ray images, it is particularly difficult to assess the severity of the pathology, and, thus, only experts in radiology should interpret chest images. In general, this process is faster than waiting for RT/̄PCR test results. However, after individual patient collection, multiple test samples can be examined by a laboratory assistant simultaneously. Whereas a radiology technician is only able to take an image of one patient at a time, and then such an image must still be analyzed by a radiologist.
Recent applications of machine learning (ML) have gained popularity in the medical domain [14, 15]. The performance achieved by neural networks is becoming similar to that reached by medical experts. Deep learning techniques for medical images are present in classification (skin lesions [16], lung cancer[17]), detection (arrhythmia[18], breast cancer[19], pneumonia[20], ADHD[21]), segmentation (lung[22], brain[17]) and imaging reconstruction (magnetic resonance [23], Single Photon Emission Computerized Tomography (SPECT) [24]).
Considering the need for a highly accurate and fast diagnosis process, artificial intelligence (AI) can play a significant role in automating the detection of COVID/̄19 cases.
AI solutions are frequently based on complex, so-called black-box models [25]. For this reason, it is difficult to tell what factors lead to a particular model prediction. Such a lack of interpretability may be dangerous, as it may lead to biased results and incorrect decisions in real diagnostic procedures. Recent development in the area of Explainable Artificial Intelligence (XAI) shows the importance of model explanations, which help to avoid erroneous predictions. Nevertheless, surprisingly, in the area of COVID/̄19 image analysis, there are still only few results concerning the use of XAI for lung image analysis.
In this paper, we will summarize recent publications about lung imaging analysis (section II-III), and show how explainable AI techniques have been used in these solutions (section IV). We will confront these approaches with the domain knowledge of radiologists and we will show how many of the assumptions about data, models or explanations made in many of the analyzed studies are not appropriate. Finally, we will construct a checklist to help model developers assess whether they avoided the most common errors. We believe that this criticism, together with the proposed checklist, will contribute to building better models not only for the diagnosis of COVID/̄19 disease, but also for other applications based on lung images.
2 Methods
2.1 Literature search
This research is based on a systematic literature review. The data was collected between the 1st and 14th of August 2020. The search was performed according to Preferred Reporting Items for Systematic reviews and the Meta-Analyses (PRISMA) statement [26] presented in Figure 1 in the following academic digital databases: ArXiv, IEEE, Google Scholar, PubMed, Science Direct, Scopus, Web of Science. All studies written in English, regardless of the publication status (preprint, peer-reviewed, or published articles), were included in this review. Studies were identified by the combination of keywords: (“XAI COVID/̄19” OR “explainable artificial intelligence COVID/̄19” OR “explainable COVID/̄19” OR “explanations COVID/̄19” OR “interpretable COVID/̄19” OR “interpretations COVID/̄19” OR “transparent COVID/̄19”) and (“X/̄ray” OR “radiography” OR “CT” OR “computed tomography”). Then, each study was screened for content relevance.
From 31 collected works, during eligibility checking, 6 studies were dropped due to irrelevant scope or lack of XAI parts. There were 25 studies included for qualitative synthesis. The number of studies considered in the review is vast enough to create a representative set/collection for further investigation. Some of the studies were published as preprints, not as camera-ready articles. Due to the rapidly growing field of tools related to supporting medical practitioners in the fight against pandemics, we included them. They will help to show a variety of considered XAI approaches.
Then, on February 26, 2021, it was verified which articles previously available as preprints were published in peer reviewed journals. The content of these articles was again reviewed for changes that had been made. Articles published in journals: [27, 28, 29, 30, 31, 32, 33, 34, 35, 36, 37, 38], preprints: [39, 40, 41, 42, 43, 44, 45, 46, 47, 48, 49, 50, 51].
2.2 Types of COVID-19 prediction tasks
The 25 studies identified according to our methodology concern various types of ML tasks. In Figure 2, we introduce a taxonomy for these studies. In the following sections, when discussing specific solutions, it is important to remember what kind of problems they are designed for.
The first breakdown concerns the types of tasks, such as: classification (COVID/̄19 vs. other classes), severity assessment or segmentation. Among classification tasks, the first group is related to the detection of COVID/̄19 cases. The goal of the second is to assess how severe the changes caused by COVID/̄19 are.
In the reviewed works, segmentation can be regarded as an image preparation technique for the further classification process. Segmentation was not used in all studies. Lung segmentation is present in works [31, 32, 34, 45, 50] and lesion segmentation in [32, 38, 47]. The lungs are segmented to remove the unnecessary background because, based on medical experience, the lesions caused by COVID/̄19 are not located outside the lungs. Lesion segmentation, also called infection mask, helps to train the model to recognize infected regions and can be beneficial for further model assessment. Only radiologists can prepare trustworthy and high-quality lung lesion masks, not an automatic tool similar to those in the reviewed works [32, 38]. However, manual mask preparation takes a lot of time and money and requires a high level of consistency among annotators, but, surely, it is the most valuable method for qualitative and quantitative XAI evaluation.
There are not any strict guidelines on how many classes the classification should be conducted on. In classification problems, the number of classification classes varies between studies. This distinction is particularly important when comparing model performance. It is worth noting that some studies have verified the performance of the model considering different number of classes [28, 33, 35, 48]. Binary classification task detecting COVID/̄19 and non/̄COVID/̄19 is the most popular [27, 28, 30, 33, 35, 38, 39, 41, 45, 46, 48, 49]. Another frequently used method is three-class classification [28, 29, 33, 35, 36, 37, 47, 48, 51]: no infection/no pneumonia, pneumonia (bacterial or non/̄COVID/̄19 viral infection), and COVID/̄19 (COVID/̄19 viral infection). In the four-class classification problem, there are two different approaches to splitting images. The first one divides images into: normal, bacterial pneumonia, non/̄COVID/̄19 viral pneumonia, and COVID/̄19 [35, 44], while the second one into: normal, bacterial pneumonia, tuberculosis (TB), and viral pneumonia. In the second approach, study [31] refers to [52] and claims that differentiation between viral pneumonia and COVID/̄19 is challenging, because similar radiological features exist between them. In classification tasks with the biggest number of classes (5), the authors distinguish five different classes: normal, pneumonia, virus, bacteria, and COVID/̄19 [40]. In [42] the authors applied multi-label classification. For example, for an image with the lungs of a patient suffering from COVID/̄19, the correct classification should predict all three labels: pneumonia, viral pneumonia, and COVID/̄19.
In the segmentation for severity assessment, there are two different approaches. One rates how severe the lesions are in parts of the lungs. Another one assigns labels to lesions’ names that point out which changes in the lungs are present in the image.
In two studies [34, 50] images or parts of images were divided into classes that correspond to the severity of COVID/̄19 effects on the lungs. The authors [34] propose dividing each lung horizontally into 4 parts, and giving them a grade of 1 if it contained any lesions, such as consolidation or ground-glass opacities, or 0 otherwise. Then, the grades from all parts were summed up. Based on grades, the following scale was prepared: Normal/̄PCR+ 0 (a patient classified by expert radiologist as Normal that has positive RT/̄PCR test), Mild 1/̄2, Moderate 3/̄5, and Severe 6/̄8. A similar solution was introduced by [50]. In this study, each lung was divided horizontally into 3 parts and a 4 grade scale was used for each part. The division of each lung into 3 parts (upper, middle, and lower lung field) resembles natural lung structure and common radiological practice.
An example of multi-label classification is described in [43] where 18 outputs of neural network (such as atelectasis, consolidation, infiltration, pneumothorax, edema, emphysema, fibrosis, effusion, pneumonia, pleural thickening, cardiomegaly, nodule, mass, hernia, lung lesion, fracture, lung opacity, and enlarged cardiomediastinum) give information about lesions in lungs. Some of them are characteristic for specific illnesses. This is a very promising approach because with XAI visualizations it should be clearly visible for radiologists if a model learned to recognize proper lesions.
3 Deep learning on lung image data
3.1 Data resources
The COVID/̄19 virus is a relatively new disease, and, in several articles, the lack of high-quality medical imaging databases is indicated [34, 47]. To verify this, we looked at the quality of the data used to construct the models in selected peer-reviewed research descriptions. The results of this analysis are presented in Table LABEL:tab:links.
For medical imaging, the standard format for representing measured and / or reconstructed data is DICOM (Digital Imaging and Communications in Medicine). Significant features of this format are the ability to faithfully record 16-bit dynamics of data in grayscale (CT, radiography), control of acquisition parameters, and the ability to adapt to presentation conditions at diagnostic stations. The use of full data dynamics, i.e., all information about the imaged objects, taking into account the characteristic properties of the entire measurement and reconstruction process of the data (equipment parameters, filters, parameters of the acquisition process, specificity of pre-processing and forms of image representation) enables the construction of models based on complete measurement information about the examined object. Unfortunately, the vast majority of COVID/̄19 resources do not retain the source image information on the diagnosed objects. The data is converted from DICOM to typical multimedia image formats (mainly JPEG, PNG, TIFF standards) with the omission of information about the imaging process itself and often with a loss of quality and informative value of the compressed data. Data dynamics is often reduced to the 8 most significant bits, quantized to simplified 8-bits representation or all image information is lossy compressed (JPEG) using standard quantization tables.
| No. | Institution | Link to dataset | Used in article | Dynamic range of images | Data processing | Prepared for scientific experiments |
| 1) | University of Waterloo | github.com/lindawangg/COVID-Net | [37, 47, 48, 50] | |||
| 2) | \hangpara5mm0University of Waterloo | github.com/agchung/Figure1-COVID-chestxray-dataset | [29, 48] | 8 bits, 48 cases | JPG, PNG | X-ray database for research purposes only, continuously growing; Metadata: offset, sex, age. finding, survival temperature, pO2, saturation, view, modality, artifacts/distortion, notes; Categories: covid, pneumonia, no finding |
| 3) | \hangpara5mm0University of Waterloo | github.com/agchung/Actualmed-COVID-chestxray-dataset | 8 bits, 237 cases | PNG, BMP | X-ray database for research purposes only, continuously growing; Metadata: finding, view, modality, notes; Categories: covid, no finding | |
| 4) | \hangpara5mm0Qatar & Bangladesh Universities | kaggle.com/tawsifurrahman/covid19-radiography-database | [29] | 8 bits, 21165 cases | PNG, resized | X-ray database; No metadata; Categories: COVID-19 positive cases (3616), normal (10,192), lung opacity (Non-COVID lung infection - 6,012), viral pneumonia (1,345) |
| 5) | \hangpara5mm0University of Montreal | github.com/ieee8023/covid-chestxray-dataset | [27, 29, 30, 31, 33, 35, 36, 40, 42, 43, 44, 46, 48, 50, 51] | 8 bits, 951 cases | JPG, PNG, resized | X-ray database; Metadata: covid severity scores, sex,age, finding, RT_PCR_positive, survival, intubated, intubation_present, went_icu, in_icu, needed_supplemental_O2, extubated, temperature, pO2_saturation, leukocyte_count, neutrophil_count, lymphocyte_count, clinical_notes, other_notes; Categories: covid, viral, bacterial, fungal, lipoid, aspiration, unknown |
| 6) | \hangpara5mm0National Institutes of Health | kaggle.com/c/rsna-pneumonia-detection-challenge | [29, 43, 48, 50] | 8 bits, 30227 (training)+3000 (test) cases | DICOM, resized | X-ray database of Pneumonia Detection Challenge; No metadata; Categories: normal. lung opacity, no lung opacity/not normal |
| 7) | National Institutes of Health | nihcc.app.box.com/v/ChestXray-NIHCC | [33, 43, 48] | 8 bits, 112120 cases | PNG, resized | X-ray database of Common Thorax Disease; Metadata: finding ROI; Categories: no findings and 14 disease categories (Atelectasis, Cardiomegaly, Effusion, Infiltration, Mass, Nodule, Pneumonia, Pneumothorax, Consolidation, Edema, Emphysema, Fibrosis, Pleural_Thickening, Hernia) |
| 8) | National Institutes of Health | kaggle.com/nih-chest-xrays/sample | [27] | 8 bits, Random sample of 5606 from 112,120 images of 30,805 unique patients | PNG, resized | X-ray database; Metadata: finding labels, follow-up, age, gender, view; Categories: Atelectasis, Cardiomegaly, Effusion, Infiltration, Mass, Nodule, Pneumonia, Pleural_Thickening, Hernia, Pneumothorax, Consolidation, Edema, Emphysema, Fibrosis |
| 9) | University of Montreal | kaggle.com/praveengovi/coronahack-chest-xraydataset | [31, 40] | 8 bits, 5910 cases (normal-1576, covid 58, SARS-4, virus-1493, bacteria 2777, ARDS-2) | JPG,PNG-resized | Collection Chest X Ray (anterior-posterior) of Healthy vs Pneumonia (Corona) affected patients infected patients along with few other categories such as SARS (Severe Acute Respiratory Syndrome ), Streptococcus & ARDS (Acute Respiratory Distress Syndrome); No metadata |
| 10) | University of California San Diego | kaggle.com/paultimothymooney/chest-xray-pneumonia | [31, 35, 42, 44, 51] | 8 bits, 5863 cases | JPG | Chest X-ray images (anterior-posterior) were selected from retrospective cohorts of pediatric patients of one to five years old from Guangzhou Women and Children’s Medical Center, Guangzhou. All chest X-ray imaging was performed as part of patients’ routine clinical care.; Categories: normal and pneumonia; No metadata |
| 11) | University of California San Diego | github.com/UCSD-AI4H/COVID-CT | [30, 39, 41, 46] | 8 bits, 349 cases | Images collected (scanned) from covid-related and medical papers in PNG (covid) or JPG (normal) | This dataset has 349 CT images containing clinical findings of COVID-19 from 216 patients; Categories: covid and noncovid cases; Metadata: age, gender, location, medical history (unfortunately modest), time after the onset of illness, severity, other diseases |
| 12) | University of California San Diego | data.mendeley.com/datasets/rscbjbr9sj/2 | [36] | 8 bits, 5233 cases | JPG (QF=95 for normal and QF=75 for pneumonia) | Collection Chest X Ray; Categories: normal (1349 cases) vs pneumonia (3884 cases) including subcategories of bacteria and virus; No metadata |
| 13) | Elazig in Turkey | github.com/muhammedtalo/COVID-19 | [27, 29] | 8 bits, 1125 cases | JPG (QF=90, subsampling2x2), PNG (resized) | X-Ray Images collection; No metadata; Categories: covid (125 cases), no findings (500 cases), pneumonia (500 cases) |
| 14) | National Library of Medicine | openi.nlm.nih.gov/gridquery?it=xg&coll=cxr&m=1&n=100 | [31, 43] | 8 bits or full bits, 7470 cases | PNG (resized), Full DICOM | Chest X-rays collection with 3,955 radiology reports; Categories: 14 pulmonary categories; Metadata: time after the onset of illness, severity, other diseases, captions of symptoms as unstructured symptom description |
| 15) | Stanford University School of Medicine | stanfordmlgroup.github.io/competitions/chexpert | [43, 50] | 8 bits, 224,316 chest radiographs of 65,240 patients | JPG | Large dataset of chest X-rays which features uncertainty labels and radiologist-labeled reference standard evaluation sets; Categories: each report was labeled for the presence of 14 observations (no finding, enlarged cardiom., cardiomegaly, lesion, opacity, edema, consolidation, pneumonia, atelectasis, pneumothorax, pleural effusion, pleural other, fracture, support devices) as positive, negative, or uncertain; Metadata: related to above categories (blank for unmentioned, 0 for negative, -1 for uncertain, and 1 for positive) |
| 16) | Hospital San Juan de Alicante - University of Alicante | bimcv.cipf.es/bimcv-projects/padchest | [43] | 8 bits, more than 160,000 images from 67,000 patients | PNG | PadChest: A large chest x-ray image dataset with multi-label annotated reports; the reports were labeled with 174 different radiographic findings, 19 differential diagnoses, and 104 anatomic locations; a 27% of the reports were manually annotated by trained physicians; Metadata: age, sex |
| 17) | Hospital Universitario San Cecilio | github.com/ari-dasci/OD-covidgr | [34] | 8 bits, 852 images | JPEG (QF=90) | X-ray images: 426 positive covid cases and 426 negative cases; only the posterior-anterior view is considered; Categories: covid severity - normal-PCR+ (76), mild (100), moderate (171), severe (79); General metadata: positive images correspond to patients who have been tested positive with RT-PCR within a time span of at most 24h between the X-ray image and the test; every image has been taken using the same type of equipment and with the same format |
| 18) | Beth Israel Deaconess Medical Center in Boston | physionet.org/content/mimic-cxr/2.0.0 | [43] | full bits, 227,835 imaging studies for 65,379 patients | full DICOM | Chest radiographs with metadata: electronic health record data, dicom metadata, free-text radiology reports Categories: 14 pulmonary observations with an additional “uncertain” category |
| 19) | Società Italiana di Radiologia Medica e Interventistica | sirm.org/category/senza-categoria/covid-19 | [49] | 8 bits | mostly JPG (QF=95, subsampling2x2) | Chest radiographs with free-text radiology and clinical reports, covid confirmation; Metadata includes selected information from electronic health record (e.g. symptoms, lab exams, ARDS, ventilatory assistance, previous exams); Categories: covid confirmation or no with 14 pulmonary observations |
| 20) | National Cancer Institute | wiki.cancerimagingarchive.net/display/Public/LIDC-IDRI | [45] | full bits, 1308 cases | full DICOM | The Lung Image Database consists of diagnostic and lung cancer screening thoracic CT scans with marked-up annotated lesions (XML); it includes three categories ("nodule > or =3 mm," "nodule <3 mm," and "non-nodule > or =3 mm"); |
| 21) | University of Brescia | brixia.github.io/#dataset | [50] | full bits, 4,707 cases | full DICOM | COVID-19 subjects, acquired with both CR and DX modalities, in AP or PA projection with highly expressive multi-zone COVID-19 severity score, fully annotated; Metadata: the multi-region 6-valued Brixia-score defined for six zones, sex, age |
| 22) | open-edit radiology resource | radiopaedia.org | [49] | 8 bits, a significant number of cases, constantly updated | JPG with different QF, resized | Database of general radiological purposes; in selected cases free-text radiology and clinical reports, selected; generally, quantitatively and qualitatively differentiated case reports |
| 23) | generated using data augmentation | kaggle.com/nabeelsajid917/covid-19-x-ray-10000-images | [29] | 8 bits, 104 cases | JPEG with different QF, resized | Corona Virus X-ray Dataset; Categories: covid and normal; No metadata |
| 24) | offline database or from hospital | [28, 32, 38, 45] | ||||
Scarcity of publicly available COVID/̄19 data sources with images in raw DICOM format
It was observed that only one out of five repositories with the DICOM extension presented in Table LABEL:tab:links contains COVID/̄19 cases. Most databases regarding COVID/̄19 images are in 8-bit JPG or PNG formats. There are concerns that the quality of shared images is degraded, which may render the trained models less accurate. The quality degradation includes: the Hounsfield unit (HU) values are inaccurately converted into grayscale image data, and the number of bits per pixel and the resolution of images are reduced.
An extreme case is the use of digital scans of printed lung images with no standard regarding image size, e.g., images extracted from the manuscripts [49]. Comparative statistical analysis based on the value of systematic measurement errors for the COVID-19 data, including the raw data and the metadata extracted from official reports, showed noticeable and increasing measurement errors [16]. This matter showed the importance of the accuracy, timeliness and completeness of COVID-19 datasets for better modeling and interpretation.
Too few images with low and moderate severity cases
Most studies are based on data sources publicly available on the Internet on a popular sharing platform, such as GitHub and Kaggle. The most commonly used data source with COVID/̄19 cases was created at the beginning of the epidemic. The first publicly available repository was published on January 15, 2020. In [34] it is stressed that available data sources contain too few images with low and moderate severity cases. Most of the data sources have only class labels without fine-grained pixel-level annotations, for example 3), 4), 8), 9), 10).
| Study | [27] | [28] | [29] | [30] | [31] | [32] | [33] | [34] | [35] | [36] | [37] | [38] | [39] | [40] | [42] | [44] | [45] | [47] | [49] | [51] |
| Number of COVID/̄19 images | 250 | 230 | 855 | 345 | 502 | 3,389 | 127 | 377 | 112/137 | 76 | 358 | 400 | 400 | 58 | 234 | 68 | 829∗2 | 99 | 120 | 269 |
| Total number of images | 6523 | 460 | 15,959 | 720 | 1004 | 2186 | 1125 | 754 | 366 | 5949 | 13,975 | 750 | 800 | 2800 | 1234 | 5941 | 1,865∗2 | 18,529 | 239 | 5 801 |
| Number of classes | 2/3 | 3 | 3 | 2 | 4 | 2 | 3 | 3/2 | 3 | 3 | 2 | 2 | 4 | 12∗1 | 4 | 2 | 3 | 2 | 3 | |
| Aspect ratio | 0.08/0.11 | 1.5 | 0.16 | 0.96 | 2 | 1.36 | 0.34 | 0.63 | 0.92/0.75 | 0.04 | 0.08 | 1.07 | 1.00 | 0.08 | 2.28 | 0.05 | 0.89 | 0.02 | 1.00 | 0.14 |
∗1 multilabel classification, ∗2 training slides (106 COVID-19 images), ∗3 four COVID/̄19 classes (NormalPCR+: 76 cases, Mild cases: 80, Moderate: 145 cases, Severe: 76 cases) and one Negative (377 cases)
Relatively low number of COVID/̄19 images
Image format is one problem, while the amount of available data is another problem. The median number of COVID/̄19 images in the considered data resources is . With so little data, it is difficult to train a deep neural network (DNN). Table 2 shows the number of cases in particular classes. The last row with aspect ratio shows the proportion of the COVID cases to non/̄COVID cases.
The use of imbalanced datasets requires more attention during the model training. Either proper data resampling [32] (oversampling [36, 48], undersampling [35]) should be applied, or an appropriate loss function should be chosen [29, 44, 46, 47], unless acquiring a greater amount of less common data is possible. It is also possible to use micro-base metrics [42]. However, most ML algorithms do not work very well with imbalanced datasets.
The data sources lack descriptions
Data resources: 4), 6), 9), 10), 12), 13), and 23) did not include metadata. At a minimum, the description of the dataset should include the following factors. First of all, the total number of images and the number of images in each class should be given. Additionally, the balance in terms of age and sex is another important factor because of the differences in anatomy. Information about smokers or previous lung diseases is also relevant. For analyzing model responses, the information about concurrent diseases, the severity of COVID/̄19, and the number of days between the exposure and the acquisition of the image of the chest are also useful.
Mix of CT and X/̄ray images
The problem that we found in these datasets is the data purity. If we look closer at the images presented in study [46], it appears that CT and X/̄ray images are mixed in the X/̄ray dataset. These two techniques are so different that networks for CT and X/̄ray images should be trained separately.
Inappropriate CT windows
For COVID-related lung analysis, it is essential to have Hounsfield Units equivalent for “lung” window (width: 1,500, level: -600). Otherwise, the lung structures are obscured or not visible at all, such as some examples in studies [28, 39, 41]. This is a basic, but key, issue because we do not want to assess soft tissues or bones. Photos taken in other windows do not have any real diagnostic value.
“Children are not small adults”
When we go back to the databases, it appears that, in some cases, e.g. 7), 8), 9) the X/̄rays of children and adults are mixed. The next problem is related to the mixture of images of patients of different ages. There are crucial differences between the X/̄rays of children’s and adults’ chests: technical (hands are often located above the head), anatomical (different shape of the heart and mediastinum, as well as bone structures), and pathological (different pathologies). This will also include a different course of infectious diseases, with the most vivid example of round pneumonia mimicking tumors [53]. It is important to mark the age of patients in data resources, and to separate children from adults when preparing data for training.
CT and X-rays images are not in color.
Despite that fact, some databases, e.g. 5) and 11), include images in RGB color space. It introduces redundant information, because values in all channel are the same (R=G=B). This situation leads to increasing the number of input neurons in the neural network by three times. Due to that fact, the number of parameters will also rise, and the training may require more data and time, however, it lacks extra information.
Incorrect categorization of pathologies
We have noticed that some images are incorrectly categorized - into normal or pathologic, e.g. in database 10), 13), and also within the class of pathology, e.g. in database 14). An additional problem is that, from a medical point of view, some images should be multi-categorized. This means that there is more than one pathology in one image. For instance, pneumonia (main class) can manifest itself as lung consolidations, which, however, can also appear with pleural effusion or atelectasis (two additional classes). On the other hand, atelectasis itself, with a mediastinal shift, can be a sign of a different pathology, such as a lung tumor. Thus, databases should be verified by experienced radiologists for proper categorization and maybe a rejection of multi-class images. This, however, would be time-consuming and - what is more important - very difficult or impossible with low-quality images or images without appropriate descriptions.
Lack of information about chest projection for X/̄ray imaging
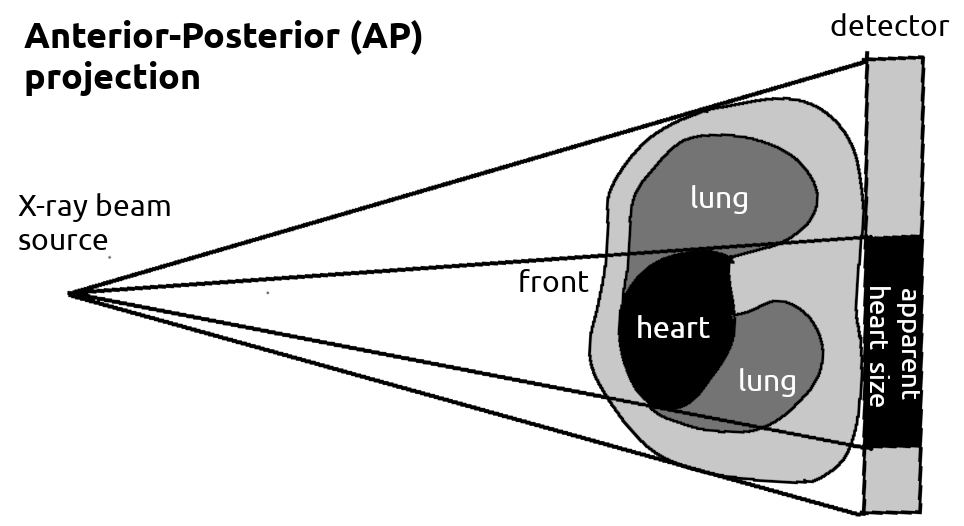
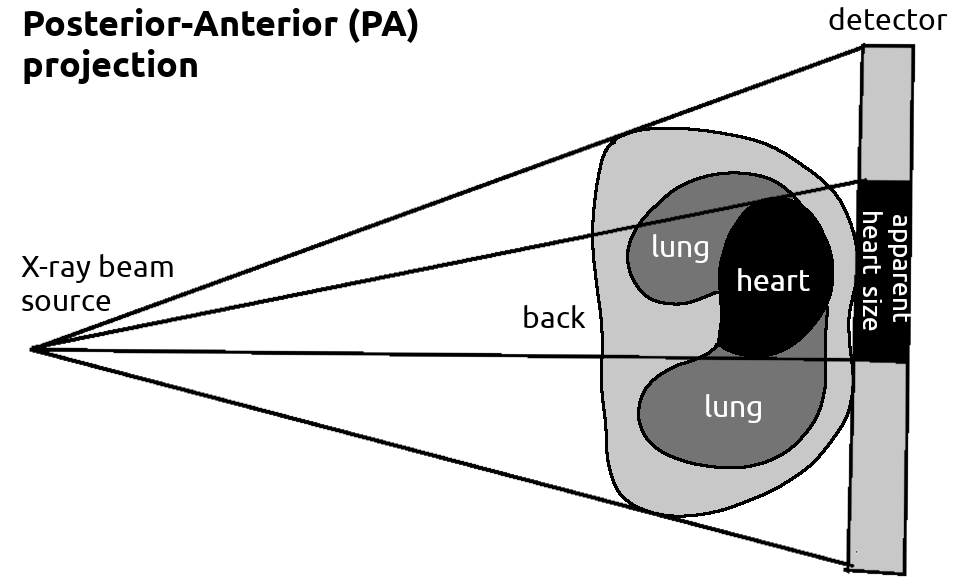
This problem is present, for example in 2), 4), 9). There are two main chest projections, see Figure 3, Posterior-Anterior (PA) and Anterior-Posterior (AP). The first one is acquired while the patient is standing. The X/̄ray beam comes through the patient’s chest from its back (posterior) to front (anterior) - i.e., PA projection. The second one is the opposite - the beam enters through the front (anterior) of the chest and exits out of the back (posterior) - i.e., AP projection. This type of examination is mostly conducted in more severe cases, with lying patients, with comorbidities, often in Intensive Care Units. As the X/̄ray beam is cone-shaped, both projections have one very important difference, which is the size of the heart. In PA projection, the heart is close to the detector, resulting in a similar heart size on the X/̄ray as in reality. In AP projection, the heart is away from the detector, resulting in a larger heart size on the X/̄ray, which can be confused with cardiomegaly. In databases, AP and PA images are often mixed, which can cause bias because AP projections are performed on severely ill patients [34]. From a medical point of view, it is impossible to perform chest X/̄rays in only one projection as this depends on patients condition. However, projection should be specified for every X/̄ray in dataset, and possible bias in model classification should be evaluated.
|
|
To sum up, this section shows that data sources have several weaknesses. First of all, images available for COVID/̄19 in public databases are in not the most dedicated image format because DICOM images are still rarely available for this disease. Secondly, in the data sources, there is missing data (i.e., chest projection) or poor quality data (i.e., poor image quality, not grayscale images, inappropriate CT window, mixed CT and X/̄ray images, or incorrect pathology categorization). Lastly, during data preparation, it should be taken into account that DNNs work better when the class balance is maintained.
3.2 Image preprocessing methods
The aim of preprocessing is to make the images from different data resources look homogeneous and coherent. This process reduces the possibility of bias via eliminating some artifacts from images, such as captions, annotations, which may deceive the model. The model should learn how to differentiate labels by focusing on image features, not by recognizing from which database the image comes from. During preprocessing, irrelevant image features that are easier to learn are removed. This is because in some databases there are no cases of people suffering from COVID/̄19, while in others there are, for example, only serious cases. These differences, which are insignificant from a human perspective, must be eliminated. For machines, even the information that images from one data resource are relatively darker might be relevant.
However, due to a large amount of data, automation of preprocessing is necessary. Preprocessing cannot introduce any changes in an image which will add or remove some relevant information. Its purpose is to make it impossible to identify the machine or characteristic machine’s calibration parameters, e.g., the dose of exposure.
Table 3 lists preprocessing techniques used in the reviewed studies. The most common was resizing an image to the same size. It is the most basic operation needed to train DNN when images have different sizes. Other techniques applied frequently to images were: normalizing pixel intensity, changing color space, eliminating noise, equalizing histogram, and performing image enhancement. Unfortunately, in 9 out of 25 studies there was no information about preprocessing steps provided. [54] also stressed that many studies do not contain sufficient information about preprocessing, such as cropping of images.
| Preprocessing technique | Reference |
| Resize to the same size | [29, 30, 31, 32, 35, 36, 40, 41, 42, 43, 44, 46, 49, 51] |
| Normalize pixel intensity | [29, 35, 42, 43, 44, 49, 50] |
| Eliminate noise | [29, 30, 34, 50] |
| Use Perona-Malik filter | [29] |
| Limit image intensity | [42, 50] |
| Equalize histogram | [29, 31, 40, 50] |
| Perform image enhancement | [29, 30, 31, 32] |
| Cast data type | [29, 31, 50] |
| Change color space | [36, 46, 49] |
| Crop image | [34, 40, 42] |
| Zoom image / augmentation | [41, 49] |
| Add pixels | [34] |
| Feature encoding | [51] |
| Rotate image | [41] |
| Use 2D wavelet transform | [30] |
| Feature extraction | [47, 51] |
| Lack of preprocessing or description | [27, 28, 33, 37, 38, 39, 45, 47, 48] |
Cropping, changing color space, proportionally resizing, or zooming can be helpful to adjust images for training on specific network architecture, or the easiest way to remove some descriptions from the edges of images. If not required, resizing ought to be omitted. Normalizing pixel intensity or equalizing histograms are required to eliminate strong correlations with specific machine settings. Spot changes, such as noise removal, are not desirable. These techniques can be used only very carefully in order not to remove important features, such as lesions or parts of them.
To sum up, preprocessing is an important step preceding model training. It should reduce the possibility of bias and guarantee more homogeneous images without the elimination of any medically significant features.
3.3 Data augmentation
Data augmentation for ML is a technique that artificially multiplies the number of images through cropping and transforming existing images or creating new synthetic images thanks to generative adversarial networks. This procedure may help to reduce model overfitting and the problem of class imbalance. It helps in achieving a larger training dataset and more robust models.
In Table 4, we summarized data augmentation techniques from the reviewed studies. The most popular augmentation techniques in the reviewed studies are affine transformations, such as rotation, scaling or zooming, flip, and shifting or translation. On the contrary, splitting a radiological image into overlapping patches, or generating new content via a type of Generative Adversarial Network are rarely used.
| Data augmentation technique | Values and studies |
| Affine transformations | [28]: |
| Rotation | [35, 37, 45, 48], 5°[40], 15°[27, 29, 49], 20°[44], 25°[50] |
| Scaling / Zooming | [37, 44, 48], 10% [40, 46, 50], 20% [35] |
| Flip | [44, 46, 47] |
| Horizontal | [37, 38, 40, 45, 48] |
| Vertical | |
| Shifting / Translation | [37, 44, 48], height 5% [40], 10% [50] |
| Shearing | [35, 36, 44] |
| Brightness change | [28, 48, 37] +/-30 [36], 10% [40] |
| Crop | [38, 45] |
| Contrast change | [28] |
| Gaussian noise | [36] |
| ZCA whitening transformation | [44] |
| Elastic transformation | =60, =12 [50] |
| Grid distortion | steps=5, limit=0.3 [50] |
| Optical distortion | distort=0.2, shift=0.05 [50] |
| Warping | 10% [46] |
| Multiple patches from each image | [31] |
| Class-inherent transformations Network* | [34] |
| Augmentation used but parameters are not specified | [41] |
| No augmentation used | [30, 32, 33, 39, 42, 43, 51] |
* inspired by Generative Adversarial Networks
However, not all of them are appropriate from a medical point of view. Before an augmentation, it is recommended to consider the ’safety’ for the chosen domain. For example, the rotation should be done carefully, because some parts of the lungs, such as costophrenic recesses, may be placed outside the image. Also, change of brightness or contrast should be performed only in a limited manner, as greater manipulation may obscure lung structure. Moreover, in predicting COVID-19, it is acceptable to crop or proportionally scale/zoom an image to such an extent that it displays only the lungs without a background or other parts of the body.
It is also worth noting, that in the case of CT and X/̄ray images, the augmentation based on rotation or flipping generate photos that cannot naturally appear in real datasets, because the process of taking the photo itself is standardized. Horizontal flips should be done carefully, with some specific limitations. Most pathologies will be present similarly on the left or right lung, except for the change in shape of the heart (like in dextrocardia) or pathologies affecting specific lobes, due to different lung anatomy (like lobar pneumonia or lobar atelectasis). These limitations should be taken into consideration in model design.
In general, all augmentation methods should be consulted with radiologists, as domain knowledge is crucial. In every project, it is important to know the field of research to avoid a situation in which instead of solving the problem, bias is accidentally introduced.
3.4 Model architecture
In the studies different approaches of modeling were applied. Some benefited from machine learning methods, whereas the rest used deep learning. In the first case, simple classifiers or their ensembles were applied: AdaBoost [41], KNN [41], Naive Bayes [41], SVM [41].
In the reviewed studies, lung-specific model architectures (own models) were relatively often used for classification, whereas the existing architectures were frequently fine-tuned. The following model architectures or their fine-tuned, modified versions were investigated: ResNet [29] (ResNet18 [31, 42, 47, 50], ResNet34 [32, 42, 46], ResNet50 [30, 39, 40, 45, 46]), DenseNet [29, 43, 48, 50] (DenseNet121 [40, 49], DenseNet-161 [42], DenseNet-201 [39, 46, 49]), VGG [29, 50] (VGG-16 [27, 39, 49, 51],VGG-19 [39, 46, 49]), Inception [50], InceptionV3 [35, 42], InceptionResNetV2 [39, 42, 49], MobileNetV2 [39, 49], NASNetMobile [39, 49], EfficientNet-B0 [46], Efficient TBCNN [40], MobileNet [49], NASNetLarge [49], Res2Net [38], Attention-56 [49], ResNet15V2 [39], ResNet50V2 [44], ResNeXt [42], WideResNet [42], Xception [49], own model [28, 33, 41, 36, 37, 46, 34, 50]. It is clearly visible that there are numerous types of neural networks. Different neural networks can catch different dependencies in the data. For solving a problem, many types of model architectures are tested to find the best one for a specific task. Recommendations on how the explanations should look do not depend on the neural network architecture.
For segmentation, the following architectures were used: U-net [34, 45, 50], AutoEncoder [47], VGG-16 backbone + enhanced feature module [38], (FC)-DenseNet-103 [31], Nested version of Unet (Unet++) [50], VB-Net [32]. During the segmentation process, it is important that the lungs are accurately segmented. Otherwise, distorted border lines can be an indication of pathology. In study [31], the authors were aware that their segmentation cut pathological changes in lungs. In study [50] segmentation for non-domain experts appears accurate. However, radiologists noticed that also other structures (i.e., bowel loops) were interpreted as lungs in that segmentation.
There are multiple purposes for creating new model architectures. The most common is adjusting existing architectures for better explainability or scalability for training on medical COVID/̄19 imaging [28, 41]. For example, in studies [37, 46], the authors conducted tests and chose the advantages of many architectures while creating their own. The proposed architectures are usually smaller and require a lower number of trainable parameters than in well-known DNN architectures [34, 36].
3.5 Transfer learning
Transfer learning is an ML technique about reusing gained knowledge from one problem to a new one. In the reviewed studies, it is commonly used when the neural network has a large number of parameters or the number of collected samples is too small for a specific task. In such a case, fewer training epochs are needed to adjust the model to a particular task. There are several popular image databases: ImageNet and, NoisyStudent for which various architectures of pre-trained neural networks are available. Transfer learning on ImageNet database was utilized in the following studies: [27, 31, 34, 35, 36, 37, 39, 40, 41, 46, 49, 51]. Twelve out of 25 studies decided to use a neural network pre-trained on ImageNet for transfer learning. Therefore, it can be said that this is a very common procedure.
However, as [55] shows, it is not clear whether using ImageNet for transfer learning in medical imaging is the best strategy. ImageNet consists of natural images. Meanwhile, medicine is an entirely different field and is completely unrelated. [56] also stressed the fact that the features which are extracted by models pre-trained on ImageNet can introduce bias.
Only in three of the reviewed studies was transfer learning conducted on lung images. The chosen datasets included 112,120 in [48], 88,079 in [43], and 951 in [50] non-COVID/̄19 lung images. The study [29] did not perform any transfer learning because lung images lack colorful patterns, specific geometrical forms, or similar shapes. The amount of redundant information introduced by a network pre-trained with color images may seriously affect the learning process on gray level images. In study [40], the authors discovered that the model has better performance when pre-trained on ImageNet than without it. However, the authors found out that their models pre-trained on ImageNet were using irrelevant markers on lung images while making a prediction.
Especially when the model is trained on a small amount of data, the usage of completely irrelevant features from another pre-trained model may increase model accuracy/result. For this reason, it is crucial to find a large database with images similar in domain and appearance to limit the possibility of irrelevant markers that take part in a prediction. It is recommended to train a neural network on this database and then use transfer learning to adjust it to the target task.
For transfer learning, it is recommended to take into consideration the following X/̄ray data sources with DICOM images (consider the fact that, in some of them, children and adults lungs are mixed): U.S. National Library of Medicine111pubmed.ncbi.nlm.nih.gov/25525580 ( images), Radiological Society of North America222kaggle.com/c/rsna-pneumonia-detection-challenge ( images), Society for Imaging Informatics in Medicine333kaggle.com/c/siim-acr-pneumothorax-segmentation ( images), Medical Information Mart for Intensive Care444physionet.org/content/mimic-cxr/2.0.0 ( images). For transfer learning on CT, the following data sources are available: The Reference Image Database to Evaluate Therapy Response555wiki.cancerimagingarchive.net/display/Public/RIDER+Lung+CT ( images), A Large-Scale CT and PET/CT Dataset for Lung Cancer Diagnosis666wiki.cancerimagingarchive.net/pages/viewpage.action?pageId=70224216 ( images), The National Lung Screening Trial777wiki.cancerimagingarchive.net/display/NLST ( images).
3.6 Training parameters
The selection of hyperparameters has a large impact on model results. Nevertheless, the process of tuning parameters is empirical and depends on the model architecture. For this reason, it is difficult to present a set of parameters adequate for every model architecture. However, there are several tips which can be used for most models.
Often the learning rate is decreased during the training process. Sometimes callback functions are used to halt training, when the result of a model is optimum, and during the training process, to save and store the best model and its parameters. The most typically used optimizer is Adam. The batch size of images during model training is between 2 and 81 with the most common value 8.
The whole image dataset is typically divided into 3 or 2 sets, most commonly into: training set 80%, validation set 10% and testing set 10% [34, 36, 48, 51]. Proportion 80% to 20% was the most frequently used among divisions into training and testing set respectively [39, 44].
In study [39], the recommendation to conduct external validation is indicated, meaning an evaluation on an independent database. Another public dataset will be the best choice for cross-database validation [31]. However, in the reviewed studies cross-validation is the most frequently used. It is a common choice for training on a small amount of data resources. The problem which may occur during cross-validation is overfitting to the data. For this reason, validation on an external resource is the most trustworthy method.
3.7 Model performance
Evaluation metrics are commonly used to compare different models. For DNN image classification, there are many metrics frequently used for model quality assessment. In the reviewed studies, we discovered a large variability in the number of reported metrics. It is a common situation due to the fact that there are no detailed recommendations as to which performance metric should be used. We recommend the instructions presented in [57], but, unfortunately, in almost all the reviewed studies, at least one metric out of these recommendations was missing.
Based on the rules described in study [57], there are six evaluation criteria for binary classification: accuracy, precision, recall (sensitivity), F score, specificity, AUC. For multi-class classification, there are eight criteria: average accuracy, error rate, precisionμ, recallμ, F scoreμ, precisionM, RecallM, F scoreM, and for multi-label classification four criteria: exact match ratio, labelling F score, retrieval F score, Hamming loss.
There is another important factor which indicates why more than one evaluation metric should be used. It provides the opportunity to compare model architectures and then choose the best one for a given problem. Nevertheless, the models were not trained on the same images. Some databases contained only severe cases which were easier to classify [34]. Even if studies refer to the same data resources, it is possible that the amount of data has increased over time. For this reason, it is rather difficult to make a reliable comparison. The most trustworthy way to compare different model architectures is to look at studies which tested many of them, i.e. [34, 39, 41, 46, 49, 50].
4 Explainable artificial intelligence
4.1 The importance of model explainability
When designing predictive models for healthcare, or any other high-stakes decisions, the explainability of the model is a key part of the solution. The empirical performance of the model is very important, but there can be no responsible modeling if the issue of explainability is not addressed properly for each stakeholder of the system. For physicians, the lack of explainability drastically reduces the confidence in the system. For model developers, it makes it difficult to detect flaws in model behavior and obstructs debugging [58, 59].
For predictive models, two general approaches to explainability are either by using classes of interpretable-by-design models or using post-hoc explanations. Despite the obvious advantages of interpretable-by-design models, their construction requires more domain knowledge linked to the construction of interpretable features. The advantage of post-hoc explanations is that they are constructed after the model has been trained. Thus, the developer can focus on model performance by pouring large volumes of data into a neural network and then deal with model explanations afterwards. In the analyzed studies, the authors used only post-hoc methods which are prevalent in computer vision tasks [60]. Examples of post-hoc explanations are presented in Figure 4.
a) 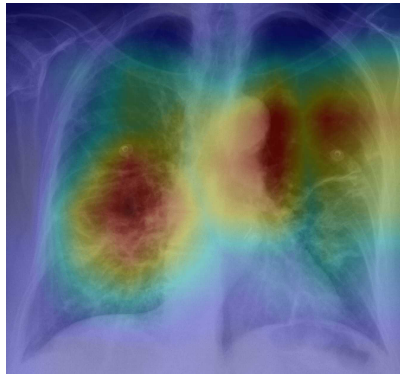
|
b) 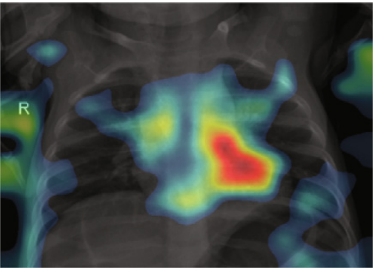
|
c) 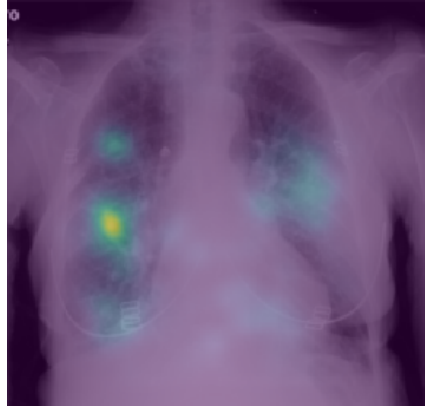
|
d) 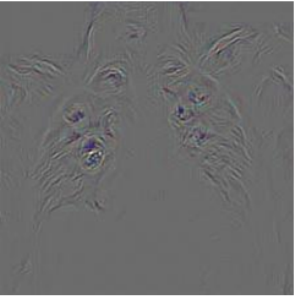
|
e) 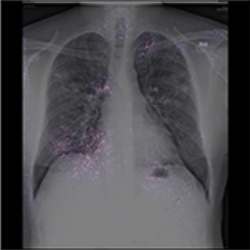
|
f) 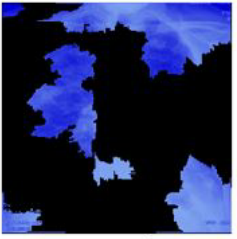
|
Due to the mode of operation, also post-hoc explanation methods can be divided into two groups. The first group consists of input perturbation methods such as Locally Interpretable Model Explanations (LIME), or Occlusion Sensitivity. These methods are based on the analysis of the change of the model response after obscuring, removing, or perturbing some part of the image. The advantage of this class of methods is that they are insensitive to the internal structure of the model. Such so-called model-agnostic approaches assume nothing about the internal structure of the model. By analyzing how a series of input perturbations affect the final prediction, it determines which part of the input is important.
The second group are methods based on the analysis of signal propagation through the network, i.e. model-specific methods. This group of methods uses detailed information about the network architecture and the design of subsequent layers to determine the key regions of input for the final prediction. The advantage of such approaches is that usually, one pass through the structure of the network is sufficient to generate explanations. Model specific methods for explanations of CNNs can be organized into a spectrum of solutions, from gradient-based methods to activation map-based methods.
For gradient-based methods, the gradient between the output model class and the input image is used to calculate saliency maps. For large networks, such as most of those shown in Table 5, the gradient information is very noisy, so there have been many modifications to this method that reduce noise by smoothing or thresholding or rescaling. This class of models includes Guided Backpropagation, Layer-wise relevance propagation, and SmoothGrad.
| Model architectures | Depth | No. of parameters | Layer types |
| ResNet18, ResNet34, ResNet50, ResNet15V2, ResNet50V2 | - | 11.7M-25.6M | ZeroPadding2D, Conv2D, BatchNormalization, Activation, MaxPooling2D, Add, GlobalAveragePooling2D, Dense |
| DenseNet121, DenseNet-161, DenseNet-201 | 121-201 | 8.1M-20.0M | ZeroPadding2D, Conv2D, BatchNormalization, Activation, MaxPooling2D, Concatenate, AveragePooling2D, GlobalAveragePooling2D, Dense |
| VGG-16, VGG-19 | 23-26 | 138-144 | Conv2D, Dense, Flatten, InputLayer, MaxPooling2D |
| InceptionV3 | 159 | 23.9M | Conv2D, BatchNormalization, Activation, MaxPooling2D, AveragePooling2D, Concatenate, GlobalAveragePooling2D, Dense |
| InceptionResNetV2 | 572 | 55.9M | Conv2D, BatchNormalization, Activation, MaxPooling2D, AveragePooling2D, Concatenate, Lambda, GlobalAveragePooling2D, Dense |
| MobileNet | 88 | 4.3M | Conv2D, BatchNormalization, ReLU, DepthwiseConv2D, ZeroPadding2D, GlobalAveragePooling2D, Reshape, Dropout, Activation |
| MobileNetV2 | 88 | 3.5M | Conv2D, BatchNormalization, ReLU, DepthwiseConv2D, ZeroPadding2D, Add, GlobalAveragePooling2D, Dense |
| NASNetMobile, NASNetLarge | - | 5.3M-88.9M | Conv2D, BatchNormalization, Activation, ZeroPadding2D, SeparableConv2D, Add, MaxPooling2D, AveragePooling2D, Cropping2D, Concatenate, GlobalAveragePooling2D, Dense |
| EfficientNet-B0 | - | 5.3M | Rescaling, Normalization, ZeroPadding2D, Conv2D, BatchNormalization, Activation, DepthwiseConv2D, GlobalAveragePooling2D, Reshape, Multiply, Dropout, Add, Dense |
| Efficient TBCNN | 0.23M | Conv2D, MaxPool2D, BatchNormalization, GlobalAveragePooling2D, Add, Dense | |
| Attention-56 | 115 | 31.9M | Conv2D, Lambda, MaxPool2D, UpSampling2D, AveragePooling2D, ZeroPadding2D, Dense, Add, Multiply, BatchNormalization, Dropout |
| Xception | 126 | 22.9M | Conv2D, BatchNormalization, Activation, SeparableConv2D, MaxPooling2D, Add, GlobalAveragePooling2D, Dense |
Methods based on activation maps, such as Class Activation Mapping (CAM) or DeepLIFT, focus on visualizing the relationship between the layer with the feature map (in most cases the penultimate layer of the network) and the model output. Assuming that the feature map stores information about the spatial relevance of features, one can explore what elements of the feature map are most relevant for the final prediction. Such methods often have an assumption about the structure of the network, such as global average pooling before the softmax layer.
In our analysis, the most popular solution turned out to be the one that combines both mentioned above approaches, tracing the gradient between the model prediction and the feature map and then analyzing the spatial information of a specific part of the feature map. This group of methods includes the most popular explanation method Grad-CAM and its modifications Guided Backpropagation, Guided Grad-CAM, Grad-CAM++. Using gradient tracking between the feature map and network output is also a more flexible approach in terms of network architecture without enforcing global pooling.
4.2 XAI methods used in the reviewed studies
The area of model explanations and the number of methods that can be used for this purpose are increasing rapidly [59]. Such methods differ in properties; they work either for a single image (so-called instance level methods) or globally for the whole dataset. Some of them are based on gradients, others on interpretable features, some are intrinsic or post-hoc, model-specific (class-discriminative, high-resolution, multi-layer) or model-agnostic.
Table 6 shows which approach to model explanation was used in each study. The most popular in the reviewed studies was Grad-CAM. Its popularity may be related to the fact that colorful heat maps are easy to implement and seem to be readable. An example of an implementation for Grad-CAM is available online, and its use on melanoma images shows great results.
| Name of the XAI technique | Reference |
| Grad-CAM (gradient-weighted class activation mapping) | [27, 28, 29, 30, 31, 32, 33, 34, 35, 40, 48, 50] |
| LIME (local interpretable model-agnostic explanations) | [39, 46, 50] |
| CAM (class activation mapping) | [32, 36, 39, 44] |
| Saliency (saliency map) | [40, 42, 43, 44] |
| Guided Backpropagation | [42, 44] |
| LRP (layer-wise relevance propagation) | [29, 34] |
| Occlusion (occlusion sensitivity) | [30, 42] |
| AM (activation mapping) | [38] |
| Attribution maps | [47] |
| DeepLIFT | [42] |
| Feature maps | [49] |
| Grad-CAM++ | [29] |
| Guided Grad-CAM | [44] |
| GSInquire | [37] |
| Input X Gradient | [42] |
| Integrated Gradients | [42] |
Another very popular method is LIME. As clearly visible in studies [39, 46], some large superpixels include different structures (i.e., lung tissue and chest wall). Therefore, this method is not accurate enough for an interpretable representation of space due to the lack of semantic meaning.
Some threads related to the application of XAI in the analyzed publications are questionable. Contrary to what [29] states, explanations of ensemble models are possible. A single best model does not have to be selected for the visualization of the prediction. There are many model-agnostic interpretation methods which do not rely on model architecture and can be easily used for explanations, such as: LIME, or Anchors. In most XAI methods, it is possible to adjust them to suit ensemble models. Moreover, ensemble models usually outperform a single model in terms of accuracy.
According to [33], the model makes incorrect decisions in poor quality X/̄rays. This is because the low quality or very low-resolution images do not show enough details even for the models. Such images should be removed while checking the database contents.
The study [30] noticed that the region of the lesion is marked correctly, but that model prediction is wrong. Unless we perform a quantitative and qualitative evaluation of XAI results, we will not have the opportunity to assess the trustworthiness of our model. The model may take into greater consideration other image features than it should. To explore this kind of a model mistake, other XAI methods ought to be used to obtain a better comparison possibility.
4.3 Domain experts’ evaluation of XAI methods
In most of the reviewed studies, the application of XAI comes down to the series of colorful images without any assessment about how valid these explanations are. Colored explanations obscure the original image, which makes it even more difficult to assess their correctness. In images with XAI heat maps, it is often hard or impossible to see pathologies and guess if the model works well. Raw lung images shall be put next to explanations. Also the explanations should be interpreted or validated by radiologists. Otherwise, they are redundant and contribute nothing to the trustworthiness of the model.
Together with the radiologists, we analyzed the explanations from the discussed works. In the following paragraphs, we discuss the most common mistakes or inappropriate explanations.
a) 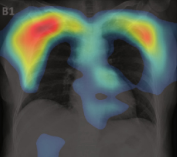
|
b) 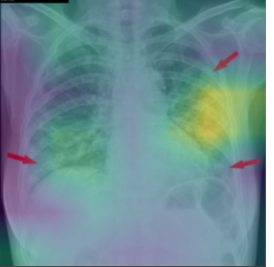
|
c) 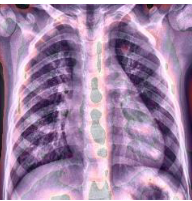
|
d) 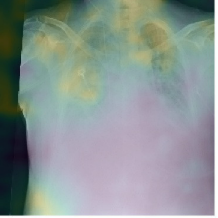
|
In the first example, in Figure 5a), the model focuses on clavicles, scapulas, and soft tissues, which are outside the lungs. Very likely, the model predicts illness based on an improper part of the image. Location of the areas marked by explanation should be inside the chest on the lung tissue because COVID/̄19 lesions are not located on, e.g., lymph nodes. Moreover, there are some elements that cannot be considered as decision factors like imaging artifacts (cables, breathing tubes, image compression) or embedded markup symbols [37]. To prevent the model from focusing on irrelevant features, in some studies, the lungs were segmented, and their background was removed [31, 32, 34, 45, 50]. However, it may not help when some imaging artifacts are present in the area of the lungs.
The second example, in Figure 5b) shows that the model does not take the lesions into account. The model states that parts of the lungs other than the ones marked by the radiologist are relevant for model prediction. Explanations that “roughly indicate the infection location” [32] are not acceptable for the robust model. The model should do this with the accuracy of the pixel marked by radiologists as relevant.
The third example, in Figure 5c), visualization is not clear. The study describes a different XAI method than the one present in the image. Moreover, this visualization highlights the whole image, and it is not possible to guess which features took part in the prediction. It is important to point out that some explanation methods can give clearer results for a specific type of DNN and for a specific domain.
The last example, in Figure 5d) is blurred. The image of the lungs is improperly taken, and the process should be repeated. The current image is useless for the accurate diagnosis process. Such images should be removed during data resource verification before model training.
If the lung lesions are well described, it will be possible to prepare quantity and quality XAI assessment to score the trustworthiness of the specific model. One possible option would be to create measures for the evaluation of XAI image models based on the measures quoted in study [61]: Intersection-Over-Union and token-level, which presents measures for the evaluation of text models.
Evaluation of explanation methods is crucial for confirmation of model trustworthiness. First of all, radiologists should validate a specific model with the help of XAI. They should assess location, size, and shape of marked regions by explanation methods. Their interpretations should contain clear references to structures and lesions in the lungs, such as posterior basal segment, ground-glass opacity, consolidation, frosted glass shadows, etc. The example of a well-prepared XAI interpretation can be found in the study [30].
5 The checklist for responsible analysis of lung images with deep learning models
In this work, we have shown that development of a model which analyzes lung images is a complex process. Therefore, we prepared the checklist based on the analyzed studies and the errors we found in them. In [62], it is shown that well-prepared checklists significantly improve the quality of the modeling process. They help to avoid, or quickly detect and fix, errors.
In the list below, the letter R indicates that the point should be consulted with a field expert / radiologist, and the letter D indicates that the point should be consulted with a model developer.
The points in the checklist below are grouped according to the sections’ names discussed in this study. This should assist in finding a detailed description of the problem stated in the checkpoint list in the corresponding section.
-
•
Data resources
-
D
Does the data and its associated information provide sufficient diagnostic quality? If images are in DICOM, does the header provide the needed information? If not, is it provided in any other way?
-
R
Are the low quality images (i.e., blurred, too dark, or too bright) rejected?
-
D
Is the dataset balanced in terms of sex and age?
-
R
Does the dataset contain one type of images (CT or X/̄ray)?
-
R
Are the lung structures visible (“lung” window) on CT images?
-
D
Are images of children and of adults labelled as such within the dataset?
-
R
Are images correctly categorized in relation to class of pathology?
-
D
Are AP/PA projections described for every X/̄ray image?
-
D
-
•
Image preprocessing
-
D
Is the data preprocessing described?
-
D
Are artifacts (such as captions) removed?
-
D
-
•
Data augmentation (if needed)
-
D
Are the lungs fully present after transformations?
-
R
Are lung structures visible after brightness or contrast transformations?
-
D
Are only sensible transformations applied?
-
D
-
•
Transfer learning (if used)
-
D
Is the transfer learning procedure described?
-
D
Is the applied transfer learning appropriate for this case (i.e.: images of same type and content have been used to train the original model)?
-
D
-
•
Model performance
-
D
Are at least a few metrics of those proposed in [57] used?
-
D
Is the model validated on a different database than the one used for training?
-
D
-
•
Domain quality of model explanations
-
R
Are other structures (i.e., bowel loops) misinterpreted as lungs in segmentation?
-
R
All the areas marked as highly explanatory are located inside the lungs?
-
R
Are artifacts (cables, breathing tubes, image compression, embedded markup symbols) misidentified as part of the explanations?
-
R
Are areas indicated as explanations consistent with opinions of radiologists?
-
R
Do explanations accurately indicate lesions?
-
R
| Checklist / Data resource | 2) | 3) | 4) | 5) | 6) | 7) | 8) | 9) | 10) | 11) | 12) | 13) | 14) | 17) | 23) |
| [D] Does the data and its associated information provide sufficient diagnostic quality? | Y? | N? | N | N? | N? | N | N? | N | N? | N | N | N | Y | N? | N |
| [R] Are the low quality images rejected? | N | N | N | N | N | N | N | N | N | n/a | Y | N | N | Y? | N |
| [D] Is the dataset balanced in terms of sex and age? | Y? | ? | ? | Y? | Y? | Y | Y | ? | N | N | ? | ? | ? | Y? | ? |
| [R] Does the dataset contain one type of images (CT or X/̄ray or the same projection)? | Y | Y | Y | N | Y | Y | N | N | Y | Y | Y | Y | N | Y | N |
| [R] Are the lung structures visible (“lung” window) on CT images? | n/a | n/a | n/a | n/a | n/a | n/a | n/a | n/a | n/a | N | n/a | n/a | n/a | n/a | n/a |
| [D] Are images of children and of adults labelled as such within the dataset? | not all | N | N | Y? | Y | Y | Y | N | Y | not all | N | N | N | N | N |
| [R] Are images correctly categorized in relation to class of pathology? | N | N | Y | N | N | N | N | N | Y | N | Y | N | Y | N? | N |
| [D] Are AP/PA projections described for every X/̄ray image? | N | Y | N | Y | Y | Y | Y | N | Y | n/a | N | N | Y | Y | N |
| Checklist / Study | [27] | [28] | [29] | [30] | [31] | [32] | [33] | [34] | [35] | [36] | [37] | [38] |
| Image preprocessing | ||||||||||||
| [D] Is the data preprocessing described? | Y | N | Y | Y | Y | Y | Y | Y | Y | Y | Y | Y |
| [D] Are artifacts (such as captions) removed? | ? | ? | Y | Y | Y | n/a | ? | Y | N | N | Y | n/a |
| Data augmentation (if needed) | ||||||||||||
| [D] Are the lungs fully present after transformations? | ? | ? | ? | n/a | Y? | Y | n/a | ? | ? | ? | ? | N? |
| [R] Are lung structures visible after brightness or contrast transformations? | n/a | ? | n/a | n/a | n/a | Y | n/a | ? | n/a | ? | ? | n/a |
| [D] Are only sensible transformations applied? | Y | ? | Y | n/a | Y | Y | n/a | ? | ? | N | N | N |
| Transfer learning (if used) | ||||||||||||
| [D] Is the transfer learning procedure described? | Y | n/a | n/a | Y? | Y | n/a | Y | Y | Y | Y | Y | Y |
| [D] Is the applied transfer learning appropriate for this case? | N | n/a | n/a | N | N | n/a | N | Y? | N | N | N | N |
| Model performance | ||||||||||||
| [D] Are at least a few metrics of those proposed in [57] used? | Y | Y | Y | Y | Y | Y | Y | Y | Y | Y | Y | Y |
| [D] Is the model validated on a different database than the one used for training? | N | N | N | N | Y | Y | N | N | N | N | N | N |
| Domain quality of model explanations | ||||||||||||
| [R] Are other structures (i.e., bowel loops) misinterpreted as lungs in segmentation? | n/a | n/a | n/a | n/a | N | Y? | n/a | N | n/a | n/a | n/a | Y |
| [R] All the areas marked as highly explanatory are located inside the lungs? | Y | n/a | Y | n/a | Y | Y | Y? | Y | N | Y | Y | |
| [R] Are artifacts misidentified as part of the explanations? | Y | n/a | N | n/a | n/a | n/a | n/a | N | n/a | n/a | n/a | |
| [R] Are areas indicated as explanations consistent with opinions of radiologists? | N | n/a | n/a | n/a | n/a | n/a | n/a | n/a | Y | n/a | n/a | n/a |
| [R] Do explanations accurately indicate lesions? | Y? | n/a | Y? | n/a | Y? | Y | N | N | N | Y? | N | Y |
According to the prepared checklist, in Table 7 and 8, we tried to analyze which points are fulfilled by the reviewed studies and the datasets used in these papers for the neural network training. Due to the possibility of changes in preprints, we only examined papers already published in journals.
We applied the following denotements: “Y”, “N” mean yes and no respectively (if an answer is probable then the additional “?” is added), “?” means there is no information provided, “n/a” signifies that the issue does not apply to a particular publication. Due to the fact that we can only evaluate the information contained in the article, the answers given to some questions from the checklist need to be clarified.
The question regarding balance in the dataset (Table 7) has two components. Sometimes, the dataset is balanced concerning only one criterion but not in terms of the second one. In such cases, we put “Y?” sign. We did similarly in cases where many metadata are missing, but there is a balance considering the existing data.
We would like to stress that mixed projections of X-rays are present in databases: 5), 8), 23), both PA and lateral. Databases 5) and 9) contain also CT exam images. Furthermore, dataset 23) includes CT scanogram described as X-ray which is inappropriate for medical use. It is important to note that if the datasets in Table 7 are labeled as containing images incorrectly categorized by pathology class, then in most cases patients should be classified into more than one pathology class. Moreover, in other databases, X-rays marked as pneumonia or other disorders have no radiological findings.
In Table 8, for the papers [35, 36], the assessment of the presence of artifacts was made based on the images provided by the authors. In the question regarding the visibility of lungs after data augmentation, we put the value “N?” because there were no details about applied random cropping. Such an answer reflects the fact that cropping can be risky especially if the parameters are not carefully chosen. In case of [31], we put “Y?” as the authors honestly pointed out that their model for segmentation sometimes improperly generates masks when there is severe opacity. In such situations, the mask covers lungs only partially.
We would like to explain the criteria for assessing data augmentation and transfer learning. In the case of the former, we put “N” when horizontal flip was applied. In the latter, the main criterion was whether the authors used a model pre-trained on ImageNet dataset. Such behavior is not recommended as natural scene images are significantly different from medical images. The biggest difference is the fact that X-ray and CT images are in grayscale unlike images in ImageNet. In the reviewed papers, there were two approaches to transfer learning: the backbone weights were frozen and the case where the pre-trained weights were just an initialization and were later trained. We decided to put “N” in both scenarios as both require artificial conversion of grayscale images to RGB.
In Table 8, the difficulty to assess the solutions applied in the papers occurred also in the section requiring radiological expert knowledge. In the group “Domain quality of model explanations”, we were not able to check which of these points were fulfilled by each of the studies, as most publications contain only few or even none images, which could be radiologically evaluated. Nevertheless, although our observations were made on such limited data, we were able to identify many mistakes in the radiologic background.
6 Conclusion
The sudden outbreak of the COVID/̄19 pandemic has shown us how we need effective tools to support the physicians. Deep neural networks can offer much in the analysis of lung images, but responsible modeling requires very thorough model validation. Models without explanations create validation debt and explanations without consultations with a radiologist are just an illusion of validation.
This work shows a critical analysis of 25 state-of-the-art articles that use deep learning models based on lung images to identify COVID/̄19. We have selected the most advanced papers in which the authors made extra effort to supplement the models with explanations. But even in this sample, it turns out that only in 7 out of the 25 reviewed studies, the models were consulted with radiologists and regarding the model explanations, they were validated only in three studies [33, 35, 50].
It is important to point out that, for medical examination, the most valuable are large-resolution images, especially in DICOM format. Surprisingly, out of the considered datasets, DICOM COVID/̄19 cases are available only in one online dataset, and there are only four datasets with DICOM images for other lung diseases. The motivations for explaining models are commendable. Nevertheless, in many works, interpretations of explanations and summaries are missing. The XAI method is not a conclusion in itself. The fact that the model provides correct explanations for a few images does not yet show that the model works properly. It would be good to quantitatively validate XAI methods. For this purpose, the help of clinicians or proper annotations prepared by radiologists beforehand are necessary.
The paper mentions a long list of problems in modeling, but this analysis is not intended to criticize any of the mentioned articles, these are state-of-the-art papers often published in prestigious journals. However, the analysis of these articles makes one look critically at standards in AI for healthcare or rather the lack of them. We hope that this paper will initiate the process of development of standards for responsible AI solutions in healthcare. In this paper, we showed that the verification of the XAI solutions for medical images is not only important but it is a must.
Following the guidelines proposed in the paper, we created an online GitHub repository888https://github.com/Hryniewska/checklist which can be maintained by the community working on AI models for image analysis in healthcare. This repository is intended to be a starting point for further development of the proposed checklist to meet the evolving challenges in responsible modeling. We believe that if the proposed checklist is taken into account when building models, we will get better models.
7 Acknowledgment
We would like to thank the anonymous reviewers whose detailed comments and valuable suggestions greatly improved this paper. Work on this paper was funded by the IDUB against COVID/̄19 initiative at the Warsaw University of Technology.
References
- [1] Xingzhi Xie, Zheng Zhong, Wei Zhao, Chao Zheng, Fei Wang, and Jun Liu. Chest CT for Typical Coronavirus Disease 2019 (COVID-19) Pneumonia: Relationship to Negative RT-PCR Testing. Radiology, 296(2):E41–E45, 2020.
- [2] Yicheng Fang, Huangqi Zhang, Jicheng Xie, Minjie Lin, Lingjun Ying, Peipei Pang, and Wenbin Ji. Sensitivity of Chest CT for COVID-19: Comparison to RT-PCR. Radiology, 296(2):E115–E117, 2020. PMID: 32073353.
- [3] Ho Yuen Frank Wong, Hiu Yin Sonia Lam, Ambrose Ho-Tung Fong, Siu Ting Leung, Thomas Wing-Yan Chin, Christine Shing Yen Lo, Macy Mei-Sze Lui, Jonan Chun Yin Lee, Keith Wan-Hang Chiu, Tom Wai-Hin Chung, Elaine Yuen Phin Lee, Eric Yuk Fai Wan, Ivan Fan Ngai Hung, Tina Poy Wing Lam, Michael D. Kuo, and Ming-Yen Ng. Frequency and Distribution of Chest Radiographic Findings in Patients Positive for COVID-19. Radiology, 296(2):E72–E78, 2020. PMID: 32216717.
- [4] Victor M. Corman, Olfert Landt, Marco Kaiser, Richard Molenkamp, Adam Meijer, Daniel K.W. Chu, Tobias Bleicker, Sebastian Brünink, Julia Schneider, Marie Luisa Schmidt, Daphne G.J.C. Mulders, Bart L. Haagmans, Bas Van Der Veer, Sharon Van Den Brink, Lisa Wijsman, Gabriel Goderski, Jean Louis Romette, Joanna Ellis, Maria Zambon, Malik Peiris, Herman Goossens, Chantal Reusken, Marion P.G. Koopmans, and Christian Drosten. Detection of 2019 novel coronavirus (2019-nCoV) by real-time RT-PCR. Eurosurveillance, 25(3):1–8, 2020.
- [5] Yan Li and Liming Xia. Coronavirus disease 2019 (COVID-19): Role of chest CT in diagnosis and management. American Journal of Roentgenology, 214(6):1280–1286, jun 2020.
- [6] Weifang Kong and Prachi P. Agarwal. Chest Imaging Appearance of COVID-19 Infection. Radiology: Cardiothoracic Imaging, 2(1):e200028, jan 2020.
- [7] Yicheng Fang, Huangqi Zhang, Jicheng Xie, Minjie Lin, Lingjun Ying, Peipei Pang, and Wenbin Ji. Sensitivity of chest CT for COVID-19: Comparison to RT-PCR. Radiology, 296(2):E115–E117, aug 2020.
- [8] Michael Chung, Adam Bernheim, Xueyan Mei, Ning Zhang, Mingqian Huang, Xianjun Zeng, Jiufa Cui, Wenjian Xu, Yang Yang, Zahi A. Fayad, Adam Jacobi, Kunwei Li, Shaolin Li, and Hong Shan. CT imaging features of 2019 novel coronavirus (2019-NCoV). Radiology, 295(1):202–207, feb 2020.
- [9] Harrison X. Bai, Ben Hsieh, Zeng Xiong, Kasey Halsey, Ji Whae Choi, Thi My Linh Tran, Ian Pan, Lin Bo Shi, Dong Cui Wang, Ji Mei, Xiao Long Jiang, Qiu Hua Zeng, Thomas K. Egglin, Ping Feng Hu, Saurabh Agarwal, Fang Fang Xie, Sha Li, Terrance Healey, Michael K. Atalay, and Wei Hua Liao. Performance of Radiologists in Differentiating COVID-19 from Non-COVID-19 Viral Pneumonia at Chest CT. Radiology, 296(2):E46–E54, aug 2020.
- [10] Ho Yuen Frank Wong, Hiu Yin Sonia Lam, Ambrose Ho Tung Fong, Siu Ting Leung, Thomas Wing Yan Chin, Christine Shing Yen Lo, Macy Mei Sze Lui, Jonan Chun Yin Lee, Keith Wan Hang Chiu, Tom Wai Hin Chung, Elaine Yuen Phin Lee, Eric Yuk Fai Wan, Ivan Fan Ngai Hung, Tina Poy Wing Lam, Michael D. Kuo, and Ming Yen Ng. Frequency and Distribution of Chest Radiographic Findings in Patients Positive for COVID-19. Radiology, 296(2):E72–E78, aug 2020.
- [11] Zixing Huang, Shuang Zhao, Zhenlin Li, Weixia Chen, Lihong Zhao, Lipeng Deng, and Bin Song. The Battle Against Coronavirus Disease 2019 (COVID-19): Emergency Management and Infection Control in a Radiology Department. Journal of the American College of Radiology, 17(6):710–716, jun 2020.
- [12] Chunqin Long, Huaxiang Xu, Qinglin Shen, Xianghai Zhang, Bing Fan, Chuanhong Wang, Bingliang Zeng, Zicong Li, Xiaofen Li, and Honglu Li. Diagnosis of the Coronavirus disease (COVID-19): rRT-PCR or CT? European Journal of Radiology, 126:108961, may 2020.
- [13] Adam Jacobi, Michael Chung, Adam Bernheim, and Corey Eber. Portable chest X-ray in coronavirus disease-19 (COVID-19): A pictorial review. Clinical Imaging, 64:35–42, aug 2020.
- [14] Zilong Hu, Jinshan Tang, Ziming Wang, Kai Zhang, Lin Zhang, and Qingling Sun. Deep learning for image-based cancer detection and diagnosis - A survey. Pattern Recognition, 83:134–149, nov 2018.
- [15] Hareem Ayesha, Sajid Iqbal, Mehreen Tariq, Muhammad Abrar, Muhammad Sanaullah, Ishaq Abbas, Amjad Rehman, Muhammad Farooq Khan Niazi, and Shafiq Hussain. Automatic medical image interpretation: State of the art and future directions. Pattern Recognition, 114, jun 2021.
- [16] Catarina Barata, M. Emre Celebi, and Jorge S. Marques. Explainable skin lesion diagnosis using taxonomies. Pattern Recognition, 110, feb 2021.
- [17] Yunyun Yang, Wenjing Jia, and Yunna Yang. Multi-atlas segmentation and correction model with level set formulation for 3D brain MR images. Pattern Recognition, 90:450–463, jun 2019.
- [18] Awni Y. Hannun, Pranav Rajpurkar, Masoumeh Haghpanahi, Geoffrey H. Tison, Codie Bourn, Mintu P. Turakhia, and Andrew Y. Ng. Cardiologist-level arrhythmia detection and classification in ambulatory electrocardiograms using a deep neural network. Nature Medicine, 25(1):65–69, jan 2019.
- [19] H. D. Cheng, Juan Shan, Wen Ju, Yanhui Guo, and Ling Zhang. Automated breast cancer detection and classification using ultrasound images: A survey. Pattern Recognition, 43(1):299–317, jan 2010.
- [20] Pranav Rajpurkar, Jeremy Irvin, Kaylie Zhu, Brandon Yang, Hershel Mehta, Tony Duan, Daisy Ding, Aarti Bagul, Curtis Langlotz, Katie Shpanskaya, Matthew P. Lungren, and Andrew Y. Ng. CheXNet: Radiologist-Level Pneumonia Detection on Chest X-Rays with Deep Learning. CoRR, abs/1711.05225, 2017.
- [21] S. Jaiswal, M. F. Valstar, A. Gillott, and D. Daley. Automatic Detection of ADHD and ASD from Expressive Behaviour in RGBD Data. In 2017 12th IEEE International Conference on Automatic Face Gesture Recognition (FG 2017), pages 762–769, 2017.
- [22] Johnatan Carvalho Souza, João Otávio Bandeira Diniz, Jonnison Lima Ferreira, Giovanni Lucca França da Silva, Aristófanes Corrêa Silva, and Anselmo Cardoso de Paiva. An automatic method for lung segmentation and reconstruction in chest X-ray using deep neural networks. Computer Methods and Programs in Biomedicine, 177:285–296, aug 2019.
- [23] Haris Jeelani, Jonathan Martin, Francis Vasquez, Michael Salerno, and Daniel S. Weller. Image quality affects deep learning reconstruction of MRI. In Proceedings - International Symposium on Biomedical Imaging, volume 2018-April, pages 357–360. IEEE Computer Society, may 2018.
- [24] Charalambos Chrysostomou, Loizos Koutsantonis, Christos Lemesios, and Costas N. Papanicolas. SPECT Imaging Reconstruction Method Based on Deep Convolutional Neural Network. 2019 IEEE Nuclear Science Symposium and Medical Imaging Conference, NSS/MIC 2019, oct 2020.
- [25] Cynthia Rudin. Stop explaining black box machine learning models for high stakes decisions and use interpretable models instead. NIPS 2018, pages 1–15, nov 2018.
- [26] Alessandro Liberati, Douglas G. Altman, Jennifer Tetzlaff, Cynthia Mulrow, Peter C. Gøtzsche, John P.A. Ioannidis, Mike Clarke, P. J. Devereaux, Jos Kleijnen, and David Moher. The PRISMA statement for reporting systematic reviews and meta-analyses of studies that evaluate health care interventions: Explanation and elaboration. PLoS Medicine, 6(7), 2009.
- [27] Luca Brunese, Francesco Mercaldo, Alfonso Reginelli, and Antonella Santone. Explainable Deep Learning for Pulmonary Disease and Coronavirus COVID-19 Detection from X-rays. Computer Methods and Programs in Biomedicine, 196:105608, 2020.
- [28] Z. Han, B. Wei, Y. Hong, T. Li, J. Cong, X. Zhu, H. Wei, and W. Zhang. Accurate Screening of COVID-19 Using Attention-Based Deep 3D Multiple Instance Learning. IEEE Transactions on Medical Imaging, 39(8):2584–2594, 2020.
- [29] M. R. Karim, T. Döhmen, M. Cochez, O. Beyan, D. Rebholz-Schuhmann, and S. Decker. DeepCOVIDExplainer: Explainable COVID-19 Diagnosis from Chest X-ray Images. In IEEE International Conference on Bioinformatics and Biomedicine (BIBM), pages 1034–1037, 2020.
- [30] Eri Matsuyama. A deep learning interpretable model for novel coronavirus disease (COVID-19) screening with chest CT images. Journal of Biomedical Science and Engineering, 13(7):140–152, 2020.
- [31] Yujin Oh, Sangjoon Park, and Jong Chul Ye. Deep Learning COVID-19 Features on CXR using Limited Training Data Sets. IEEE Transactions on Medical Imaging, 0062(c):1–1, 2020.
- [32] Xi Ouyang, Jiayu Huo, Liming Xia, Fei Shan, Jun Liu, Zhanhao Mo, Fuhua Yan, Zhongxiang Ding, Qi Yang, Bin Song, Feng Shi, Huan Yuan, Ying Wei, Xiaohuan Cao, Yaozong Gao, Dijia Wu, Qian Wang, and Dinggang Shen. Dual-Sampling Attention Network for Diagnosis of COVID-19 from Community Acquired Pneumonia. IEEE Transactions on Medical Imaging, 39(XX):1–1, 2020.
- [33] Tulin Ozturk, Muhammed Talo, Eylul Azra Yildirim, Ulas Baran Baloglu, Ozal Yildirim, and U. Rajendra Acharya. Automated detection of COVID-19 cases using deep neural networks with X-ray images. Computers in Biology and Medicine, 121(April):103792, 2020.
- [34] S. Tabik, A. Gómez-Ríos, J. L. Martín-Rodríguez, I. Sevillano-García, M. Rey-Area, D. Charte, E. Guirado, J. L. Suárez, J. Luengo, M. A. Valero-González, P. García-Villanova, E. Olmedo-Sánchez, and F. Herrera. COVIDGR Dataset and COVID-SDNet Methodology for Predicting COVID-19 Based on Chest X-Ray Images. IEEE Journal of Biomedical and Health Informatics, 24(12):3595–3605, 2020.
- [35] Nikos Tsiknakis, Eleftherios Trivizakis, Evangelia Vassalou, Georgios Papadakis, Demetrios Spandidos, Aristidis Tsatsakis, Jose Sánchez-García, Rafael López-González, Nikolaos Papanikolaou, Apostolos Karantanas, and Kostas Marias. Interpretable artificial intelligence framework for COVID-19 screening on chest X-rays. Experimental and Therapeutic Medicine, pages 727–735, 2020.
- [36] Ferhat Ucar and Deniz Korkmaz. COVIDiagnosis-Net: Deep Bayes-SqueezeNet based diagnosis of the coronavirus disease 2019 (COVID-19) from X-ray images. Medical Hypotheses, 140(April):109761, 2020.
- [37] Linda Wang, Zhong Qiu Lin, and Alexander Wong. COVID-Net: a tailored deep convolutional neural network design for detection of COVID-19 cases from chest X-ray images. Scientific Reports, 10(1):19549, Nov 2020.
- [38] Y. H. Wu, S. H. Gao, J. Mei, J. Xu, D. P. Fan, R. G. Zhang, and M. M. Cheng. JCS: An Explainable COVID-19 Diagnosis System by Joint Classification and Segmentation. IEEE Trans Image Process, 30:3113–3126, 2021.
- [39] Md Manjurul Ahsan, Kishor Datta Gupta, Mohammad Maminur Islam, Sajib Sen, Md. Lutfar Rahman, and Mohammad Shakhawat Hossain. Study of Different Deep Learning Approach with Explainable AI for Screening Patients with COVID-19 Symptoms: Using CT Scan and Chest X-ray Image Dataset. arXiv, page 2007.12525, 2020.
- [40] Nikita Albert. Evaluation of Contemporary Convolutional Neural Network Architectures for Detecting COVID-19 from Chest Radiographs. arXiv, page 2007.01108, 2020.
- [41] Plamen P Angelov and Eduardo A Soares. Explainable-By-Design Approach For Covid-19 Classification Via CT-Scan. medRxiv, (July):2020.04.24.20078584, 2020.
- [42] Soumick Chatterjee, Fatima Saad, Chompunuch Sarasaen, Suhita Ghosh, Rupali Khatun, Petia Radeva, Georg Rose, Sebastian Stober, Oliver Speck, and Andreas Nürnberger. Exploration of Interpretability Techniques for Deep COVID-19 Classification using Chest X-ray Images. arXiv, page 2006.02570, 2020.
- [43] Joseph Paul Cohen, Lan Dao, Paul Morrison, Karsten Roth, Yoshua Bengio, Beiyi Shen, Almas Abbasi, Mahsa Hoshmand-Kochi, Marzyeh Ghassemi, Haifang Li, and Tim Q Duong. Predicting COVID-19 Pneumonia Severity on Chest X-ray with Deep Learning. arXiv, 8(December 2019):2005.11856, 2020.
- [44] Biraja Ghoshal and Allan Tucker. Estimating Uncertainty and Interpretability in Deep Learning for Coronavirus (COVID-19) Detection. arXiv, page 2003.10769, 2020.
- [45] Ophir Gozes, Ma Frid, Hayit Greenspan, and D Patrick. Rapid AI Development Cycle for the Coronavirus ( COVID-19 ) Pandemic : Initial Results for Automated Detection & Patient Monitoring using Deep Learning CT Image Analysis. arXiv, page 2003.05037, 2020.
- [46] Amit Kumar Jaiswal, Prayag Tiwari, Vipin Kumar Rathi, Jia Qian, Hari Mohan Pandey, and Victor Hugo C Albuquerque. COVIDPEN: A Novel COVID-19 Detection Model using Chest X-Rays and CT Scans. medRxiv, page 2020.07.08.20149161, 2020.
- [47] Shahin Khobahi, Chirag Agarwal, and Mojtaba Soltanalian. CoroNet: A Deep Network Architecture for Semi-Supervised Task-Based Identification of COVID-19 from Chest X-ray Images. medRxiv, page 2020.04.14.20065722, 2020.
- [48] Laboni Sarker, Mohaiminul Islam, Tanveer Hannan, Ahmed Zakaria, Zakaria Ahmed, and Ahmed Zakaria. COVID-DenseNet: A deep learning architecture to detect COVID-19 from chest radiology images. Preprints, (May):2020050151, 2020.
- [49] Vishal Sharma and Curtis Dyreson. COVID-19 detection using Residual Attention Network an Artificial Intelligence approach. arXiv, page 2006.16106, 2020.
- [50] Alberto Signoroni, Mattia Savardi, Sergio Benini, Nicola Adami, Riccardo Leonardi, Paolo Gibellini, Filippo Vaccher, Marco Ravanelli, Andrea Borghesi, Roberto Maroldi, and Davide Farina. End-to-end learning for semiquantitative rating of COVID-19 severity on Chest X-rays. arXiv, page 2006.04603, 2020.
- [51] Maryam Zokaeinikoo, Prasenjit Mitra, Soundar Kumara, and Pooyan Kazemian. AIDCOV: An Interpretable Artificial Intelligence Model for Detection of COVID-19 from Chest Radiography Images. medRxiv, page 2020.05.24.20111922, 2020.
- [52] Soon Ho Yoon, Kyung Hee Lee, Jin Yong Kim, Young Kyung Lee, Hongseok Ko, Ki Hwan Kim, Chang Min Park, and Yun Hyeon Kim. Chest radiographic and ct findings of the 2019 novel coronavirus disease (Covid-19): Analysis of nine patients treated in Korea. Korean Journal of Radiology, 21(4):498–504, apr 2020.
- [53] Edward Y. Lee. Pediatric Interstitial (Diffuse) Lung Disease. In Imaging in Pediatric Pulmonology, pages 145–197. Springer International Publishing, 2020.
- [54] Laure Wynants, Ben Van Calster, Marc M.J. Bonten, Gary S. Collins, Thomas P.A. Debray, Maarten De Vos, Maria C. Haller, Georg Heinze, Karel G.M. Moons, Richard D. Riley, Ewoud Schuit, Luc J.M. Smits, Kym I.E. Snell, Ewout W. Steyerberg, Christine Wallisch, and Maarten Van Smeden. Prediction models for diagnosis and prognosis of covid-19 infection: Systematic review and critical appraisal. The BMJ, 369, 2020.
- [55] Veronika Cheplygina. Cats or CAT scans: transfer learning from natural or medical image source datasets? Current Opinion in Biomedical Engineering, 9:21–27, oct 2018.
- [56] Hak Gu Kim, Yeoreum Choi, and Yong Man Ro. Modality-bridge Transfer Learning for Medical Image Classification. Proceedings - 2017 10th International Congress on Image and Signal Processing, BioMedical Engineering and Informatics, CISP-BMEI 2017, 2018-January:1–5, aug 2017.
- [57] O.S. Albahri, A.A. Zaidan, A.S. Albahri, B.B. Zaidan, Karrar Hameed Abdulkareem, Z.T. Al-qaysi, A.H. Alamoodi, A.M. Aleesa, M.A. Chyad, R.M. Alesa, L.C. Kem, Muhammad Modi Lakulu, A.B. Ibrahim, and Nazre Abdul Rashid. Systematic review of artificial intelligence techniques in the detection and classification of covid-19 medical images in terms of evaluation and benchmarking: Taxonomy analysis, challenges, future solutions and methodological aspects. Journal of Infection and Public Health, 13(10):1381–1396, 2020.
- [58] Przemyslaw Biecek and Tomasz Burzykowski. Explanatory Model Analysis. Chapman and Hall/CRC, New York, 2021.
- [59] Andreas Holzinger, Chris Biemann, Constantinos S. Pattichis, and Douglas B. Kell. What do we need to build explainable AI systems for the medical domain? CoRR, abs/1712.09923:1712.09923, 2017.
- [60] Wojciech Samek, Thomas Wiegand, and Klaus-Robert Müller. Explainable Artificial Intelligence: Understanding, Visualizing and Interpreting Deep Learning Models. CoRR, abs/1708.08296:1708.08296, 2017.
- [61] Jay DeYoung, Sarthak Jain, Nazneen Fatema Rajani, Eric Lehman, Caiming Xiong, Richard Socher, and Byron C. Wallace. ERASER: A benchmark to evaluate rationalized NLP models. In Proceedings of the 58th Annual Meeting of the Association for Computational Linguistics, pages 4443–4458, Online, jul 2020. Association for Computational Linguistics.
- [62] Atul Gawande. The Checklist Manifesto: How to Get Things Right. Profile, 2011.