11email: oliver.muller@astro.unistra.fr 22institutetext: Leibniz-Institut fur Astrophysik Potsdam (AIP), An der Sternwarte 16, D-14482 Potsdam, Germany 33institutetext: School of Physics and Astronomy, Cardiff University, Queens Buildings, The Parade, Cardiff,CF24 3AA, UK 44institutetext: European Southern Observatory, Karl-Schwarzschild Strasse 2, 85748, Garching, Germany 55institutetext: Department of Physics, University of Surrey, Guildford GU2 7XH, UK 66institutetext: Research School of Astronomy and Astrophysics, Australian National University, Canberra, ACT 2611, Australia
The coherent motion of Cen A dwarf satellite galaxies remains a challenge for CDM cosmology††thanks: Based on observations collected at the European Organisation for Astronomical Research in the Southern Hemisphere under ESO programmes 0101.A-0193(A) and 0101.A-0193(B).
The plane-of-satellites problem is one of the most severe small-scale challenges for the standard CDM cosmological model: several dwarf galaxies around the Milky Way and Andromeda co-orbit in thin, planar structures. A similar case has been identified around the nearby elliptical galaxy Centaurus A (Cen A). In this Letter, we study the satellite system of Cen A adding twelve new galaxies with line-of-sight velocities from VLT/MUSE observations. We find 21 out of 28 dwarf galaxies with measured velocities share a coherent motion. Similarly flattened and coherently moving structures are found only in 0.2 of Cen A analogs in the Illustris-TNG100 cosmological simulation, independently of whether we use its dark-matter-only or hydrodynamical run. These analogs are not co-orbiting, and arise only by chance projection, thus they are short-lived structures in such simulations. Our findings indicate that the observed co-rotating planes of satellites are a persistent challenge for CDM, which is largely independent from baryon physics.
Key Words.:
Cosmology: dark matter – Cosmology: observations – Galaxies: dwarf – Galaxies: elliptical and lenticular, cD – Galaxies: halos – Galaxies: kinematics and dynamics1 Introduction
One of the main challenges for current models of galaxy formation is the plane-of-satellites problem (Pawlowski, 2018). The plane-of-satellite problem has its roots in the mid-70s (Kunkel & Demers, 1976; Lynden-Bell, 1976), even though the implications for cosmology had not been realized at that time. The then-known six satellites of the Milky Way (MW) were found to be arranged in a thin, planar structure and were thought to have a tidal origin (Lynden-Bell, 1982). In the beginning of the new millennium, several high-resolution cosmological simulations became available (e.g. Springel et al. 2005), which allowed investigating cosmological predictions on the scale of galaxy groups. Kroupa et al. (2005) pointed out that the flattened spatial distribution of the then-known eleven Milky Way satellites – a feature which was basically discovered 40 years earlier – is incompatible with the standard Cold Dark Matter (CDM) model of structure formation, which predicts close to isotropic satellite distributions. This conclusion was met with several rebuttals (e.g., Zentner et al., 2005; Libeskind et al., 2005, 2009) showing that a certain degree of anisotropy is imprinted in the galaxy distribution from the accretion through the cosmic web (Libeskind et al., 2016), thus some galaxies may occasionally host flattened satellite structures. The discovery of another flattened structure of satellite galaxies around the Andromeda galaxy (Koch & Grebel, 2006; McConnachie & Irwin, 2006) showed that these planar distributions may not be rare exceptions.
A major step in understanding these structures was the measurement of the proper motions of the classical MW satellites with the Hubble Space Telescope (HST, e.g. Dinescu et al., 2004; Sohn et al., 2017), revealing that these galaxies are also kinematically correlated (Metz et al., 2008; Pawlowski et al., 2012). A similar kinematic coherence was later found for the Andromeda system by measuring the line-of-sight velocities of the dwarf galaxies (Ibata et al., 2013). Novel proper motion measurements of two satellites of the Andromeda galaxy indicate that they, too, co-orbit along their satellite plane (Sohn et al., 2020).
Nowadays the existence of co-rotating satellite systems represents one of the major controversies in near-field cosmology (Ibata et al., 2014b; Cautun et al., 2015; Pawlowski et al., 2015; Sawala et al., 2016; Lipnicky & Chakrabarti, 2017; Samuel et al., 2020). While the mere existence of flattened structures is not seen as a major problem anymore (e.g., Santos-Santos et al., 2020), the kinematic coherence of the satellite systems is a conundrum. Considering both phenomena, the spatial flattening and the kinematic coherence constitute the actual plane-of-satellites problem (Pawlowski, 2018).
Are flattened, co-rotating satellite systems a peculiarity of the Local Group or are they present around other galaxies as well? Using the Sloan Digital Sky Survey (SDSS), Ibata et al. (2014a) studied pairs of satellite galaxies on opposite sides of their host and found that their line-of-sight velocities are preferentially anti-correlated. This is expected if they lie in co-rotating planes, suggesting that planes of satellites might be abundant in the Universe, if the signal is indeed physical and not a statistical fluke (Phillips et al. 2015; Cautun et al. 2015, but see also Ibata et al. 2015).
In the Local Volume ( Mpc), there is evidence for flattened structures around Cen A (Tully et al., 2015), M 83 (Müller et al., 2018b), and M 101 (Müller et al., 2017b). Regarding Cen A, Tully et al. (2015) suggested the existence of two almost parallel satellite planes, but the subsequent discovery of new dwarf galaxies (Crnojević et al., 2016; Müller et al., 2017a) weakened the case for a strict separation in two planes (Müller et al., 2016, 2019). Interestingly, the planes around Andromeda and Cen A are mainly aligned with the cosmic web, while the plane around the MW and the candidate planes around M 83 and M 101 are not (Libeskind et al., 2015, 2019).
In Müller et al. (2018a) we reported the discovery of a kinematic correlation among the satellites of Cen A: 14 out of 16 galaxies seemingly co-rotate around the host. In cosmological simulations, satellite systems with a similar degree of kinematic coherence and flattening were found in only of Cen A analogs, indicating a similar degree of conflict as in earlier studies of the MW and Andromeda. In Müller et al. (2020), we have presented spectroscopy taken with the Multi Unit Spectroscopic Explorer (MUSE) mounted at the Very Large Telescope (VLT) of 12 additional dwarf galaxies around Cen A. Here we use them to test our previous assessment of a co-rotating plane-of-satellites around Cen A.
2 The Cen A satellite system
| Galaxy Name | Alternative name | Source | Type | ||||
| (degrees) | (degrees) | (Mpc) | (km s-1) | ||||
| (a) | (b) | (c) | (d) | (e) | (f) | (g) | (e) |
| ESO 269-037 | PGC045916 | 195.8875 | 46.5842 | 3.150.09 (1) | 744 (2) | HI | dIrr |
| NGC 4945 | PGC045279 | 196.3583 | 49.4711 | 3.720.03 (3) | 563 (4) | HI | Scd |
| ESO 269-058 | PGC045717 | 197.6333 | 46.9908 | 3.750.02 (1) | 400 (5) | HI | dIrr |
| KK 189 | PGC166158 | 198.1883 | 41.8320 | 4.210.17 (6) | 753 (7) | stars | dSph |
| ESO 269-066 | PGC045916 | 198.2875 | 44.8900 | 3.750.03 (1) | 784 (8) | stars | dSph |
| NGC 5011C | PGC045917 | 198.2958 | 43.2656 | 3.730.03 (1) | 647 (9) | stars | Tr |
| KKs 54 | PGC2815821 | 200.3829 | 31.8864 | 3.750.10 (10) | 621 (7) | stars | Tr |
| KK 196 | PGC046663 | 200.4458 | 45.0633 | 3.960.11 (1) | 741 (11) | stars | dIrr |
| NGC 5102 | PGC046674 | 200.4875 | 36.6297 | 3.740.39 (3) | 464 (12) | HI | Sa |
| KK 197 | PGC046680 | 200.5086 | 42.5359 | 3.840.04 (1) | 643 (7) | stars | dSph |
| KKs 55 | PGC2815822 | 200.5500 | 42.7311 | 3.850.07(1) | 530 (7) | stars | Sph |
| dw1322-39 | 200.6336 | 39.9060 | 2.950.05 (10) | 656 (7) | stars | dIrr | |
| dw1323-40b | 200.9809 | 40.8361 | 3.910.61 (10) | 497 (7) | stars | dSph | |
| dw1323-40a | 201.2233 | 40.7612 | 3.730.15 (10) | 450 (7) | stars | dSph | |
| Cen A | PGC046957 | 201.3667 | 43.0167 | 3.680.05 (1) | 55610 (4) | HI | S00 |
| KK 203 | PGC166167 | 201.8681 | 45.3524 | 3.780.25 (3) | 306 (7) | stars | Tr |
| ESO 324-024 | PGC047171 | 201.9042 | 41.4806 | 3.780.09 (1) | 514 (12) | HI | Sdm |
| NGC 5206 | PGC047762 | 203.4292 | 48.1511 | 3.210.01 (1) | 583 (13) | stars | S0- |
| NGC 5237 | PGC048139 | 204.4083 | 42.8475 | 3.330.02 (1) | 361 (4) | HI | BCD |
| NGC 5253 | PGC048334 | 204.9792 | 31.6400 | 3.550.03 (3) | 407 (4) | HI | Sdm |
| dw1341-43 | 205.4032 | 43.8553 | 3.530.04 (10) | 636 (7) | stars | dSph | |
| KKs 57 | PGC2815823 | 205.4079 | 42.5797 | 3.840.47 (1) | 511 (7) | stars | Sph |
| KK 211 | PGC048515 | 205.5208 | 45.2050 | 3.680.14 (1) | 600 (14) | stars | Sph |
| dw1342-43 | 205.6837 | 43.2548 | 2.900.14 (10) | 510 (7) | stars | Tr | |
| ESO 325-011 | PGC048738 | 206.2500 | 41.8589 | 3.400.05 (1) | 544 (15) | HI | dIrr |
| KKs 58 | PGC2815824 | 206.5031 | 36.3289 | 3.360.10 (10) | 477 (7) | stars | dSph |
| KK 221 | PGC166179 | 207.1917 | 46.9974 | 3.820.07 (1) | 507 (14) | stars | dIrr |
| ESO 383-087 | PGC049050 | 207.3250 | 36.0614 | 3.190.03 (1) | 326 (4) | HI | Sdm |
| ESO174-001/KKs 57 | PGC048937 | 206.9920 | 53.3476 | 3.68* | 686 (15) | HI | dIrr |
Cen A – the central galaxy of the Centaurus group – is one of the best studied nearby galaxies beyond the Local Group. To date, 27 dwarf satellites of Cen A have both accurate distances and velocity measurements. The line-of-sight velocities were measured using two different techniques: emission lines from atomic and/or ionized gas for star forming galaxies (e.g. Koribalski et al. 2004) or absorption line spectroscopy of the stars (e.g. Puzia & Sharina 2008, Müller et al. 2020). The distances come from tip of the red giant branch (TRGB) measurements based on HST programs (Karachentsev et al., 2007) and our VLT program (Müller et al., 2019). An additional dwarf galaxy (ESO174-001) has a velocity measurement, but no accurate distance estimate. As we are mainly focusing on the motion of satellites, we include this dwarf in our sample, for a grand total of 28 satellites. All galaxies used in the analysis are presented in Table 1.
There are 13 more dwarfs around Cen A which have TRGB measurements (e.g., Crnojević et al. 2019), but lack the velocities necessary to study the kinematics of the satellite system. More than 30 additional candidates (Müller et al., 2015, 2017a; Taylor et al., 2018) await membership confirmation.
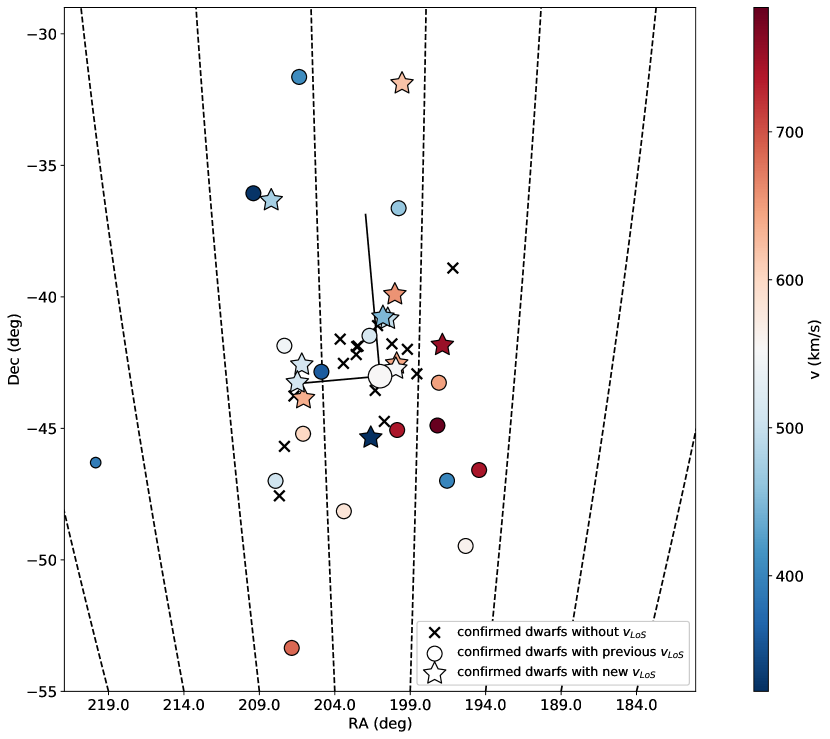
Figure 1 shows the on-sky distribution and line-of-sight velocities of the 28 satellites with respect to Cen A. If the co-rotating satellite system suggested by Müller et al. (2018a) is a real physical structure, then the dwarfs to the north of Cen A should be blue-shifted, while the dwarfs to the south should be red-shifted. This is the case for 21 out of 28 of the dwarf satellites.
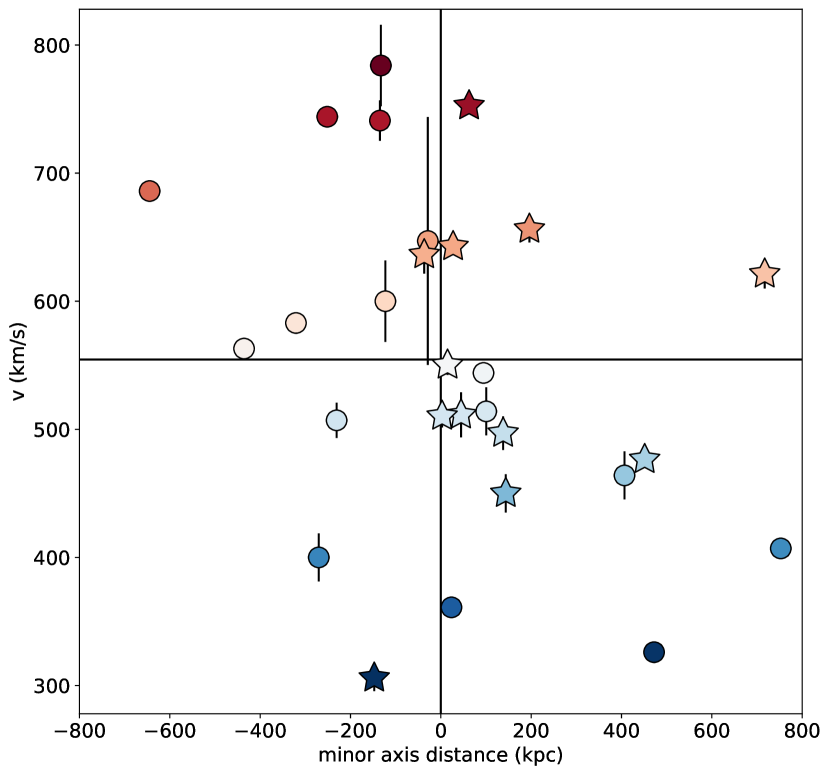
Figure 2 presents the position-velocity diagram for the dwarf galaxies around Cen A. For convenience, we assign positive and negative separations from Cen A to the Northern and Southern satellites, respectively, adopting a separating line with a position angle and the mean velocity of the group of km s-1. This position angle corresponds to the geometric minor axis of the 28 satellite galaxies studied in this work. If the satellite system has significant rotational support with all the members having near-circular orbits and sharing the same orbital motion, we would expect them to populate two opposing quadrants in the position-velocity diagram. On the other hand, a pressure-supported system would fill all four quadrants equally. Figure 2 clearly favors the former case: out of 28 galaxies, 21 lie in two opposing quadrants.
If we assume that this signal arises by chance and calculate its probability via the binomial coefficient, the probability of finding exactly 21 out of 28 galaxies in opposing quadrants is %, while the one of finding 21 or more out of 28 is %. For comparison, Müller et al. (2018a) found 14 out of 16 satellites in opposing quadrants yielding a probability of % or %. Thus, the statistical significance of a kinematic signal has nearly stayed the same after almost doubling the sample size. Therefore, it is likely that a rotational component is present in the satellite system – even though 5 of the new data points are not following this pattern. Two of the latter lie in the inner region of the system, where the line-of-sight velocities are less likely to indicate the orbital direction if the satellites follow non-circular orbits.
3 Comparison to cosmological expectations
The high degree of kinematic correlation among the satellite galaxies of Cen A was shown to be rare in cosmological simulations (Müller et al., 2018a). In the hydrodynamical Illustris simulation (Vogelsberger et al., 2014), only 0.5 per cent of mock-observed satellite systems around hosts of similar virial mass as Cen A were both as flattened and kinematically correlated. For the dark-matter-only Millennium-II simulation (Boylan-Kolchin et al., 2009), the frequency of analogs to the Cen A satellite system was even lower: only 0.1 per cent. Here we update these comparisons adding our new data to determine whether the tension with cosmological expectations remains or is alleviated given the more comprehensive observational picture.
We base our comparison on the IllustrisTNG project, specifically the TNG100-1 run (e.g., Springel et al., 2018; Pillepich et al., 2018). IllustrisTNG expands the original Illustris simulations by refining the implemented physics. The adopted cosmological parameters are consistent with a Planck cosmology (Planck Collaboration et al., 2016). The simulations box size (), and resolution (dark matter particle mass for the hydrodynamical run) provides a good compromise between the number of hosts and the number of resolved satellites. We use the publicly available redshift zero galaxy catalogs (Nelson et al., 2019). By using both the hydrodynamical and the equivalent dark-matter-only (DMO) run we can directly determine whether baryonic physics (as implemented in the simulation) affects the planes-of-satellites issue.
3.1 Simulated Cen A analogs and mock satellite systems
We select Cen A analog host galaxies by a mass and isolation criterion. The simulated host halos are required to have a virial mass between and . This is identical to the mass range of Cen A analogs in Müller et al. (2018a). We require each host to be isolated by rejecting any potential hosts which contain a second halo with virial mass within 1.2 Mpc radius, motivated by the distance of Cen A to M 83, the second major galaxy in the Centaurus group. For each host we identify all (subhalo) galaxies within 800 kpc as possible satellites, comparable to the distance range of observed satellites (see Fig. 2). Note that we only select by this volume and do not require the possible satellites to be bound to their host, since no such selection was made on the observational data either. Finally, to exclude cases of possible ongoing major mergers, we reject all hosts which have a satellite whose stellar mass exceeds of the host galaxy stellar mass, as these would not resemble the observed Cen A system. For the DMO run, the latter criterion is applied to the virial masses, though a smaller number of hosts is rejected in this case since dark matter mass is more easily stripped and thus reduced faster after infall. These criteria result in 180 Cen A analogs from the hydrodynamical TNG100 run and 307 from the the DMO run.
In the DMO run the satellites of a given host are ranked by their dark matter mass. In the hydrodynamical run the satellites are ranked by their stellar mass first, and then by their dark matter mass for those subhalos that do not contain stellar particles. We allow the inclusion of such dark satellites to ensure a large sample of satellite systems with a sufficient number of satellites to compare to the observed situation, as was also done for MW analogs in Pawlowski & Kroupa (2020). It is safe to assume that the presence or absence of stars in subhalos of dwarf-galaxy scale does not strongly affect the subhalo position and motion, given the dynamical dominance of the dark matter component. While this ensures a meaningful test of cosmological predictions, it could be improved upon in the future by comparisons with dedicated, higher-resolution zoom simulations of Cen A analogs.
We mock-observe each satellite system by placing the host at a distance of 3.68 Mpc, projecting the satellites on the sky in angular coordinates relative to the host and calculating the line-of-sight velocity component of each satellite. Satellites are then selected in order from the ranked list requiring them to be between and from the host. For a comparison to the extended data set presented in this study we require 28 satellites to be selected. For each of the 180 hosts identified in the hydrodynamic TNG100 simulation, this process is repeated for ten different random viewing directions. We obtain 1763 mock-observed systems, because for 37 realizations there were less than 28 simulated satellites within the mock-observed volume around their host. For the DMO run, we have 307 hosts and 3070 mock-observed realizations.
We checked that the selected mock satellite systems have a radial root-mean-square (rms) distribution in angular coordinates on the sky that is consistent with that of the observed Cen A system. For the 28 observed satellites, we find a rms radial distance from the position of Cen A of with the uncertainty determined by bootstrapping. From the hydrodynamical run, the average and standard deviation of the simulated systems with 28 satellites is . The DMO run tends to result in slightly more radially extended satellite systems, with an average and standard deviation of . This has a couple of reasons. The combined effect of a steeper inner density profile due to a disk, less mass loss due to tides, and a larger dynamical friction means that halos have more concentrated satellite distributions in hydrodynamical than DMO simulations (Libeskind et al., 2010).
3.2 Frequency of Cen A analogs in simulations
As in Müller et al. (2018a), we decide to be conservative and consider only the on-sky distribution of the simulated satellite systems and their line-of-sight velocity components. For each mock-observed system, we find the major axis of the on-sky satellite distribution and measure the rms flattening perpendicular to this direction (the minor to major axis ratio ). We also count the number of satellite galaxies with coherent line-of-sight velocities along the major axis (i.e., consistently redshifted or blueshifted with respect to the central halo) by dividing the on-sky satellite distribution along the minor axis. For the observed Cen A system, this yields an on-sky flattening of and . A slightly larger number might be found for a different orientation of the dividing line, but to ensure an unbiased comparisons to the simulations we opt to define the orientation using only spatial information.
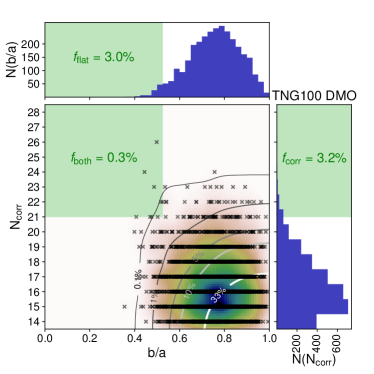
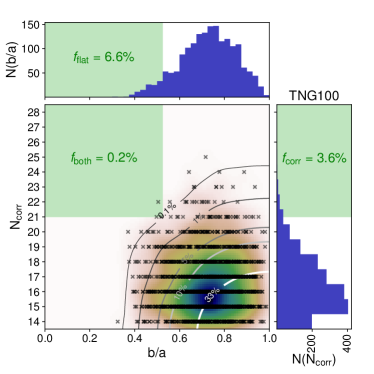
The results of our comparison for the full sample of 28 satellites is shown in Fig. 3. Taking the frequency that both the kinematic coherence and flattening is as extreme or more as the observed Cen A satellite population (measured as ), we find that only % of the DMO mock systems (8 out of 3070 realizations), and % of the hydrodynamic mock systems (3 out of 1763 realizations) are as extreme or more as the Cen A system. Thus, the inclusion of baryon physics does not alleviate the plane-of-satellites problem for Cen A. Even though the fraction of correlated satellites has dropped compared to the earlier study the significance or rarity of this occurring in cosmological simulations remains unchanged, since we are probing a larger fraction of the total satellite population.
The fraction of simulated systems which are at least as kinematically correlated as observed is consistent between the DMO and hydrodynamical runs (3.2 versus 3.6%). However, the DMO run has a smaller frequency of similarly flattened satellite systems (%) than the hydrodynamic run (%). We suspect this is related to the slightly less compact radial distribution in the DMO run, as it has been found that more compact satellite systems tend to result in more flattened distributions (Pawlowski et al., 2019).
For the previous analysis, we have taken the 28 brightest (or most massive in the DMO simulation) subhalos to compare our observations to. Does this ranked selection of subhalos bias the results? To assess this, we have repeated our analysis on the TNG-100 simulation, considering the hydrodynamical run. Instead of selecting the 28 brightest subhalos, we selected the 40, 45, and 50 brightest subhalos and draw a random sample of 28 subhalos out of those. Finding 21 out of 28 coherently moving and flattened satellites as observed around Cen A occurs in 0.3%, 0.4%, and 0.1% of the simulated Cen A analogs, respectively. In other words, the frequency doesn’t change whether we pick the 28 brightest subhalos or draw randomly from a larger sample of subhalos. We drew the same conclusion in Müller et al. (2018a).
3.3 Properties of identified analogs
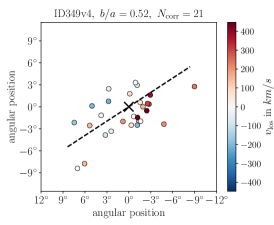
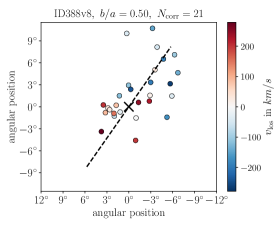
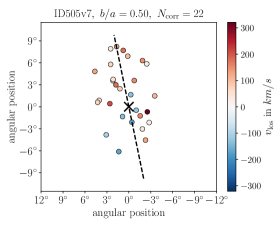
Fig. 4 shows the three mock satellite systems in the hydrodynamical Illustris TNG simulation that are at least as flattened () and have at least as many kinematically correlated satellites () as Cen A. For each of these three cases, only one out of 10 random view directions results in a match. The other nine random view directions do not simultaneously reproduce the observed spatial flattening and kinematic correlation. This suggests that planes of satellites in CDM simulations are of transient nature due to chance projections (see also Buck et al., 2016). They do not form co-rotating structures, otherwise we would expect to mock-observe a similar kinematic coherence from different directions. Therefore, the probability of having chance projections in the three nearest and best-studied satellite systems (Milky Way, Andromeda, and Cen A) appears arbitrarily small.
The central halos of the three simulated systems resembling the Cen A satellite population have varied merger histories. Two of them show quiescent growth over the last 10 Gyr, while one experienced a major merger 4 Gyr ago. The high coherence in the latter’s satellites is unlikely to result from the merger event, contrary to what was proposed by Smith et al. (2016). Most of a major merger influence would have been washed out by the stripping of participating satellites and the accretion of new satellites since (Kanehisa et al. in prep). None of these three analogs match Cen A’s reported major merger 2 Gyr ago (Wang et al., 2020).
4 Summary and conclusions
The phase-space distribution of dwarf satellite galaxies provides a key testbed for cosmological predictions on small scales. For the Cen A system it has been suggested based on 16 line-of-sight velocities (Müller et al., 2018a) that most dwarf galaxies are aligned in a co-rotating structure similar to what has been found for the MW and the Andromeda galaxy. We revisited this issue by adding 12 more satellites of Cen A, for which we acquired line-of-sight velocities using MUSE spectroscopic observations (Müller et al., 2020). This increases the sample size from 16 to 28 satellites and enhances the representation of gas-poor dwarf spheroidal galaxies.
We find that 21 out of 28 satellites show a coherent motion. This implies that the co-moving satellite system inferred around Cen A was not a statistical fluke due to the small number of tracers, but is a real phenomenon.
In the Illustris-TNG simulation, satellite systems that are at least as flattened and kinematically correlated as Cen A occur with a frequency of only 0.2 in the hydrodynamical and 0.3 in the DMO run. This indicates that the plane-of-satellites problem is independent of baryon physics. The simulated satellite systems that are consistent with the observed Cen A properties are not stable, co-rotating structures: their kinematic coherence is arising by chance projection.
In summary, we find that the additional kinematic data obtained for 12 more Cen A satellites (Müller et al., 2020) does not alleviate the tension with CDM expectations. The new velocities further support the findings of Müller et al. (2018a). The satellite system of Cen A remains a challenge for CDM.
Acknowledgements.
We thank the referee for the constructive report, which helped to clarify and improve the manuscript. O.M. is grateful to the Swiss National Science Foundation for financial support. M.S.P. and O.M. thank the DAAD for PPP grant 57512596 funded by the BMBF, and the Partenariat Hubert Curien (PHC) for PROCOPE project 44677UE. M.S.P. thanks the Klaus Tschira Stiftung gGmbH and German Scholars Organization e.V. for support via a Klaus Tschira Boost Fund. H.J. acknowledges financial support from the Australian Research Council through the Discovery Project DP150100862.References
- Banks et al. (1999) Banks, G. D., Disney, M. J., Knezek, P. M., et al. 1999, ApJ, 524, 612
- Bouchard et al. (2007) Bouchard, A., Jerjen, H., Da Costa, G. S., & Ott, J. 2007, AJ, 133, 261
- Boylan-Kolchin et al. (2009) Boylan-Kolchin, M., Springel, V., White, S. D. M., Jenkins, A., & Lemson, G. 2009, MNRAS, 398, 1150
- Buck et al. (2016) Buck, T., Dutton, A. A., & Macciò, A. V. 2016, MNRAS, 460, 4348
- Cautun et al. (2015) Cautun, M., Wang, W., Frenk, C. S., & Sawala, T. 2015, MNRAS, 449, 2576
- Crnojević et al. (2019) Crnojević, D., Sand, D. J., Bennet, P., et al. 2019, ApJ, 872, 80
- Crnojević et al. (2016) Crnojević, D., Sand, D. J., Spekkens, K., et al. 2016, ApJ, 823, 19
- Dinescu et al. (2004) Dinescu, D. I., Keeney, B. A., Majewski, S. R., & Girard, T. M. 2004, AJ, 128, 687
- Doyle et al. (2005) Doyle, M. T., Drinkwater, M. J., Rohde, D. J., et al. 2005, MNRAS, 361, 34
- Ibata et al. (2014a) Ibata, N. G., Ibata, R. A., Famaey, B., & Lewis, G. F. 2014a, Nature, 511, 563
- Ibata et al. (2015) Ibata, R. A., Famaey, B., Lewis, G. F., Ibata, N. G., & Martin, N. 2015, ApJ, 805, 67
- Ibata et al. (2014b) Ibata, R. A., Ibata, N. G., Lewis, G. F., et al. 2014b, ApJ, 784, L6
- Ibata et al. (2013) Ibata, R. A., Lewis, G. F., Conn, A. R., et al. 2013, NAT, 493, 62
- Jerjen et al. (2000a) Jerjen, H., Binggeli, B., & Freeman, K. C. 2000a, AJ, 119, 593
- Jerjen et al. (2000b) Jerjen, H., Freeman, K. C., & Binggeli, B. 2000b, AJ, 119, 166
- Karachentsev et al. (2004) Karachentsev, I. D., Karachentseva, V. E., Huchtmeier, W. K., & Makarov, D. I. 2004, AJ, 127, 2031
- Karachentsev et al. (2013) Karachentsev, I. D., Makarov, D. I., & Kaisina, E. I. 2013, AJ, 145, 101
- Karachentsev et al. (2007) Karachentsev, I. D., Tully, R. B., Dolphin, A., et al. 2007, AJ, 133, 504
- Kirby et al. (2012) Kirby, E. M., Koribalski, B., Jerjen, H., & López-Sánchez, Á. 2012, MNRAS, 420, 2924
- Koch & Grebel (2006) Koch, A. & Grebel, E. K. 2006, AJ, 131, 1405
- Koribalski et al. (2004) Koribalski, B. S., Staveley-Smith, L., Kilborn, V. A., et al. 2004, AJ, 128, 16
- Kroupa et al. (2005) Kroupa, P., Theis, C., & Boily, C. M. 2005, A&A, 431, 517
- Kunkel & Demers (1976) Kunkel, W. E. & Demers, S. 1976, in Royal Greenwich Observatory Bulletins, Vol. 182, The Galaxy and the Local Group, ed. R. J. Dickens, J. E. Perry, F. G. Smith, & I. R. King, 241
- Libeskind et al. (2019) Libeskind, N. I., Carlesi, E., Müller, O., et al. 2019, MNRAS, 490, 3786
- Libeskind et al. (2005) Libeskind, N. I., Frenk, C. S., Cole, S., et al. 2005, MNRAS, 363, 146
- Libeskind et al. (2009) Libeskind, N. I., Frenk, C. S., Cole, S., Jenkins, A., & Helly, J. C. 2009, MNRAS, 399, 550
- Libeskind et al. (2016) Libeskind, N. I., Guo, Q., Tempel, E., & Ibata, R. 2016, ApJ, 830, 121
- Libeskind et al. (2015) Libeskind, N. I., Hoffman, Y., Tully, R. B., et al. 2015, MNRAS, 452, 1052
- Libeskind et al. (2010) Libeskind, N. I., Yepes, G., Knebe, A., et al. 2010, MNRAS, 401, 1889
- Lipnicky & Chakrabarti (2017) Lipnicky, A. & Chakrabarti, S. 2017, MNRAS, 468, 1671
- Lynden-Bell (1976) Lynden-Bell, D. 1976, MNRAS, 174, 695
- Lynden-Bell (1982) Lynden-Bell, D. 1982, The Observatory, 102, 202
- McConnachie & Irwin (2006) McConnachie, A. W. & Irwin, M. J. 2006, MNRAS, 365, 902
- Metz et al. (2008) Metz, M., Kroupa, P., & Libeskind, N. I. 2008, ApJ, 680, 287
- Müller et al. (2020) Müller, O., Fahrion, K., Rejkuba, M., et al. 2020, arXiv e-prints, arXiv:2011.04990
- Müller et al. (2015) Müller, O., Jerjen, H., & Binggeli, B. 2015, A&A, 583, A79
- Müller et al. (2017a) Müller, O., Jerjen, H., & Binggeli, B. 2017a, A&A, 597, A7
- Müller et al. (2016) Müller, O., Jerjen, H., Pawlowski, M. S., & Binggeli, B. 2016, A&A, 595, A119
- Müller et al. (2018a) Müller, O., Pawlowski, M. S., Jerjen, H., & Lelli, F. 2018a, Science, 359, 534
- Müller et al. (2018b) Müller, O., Rejkuba, M., & Jerjen, H. 2018b, A&A, 615, A96
- Müller et al. (2019) Müller, O., Rejkuba, M., Pawlowski, M. S., et al. 2019, A&A, 629, A18
- Müller et al. (2017b) Müller, O., Scalera, R., Binggeli, B., & Jerjen, H. 2017b, A&A, 602, A119
- Nelson et al. (2019) Nelson, D., Springel, V., Pillepich, A., et al. 2019, Computational Astrophysics and Cosmology, 6, 2
- Pawlowski (2018) Pawlowski, M. S. 2018, Modern Physics Letters A, 33, 1830004
- Pawlowski et al. (2019) Pawlowski, M. S., Bullock, J. S., Kelley, T., & Famaey, B. 2019, ApJ, 875, 105
- Pawlowski et al. (2015) Pawlowski, M. S., Famaey, B., Merritt, D., & Kroupa, P. 2015, ApJ, 815, 19
- Pawlowski & Kroupa (2020) Pawlowski, M. S. & Kroupa, P. 2020, MNRAS, 491, 3042
- Pawlowski et al. (2012) Pawlowski, M. S., Pflamm-Altenburg, J., & Kroupa, P. 2012, MNRAS, 423, 1109
- Peterson & Caldwell (1993) Peterson, R. C. & Caldwell, N. 1993, AJ, 105, 1411
- Phillips et al. (2015) Phillips, J. I., Cooper, M. C., Bullock, J. S., & Boylan-Kolchin, M. 2015, MNRAS, 453, 3839
- Pillepich et al. (2018) Pillepich, A., Nelson, D., Hernquist, L., et al. 2018, MNRAS, 475, 648
- Planck Collaboration et al. (2016) Planck Collaboration, Ade, P. A. R., Aghanim, N., et al. 2016, A&A, 594, A13
- Puzia & Sharina (2008) Puzia, T. H. & Sharina, M. E. 2008, ApJ, 674, 909
- Samuel et al. (2020) Samuel, J., Wetzel, A., Chapman, S., et al. 2020, arXiv e-prints, arXiv:2010.08571
- Santos-Santos et al. (2020) Santos-Santos, I., Dominguez-Tenreiro, R., Artal, H., et al. 2020, arXiv e-prints, arXiv:2004.11585
- Saviane & Jerjen (2007) Saviane, I. & Jerjen, H. 2007, AJ, 133, 1756
- Sawala et al. (2016) Sawala, T., Frenk, C. S., Fattahi, A., et al. 2016, MNRAS, 457, 1931
- Smith et al. (2016) Smith, R., Duc, P. A., Bournaud, F., & Yi, S. K. 2016, ApJ, 818, 11
- Sohn et al. (2017) Sohn, S. T., Patel, E., Besla, G., et al. 2017, ApJ, 849, 93
- Sohn et al. (2020) Sohn, S. T., Patel, E., Fardal, M. A., et al. 2020, arXiv e-prints, arXiv:2008.06055
- Springel et al. (2018) Springel, V., Pakmor, R., Pillepich, A., et al. 2018, MNRAS, 475, 676
- Springel et al. (2005) Springel, V., White, S. D. M., Jenkins, A., et al. 2005, Nature, 435, 629
- Taylor et al. (2018) Taylor, M. A., Eigenthaler, P., Puzia, T. H., et al. 2018, ApJ, 867, L15
- Tully et al. (2015) Tully, R. B., Libeskind, N. I., Karachentsev, I. D., et al. 2015, ApJ, 802, L25
- Tully et al. (2008) Tully, R. B., Shaya, E. J., Karachentsev, I. D., et al. 2008, ApJ, 676, 184
- Vogelsberger et al. (2014) Vogelsberger, M., Genel, S., Springel, V., et al. 2014, MNRAS, 444, 1518
- Wang et al. (2020) Wang, J., Hammer, F., Rejkuba, M., Crnojević, D., & Yang, Y. 2020, MNRAS, 498, 2766
- Zentner et al. (2005) Zentner, A. R., Kravtsov, A. V., Gnedin, O. Y., & Klypin, A. A. 2005, ApJ, 629, 219