11email: sabina.ustamujic@inaf.it 22institutetext: Dipartimento di Fisica e Chimica E. Segrè, Università di Palermo, Via Archirafi 36, 90123 Palermo, Italy 33institutetext: INAF/IASF Palermo, Via Ugo La Malfa 153, I-90146 Palermo, Italy
Modeling the mixed-morphology supernova remnant IC 443
Abstract
Context. The morphology and the distribution of material observed in supernova remnants (SNRs) reflect the interaction of the supernova (SN) blast wave with the ambient environment, the physical processes associated with the SN explosion and the internal structure of the progenitor star. IC 443 is a mixed-morphology (MM) SNR located in a quite complex environment: it interacts with a molecular cloud in the northwestern and southeastern areas and with an atomic cloud in the northeast.
Aims. In this work we aim at investigating the origin of the complex morphology and multi-thermal X-ray emission observed in SNR IC 443, through the study of the effect of the inhomogeneous ambient medium in shaping its observed structure, and the exploration of the main parameters characterizing the remnant.
Methods. We developed a 3D hydrodynamic (HD) model for IC 443, which describes the interaction of the SNR with the environment, parametrized in agreement with the results of the multi-wavelength data analysis. We performed an ample exploration of the parameter space describing the initial blast wave and the environment, including the mass of the ejecta, the energy and position of the explosion, and the density, structure and geometry of the surrounding clouds. From the simulations, we synthesized the X-ray emission maps and spectra and compared them with actual X-ray data collected by XMM-Newton.
Results. Our model explains the origin of the complex X-ray morphology of SNR IC 443 in a natural way, being able to reproduce, for the first time, most of the observed features, including the centrally-peaked X-ray morphology (characteristic of MM SNRs) when considering the origin of the explosion at the position where the pulsar wind nebula (PWN) CXOU J061705.3+222127 was at the time of the explosion. In the model which best reproduces the observations, the mass of the ejecta and the energy of the explosion are and erg, respectively. From the exploration of the parameter space, we found that the density of the clouds is cm-3 and that the age of SNR IC 443 is yr.
Conclusions. The observed inhomogeneous ambient medium is the main responsible for the complex structure and the X-ray morphology of SNR IC 443, resulting in a very asymmetric distribution of the ejecta due to the off-centered location of the explosion inside the cavity formed by the clouds. It is argued that the centrally peaked morphology (typical of MMSNRs) is a natural consequence of the interaction with the complex environment. A combination of high resolution X-ray observations and accurate 3D HD modelling is needed to confirm if this scenario is applicable to other MMSNRs.
Key Words.:
hydrodynamics – ISM: supernova remnants – X-rays: ISM – ISM: individual objects: IC 443 – pulsars: individual: CXOU J061705.3+2221271 Introduction
Supernova remnants (SNRs) are diffuse expanding nebulae that result from a supernova (SN) explosion in which a star ejects violently most of its mass. The ejected material expands from the explosion, interacting with the circumstellar/interstellar medium (CSM/ISM), resulting in a rather complex morphology that reflects the interaction of the SN with the CSM/ISM, but also the asymmetries developed during the SN explosion and the nature of the progenitor star. The SNR IC 443 is one of the best examples of a SNR interacting with a very complex environment, which is made of molecular and atomic clouds (Cornett et al. 1977; Burton et al. 1988; Rho et al. 2001; Su et al. 2014).
IC 443 belongs to the class of mixed-morphology SNR (MMSNR, Rho & Petre 1998), showing shell-like morphology in the radio band and centrally filled thermal X-ray emission. The majority of MMSNRs are interacting with dense molecular clouds, and nearly half of them have been observed in -rays (Slane et al. 2015). The physical origin of the peculiar morphology of MMSNRs is still an open issue. Petruk (2001) stated that this morphology could be due to the nonuniform ambient medium where the SN exploded. Traditional models invoke the effects of thermal conduction which induce the evaporation of the dense clouds shocked by the SNRs and the cooling of the ejecta interacting with the clouds (e.g. White & Long 1991; Cox et al. 1999; Shelton et al. 1999; Zhou et al. 2011; Okon et al. 2020), though they typically do not consider the role of the ejecta X-ray emission, that is important in many cases (Lazarian 2006; Bocchino et al. 2009). On the other hand, alternative cooling processes suggest that the overionization of the ejecta is due to their rapid free expansion that follows their early heating in case of interaction with dense clouds (e.g. Miceli et al. 2010; Zhou et al. 2011; Yamaguchi et al. 2018; Greco et al. 2018). It is therefore important to carefully model the evolution of MMSNRs, by describing in detail their interaction with the complex environment.
IC 443 (G189.1+3.0) has a diameter of arcmin and belongs to the GEM OB1 association at a distance of 1.5 kpc (Petre et al. 1988; Welsh & Sallmen 2003). It appears to consist of two interconnected quasi-spherical subshells of different radii and centroids, that define the usually assumed boundaries of IC 443 (Braun & Strom 1986). The remnant age is still uncertain; proposed age for SNR IC 443 varies from kyr (Troja et al. 2008) to kyr (Chevalier 1999; Bykov et al. 2008).
Several works have investigated the physical and chemical properties of IC 443 through radio (Leahy 2004; Lee et al. 2008, 2012), infrared (Rho et al. 2001; Su et al. 2014), X-ray (Troja et al. 2006, 2008; Greco et al. 2018) and -ray (Tavani et al. 2010; Abdo et al. 2010) observations. IC 443 interacts with a molecular cloud in the northwestern (NW) and southeastern (SE) areas, and with an atomic cloud in the northeast (NE). The dense molecular cloud was first identified by Cornett et al. (1977), and lies in the foreground of IC 443 forming a semi-toroidal structure (Burton et al. 1988; Troja et al. 2006; Su et al. 2014). In the NE the remnant is confined by the atomic H I cloud, discovered by Denoyer (1978), which is well traced by optical, infrared and very soft X-ray emission (see Troja et al. 2006). The X-ray emission from IC 443 is composed of extended thermal X-ray emission and a number of isolated hard X-ray sources whose emission includes both thermal and non-thermal components (e.g. Petre et al. 1988; Bocchino & Bykov 2000, 2003; Bocchino et al. 2008). The latter could be a product of the SNR ejecta (or the pulsar wind nebula; PWN) and the surrounding shocked molecular clumps (see Zhang et al. 2018, and references therein). The gamma-ray emission from IC 443 seems to be associated with the interaction of cosmic rays accelerated at the shock front and the nearby molecular clouds (Tavani et al. 2010; Abdo et al. 2010). The remnant shows a great diversity and superposition of shocks which may be a natural result of the shock–cloud interactions in a clumpy interstellar medium (Snell et al. 2005; Shinn et al. 2011). Indications for the presence of overionized plasma have also been found (Yamaguchi et al. 2009; Matsumura et al. 2017; Greco et al. 2018), whose origin is still under debate.
The available evidence implies that the SNR shock has encountered a pre-existing high density shell. Troja et al. (2008) suggested that SNR IC 443 has evolved inside a preexisting wind blown bubble, which likely originated from the massive progenitor star of the remnant (probably related to the PWN CXOU J061705.3+222127). The plerion nebula, discovered by Chandra (Olbert et al. 2001) and studied by several authors (e.g. Bocchino et al. 2001; Gaensler et al. 2006; Swartz et al. 2015), is situated in the southern part of the remnant, but its association with IC 443 is still debated considering its off-center position. Recently, Greco et al. (2018) detected a Mg-rich jet-like structure in the NW area of IC 443 close to the molecular cloud. Interestingly, the jet emission is mainly due to overionized plasma and its projection towards the remnant interior crosses the position of the neutron star at the time of the explosion of the progenitor star. This strongly suggests that the PWN belongs to IC 443 and that the collimated jet has been produced by the exploding star.
Here, we investigate the origin of the complex structure and of the multi-thermal X-ray emission of SNR IC 443 as well as the effects of the inhomogeneous medium in shaping the observed morphology. To this end, we modeled the expansion of the SNR and its interaction with the surrounding environment, parametrized in agreement with the results of the multi-wavelength data analysis. From the simulations we synthesized the thermal X-ray emission and compared it with observations.
The paper is organized as follows. In Sect. 2 we describe the model, the numerical setup, and the synthesis of the thermal X-ray emission; in Sect. 3 we discuss the results; and in Sect. 4 we draw our conclusions.
2 Hydrodynamic model
We developed a three-dimensional (3D) hydrodynamic (HD) model for SNR IC 443, which describes the expansion of the SNR and its interaction with the surrounding CSM/ISM. We followed the evolution of the SNR for yr by numerically solving the full time-dependent HD equations in a 3D Cartesian coordinate system , including the effects of the radiative losses from optically thin plasma. The HD equations were solved in the conservative form
| (1) |
| (2) |
| (3) |
where is the total gas energy (internal energy , and kinetic energy) per unit mass, is the time, is the mass density, is the mean atomic mass of positive ions (assuming cosmic abundances), is the mass of the hydrogen atom, is the hydrogen number density, is the gas velocity, is the temperature, and represents the optically thin radiative losses per unit emission measure derived with the PINTofALE spectral code (Kashyap & Drake 2000) and with the APED V1.3 atomic line database (Smith et al. 2001), assuming solar abundances. We used the ideal gas law, , where is the adiabatic index.
The calculations were performed using PLUTO (Mignone et al. 2007), a modular Godunov-type code for astrophysical plasmas. The code provides a multiphysics, multialgorithm modular environment particularly oriented towards the treatment of astrophysical high Mach number flows in multiple spatial dimensions. The code was designed to make efficient use of massive parallel computers using the message-passing interface (MPI) library for interprocessor communications. The HD equations are solved using the HD module available in PLUTO; the integration is performed using the original Piecewise Parabolic Method (PPM) reconstruction by Colella & Woodward (1984, see also ) with a Roe Riemann solver. The adopted scheme is particularly appropriate for describing the shocks formed during the interaction of the remnant with the surrounding inhomogeneous medium, as in our case. A monotonized central difference limiter (the least diffusive limiter available in PLUTO) for the primitive variables is used. PLUTO includes optically thin radiative losses in a fractional step formalism (Mignone et al. 2007), which preserves the second time accuracy, as the advection and source steps are at least second-order accurate; the radiative losses ( values) are computed at the temperature of interest using a table lookup/interpolation method. The code was extended by additional computational modules to evaluate the deviations from equilibrium of ionization of the most abundant ions (through the computation of the maximum ionization age in each cell of the spatial domain as described in Orlando et al. 2015), and the deviations from temperature-equilibration between electrons and ions. For the latter, we included the almost instantaneous heating of electrons at shock fronts up to keV by lower hybrid waves (see Ghavamian et al. 2007), and the effects of Coulomb collisions for the calculation of ion and electron temperatures in the post-shock plasma (see Orlando et al. 2015, for further details).
2.1 Numerical setup
The initial conditions consist of a spherically symmetric distribution of ejecta, representing the remnant of the SN explosion at the age of years, which expands through a highly inhomogeneous ISM. At this stage the energy of the SNR is almost entirely kinetic, being the internal energy only a small percentage of the total energy. Given the lack of knowledge about the progenitor of SNR IC 443, we explored values in the ranges for the mass of the ejecta and erg for the energy of the explosion. The radial density profile of the ejecta is described by two power law segments ( on the inside and on the outside), following the density distribution in a core-collapse SN as described by Chevalier (2005). For our favourite model, we use and 111This value is consistent with a supernova from a progenitor red supergiant (see Table 4 in Matzner & McKee 1999). (see Chevalier 2005) leading to an explosion energy of erg and an ejecta mass of . The initial pressure of the ejecta is uniform, while the temperature is the lowest at the center of the initial remnant ( K) and the highest in the outermost layers ( K), following the inverse of the radial profile of density. The initial velocity of the ejecta increases linearly with the radial distance from zero, at the center of the remnant, up to cm s-1 at 1 pc, namely the initial radius of the remnant.
The initial remnant is immersed in a highly inhomogeneous ambient environment. We follow the two-shells model proposed by Troja et al. (2006) to explain the IC 443 morphology (see Fig. 9, Troja et al. 2006). The medium consists of a toroidal molecular cloud and an spherical cap on the top representing the atomic cloud. In Figure 1 we present a schematic view of the environment adopted as initial conditions.
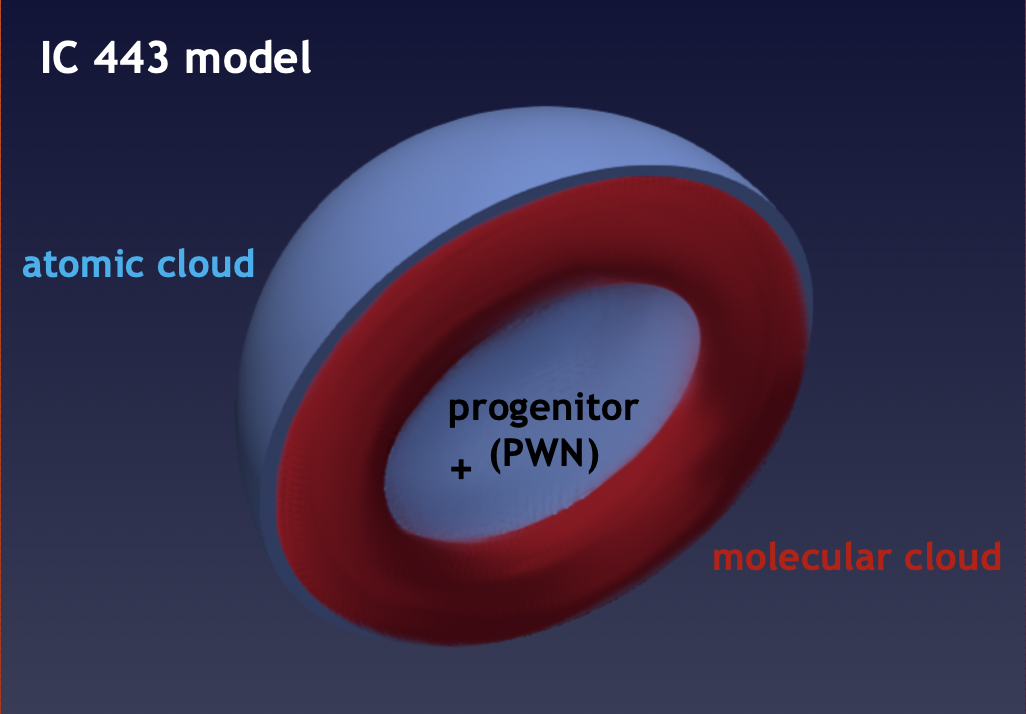
The toroidal molecular cloud is azimuthally symmetric about the -axis, centered at the origin of the 3D Cartesian coordinate system . The dimensions of the clouds were chosen following the results of multi-wavelength data analysis (Rho et al. 2001; Troja et al. 2006, 2008; Lee et al. 2012; Su et al. 2014; Greco et al. 2018). The radius of the torus (i.e., the distance from the origin to the center of the tube) is 10 pc, while the radius of the tube is 2.6 pc. The atomic cloud is described as a spherical cap of radius 8 pc centered on the origin, confining the remnant on the positive direction of the -axis.
The clouds play a central role in modifying the expansion of the forward shock and in driving a reverse shock through the ejecta. Since the geometry and density distribution adopted in the paper are idealized, this may introduce some artifacts in the remnant structure if the clouds are assumed to be uniform. On the other side, a clumpy structure of the clouds is expected and often originates from highly compressible turbulence. Thus we adopted a simplistic approach to the treatment of small-scale inhomogeneities in the clouds, since we are not interested in studying in detail the effect of turbulence (as done by Zhang & Chevalier 2019). In order to get a non-uniform morphology and density distribution for the clouds, the material is modeled as a set of spherical clumps with radius 0.9 pc randomly distributed, filled with spherical sub-clumps of radius 0.3 pc. For the sake of simplicity, the clouds were defined without considering any velocity fluctuations (which would be anyway much smaller than the shock velocity at the time when the remnant starts to interact with the clouds) and assuming pressure equilibrium among the clumps. For the average density we explored values in the range cm-3 and cm-3 for the atomic and molecular clouds respectively, in good agreement with the values derived by Rho et al. (2001) from observations, namely cm-3 in the northeastern rim and cm-3 in the southern molecular ridge. The density of the plasma in the spheres follows a normal distribution for both the atomic and the molecular clouds; in our favourite model the mean density is cm-3 and cm-3 respectively. The inter-cloud medium is assumed to be uniform with density cm-3 and temperature K. The temperatures of the molecular and atomic clouds are set in order to be in pressure equilibrium with the inter-cloud component. The clouds and the inter-cloud medium are defined without considering any bulk velocity, which would be anyway much smaller than the velocity of the forward shock.
We explored different positions for the explosion (ranging between the geometric center of the cavity formed by the clouds and the very off-centered position of PWN CXOU J061705.3+222127 suspected to be the compact remnant of the SN) to derive the case that best reproduces the observations. We considered an offset along the -axis, i.e., the origin of the explosion is , with varying in the range pc. The case corresponds to an explosion centered in the cavity formed by the surrounding clouds (see Fig. 1). Our favourite model, namely the case that best reproduces the observations, is for pc, that corresponds to the position of PWN CXOU J061705.3+222127 at the time of the explosion (as inferred by Greco et al. 2018, taking into account the proper motion of the neutron star).
Table 1 summarizes the parameter space with the corresponding range of values explored, selected according to the values reported in the literature. Given the large number of parameters to be explored, we adopted an educated exploration of the parameter space by starting from a set of initial parameters (e.g. the SN explosion located at the geometric center of the clouds) and by performing an iterative process of trial and error to converge on a set of model parameters that reproduces the main features of X-ray observations of IC 443. The values of the model which best reproduce the data are outlined in the last column of Table 1.
The simulations include passive tracers to follow the evolution of the different plasma components (ejecta - ej - and atomic/molecular clouds; see Fig. 1), and to store information on the shocked plasma (time, shock velocity, and shock position, i.e., Lagrangian coordinates, when a cell of the mesh is shocked by either the forward or the reverse shock) required to synthesize the thermal X-ray emission (see Sect. 2.2). The continuity equations of the tracers are solved in addition to our set of HD equations. In the case of tracers associated with the different plasma components, each material is initialized with , while elsewhere, where the index refers to the material in the ejecta, in the atomic cloud and in the molecular cloud. All the other tracers are initialized to zero everywhere.
The computational domain is a Cartesian box extending for pc in the and directions, and for pc in the direction. The box is covered by a uniform grid of zones, leading to a spatial resolution of pc. In this way, the initial remnant is covered by grid zones. We imposed outflow boundary conditions at all the boundaries.
| Parameters | Units | Range explored | Best model |
|---|---|---|---|
| () | |||
| (erg) | |||
| (pc) | |||
| (cm-3) | |||
| (cm-3) |
2.2 Synthesis of X-ray emission
We synthesized thermal X-ray emission from the model results, following the approach outlined in Orlando et al. (2015). Here we summarize the main steps of this approach (see Sect. 2.3 in Orlando et al. 2015 for more details; see also Orlando et al. 2009; Drake & Orlando 2010).
First, we rotated the system 10º about the -axis, 60º about the -axis, and 28º about the -axis to fit the orientation of the toroidal structure with respect to the line of sight (LoS) found from the analysis of observational data (Troja et al. 2006, 2008). For each cell of the 3D domain we derived the following: (a) the emission measure as (where is the hydrogen density and is the volume of the emitting plasma; we assume fully ionized plasma); (b) the ionization age where is the time since the plasma in the domain cell was shocked; and (c) the electron temperature , calculated from the ion temperature, plasma density, and , by assuming Coulomb collisions and starting from an electron temperature at the shock front keV, which is assumed to be the same at any time as a result of instantaneous heating by lower hybrid waves (Ghavamian et al. 2007; see also Orlando et al. 2015, for further details). In calculations of the electron heating and ionization timescale, the forward and reverse shocks are treated in the same way. From the values of emission measure, maximum ionization age, and electron temperature derived, we synthesized the X-ray emission in the soft [] keV and hard [] keV bands using the non-equilibrium of ionization (NEI) emission model VPSHOCK available in the XSPEC package along with the NEI atomic data from ATOMDB 3.0 (Smith et al. 2001).
We assumed a distance of 1.5 kpc to the source (Welsh & Sallmen 2003), and an interstellar column density cm-2 (Troja et al. 2006). We assumed solar abundances for the ISM/CSM. As for the ejecta, we synthesized the X-ray emission by assuming the following set of abundances: O/O⊙=6, Ne/Ne⊙=7.5, Mg/Mg⊙=7.5, Si/Si⊙=8, S/S⊙=8, Fe/Fe⊙=2.5, solar abundances elsewhere. It is typically difficult to get reliable estimates of the absolute abundances from the analysis of X-ray spectra (see Greco et al. 2020, and references therein), while relative abundances are much more robust. Our relative abundances are in agreement with those derived by Troja et al. (2006, 2008) from the analysis of XMM-Newton observations (absolute abundances are a factor higher, see “region 6” in Troja et al. 2006 and “region IN” in Troja et al. 2008). We calculated the total X-ray emission in each cell and integrated along the LoS, and in selected spatial regions for the synthetic spectra. We then folded the resulting emission through the instrumental response of XMM-Newton/EPIC MOS2 camera.
We also derived the distribution of emission measure vs. temperature, , in the temperature range K. The distribution is an important source of information on the plasma components with different temperature contributing to the emission and is very useful in order to compare model results with observations. From the 3D spatial distributions of and , we derive the for the computational domain as a whole or for part of it: we consider the temperature range K divided into 80 equidistant bins in log ; the total in each temperature bin is obtained by summing the emission measure of all the fluid elements corresponding to the same temperature bin.
3 Results
3.1 Hydrodynamic evolution
We followed the evolution of the SNR for approximately 10000 yr, starting yr after the explosion. We described the initial blast wave and the environment by performing a wide exploration of the parameter space, including the mass of the ejecta, the energy and origin of the explosion, and the density of the clouds (see Table 1). Here we present in detail the results for our best model, namely the case that best reproduces the observations of SNR IC 443, and discuss the exploration of the parameter space.
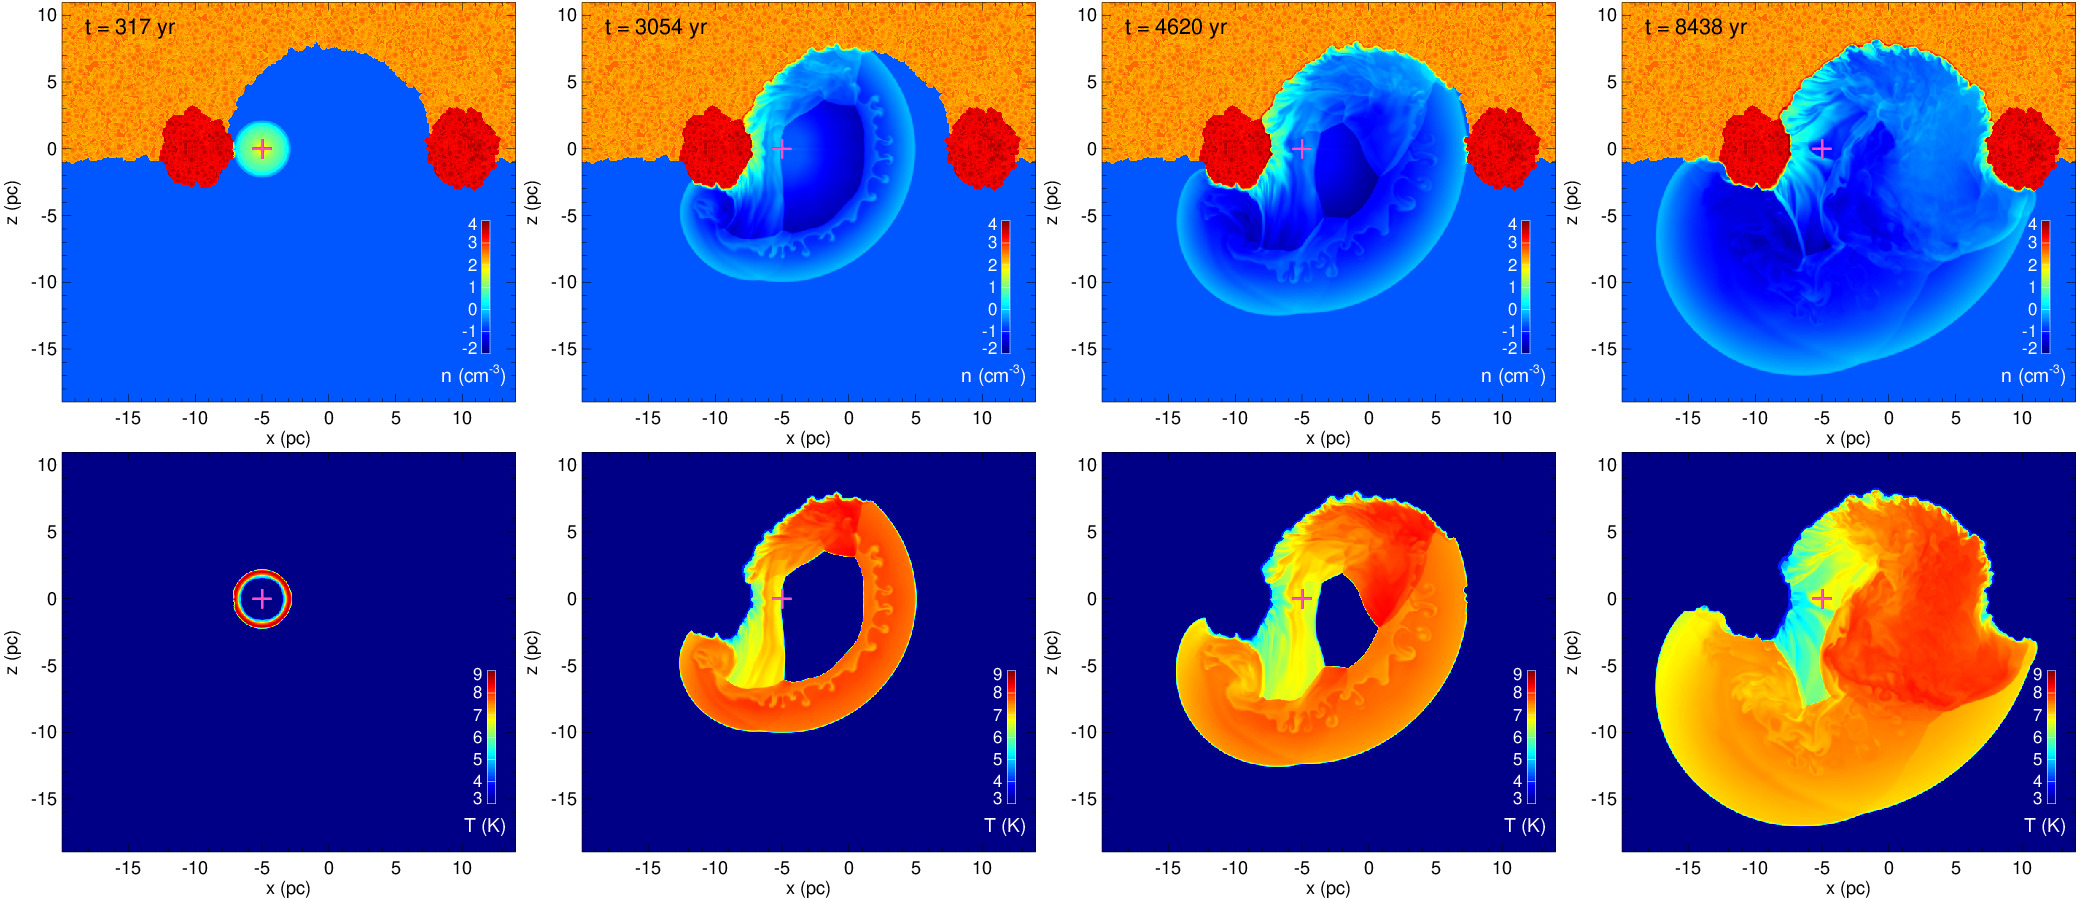
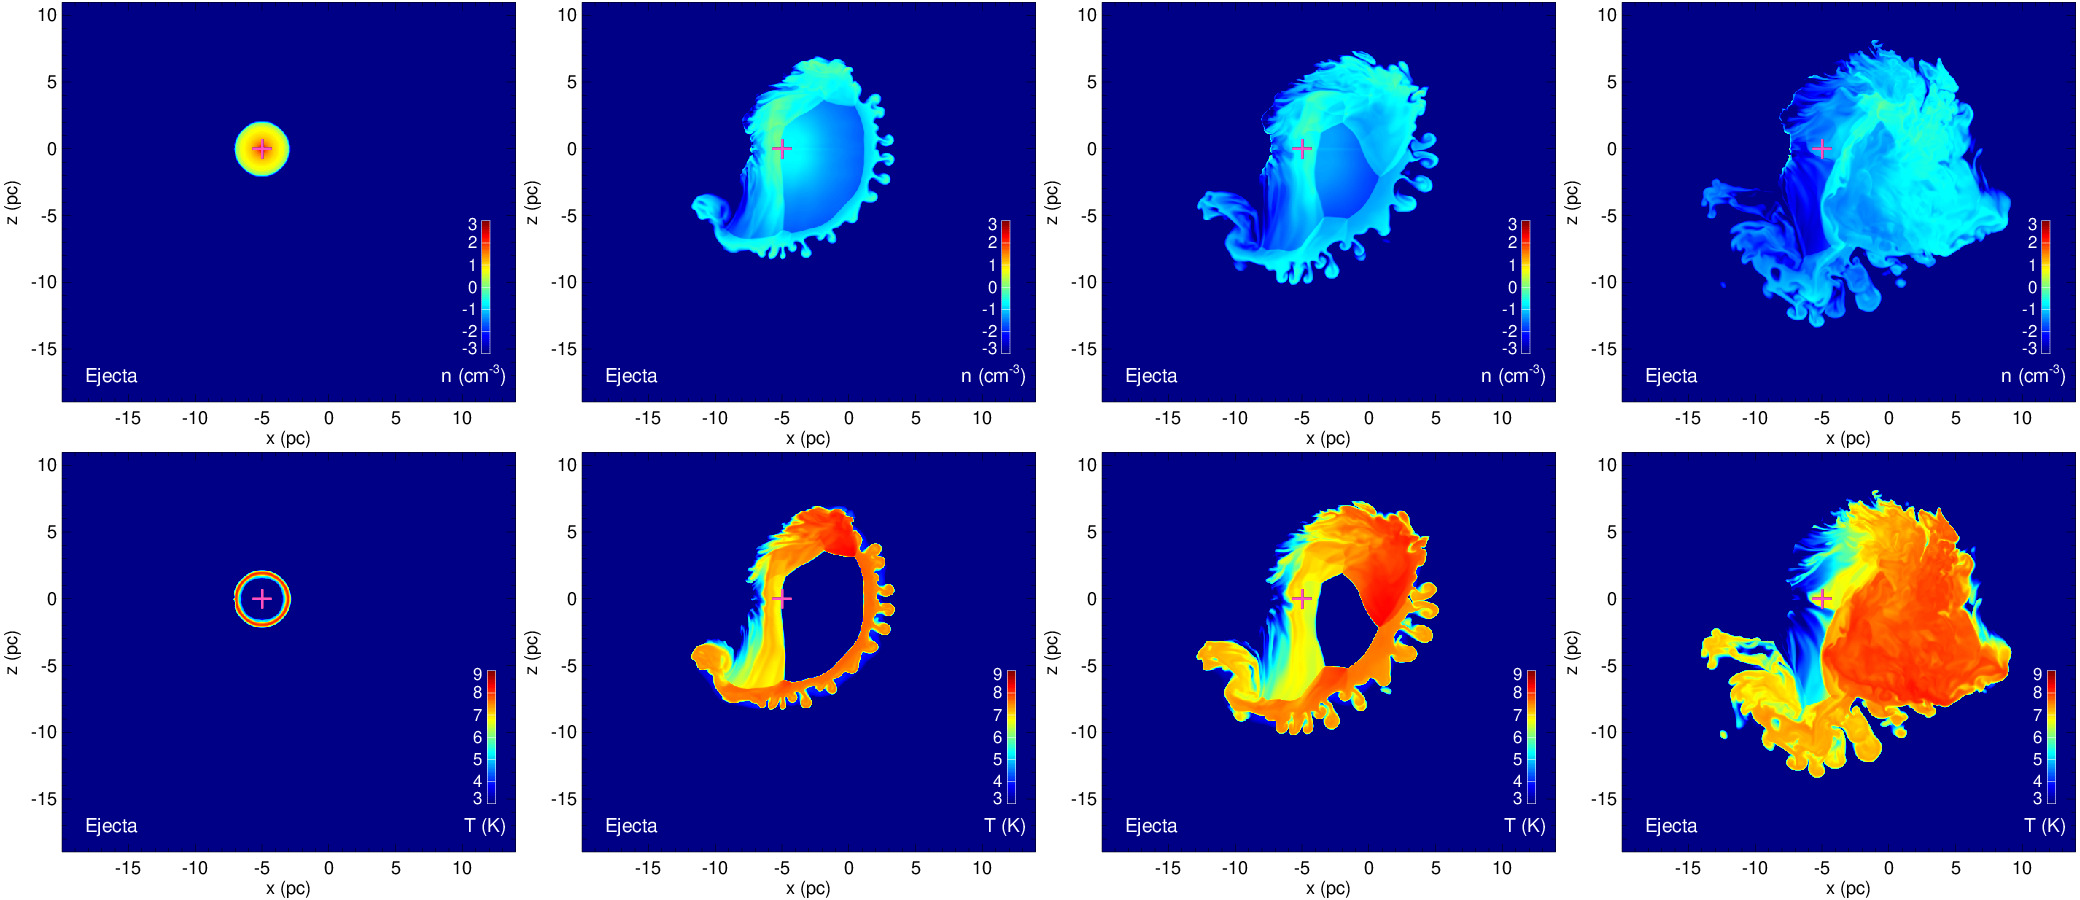
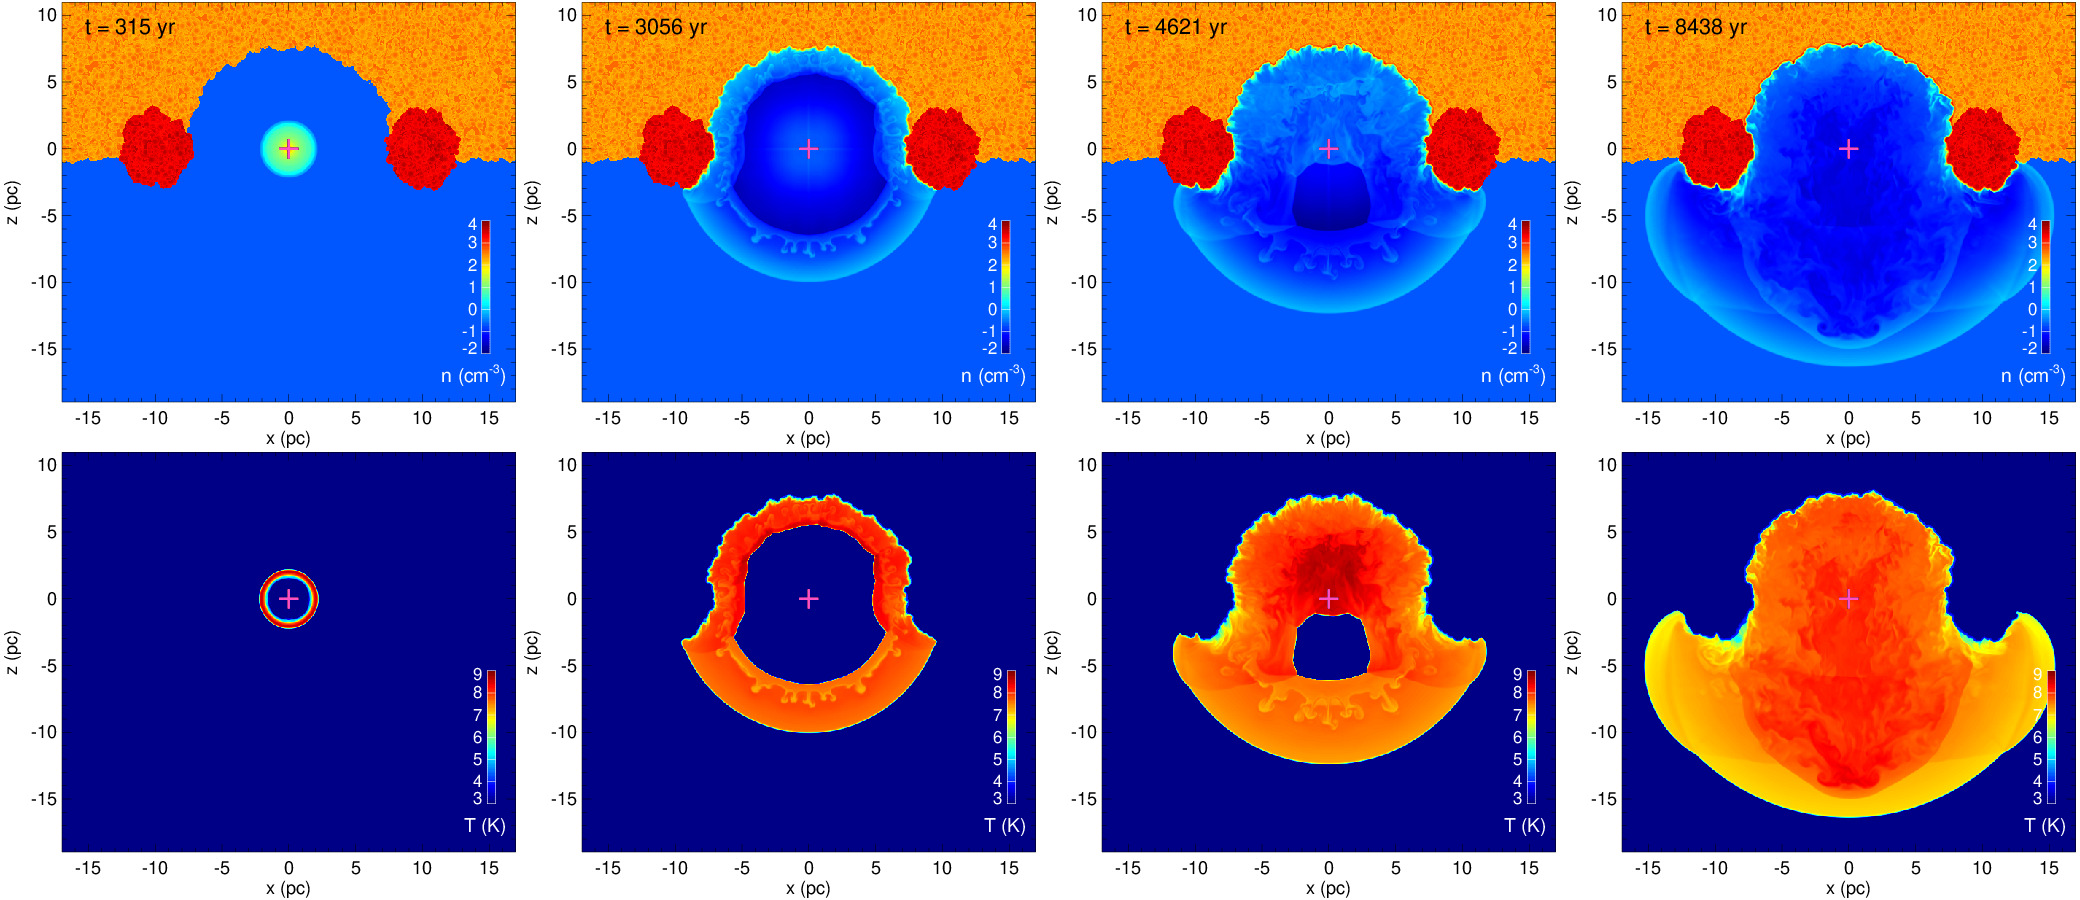
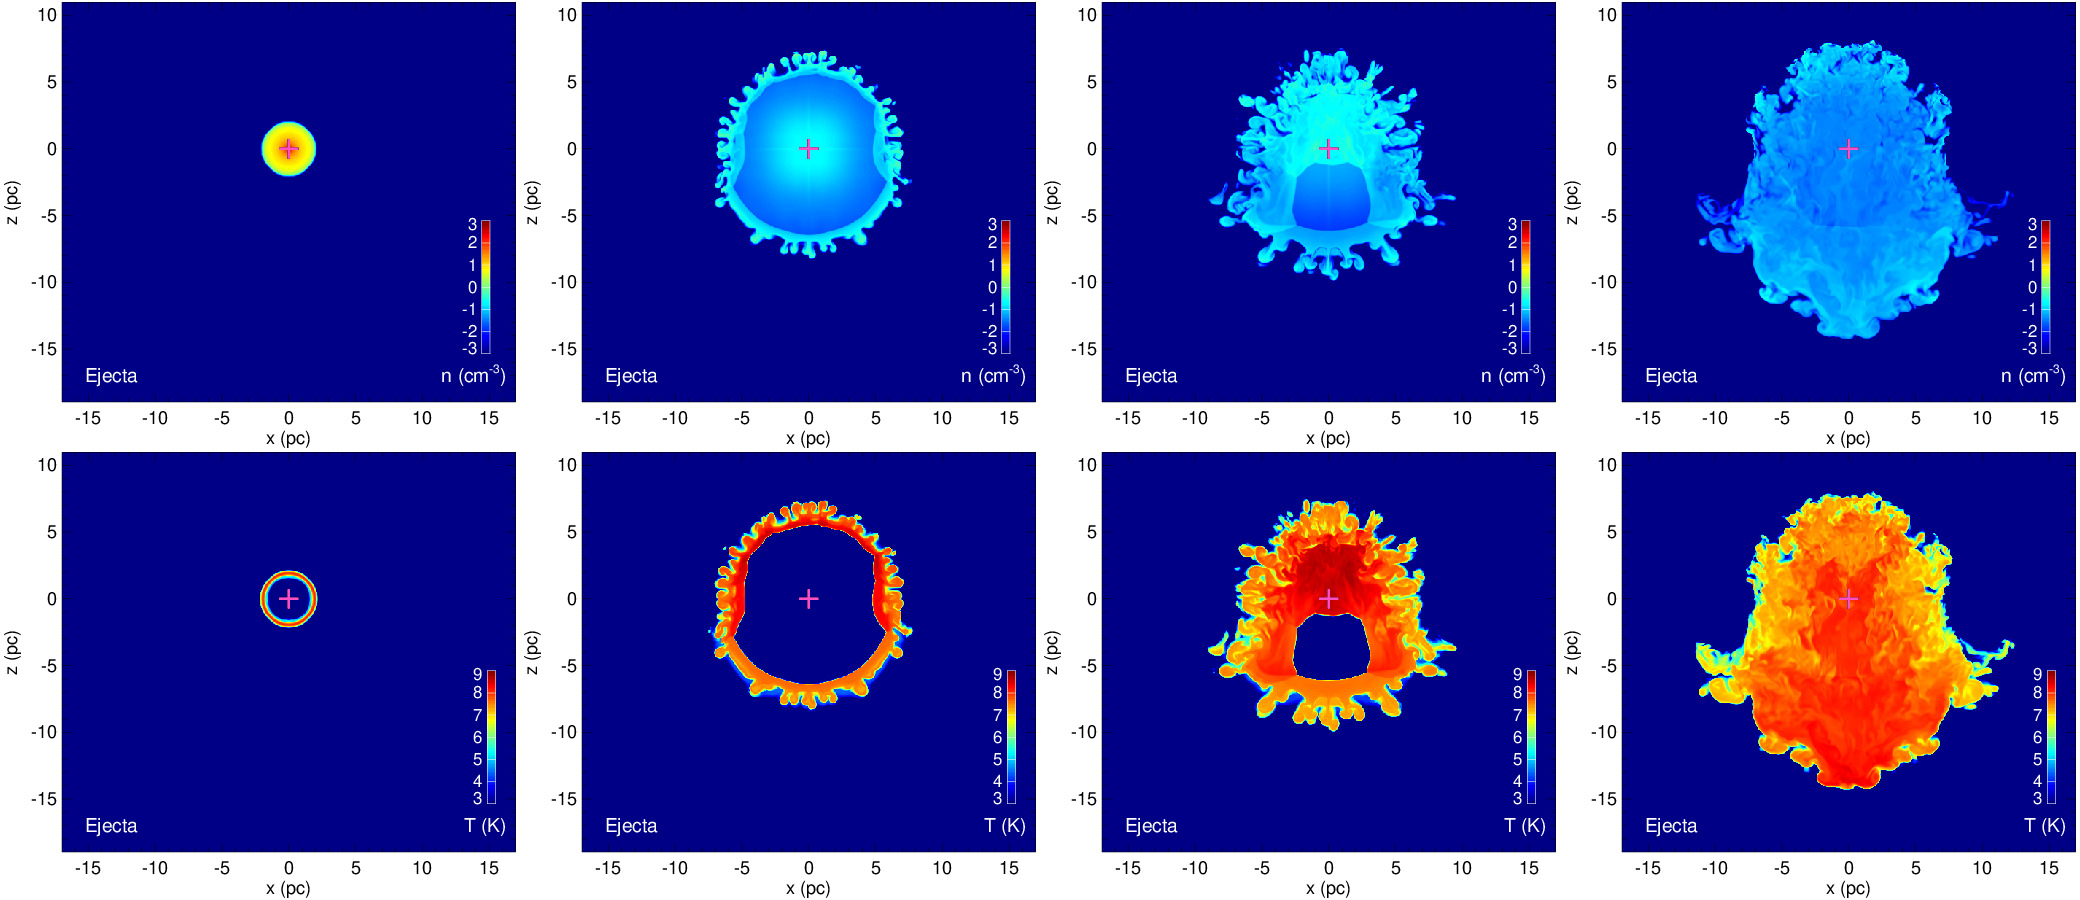
The evolution of our favourite model is shown in Fig. 2, which reports the density (first row; third row, only the ejecta) and temperature (second row; fourth row, only the ejecta) distributions in the plane, in logarithmic scale, at different epochs (increasing from left to right). The complete temporal evolution is available as online movie (Movie 1). The ejecta, described with a spherically symmetric distribution at the age of yr, initially propagate through a homogeneous medium in all the directions powered by their high kinetic energy. About yr after the SN event, the forward shock starts to interact with the closer part of the toroidal molecular cloud (red clumpy structure in the left top panel in Fig. 2). The interaction determines a strong slowdown of the forward shock hitting the cloud and, consequently, a strengthening of the reverse shock traveling through the ejecta. Meanwhile, the portion of the remnant not interacting with the cloud continues to expand through the uniform intercloud medium. As a result the initially spherically symmetric remnant progressively becomes asymmetric in the subsequent evolution (see second column in Fig. 2). The asymmetry is even enhanced when the blast wave starts to interact also with the atomic cloud to the north (orange clumpy structure in the top panels in Fig. 2). The strong reverse shock powered by the interaction with the molecular and atomic clouds (on the left side of the domain) rapidly expands through the ejecta and crosses the position of the neutron star immediately after the explosion (as also suggested by Greco et al. 2018) at an age of years (see the magenta cross in the second column in Fig. 2). Given the large asymmetry caused by the interaction with the clouds on the left side, the reverse shock does not refocus in the center of the explosion, but proceeds expanding to the right (see third column in Fig. 2). At the same time, the forward shock continues to expand, reaching the farthest part of the toroidal cloud at yr (see third column in Fig. 2). Conversely, the portion of the blast wave traveling southward is free to expand through the uniform intercloud medium. Most of the ejecta remain confined by the dense clouds in the northern part of the domain, to the right with respect to the center of the explosion (see the densest part of the ejecta in the third row in Fig. 2), while a fraction of them expand freely to the south (see third and fourth rows in Fig. 2).
The mass of the ejecta determines the density at the blast wave, and together with the velocity regulates the energy of the explosion. The mass of the ejecta in our favourite model is and the energy is erg. The higher is the mass of the ejecta the higher is the density and the contribution of the ejecta to the X-ray emission (see Sec. 3.2). Moreover, if we consider models with the same energy, the higher is the ejecta mass the longer takes the blast wave to expand and the reverse shock to refocus; e.g., the model with ejecta mass 10 takes yr longer than the model with 4 to arrive to an analogous final evolution state. When we consider models with higher energy instead (and same ejecta mass), the blast wave expands faster due to the higher velocity of the ejecta and the stronger interaction with the clouds leads to a larger contribution to the X-ray emission (see Sec. 3.2). For instance, the model with an explosion energy of erg takes yr shorter than the model with erg to arrive to an analogous final evolution state. In the best model we consider an offset of 5 pc from the center of the cavity for the progenitor (see Sec. 2.1), corresponding to the position inferred by Greco et al. (2018) for the nearby PWN at the instant of the explosion. A more centered position for the origin of the explosion (see Appendix A) yields a quite symmetric distribution of material in the SNR that does not agree at all with the multi-wavelength observations (Rho et al. 2001; Troja et al. 2006, 2008; Lee et al. 2012; Su et al. 2014; Greco et al. 2018).
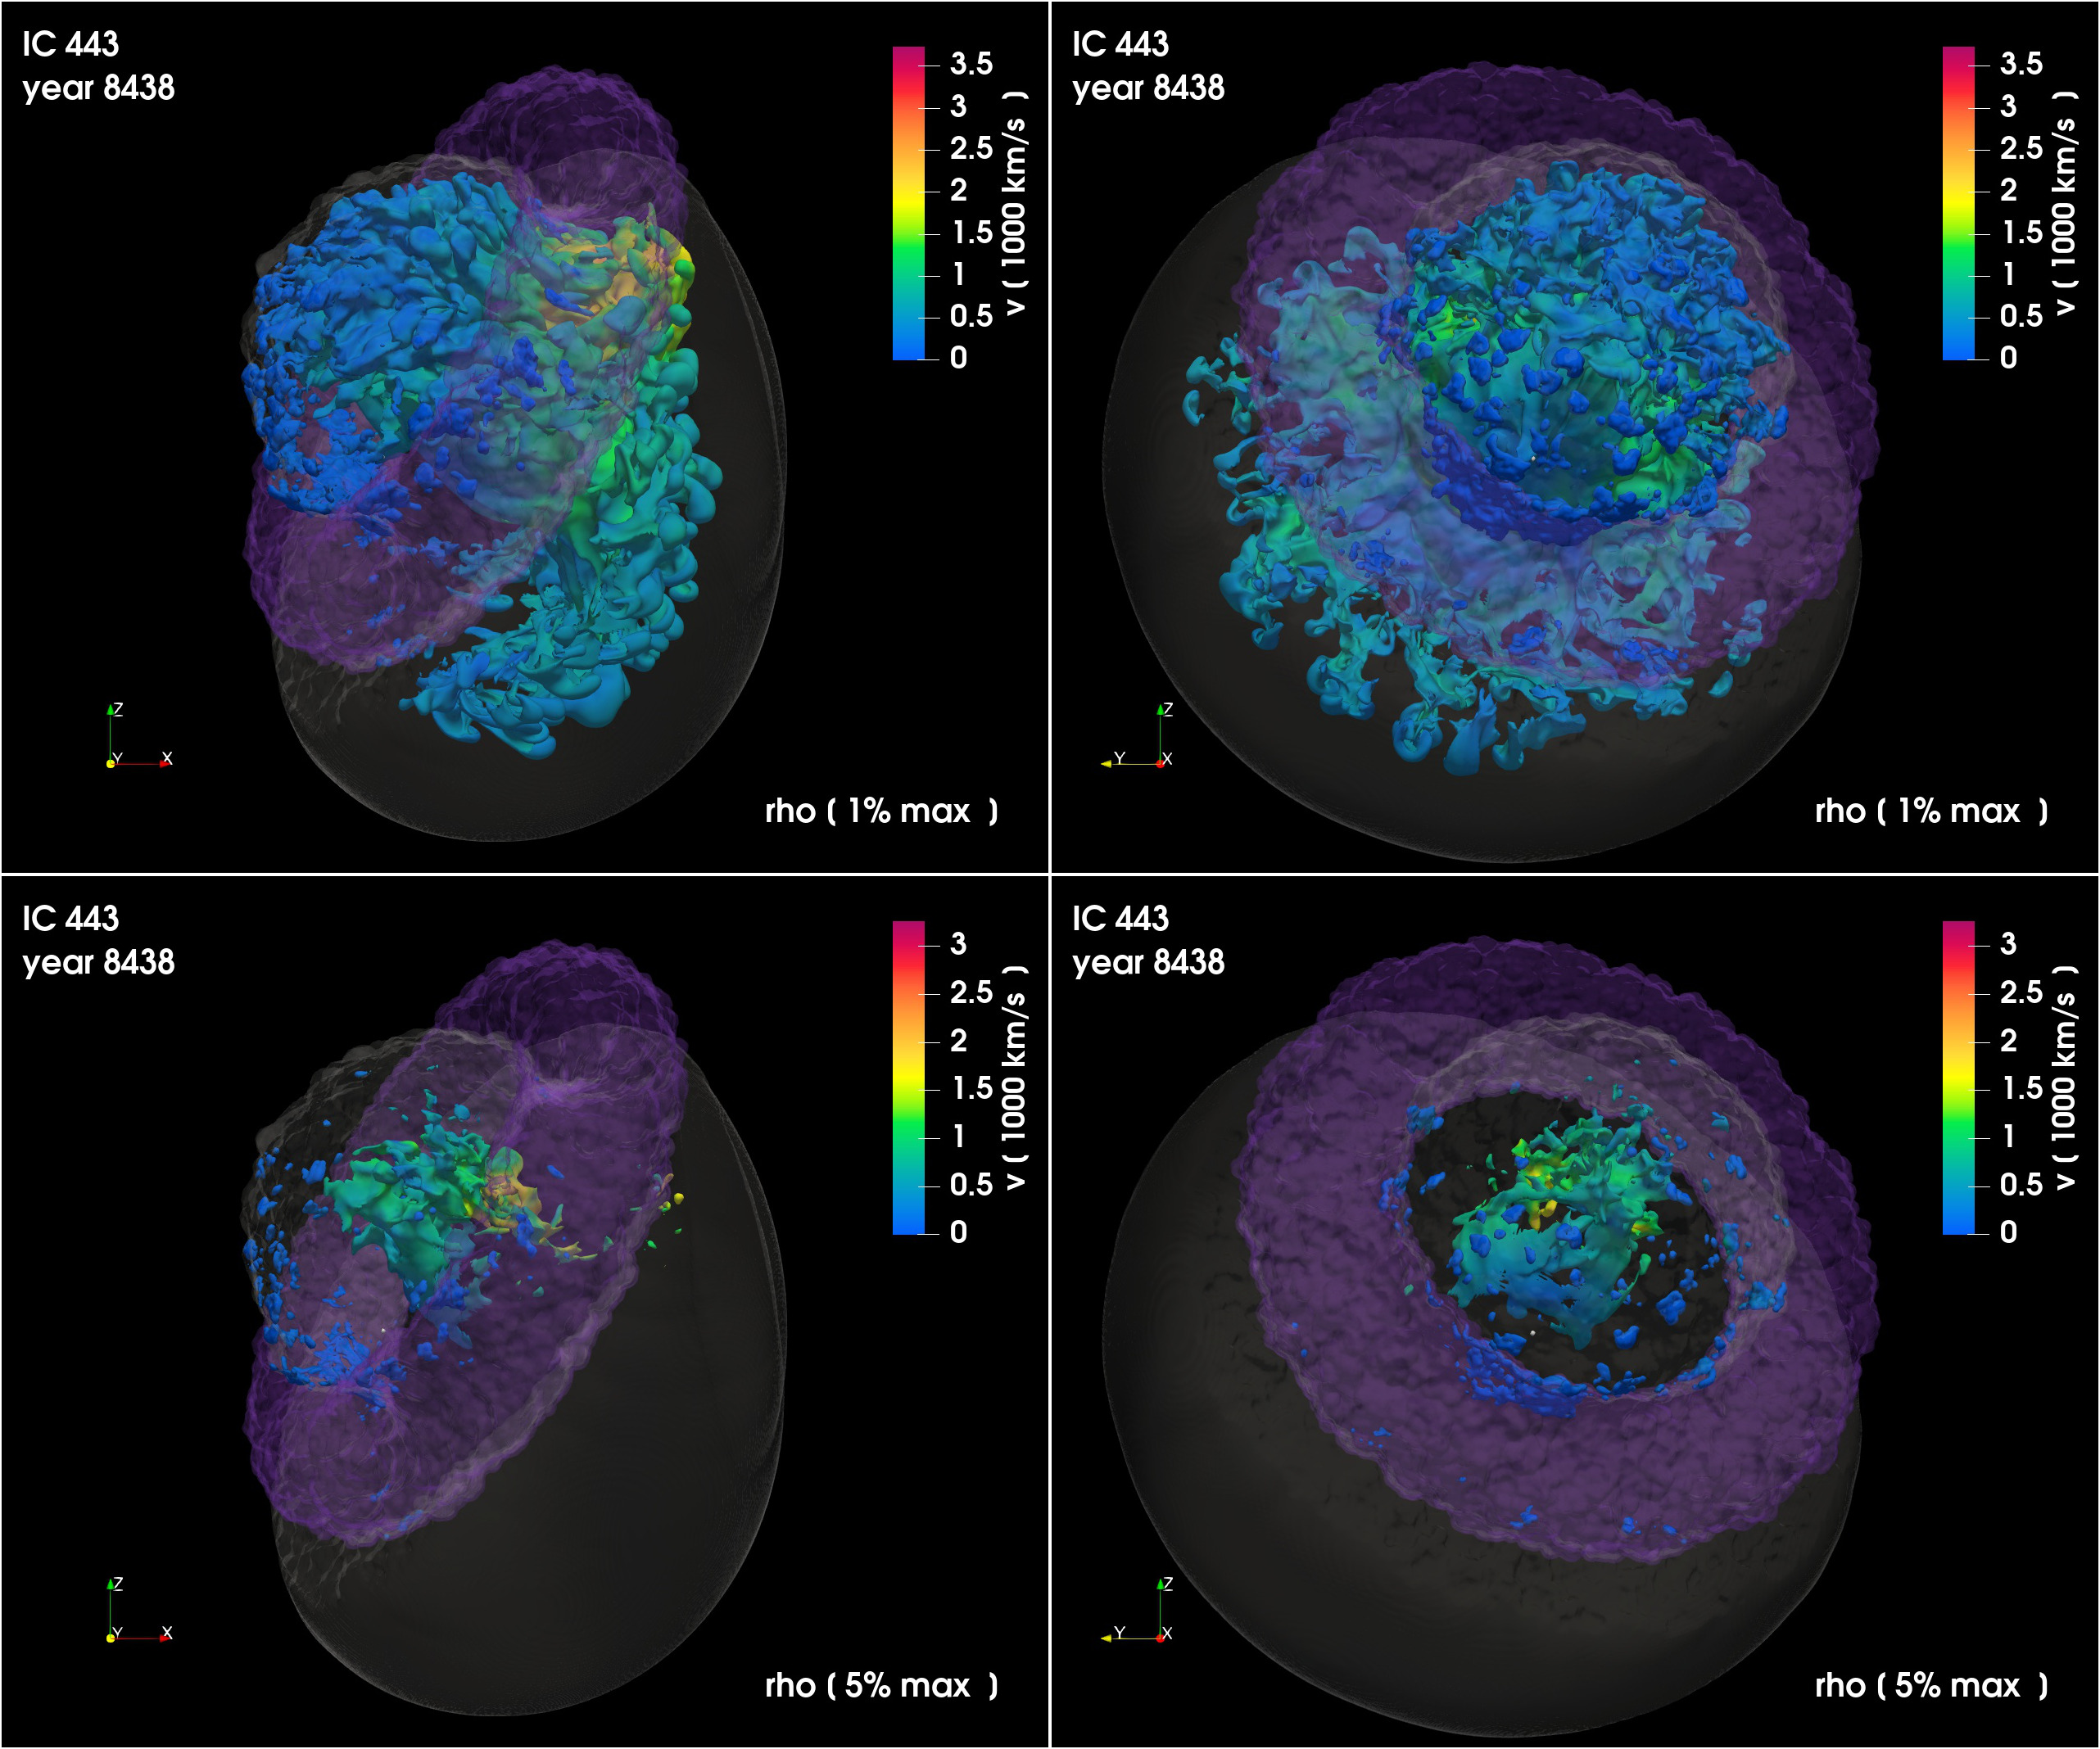
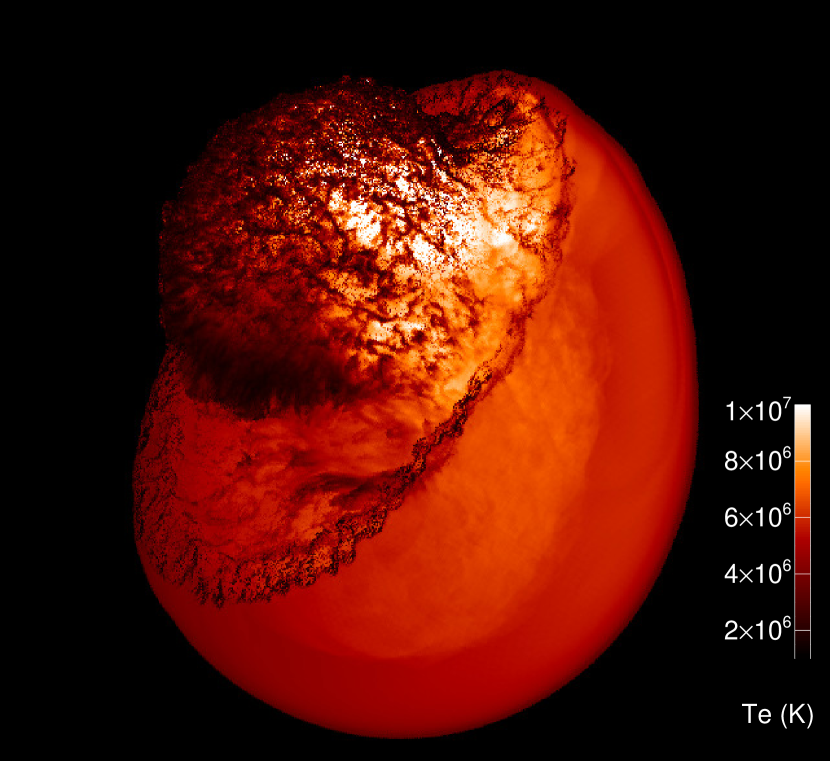
In Figure 3, we show a 3D volume rendering of the ejecta in our favourite model for IC 443 at yr, from two different points of view: on the left, the assumed LoS (see Sect. 2.2, and Troja et al. 2006, 2008); on the right, same representation rotated by 90º about the -axis. The ejecta distribution considers cells with density at more than 1% (upper panels) and 5% (lower panels) of the peak density. For a full-view distributions, see the online animations (Movie 2 and Movie 3). We also compare the modeled distribution of the ejecta and the blast wave with the observed morphology of the remnant in the optical band in the online Movie 4 (the wide field optical image was provided by Bob Franke - Focal Pointe Observatory) and in a navigable 3D graphic (available at https://skfb.ly/6X6BV). The ejecta are confined by the toroidal molecular (purple semi-transparent structure) and atomic clouds in the NE area, while the forward shock (transparent surface) travels freely in the opposite direction. The range of values explored for the atomic cloud is cm-3, according to the values discussed in the literature (e.g. Rho et al. 2001); for models with cm-3 the forward shock sweeps up part of the material of the cloud and produces higher X-ray emission (see Sec. 3.2 for more details). In general, models with cloud densities cm-3 show similar distributions of ejecta and X-ray emission (see Sec. 3.2); due to the high density the cloud acts as a wall where the forward shock reflects. Thus, we selected for our best model the minimum density producing results consistent with the observations, namely cm-3. We interpreted this as a lower limit to the density of the atomic cloud, thus constraining better the values of density quoted in the literature (namely cm-3; e.g. Rho et al. 2001). As for the molecular cloud, we explored values in the range cm-3; for all of them, we found that neither the ejecta nor the X-ray distributions show relevant differences. So we decided to consider a density of the molecular cloud which is an order of magnitude higher than that of the atomic cloud, namely cm-3.
We observe a very irregular and asymmetric distribution of the ejecta (see Fig. 3) mainly due to the highly inhomogeneous medium where the SNR evolve and to the off-centered position selected for the origin of the explosion; the denser material is in the central part of the remnant to the right of the center of the explosion inside the cavity formed by the clouds (see 3rd and 4th rows in Fig. 2). This is due to the fact that the forward shock reflects first on the NE clouds, is driven rapidly in the opposite direction, shocking the ejecta expanding to the right, and, finally, interacts with the reverse shock developed by interaction of the blast wave with the NW clouds (note the color scale in Fig. 3 and Movie 2, indicating the velocity distribution of the ejecta; see also Fig 2). As a result, the reverse shock converges on a region located to the right of the center of explosion where the ejecta are compressed, reaching the highest values of density.
Since the SN explosion occurs close to the SE side of the molecular cloud, ejecta are heated several times by multiple shocks reflected on the surrounding clouds in the very early stages of the remnant evolution, while they are still dense enough to approach rapidly the collisional ionization equilibrium. After this early heating, which occurs close to the explosion site, ejecta expand freely in the NW direction (see Fig. 2 and Movie 1) and cool down adiabatically, possibly leading to overionized plasma. This supports the scenario proposed by Greco et al. (2018) to explain the presence of overionized plasma and the component in strong non-equilibrium of ionization (NEI) found in the jet-like feature of IC 443.
In Figure 4 we plot the density-weighted average electronic temperature along the LoS (see Sec. 2.2) for our favourite model at yr. The temperature in the northern area close to the atomic cloud is K, while in the SW region is higher, and reach values of K in the central part of the remnant (close to the molecular cloud). Thus, the figure evidences a rather complex temperature structure of the plasma which is expected to be reflected in the X-ray emission arising from the remnant, and a morphology which shows a striking resemblance with that of IC 443.
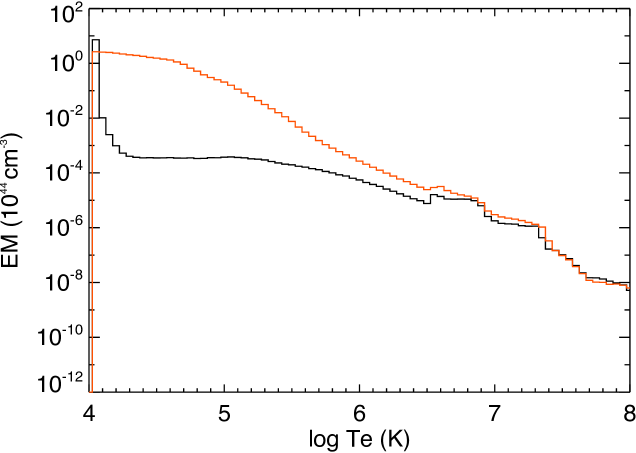
Figure 5 shows the distribution of emission measure as a function of the electronic temperature, , for our favourite model (black line), and the ideal case without considering the effect of radiative losses from optically thin plasma (red line). The two models show completely different distributions for T K (indicating an important role played by the radiative cooling), while they appear to be very similar for higher temperatures. Thus the density-weighted temperature and the emission maps in the X-rays are similar for both the ideal and the best case; the differences in the distributions for T K are reflected mainly in the contribution to the X-ray emission coming from the plasma interacting with the clouds, which is higher in the ideal case. For a detailed description of the X-ray emission see Sec. 3.2.
3.2 X-ray emission
In this section we analyse the distribution of the X-ray emission in our best model, and compare the X-ray emission synthesized from the model (see Sec. 2.2 for a detailed description) with XMM-Newton observations of SNR IC 443 (see Appendix B and Greco et al. 2018 for more details).
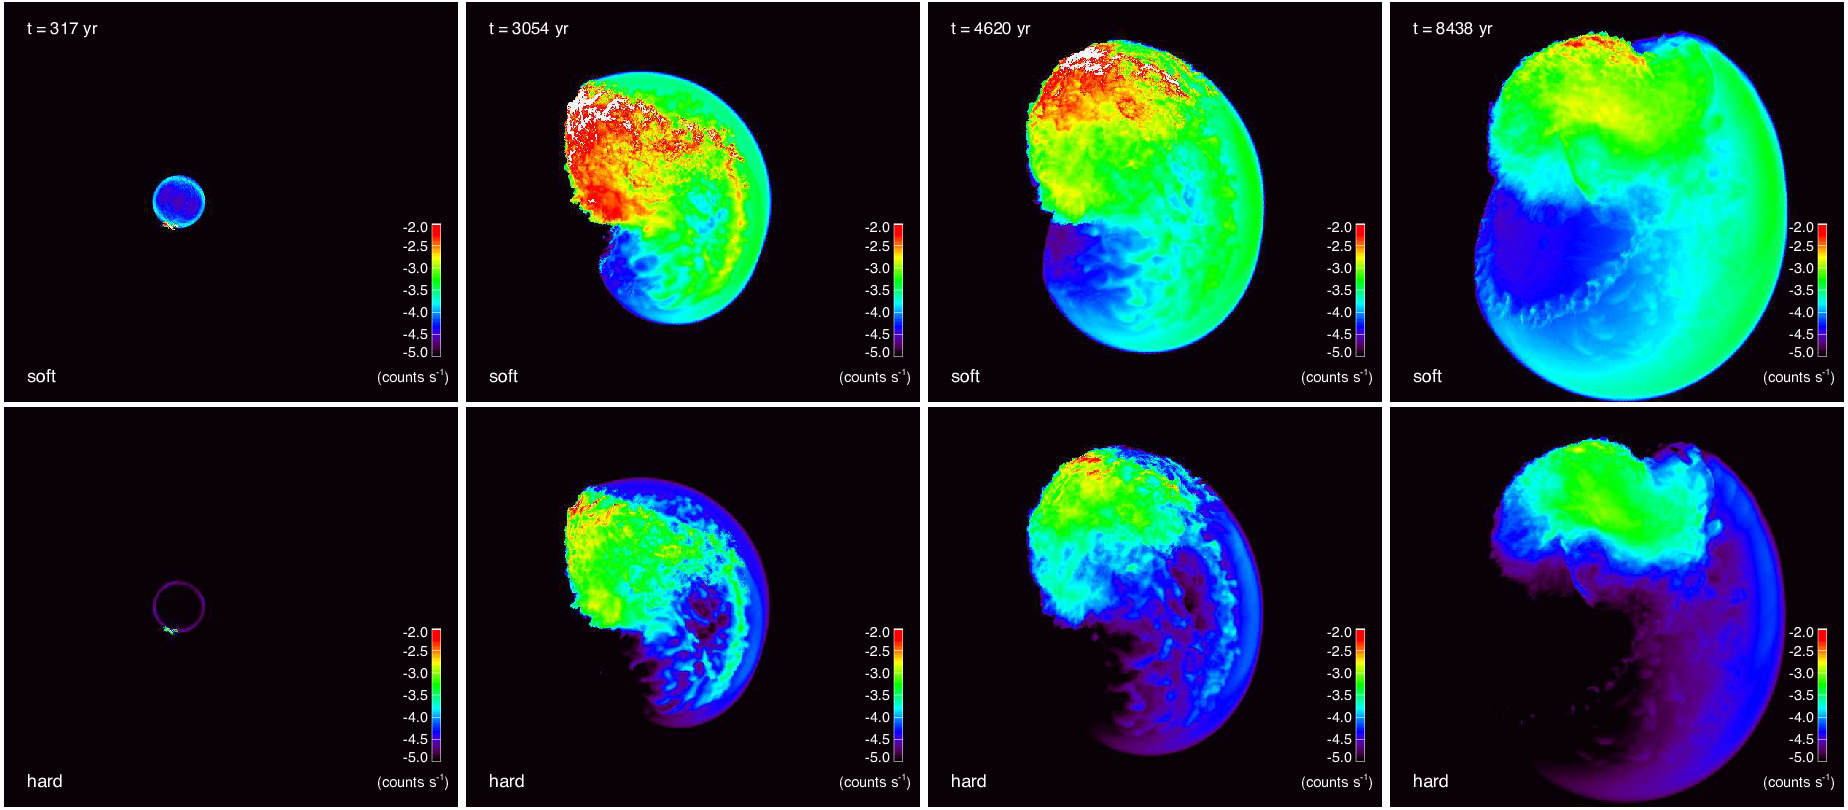
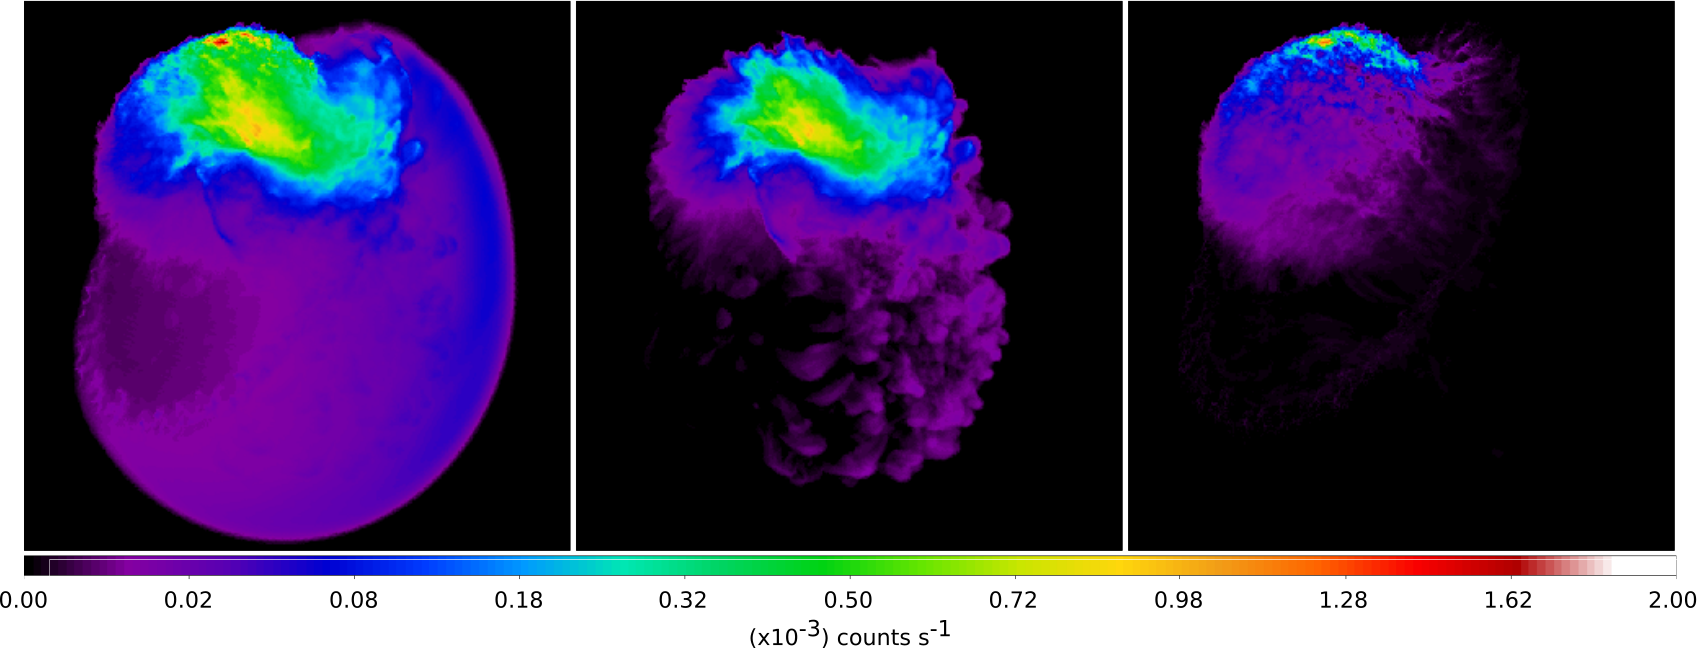
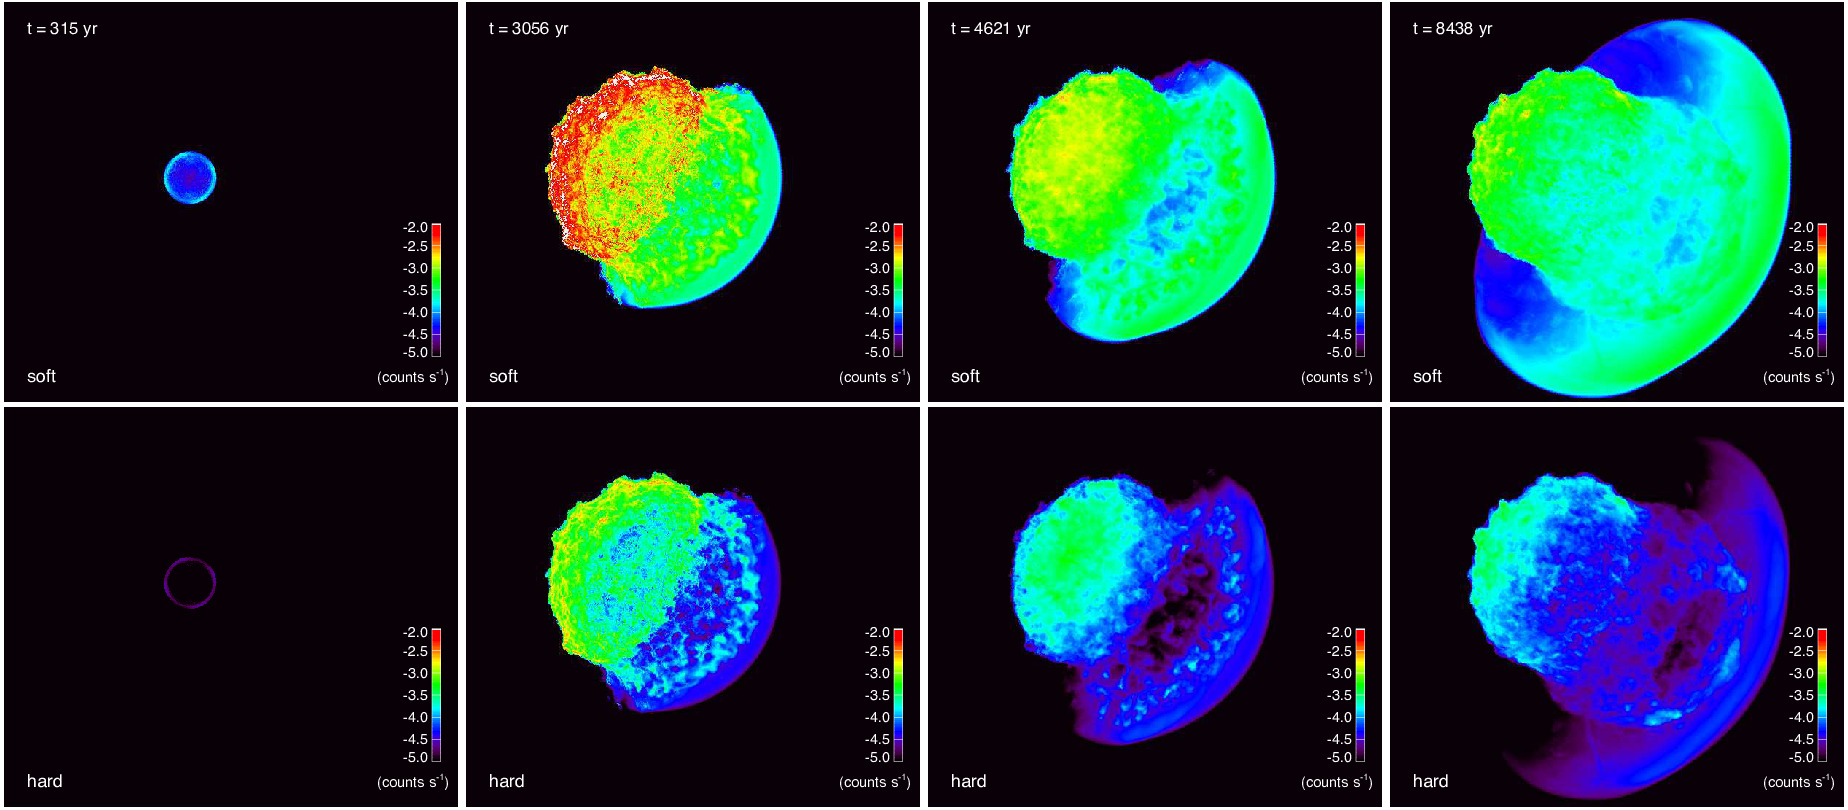
In Figure 6 we present X-ray count rate maps synthesized from the model at different evolution times (increasing from left to right, corresponding to the evolution times shown in Fig. 2), considering the LoS as in left panels in Fig. 3 and integrating the emission along the LoS (see Sec. 2.2). The complete temporal evolution is available as online movie (Movie 5). The upper and lower panels at each epoch show the soft ([] keV), and hard ([] keV) X-ray emission, respectively. When the expanding ejecta reach the molecular cloud at yr since the SN event, the interaction of the forward shock with the dense cloud produces bright X-ray emission in both soft and hard bands (see left panels in Fig. 6). The impact on the cloud produces a reflected shock that powers the reverse shock, heating the ejecta material (see Fig. 2); indeed, the second column panels in Fig. 6 evidences a great area with strong X-ray emission, especially in the soft band, due to the interaction of the ejecta with the dense cloud and the powered reverse shock. The forward shock continues to interact with the atomic cloud to the north while expanding and producing bright X-ray emission that moves clock-wise from east to the north during the evolution (see Fig. 6, from left to right, and Movie 5). The free propagation of the forward shock to the SW heats the ambient interclump material producing soft, and faint hard, X-ray emission (see third and fourth columns, in Fig. 6). We find the brightest X-ray emission in the north area of the remnant where the clouds keep the plasma confined.
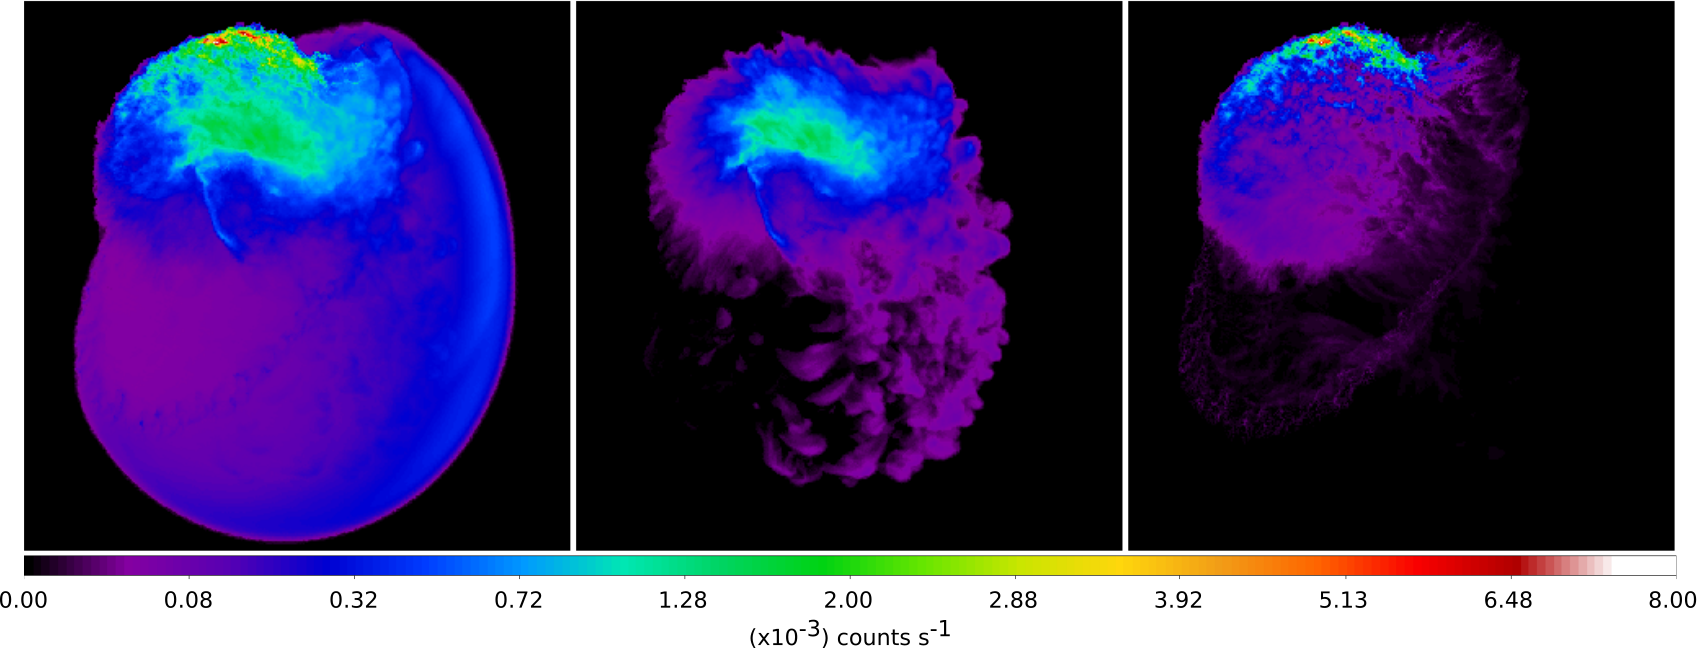
We followed the evolution and calculated the X-ray emission of the different plasma components (namely ISM and ejecta) by following the procedure explained in Sec. 2.2. In Figures 7 and 8 we show synthetic X-ray count rate maps, in the soft and the hard bands respectively (note the different scales), for the best model at yr. Similarly to the density distributions shown in Fig. 2 and Fig. 3, the X-ray emission maps show a very asymmetric shape due to the highly inhomogeneous medium where the SNR evolve and to the off-centered position selected for the origin of the explosion; due to the morphology of the surrounding clouds, a more centered position in the cavity for the originating SN derives in a more symmetric distribution (see Fig. 12 and Appendix A) that does not agree with the X-ray studies performed (Troja et al. 2006, 2008; Bocchino et al. 2009; Greco et al. 2018). The ejecta show a centrally peaked distribution (see Fig. 7 and Fig. 8, middle panels) in both soft and hard bands. From the exploration of the parameter space, we found out that the higher is the initial mass of the ejecta the brighter is its X-ray distribution.
The ejecta and the interstellar material are confined in the NE area (see Fig. 3) and interact with the clouds emitting in X-rays, mainly in the soft band, from the limb close to the atomic cloud (see left panels in Fig. 7 and Fig. 8). We verified that by changing the cloud density, we induce variations of the intensity of the X-ray emission in the northeastern bright limb. In particular, a lower cloud density leads to a higher contribution of X-ray emission from the interaction with the clouds. In fact, in lower density ( cm-3) models, the forward shock impacts into the cloud and drags part of the material; this interaction produces higher X-ray emission than the one shown in right panels in Fig. 7 and Fig. 8. On the other hand, for cm-3, and the range of values explored here for the density of the molecular cloud, namely cm-3, the X-ray distributions don’t show relevant differences. In any case, models with erg, that is the energy of the best case, show higher X-ray emission in both the soft and the hard bands for all the density values of the clouds explored in this paper (see Table 1), due to the higher velocity of the blast wave that leads to a stronger shock while interacting with the clouds and the ejecta.
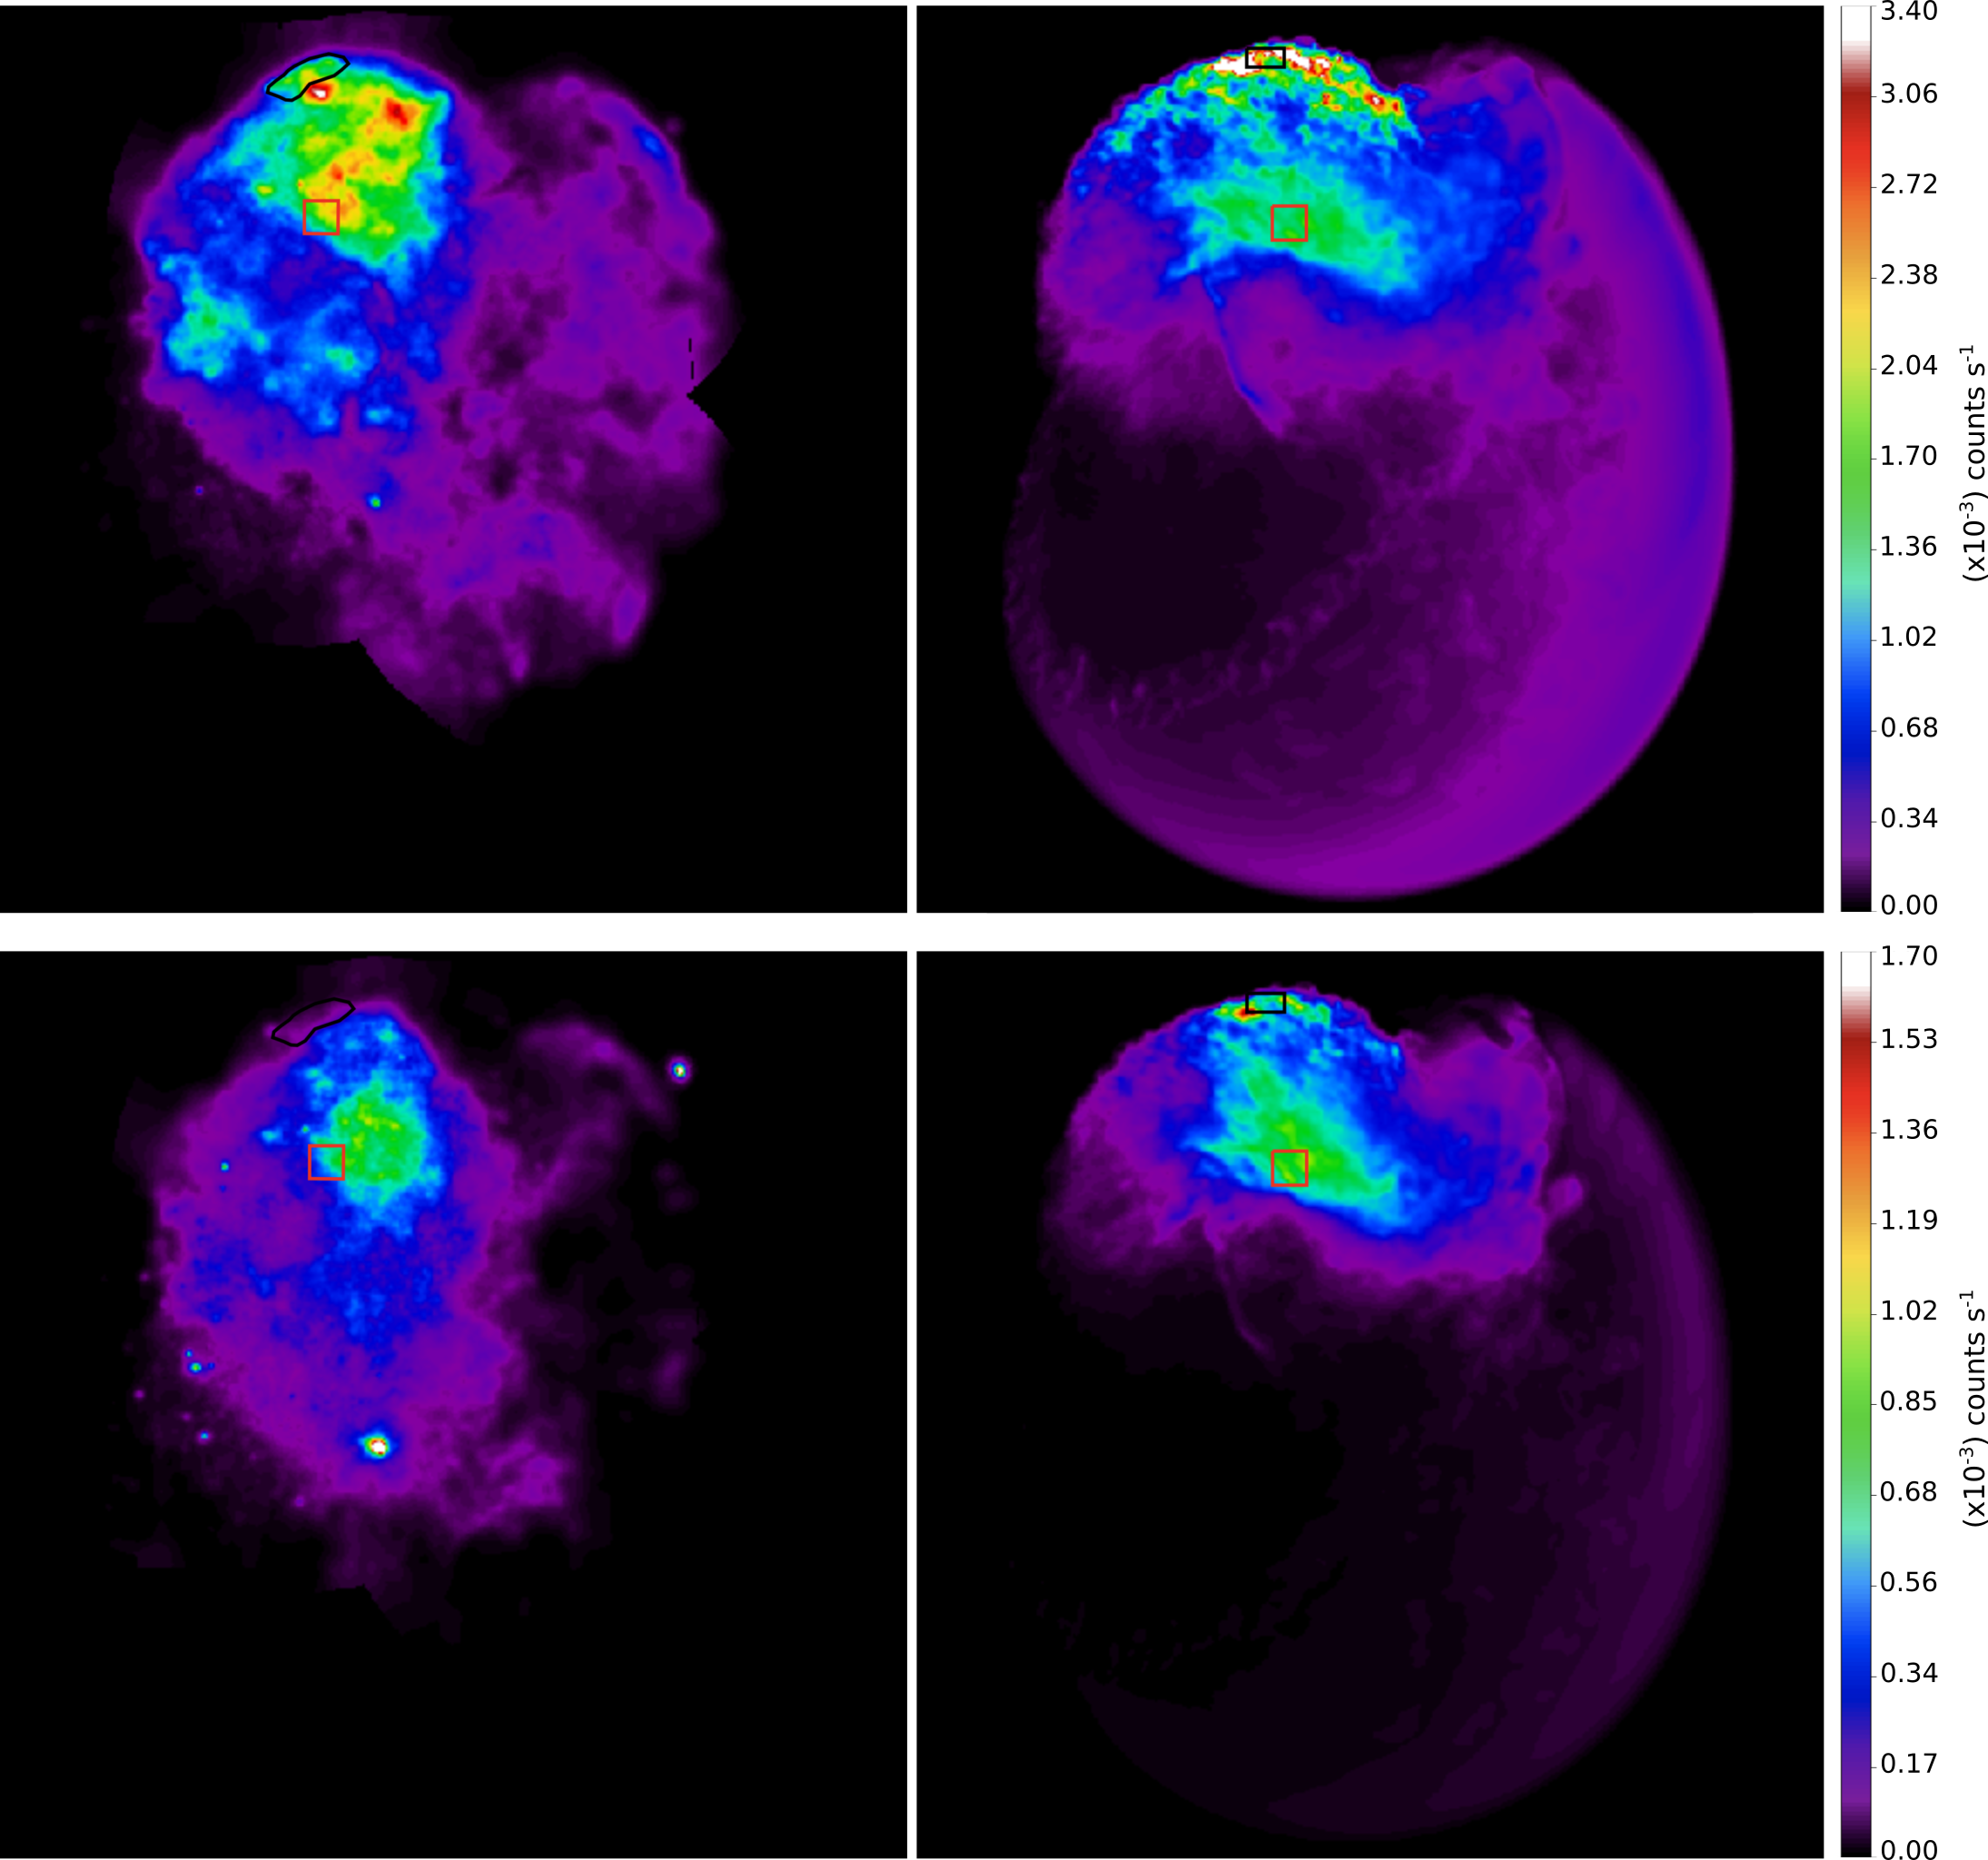
SNR IC 443 has been classified in the category of MMSNRs which show thermal peaked X-ray emission in the inner part and a shell morphology in radio (Rho & Petre 1998). The origin of this peculiar distribution, observed in left panels of Fig. 9, is not well understood. The X-ray emission synthesized from our favourite model has a centrally peaked component coming mainly from the ejecta in both soft and hard bands (see right panels in Fig. 9). By carefully deriving the explosion site (associated with CXOU J061705.3+222127) and the evolutionary stage ( yr) of IC 443, we can naturally reproduce the broadband shape of the remnant. Moreover, we can understand the physical origin of the two different morphologies observed in soft ( keV) and hard ( keV) X-rays. In particular, we can pinpoint the role of ejecta and ISM in shaping the X-ray emission. While the interaction with the clouds produce mainly soft X-rays, concentrated in the upper part of the remnant (at yr), the hard X-ray emission is more centrally peaked (as in real data) and includes a larger contribution from the shocked ejecta heated by a reflected shock generated by the impact with the surrounding molecular ring. This is in agreement with the spectral analysis performed by Troja et al. (2006, 2008), who associated the soft X-ray emission with shocked ISM and the harder X-ray emission with ejecta. The peculiar V-shaped northern border of the remnant and the faint, diffuse central and southern emission are also reproduced by our simulation as a result of the topology of the circumstellar environment.
We point out that the synthetic count rate is pretty similar to that actually observed (without the need of adding any ad-hoc renormalization), as shown in Fig. 9. We just note that synthetic maps show an excess of soft X-ray emission in the northern limb, due to the strong component originating in the interaction of the SNR with the atomic cloud (see Fig. 6 and Movie 5, and right panels in Fig. 7, Fig. 8 and Fig. 9). This excess is a result of the idealized morphology considered for the atomic cloud. Indeed, we considered a spherical cap connected with the toroidal molecular cloud that keeps the plasma confined and causes several reflections that, in turn, heat the material trapped inside. The X-ray emission from SNR IC 443 is higher in the soft band (see Fig. 9)222Note the different scales used for the soft (upper panels) and the hard (lower panels) X-ray bands. due to the strong interaction of the remnant with the CSM/ISM.
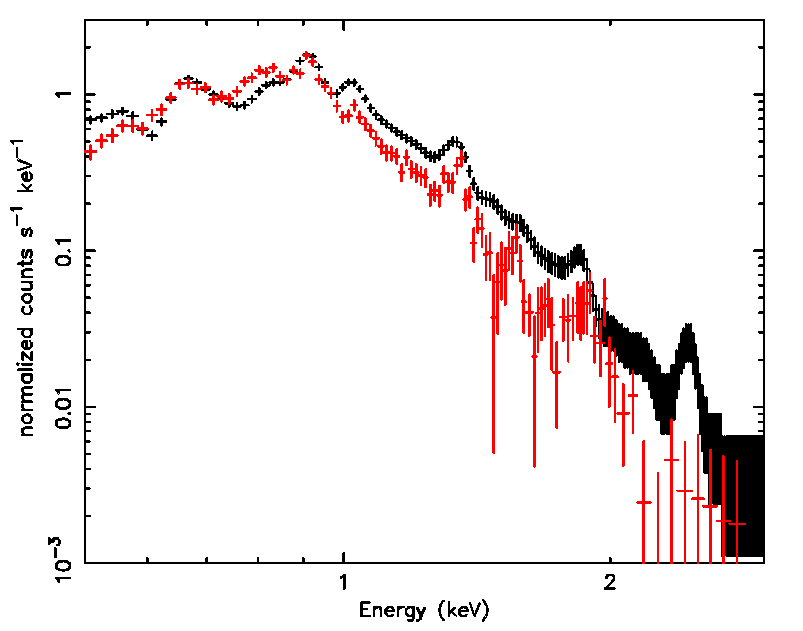
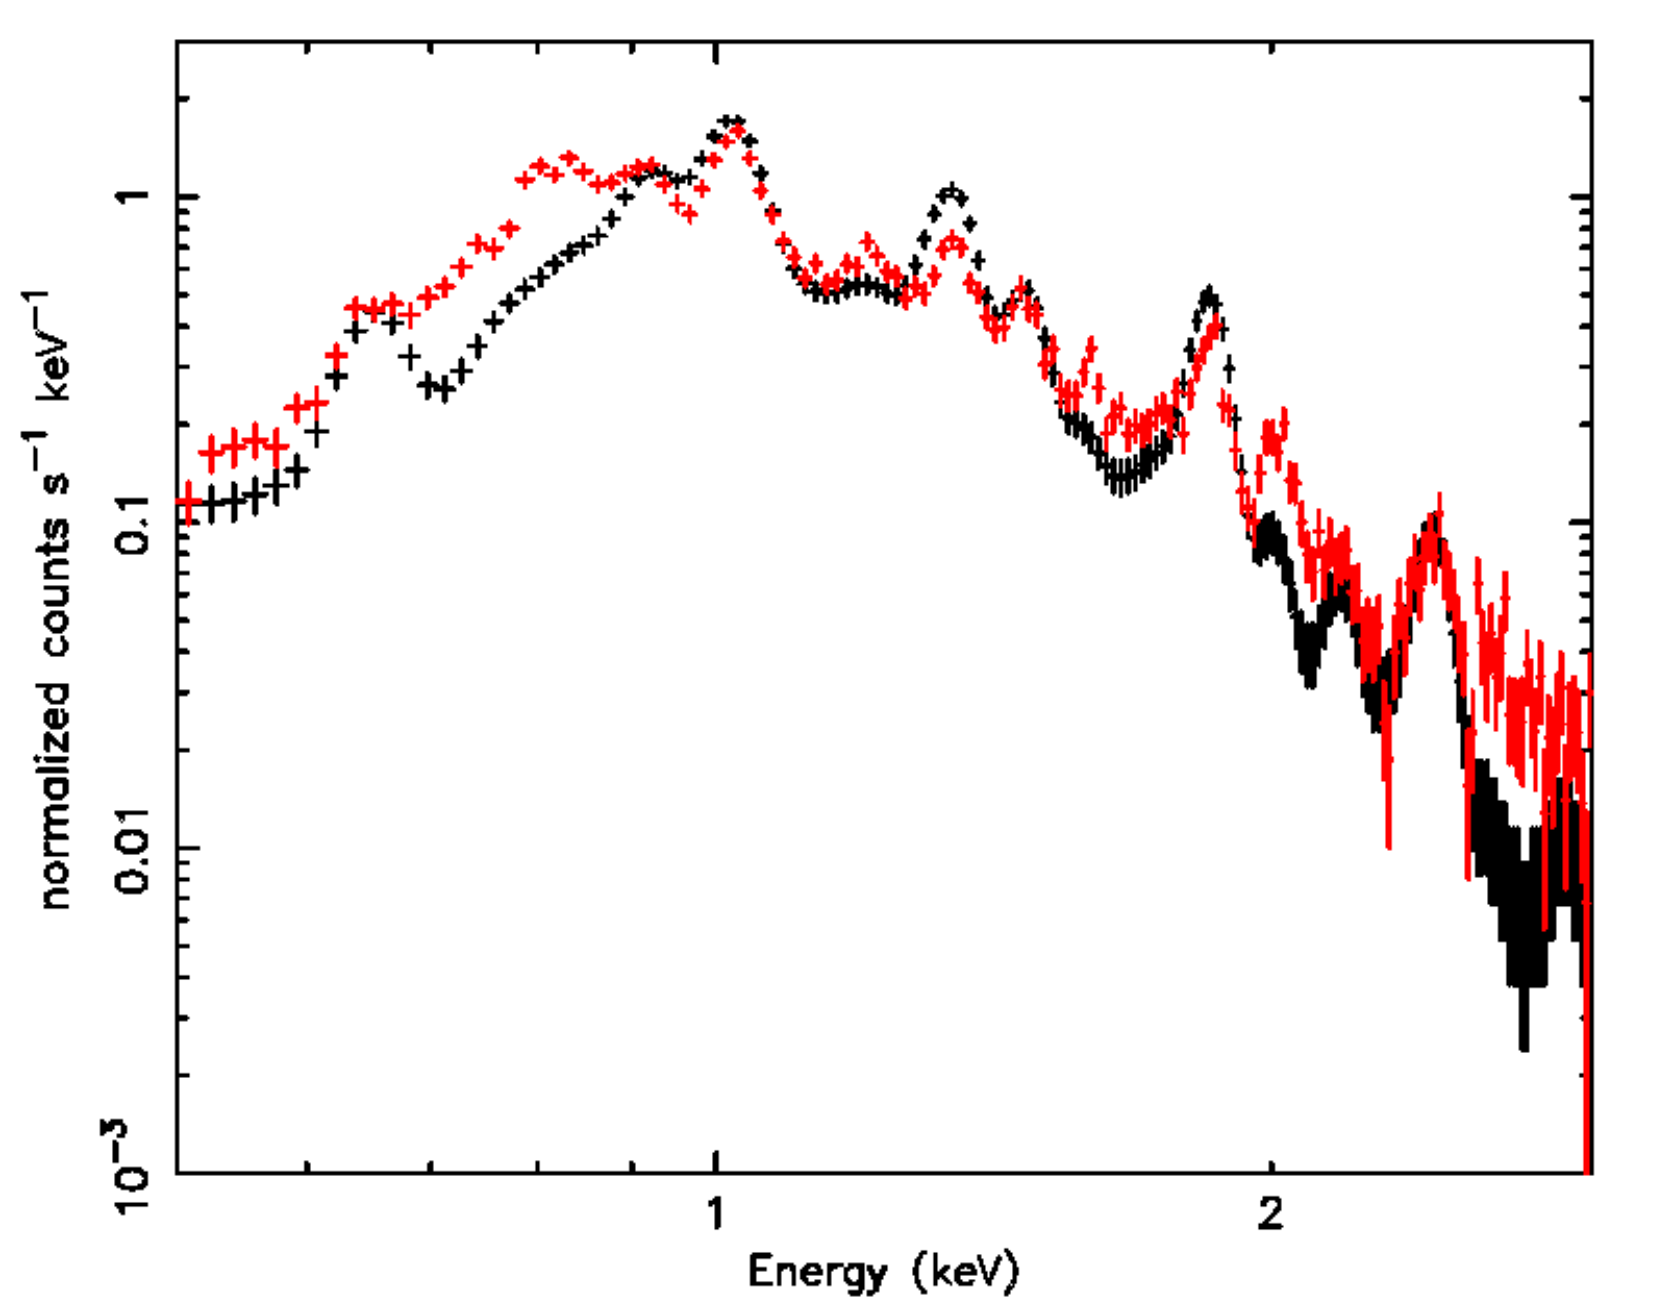
In order to get a deeper level of diagnostics, we compared synthetic and actual spectra in the northern and central part of the remnant. To this end, we synthesized X-ray spectra from the two regions shown in right panels of Fig. 9: the northern region of the image being mainly composed by X-ray emission originating from the SNR-cloud interaction (black), and the central region being dominated by the ejecta component (red). We then analyzed actual spectra extracted from corresponding regions in the real XMM-Newton data, shown in left panels of Fig. 9, following the method outlined in Greco et al. (2018) (see also Appendix B). We selected regions with similar observed and synthetic total count rate, in order to compare the shape and the main features of the spectra. In Figure 10 we plot the spectra corresponding to the northern (left panel) and the central (right panel) regions; in both cases, the spectra derived from the best model (black) remarkably reproduce the main features of the spectra extracted from the observed data (red). In particular, the equivalent widths of emission lines are much more pronounced in the central region than at north. Moreover, the overall slope of the continuum is steeper at the north than in the central region, as in real spectra. Details of line emission differ between models and observations (see Fig. 10, right panel). This is because we do not include tracers to follow the different chemical elements in the model, but just impose uniform metallicity for all the ejecta in post-processing, according to the relative abundances of the main elements derived by Troja et al. (2006, 2008).
4 Summary and conclusions
In this work, we investigated the origin of the complex X-ray emission observed in the mixed-morphology SNR IC 443. For this purpose, we developed a 3D HD model describing the interaction of the SNR with the environment, parametrized in agreement with the results of the multiwavelength data analysis (Rho et al. 2001; Troja et al. 2006, 2008; Lee et al. 2012; Su et al. 2014; Greco et al. 2018). We performed a wide exploration of the parameter space describing the initial blast wave and the environment, including the mass of the ejecta, the energy and origin of the explosion, and the density of the clouds (see Table 1 for a summary of the parameter space explored and the values best reproducing the observations). From the simulations, we synthesized the X-ray emission and compared it with XMM-Newton observations (see Appendix B).
Our model explains the complex X-ray morphology of SNR IC 443 in a natural way, being able to reproduce most of the features observed and identifying the strong effect of the inhomogeneous ISM on the remnant. The centrally-peaked X-ray morphology, is best reproduced when considering the explosion site at the position of the PWN CXOU J061705.3+222127 at the time of the explosion (inferred taking into account the proper motion of the neutron star as estimated by Greco et al. 2018). This fact, together with the jet-like structure detected by Greco et al. (2018), supports the association between the PWN and IC 443, strongly indicating that the PWN belongs to IC 443 and that the collimated jet-like structure has been produced by the exploding star.
Our model results in a very irregular and asymmetric distribution of the ejecta, with a centrally-peaked X-ray emission, due to the highly inhomogeneous medium where the SNR evolve and the off-centered position selected for the origin of the explosion. The surrounding clouds form a cavity where multiple shocks reflect, heating repeatedly the ejecta trapped inside. Before the expansion, the ejecta are heated and ionized by the interaction with the reflected shock due to the impact of the forward shock front with the SE cloud (which is very close to the explosion site, indicated by the position of the PWN at that time). Afterwards, the ejecta may cool down via adiabatic expansion to the NW, which could explain the overionized plasma in the jet-like structure discovered by Greco et al. (2018).
In our model, the atomic and the molecular clouds confine the remnant to the NE and SE, while it expands freely to the SW (see Fig. 3 and Movie 2 for a 3D view). From the exploration of the parameter space and the comparison of the X-ray emission observed with the X-ray synthesized images, we find that the density of the atomic cloud should be cm-3, thus constraining better the values of density quoted in the literature (namely cm-3; e.g. Rho et al. 2001). In models with cm-3 the forward shock sweeps up part of the material of the cloud and produces higher X-ray emission. For the molecular cloud, instead, neither of the values explored, namely cm-3, show significant differences in the X-ray emission. In our best model, the mass of the ejecta and the energy of the explosion are and erg, respectively, indicating that the parent SN was characterized by a low explosion energy. The higher is the mass of the ejecta and the energy of the model, the brighter is the X-ray emission synthesized. From the evolution of the best model, we found that the peak of the X-ray emission move with time clockwise from east to the north and the time that best reproduces the X-ray observations of the remnant is yr. Considering all the cases explored we find that the age of SNR IC 443 is yr, indicating that IC 443 could be much younger than previous studies estimated (e.g. Chevalier 1999; Bykov et al. 2008).
The X-ray emission from SNR IC 443 is mostly dominated by the soft band, with a centrally-peaked distribution from the ejecta, and a bright X-ray component from the northern limb close to the atomic cloud (see upper panels in Fig. 9). The X-ray emission in the [] keV band is dominated by the ejecta component and presents a more pronounced centrally peaked morphology, as in actual data. The synthetic spectra derived from the model reproduce well the main features of the spectra extracted from the observed data.
It is also worth to mention that our simulations do not treat molecular and atomic dissociation and ionization in the dense clouds because these processes are negligible in the energy balance of the model. Considering a composition of 90% H and 10% He for the clouds, we estimated that the total energy necessary to dissociate and ionize all the shocked atoms and molecules of the clouds at the age of years is erg. This value is one order of magnitude lower than the total internal energy of the shocked cloud material at the same epoch (which is erg). Thus, we do not expect that the inclusion of these effects could change the main conclusions of this work. We also note that the internal structure of the remnant is mainly determined by the reverse shock that heats the ejecta, leading to the centrally-peaked morphology that emerges in the X-rays (see Fig. 9). Eventually, the main effect of dissociation and ionization of H and He would be to slightly reduce the temperature of the shocked clouds material, thus slightly lowering the contribution to the X-ray flux from the clouds in the [] keV soft band (see right panel in Fig. 7). This reduction would improve even more the agreement between the X-ray emission maps synthesized from our model and those observed (see Fig. 9).
The radiative losses included in the model cool down the plasma, although in every case the synthesized X-ray emission produced from the interaction with the atomic cloud is brighter than that observed in X-ray data. The excess of X-ray emission produced in the interaction of the SNR with the clouds in our model is a result of the morphology considered for the atomic cloud. Indeed, we considered a spherical cap, connected with the toroidal molecular cloud, that keeps the plasma confined and produces several reflections that heat the material trapped inside. The morphology described here is an idealization of the environment that we expect in SNR IC 443; a small fraction of the material could escape from the bubble along the LoS without leaving clear evidence in the observations.
It is worth to note that we neglected the effects of the thermal conduction in our simulations, although it may play a role in modifying the temperature structure of the shocked cloud and ejecta. In fact, a crucial effect that should be taken into account when including the thermal conduction is the ambient magnetic field which makes the thermal conduction highly anisotropic. However we do not have any hints on the configuration and strength of the pre-SN interstellar magnetic field in IC 443. Any exploration of different field configurations and strengths in the simulations would be hopeless without any constraints from observations. Nevertheless, even if we would have a satisfactory knowledge of the field configuration, we think that the effects of thermal conduction may be negligible. For example, in the case of an ordered magnetic field, the thermal conduction can be highly suppressed in the direction perpendicular to the magnetic field (e.g. Orlando et al. 2008) and this could be the case if the blast wave squeeze the interstellar magnetic field along the clouds border (e.g. Orlando et al. 2019). In this case, the results would be similar to those presented in the paper. In the case of a randomly oriented magnetic field (possibly due to local turbulence) the thermal conduction can be reduced by up to a factor of 5 (Narayan & Medvedev 2001), thus making less relevant the effects of the thermal conduction. Considering this reduction factor and the spatial resolution of the simulations as the lowest temperature length-scale, we estimated the characteristic time-scale for the thermal conduction in our model following the Eq. 10 in Orlando et al. (2005). We obtained a conduction time-scale of years, which is much larger than the evolution time of our model ( years). Thus, rather than prescribing an arbitrary magnetic field, for the purposes of the paper, we preferred to neglect the effects of thermal conduction in our simulations. This choice is analogous to assume a randomly oriented ambient magnetic field which is capable to strongly limit the effects of the thermal conduction. This assumption may affect some of the details of the shock-cloud interaction especially in regions where the effects of thermal conduction can be relevant. However we do not expect that our assumption affects the large-scale structure of the remnant and the ejecta distribution and, therefore, that it changes the main conclusions of the paper.
The morphology and the distribution of material observed in SNRs reflect the interaction of the SN blast wave with the ambient environment as well as the physical processes associated to the SN explosion and the internal structure of the progenitor star. Here we considered a symmetric explosion for the initial conditions, which means that all the features observed in our model arise from the interaction of the remnant with the CSM/ISM. Thus, a correct description of the environment where the progenitor exploded has allowed us to explain the physical origin of the puzzling and multi-thermal X-ray emission of IC 443. The centrally peaked morphology (characteristic of MMSNRs) is a natural result of the interaction with the complex environment of IC 443. A combination of high resolution X-ray observations and accurate 3D HD modelling is necessary to confirm if this scenario is applicable to other MMSNRs. Our model also provided tight constraints on the explosion energy and the remnant age, and supported the association of IC 443 with PWN CXOU J061705.3+222127. A more detailed description of the SN explosion in IC 443 could add new information on the distribution of chemical abundances within the ejecta and on intrinsic inhomogeneities like the overionized jet-like structure described by Greco et al. (2018).
Acknowledgements.
We thank the referee for useful comments and suggestions that allowed us to improve the manuscript. We acknowledge the CINECA ISCRA initiative (Award HP10CET086), the MoU INAF-CINECA initiative (Grant INA17_C5A43) and the HPC facility (SCAN) of the INAF – Osservatorio Astronomico di Palermo for the availability of high performance computing resources and support. The PLUTO code, used in this work, was developed at the Turin Astronomical Observatory in collaboration with the Department of General Physics of Turin University and the SCAI Department of CINECA. SO, MM, FB acknowledge financial contribution from the INAF mainstream program and from the agreement ASI-INAF n.2017-14-H.O. We are grateful to Bob Franke, Focal Pointe Observatory, for sharing the optical image of SNR IC 443 used in the online movie and the 3D interactive graphic.References
- Abdo et al. (2010) Abdo, A. A., Ackermann, M., Ajello, M., et al. 2010, ApJ, 712, 459
- Arnaud (1996) Arnaud, K. A. 1996, in Astronomical Society of the Pacific Conference Series, Vol. 101, Astronomical Data Analysis Software and Systems V, ed. G. H. Jacoby & J. Barnes, 17
- Bocchino & Bykov (2000) Bocchino, F. & Bykov, A. M. 2000, A&A, 362, L29
- Bocchino & Bykov (2003) Bocchino, F. & Bykov, A. M. 2003, A&A, 400, 203
- Bocchino et al. (2008) Bocchino, F., Krassilchtchikov, A. M., Kretschmar, P., et al. 2008, Adv. Space Res., 41, 396
- Bocchino et al. (2009) Bocchino, F., Miceli, M., & Troja, E. 2009, A&A, 498, 139
- Bocchino et al. (2001) Bocchino, F., Parmar, A. N., Mereghetti, S., et al. 2001, A&A, 367, 629
- Braun & Strom (1986) Braun, R. & Strom, R. G. 1986, A&A, 164, 193
- Burton et al. (1988) Burton, M. G., Geballe, T. R., Brand, P. W. J. L., & Webster, A. S. 1988, MNRAS, 231, 617
- Bykov et al. (2008) Bykov, A. M., Krassilchtchikov, A. M., Uvarov, Y. A., et al. 2008, ApJ, 676, 1050
- Chevalier (1999) Chevalier, R. A. 1999, ApJ, 511, 798
- Chevalier (2005) Chevalier, R. A. 2005, ApJ, 619, 839
- Colella & Woodward (1984) Colella, P. & Woodward, P. R. 1984, J. Comput. Phys., 54, 174
- Cornett et al. (1977) Cornett, R. H., Chin, G., & Knapp, G. R. 1977, A&A, 54, 889
- Cox et al. (1999) Cox, D. P., Shelton, R. L., Maciejewski, W., et al. 1999, ApJ, 524, 179
- Denoyer (1978) Denoyer, L. K. 1978, MNRAS, 183, 187
- Drake & Orlando (2010) Drake, J. J. & Orlando, S. 2010, ApJ, 720, L195
- Gaensler et al. (2006) Gaensler, B. M., Chatterjee, S., Slane, P. O., et al. 2006, ApJ, 648, 1037
- Ghavamian et al. (2007) Ghavamian, P., Laming, J. M., & Rakowski, C. E. 2007, ApJ, 654, L69
- Greco et al. (2018) Greco, E., Miceli, M., Orlando, S., et al. 2018, A&A, 615, A157
- Greco et al. (2020) Greco, E., Vink, J., Miceli, M., et al. 2020, A&A, 638, A101
- Kashyap & Drake (2000) Kashyap, V. & Drake, J. J. 2000, Bull. Astron. Soc. India, 28, 475
- Lazarian (2006) Lazarian, A. 2006, ApJ, 645, L25
- Leahy (2004) Leahy, D. A. 2004, AJ, 127, 2277
- Lee et al. (2012) Lee, J.-J., Koo, B.-C., Snell, R. L., et al. 2012, ApJ, 749, 34
- Lee et al. (2008) Lee, J.-J., Koo, B.-C., Yun, M. S., et al. 2008, AJ, 135, 796
- Matsumura et al. (2017) Matsumura, H., Tanaka, T., Uchida, H., Okon, H., & Tsuru, T. G. 2017, ApJ, 851, 73
- Matzner & McKee (1999) Matzner, C. D. & McKee, C. F. 1999, ApJ, 510, 379
- Miceli et al. (2010) Miceli, M., Bocchino, F., Decourchelle, A., Ballet, J., & Reale, F. 2010, A&A, 514, L2
- Mignone et al. (2007) Mignone, A., Bodo, G., Massaglia, S., et al. 2007, ApJS, 170, 228
- Miller & Colella (2002) Miller, G. H. & Colella, P. 2002, J. Comput. Phys., 183, 26
- Narayan & Medvedev (2001) Narayan, R. & Medvedev, M. V. 2001, ApJ, 562, L129
- Okon et al. (2020) Okon, H., Tanaka, T., Uchida, H., et al. 2020, ApJ, 890, 62
- Olbert et al. (2001) Olbert, C. M., Clearfield, C. R., Williams, N. E., Keohane, J. W., & Frail, D. A. 2001, ApJ, 554, L205
- Orlando et al. (2008) Orlando, S., Bocchino, F., Reale, F., Peres, G., & Pagano, P. 2008, ApJ, 678, 274
- Orlando et al. (2009) Orlando, S., Drake, J. J., & Laming, J. M. 2009, A&A, 493, 1049
- Orlando et al. (2019) Orlando, S., Miceli, M., Petruk, O., et al. 2019, A&A, 622, A73
- Orlando et al. (2015) Orlando, S., Miceli, M., Pumo, M. L., & Bocchino, F. 2015, ApJ, 810, 168
- Orlando et al. (2005) Orlando, S., Peres, G., Reale, F., et al. 2005, A&A, 444, 505
- Petre et al. (1988) Petre, R., Szymkowiak, A. E., Seward, F. D., & Willingale, R. 1988, ApJ, 335, 215
- Petruk (2001) Petruk, O. 2001, A&A, 371, 267
- Rho et al. (2001) Rho, J., Jarrett, T. H., Cutri, R. M., & Reach, W. T. 2001, ApJ, 547, 885
- Rho & Petre (1998) Rho, J. & Petre, R. 1998, ApJ, 503, L167
- Shelton et al. (1999) Shelton, R. L., Cox, D. P., Maciejewski, W., et al. 1999, ApJ, 524, 192
- Shinn et al. (2011) Shinn, J.-H., Koo, B.-C., Seon, K.-I., & Lee, H.-G. 2011, ApJ, 732, 124
- Slane et al. (2015) Slane, P., Bykov, A., Ellison, D. C., Dubner, G., & Castro, D. 2015, Space Sci. Rev., 188, 187
- Smith et al. (2001) Smith, R. K., Brickhouse, N. S., Liedahl, D. A., & Raymond, J. C. 2001, ApJ, 556, L91
- Snell et al. (2005) Snell, R. L., Hollenbach, D., Howe, J. E., et al. 2005, ApJ, 620, 758
- Su et al. (2014) Su, Y., Fang, M., Yang, J., Zhou, P., & Chen, Y. 2014, ApJ, 788, 122
- Swartz et al. (2015) Swartz, D. A., Pavlov, G. G., Clarke, T., et al. 2015, ApJ, 808, 84
- Tavani et al. (2010) Tavani, M., Giuliani, A., Chen, A. W., et al. 2010, ApJ, 710, L151
- Troja et al. (2008) Troja, E., Bocchino, F., Miceli, M., & Reale, F. 2008, A&A, 485, 777
- Troja et al. (2006) Troja, E., Bocchino, F., & Reale, F. 2006, ApJ, 649, 258
- Welsh & Sallmen (2003) Welsh, B. Y. & Sallmen, S. 2003, A&A, 408, 545
- White & Long (1991) White, R. L. & Long, K. S. 1991, ApJ, 373, 543
- Yamaguchi et al. (2009) Yamaguchi, H., Ozawa, M., Koyama, K., et al. 2009, ApJ, 705, L6
- Yamaguchi et al. (2018) Yamaguchi, H., Tanaka, T., Wik, D. R., et al. 2018, ApJ, 868, L35
- Zhang & Chevalier (2019) Zhang, D. & Chevalier, R. A. 2019, MNRAS, 482, 1602
- Zhang et al. (2018) Zhang, S., Tang, X., Zhang, X., et al. 2018, ApJ, 859, 141
- Zhou et al. (2011) Zhou, X., Miceli, M., Bocchino, F., Orland o, S., & Chen, Y. 2011, MNRAS, 415, 244
Appendix A SN explosion at the geometrical center of the atomic and molecular clouds
In this section we present the case with , which corresponds to an explosion centered in the cavity formed by the surrounding clouds (see Fig. 1 and Sec. 2.1). The rest of the parameters are the same as in our favourite model (see Table 1).
The evolution of the model is shown in Fig. 11 which, similarly to Fig. 2, reports the density and temperature distributions in the plane, using same scales and evolution times for comparison with the best model described in Sec. 3. The ejecta expanding through the uniform intercloud medium start to interact with the atomic and molecular clouds yr after the SN event, much later than in the best case (see Fig. 2, and Fig. 11) and the forward shock hits the clouds at the same time in all directions. As a consequence the reverse shock (powered by the interaction with the clouds) travels through the ejecta when already expanded and partially refocus slightly southern to the origin of the explosion indicated with a magenta cross (see second and third columns in Fig. 11). As a result of this evolution the remnant becomes symmetric respect to the -axis (see last column in Fig. 11).
In Figure 12 we present X-ray count rate maps synthesized (see Sec. 2.2) from the model at the same evolution times as in Fig. 11 (increasing from left to right), considering the LoS as in our best model (see Fig. 3, left panels). The X-ray emission maps of the remnant show a symmetric distribution respect to the axis of the toroidal structure (see Fig.1 and Fig. 3) due to the symmetric interaction with the clouds (see Fig. 12). This distribution does not agree with the X-ray observations (Troja et al. 2006, 2008; Bocchino et al. 2009; Greco et al. 2018) and do not reproduce the X-ray morphology of IC 443 (see left panels in Fig.9).
Appendix B XMM-Newton observations of IC 443
The source IC 443 has been observed several times with the European Photon Imaging Camera (EPIC) on board of XMM-Newton. We carried out spectral analysis of the observation performed in March 2010 (Obs-ID = 0600110101, PI: E. Troja) by considering only MOS2 data. For the aim of this work, only one camera is needed and, out of the three available, we chose MOS2 since it is the less degraded. We built count-rate images in two different energy bands following the same approach described in Sect. 2 in Greco et al. (2018), considering a bin size of 11″. We used the Science Analysis System (SAS), version 16.1.0, to perform the whole data analysis. In particular, we used the SAS tool evigweight to correct vignetting effect in the spectra; we applied the SAS tasks rmfgen and arfgen obtaining response and ancillary matrices; and we binned spectra to obtain at least 25 counts per bin. The spectral analysis has been performed with XSPEC (version 12.10.0c, Arnaud 1996).
Appendix C Online material
-
•
Movie 1: Temporal evolution of the density (first column) and the ionic temperature (second column) distributions in logarithmic scale in the plane. The second row shows the distributions considering only the ejecta. The magenta cross indicates the position of the explosion.
-
•
Movie 2: Isosurface of the distribution of density at yr for the ejecta of the favourite model for SNR IC 443. The opaque irregular isosurface corresponds to a value of density which is at 1% of the peak density; their colors give the radial velocity in units of 1000 km s-1 on the isosurface. The semi-transparent surface marks the position of the forward shock; the toroidal semi-transparent structure in purple represents the molecular cloud. A navigable 3D graphic is available at https://skfb.ly/6W9oM.
-
•
Movie 3: Isosurface of the distribution of density at yr for the ejecta of the favourite model for SNR IC 443. The opaque irregular isosurface corresponds to a value of density which is at 5% of the peak density; their colors give the radial velocity in units of 1000 km s-1 on the isosurface. The semi-transparent surface marks the position of the forward shock; the toroidal semi-transparent structure in purple represents the molecular cloud.
-
•
Movie 4: Same as Movie 2, compared with an optical observation of SNR IC 443. The transparent image passing through the center of the remnant is a wide field optical observation of the remnant. A navigable 3D graphic is available at https://skfb.ly/6X6BV. Image credit: Wide Field Optical: Bob Franke (Focal Pointe Observatory).
-
•
Movie 5: Temporal evolution of the synthetic X-ray count rate maps in the [] keV band (left panel) and [] keV band (right panel) in logarithmic scale.