Agglomerative Clustering of Handwritten Numerals to Determine Similarity of Different Languages
Abstract
Handwritten numerals of different languages have various characteristics. Similarities and dissimilarities of the languages can be measured by analyzing the extracted features of the numerals. Handwritten numeral datasets are available and accessible for many renowned languages of different regions. In this paper, several handwritten numeral datasets of different languages are collected. Then they are used to find the similarity among those written languages through determining and comparing the similitude of each handwritten numerals. This will help to find which languages have the same or adjacent parent language. Firstly, a similarity measure of two numeral images is constructed with a Siamese network. Secondly, the similarity of the numeral datasets is determined with the help of the Siamese network and a new random sample with replacement similarity averaging technique. Finally, an agglomerative clustering is done based on the similarities of each dataset. This clustering technique shows some very interesting properties of the datasets. The property focused in this paper is the regional resemblance of the datasets. By analyzing the clusters, it becomes easy to identify which languages are originated from similar regions.
Index Terms:
Handwritten Numeral, Clustering, Siamese Network, Dendrogram, SimilarityI Introduction
The evolution of writing has grown from tokens to pictography, syllabary and then alphabets. These writings have started independently in Near East, China and Mesoamerica. In different regions, different writing techniques have been developed. In the current stage, it is very difficult to analyze which handwritten numerals have been originated from similar regions.
Due to the fact of increasing tasks of handwritten numeral recognition analysis, formation of several datasets regarding this can be found for almost all the languages. This paper has tried to collect, create, organize and use these datasets to find the similarity of the writing patterns of the handwritten numerals of one dataset of a language, to the handwritten numerals of another dataset of another language. Then these similarities from one dataset to another have been resulted in an agglomerative clustering of datasets, which has revealed the visual resemblance of one dataset to another.
This whole technique does not only measure the similarity of the size and shape of each character but also takes into account other features such as the writing techniques. Writing techniques in each written digit includes where the stroke width is thin or where it is thick. This is because deep learning is used which automatically extracts as many features as possible.
The clustering of these datasets can be used to identify the origins of a particular language, or to be precise the numerals, knowing the origin of the languages of other datasets close to it. For example, if one knows the region where language ‘A’ is used, then he can know the region of languages ‘B’, ‘C’, etc if they are close to ‘A’.
The proposed methodology in this paper is divided into 2 parts. The first part is named as random sample similarity averaging to get similarity of two datasets discussed in section IV with the help of Siamese network which is created and proposed on section III. The second part is the clustering of the datasets using the similarity results of the first part which is discussed in section V.
II Literature Review
Similar work of this paper, which detect similarity of handwriting or language could not be found anywhere. So, some works the authors thought to be close is mentioned here for benchmarking the proposed methodology. Bin Zhang et al. [1] has tried to choose a dissimilarity measure on different handwriting identifications. They have characterized the identifications with the help of binary micro-features and were successful to pertain 8 dissimilarity measures.
Zhuoyao Zhong [2] has created a neural network named SpottingNet which is used to detect similarities between word images. They have used George Washington (GW) dataset [3] and have achieved 80.03% mAP.
Ghada Sokar [4] has used support vector machine (SVM) and Siamese network one-shot classification for optical character recognition (OCR) and gained almost similar result to state of the art CNN model.
In this paper, similarity is detected between language numerals (not between just two images) which is different from the works mentioned previously. In order to be general, multiple datasets of the same language are also taken.
The methodology, along with sample datasets used, experiments and results are provided in the rest of the paper. The next section discusses the proposed Siamese network architecture. Then, after discussing the two major parts of the methodology, the following sections demonstrate how the result for the selected datasets have been attained. Then the paper is concluded with some applications, critics and discussion about the work in this paper.
III Siamese Network
The working system is designed having a primary assumption. Two origins of two written languages are close if the datasets of those languages have high similarity between themselves. Usually, if two languages derive from a same older language, then the process of derivation is mostly a slight deformation of the parent language. Therefore, if two languages are very similar to each other, there is a high probability that they are slightly deformed from a same parent language. To find the similarity of two languages, first it is needed to find similarity between two numerals or images. This requires a similarity function or a measuring technique.
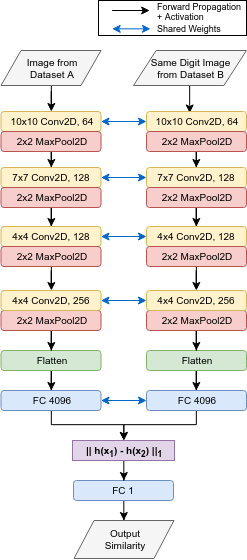
This similarity function used in this paper is a Siamese network [5] from the proposed architecture of Gregory Koch [6]. The architecture of the Siamese network is presented on figure 1. Siamese network is a network which uses two instances of a same neural network (hence called Siamese or ‘twin’) to extract a one dimensional feature vector from an image of 1 (gray-scale) or 3 channels (RGB) and then measuring the distance between the feature vectors. Convolutional Layers [7] tend to perform significantly better result on image data, so they are used in Siamese network. For each of these layers, rectified linear unit (ReLU) [8] is used as the activation function. Sigmoid [9] is used for the last two dense layers to make the output between 0 and 1. The loss function used in this experiment is Binary Cross Entropy loss function. Adam [10] optimizer is used as the optimizer of the loss function. The image input size was fixed to 105x105 gray-scale image. The training of the network is done on only one dataset of the selected numeral datasets.

IV Random sampled similarity averaging of two datasets
Siamese network will only work for two images, not for two datasets. In this part of the methodology, the technique of how the similarity of two datasets can be measured is discussed. Each dataset has a lot of images each labeled as a digit from 0 to 9. A tuple of two images is created where each image comes from the two datasets of whose similarity is needed to measure. Then the similarity of these two images is determined with the previously established similarity measuring technique in section III.
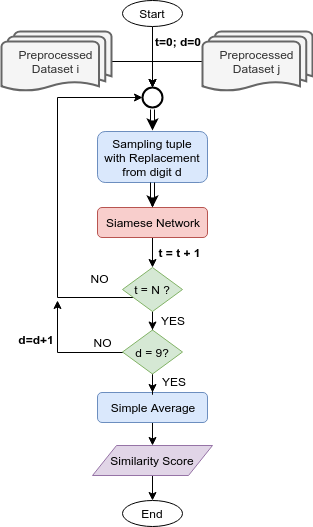
Establishing the similarity measure of two datasets depends on some more predefined parameters. The input image size is an important parameter which is selected to be 105x105. A sample size is fixed for the number of comparisons of each digit which will be done with the Siamese network. Suppose the sample size is N. For each digit, N tuples are sampled with replacement to compare and obtain the similarity with the network. Then all these values will be averaged to get the final similarity score between the two datasets. This process is iteratively continued for all combinations of the datasets taken into account. If number of datasets used is , then total number of iterations needed to compute the similarity matrix is . The whole process of measuring the similarity is demonstrated on figure 2 as a flowchart.

V Clustering of datasets
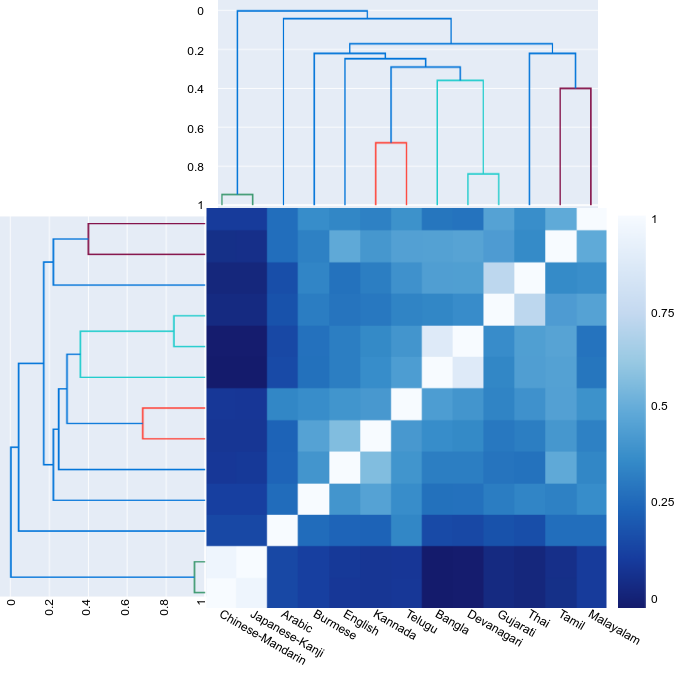
From section IV, a symmetric matrix of similarity of the used datasets is achieved. As no feature vector is generated from any dataset, the clustering is needed to be done on the basis of relative position from each other. Instead of distance, similarity measure is used for the clustering. For all these reasons, a dendrogram is used to represent the clustering. The dendrogram of the clustering is presented in figure 4.
Unweighted average linkage clustering (UPGMA) [11] is used as the linkage criterion for the clustering. This determines the similarity between clusters as an averaging function of the pairwise similarity. The similarity measuring equation is provided in 1. Here function represents the similarity of two datasets and .
| (1) |
The distance function was first chosen by inverting the similarity function. But it is observed that using the similarity function without converting it to distance function provides better result.
VI Experiments and Results
VI-A Datasets Used
All the datasets used in this paper are presented briefly in table I. As not all numeral datasets of each language is publicly available, some datasets were created for this research purpose. Siamese network is a one-shot learner, as a result smaller number of images makes negligible degradation in the expected result.
Some large datasets are created by CVPR unit, Indian Statistical Institute, Kolkata on the language Bangla and Devanagari. ISI Bangla dataset contains total 23,392 gray-scale images of Bangla handwritten numerals and ISI Devanagari dataset contains 22,556 gray-scale images. All the images are handwritten with black ink on a white background. These are gathered from postal mail pieces’ pin codes.
A comparatively lower quality of datasets are created by Computer Science and Engineering Department, Jadavpur University, Kolkata named Center for Microprocessor Application for Training Education and Research database (CMATERdb). The size of the images are all 32x32 and in bmp format. This dataset is used for Arabic, Devanagari and Telugu languages.
The authors could not find any well established dataset for Chinese, Japanese, Thai, Tamil and Malayalam numerals. Hence, they have created their own dataset by writing and collecting images from the internet. 100 images were collected for each of the datasets since not much images are needed for the methodology to work. There are a lot of variants in both Chinese and Japanese languages. For the experiment, Mandarin Chinese and Japanese Kanji are used.
| S/L | Dataset | Language | Samples Used | Sample Images | ||
| 1.a |
|
Bangla | 23,392 |
|
||
| 1.b | NumtaDB [14] | Bangla | 85,000+ |
|
||
| 2 | MNIST [15] | English | 60,000 |
|
||
| 3 | Chinese-Mandarin | Chinese | 100 |
|
||
| 4 | 278 Gujarati responses | Gujarati | 278 |
|
||
| 5 | CMATERdb 3.3.1 [16] | Arabic | 3,000 |
|
||
| 6.a | CMATERdb 3.2.1 [16] | Devanagari | 150 |
|
||
| 6.b |
|
Devanagari | 22,556 |
|
||
| 7 | Thai web collection | Thai | 100 |
|
||
| 8 | Burmese 278 responses | Burmese | 278 |
|
||
| 9 | Kannada-MNIST [17] | Kannada | 60,000 |
|
||
| 10 | Japanese-Kanji | Japanese | 100 |
|
||
| 11 |
|
Telugu | 4,000 |
|
||
| 12 | Tamil web collection | Tamil | 100 |
|
||
| 13 | Malayalam-db | Malayalam | 100 |
|
VI-B Preprocessing of Datasets
Because the preprocessing part is dependent solely on the characteristics of the images in the datasets used, this subsection is included in the experiment’s section. Firstly, some datasets (NumtaDB, Thai web collection) have a mixture of both white numeral on black background, and black numeral on white background. Because of that reason the images are classified by inspecting the histogram of the images. A sample histogram is provided in 3. It can be observed from histograms of selected images that, the background spans more area in the image than the foreground because the foreground is only the pen stroke taking a small number of pixels. So the classification is done by 2.

| (2) |
The image is transformed using equation 2 such that, the numerals are written in white colour having a black background. OTSU thresholding is applied to make the image binary. This will make the Siamese networks work easier as it has to take input of 2 intensity values (0 and 1). The images are of different sizes in different datasets. The final preprocessing step would be to resize the images to a fixed input size. We have taken the input size to be of 105 pixels width and 105 pixels height. Bilinear interpolation is used to upsample the images.
VI-C Implementation Details
The whole programming is done with the python programming language and bash shell scripting. Keras [23] and PyTorch [24] is used as the deep learning framework. Plotly [25] and Matplotlib [26] is used to visualise the figures in this paper. For the preprocessing and image resizing, OpenCV [27] is used. Numpy [28] python package is used to do all the mathematical operations such as averaging and histogram regional summation. The hierarchical clustering is done with Sci-kit learn [29] python framework. The network model is trained on a custom built PC which has CPU Intel Core i7 with 3.5 GHz speed and RAM 32 GB with GPU NVIDIA GeForce GTX 1080 Ti in a Jupyter Notebook environment.

VI-D Result Analysis
The agglomerative clustering creates a bunch of clusters of different languages based on the similarity of each other. The resulting similarity matrix is graphically presented on figure 4 where complete white represents 1 (almost identical) and dark blue represents 0 (not similar at all). Based on the matrix, the clustering is also done and the dendrogram is presented in the same figure 4.
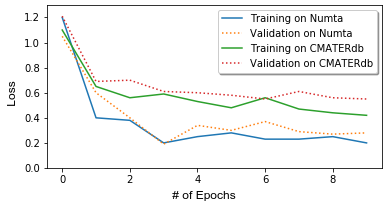
Training the Siamese network was a very important task. Generally, Siamese networks are trained until the accuracy is reached at maximum [30] without overfitting the model. But, training on a single dataset will not work for other datasets if the network is trained too much on that dataset alone. So, the authors have decided to train the network slightly less and get a low accuracy instead. This will keep the model workable on measuring similarity between different datasets. As training requires a lot of images, only few datasets are eligible for the training. NumtaDB is taken to train the Siamese network. Figure 5 shows the loss of Siamese network while training the network with NumtaDB and CMATERdb 3.4.1.

Analyzing the dendrogram on figure 4 shows that the most similar languages are Japanese Kanji and Mandarin Chinese. In fact, if the numerals are viewed one by one, it would be hard for anyone to differentiate between the two numerals of Chinese and Japanese. Then the most similar languages are Gujarati and Devanagari. This is because Gujarati language is originated from Devanagari. On the other hand, Kannada and Telugu are also very similar. The regions using these languages are very close to each other. Hence, the clustering appears to be working as assumed in the first place. Almost all the languages which are originated in Asia are observed to be merged earlier with the closer adjacent languages than other languages in the dendrogram.
VII Discussion and Conclusion
This paper has tried to identify which languages are similar to each other in different aspects. In spite of being very realistic, the resulting cluster in section VI-D has some flaws. English has merged with other Asian languages before Burmese where Burmese, Devanagari and Gujarati are more similar than English. Mandarin Chinese are Japanese Kanji seem to be very close to each other in the dendrogram. But only the numerals of the languages are same. Words are different from each other in the two languages.
This paper has tried to use only 13 different sample languages so far. For future work, more languages are considered to be included. The main focus was only on the Asian languages. English was the only language taken from continent Europe because of the global popularity and ease of collection of the dataset. Moreover, the network needs to be more tuned to fit the datasets with even more accuracy.
VIII Acknowledgement
The authors want to first express their profound gratitude and heartiest thanks to all who have inspired them for the contribution of this paper. Authors also want to thank all the people who have helped them to find and collect images of handwritten numerals of several languages. Lastly, the authors want to thank the reviewers of this paper and to the researchers on the field of machine learning for contributing to the world of knowledge.
References
- [1] S. N. S. Bin Zhang, “Binary vector dissimilarity measures for handwriting identification,” in Document Recognition and Retrieval X, vol. 5010. International Society for Optics and Photonics, 2003, pp. 28–38. [Online]. Available: https://doi.org/10.1117/12.473347
- [2] Z. Zhong, W. Pan, L. Jin, H. Mouchère, and C. Viard-Gaudin, “Spottingnet: learning the similarity of word images with convolutional neural network for word spotting in handwritten historical documents,” in 2016 15th International Conference on Frontiers in Handwriting Recognition (ICFHR). IEEE, 2016, pp. 295–300.
- [3] T. M. Rath and R. Manmatha, “Word image matching using dynamic time warping,” in 2003 IEEE Computer Society Conference on Computer Vision and Pattern Recognition, 2003. Proceedings., vol. 2. IEEE, 2003, pp. II–II.
- [4] G. Sokar, E. E. Hemayed, and M. Rehan, “A generic ocr using deep siamese convolution neural networks,” in 2018 IEEE 9th Annual Information Technology, Electronics and Mobile Communication Conference (IEMCON). IEEE, 2018, pp. 1238–1244.
- [5] J. Bromley, I. Guyon, Y. LeCun, E. Säckinger, and R. Shah, “Signature verification using a” siamese” time delay neural network,” in Advances in neural information processing systems, 1994, pp. 737–744.
- [6] G. Koch, R. Zemel, and R. Salakhutdinov, “Siamese neural networks for one-shot image recognition,” in ICML deep learning workshop, vol. 2, 2015.
- [7] Y. LeCun, Y. Bengio et al., “Convolutional networks for images, speech, and time series,” The handbook of brain theory and neural networks, vol. 3361, no. 10, p. 1995, 1995.
- [8] B. Xu, N. Wang, T. Chen, and M. Li, “Empirical evaluation of rectified activations in convolutional network,” arXiv preprint arXiv:1505.00853, 2015.
- [9] J. Han and C. Moraga, “The influence of the sigmoid function parameters on the speed of backpropagation learning,” in International Workshop on Artificial Neural Networks. Springer, 1995, pp. 195–201.
- [10] D. P. Kingma and J. Ba, “Adam: A method for stochastic optimization,” arXiv preprint arXiv:1412.6980, 2014.
- [11] R. R. Sokal, “A statistical method for evaluating systematic relationships,” Univ. Kansas, Sci. Bull., vol. 38, pp. 1409–1438, 1958.
- [12] U. Bhattacharya and B. B. Chaudhuri, “Handwritten numeral databases of indian scripts and multistage recognition of mixed numerals,” IEEE transactions on pattern analysis and machine intelligence, vol. 31, no. 3, pp. 444–457, 2008.
- [13] U. Bhattacharya and B. Chaudhuri, “Databases for research on recognition of handwritten characters of indian scripts,” in Eighth International Conference on Document Analysis and Recognition (ICDAR’05). IEEE, 2005, pp. 789–793.
- [14] S. Alam, T. Reasat, R. M. Doha, and A. I. Humayun, “Numtadb-assembled bengali handwritten digits,” arXiv preprint arXiv:1806.02452, 2018.
- [15] L. Deng, “The mnist database of handwritten digit images for machine learning research [best of the web],” IEEE Signal Processing Magazine, vol. 29, no. 6, pp. 141–142, 2012.
- [16] N. Das, J. M. Reddy, R. Sarkar, S. Basu, M. Kundu, M. Nasipuri, and D. K. Basu, “A statistical–topological feature combination for recognition of handwritten numerals,” Applied Soft Computing, vol. 12, no. 8, pp. 2486–2495, 2012.
- [17] V. U. Prabhu, “Kannada-mnist: A new handwritten digits dataset for the kannada language,” arXiv preprint arXiv:1908.01242, 2019.
- [18] N. Das, R. Sarkar, S. Basu, M. Kundu, M. Nasipuri, and D. K. Basu, “A genetic algorithm based region sampling for selection of local features in handwritten digit recognition application,” Applied Soft Computing, vol. 12, no. 5, pp. 1592–1606, 2012.
- [19] N. Das, K. Acharya, R. Sarkar, S. Basu, M. Kundu, and M. Nasipuri, “A novel ga-svm based multistage approach for recognition of handwritten bangla compound characters,” in Proceedings of the International Conference on Information Systems Design and Intelligent Applications 2012 (INDIA 2012) held in Visakhapatnam, India, January 2012. Springer, 2012, pp. 145–152.
- [20] N. Das, S. Basu, R. Sarkar, M. Kundu, M. Nasipuri, and D. Basu, “Handwritten bangla compound character recognition: Potential challenges and probable solution.” in IICAI, 2009, pp. 1901–1913.
- [21] N. Das, S. Basu, R. Sarkar, M. Kundu, M. Nasipuri et al., “An improved feature descriptor for recognition of handwritten bangla alphabet,” arXiv preprint arXiv:1501.05497, 2015.
- [22] N. Das, K. Acharya, R. Sarkar, S. Basu, M. Kundu, and M. Nasipuri, “A benchmark image database of isolated bangla handwritten compound characters,” International Journal on Document Analysis and Recognition (IJDAR), vol. 17, no. 4, pp. 413–431, 2014.
- [23] F. Chollet, “Keras documentation,” keras. io, 2015.
- [24] A. Paszke, S. Gross, S. Chintala, G. Chanan, E. Yang, Z. DeVito, Z. Lin, A. Desmaison, L. Antiga, and A. Lerer, “Automatic differentiation in pytorch,” in NIPS-W, 2017.
- [25] P. T. Inc. (2015) Collaborative data science. Montreal, QC. [Online]. Available: https://plot.ly
- [26] J. D. Hunter, “Matplotlib: A 2d graphics environment,” Computing in Science & Engineering, vol. 9, no. 3, pp. 90–95, 2007.
- [27] G. Bradski, “The OpenCV Library,” Dr. Dobb’s Journal of Software Tools, 2000.
- [28] T. Oliphant, “NumPy: A guide to NumPy,” USA: Trelgol Publishing, 2006–, [Online; accessed ¡today¿]. [Online]. Available: http://www.numpy.org/
- [29] F. Pedregosa, G. Varoquaux, A. Gramfort, V. Michel, B. Thirion, O. Grisel, M. Blondel, P. Prettenhofer, R. Weiss, V. Dubourg, J. Vanderplas, A. Passos, D. Cournapeau, M. Brucher, M. Perrot, and E. Duchesnay, “Scikit-learn: Machine learning in python,” J. Mach. Learn. Res., vol. 12, pp. 2825–2830, Nov. 2011. [Online]. Available: http://dl.acm.org/citation.cfm?id=1953048.2078195
- [30] M. Hermans and B. Schrauwen, “Training and analysing deep recurrent neural networks,” in Advances in Neural Information Processing Systems 26, C. J. C. Burges, L. Bottou, M. Welling, Z. Ghahramani, and K. Q. Weinberger, Eds. Curran Associates, Inc., 2013, pp. 190–198. [Online]. Available: http://papers.nips.cc/paper/5166-training-and-analysing-deep-recurrent-neural-networks.pdf