[a]S. Neshatpour
Searching for New Physics with
Abstract
One of the main indications for New Physics in rare -decays is deduced from the tension between experimental and Standard Model predictions of the angular analysis of the decay. There are however possible non-local hadronic effects which in principle can also explain these tensions. In this work, we consider a statistical approach for differentiating the source of the tension in observables and we also investigate the prospects of such a comparison with future data from the LHCb experiment.
1 Introduction
The tensions between the experimental measurements and the Standard Model (SM) predictions of the angular observables in the decay [1] at more than was the first in a series of deviations in transition. These so-called “-anomalies” have also been measured in lepton flavour violating observables and (with a significance of more than ) for which very precise theoretical predictions are available due to cancellation of hadronic quantities. Unlike the deviations in the ratios which cannot be explained by underestimated hadronic effects, the tensions in the angular observables of may be described by non-local long-distance effects which in principle can mimic (as well as ) New Physics (NP) effects. This is readily visible by considering that both short-distance NP effects in (and ), and non-factorisable hadronic effects contribute to the vectorial helicity amplitude
| (1) |
where denotes the helicity of the -meson and corresponds to non-factorisable four-quark and chromomagnetic contributions. While the leading non-factorisable contributions are calculated within QCD factorisation (QCDf), the higher powers are not calculable within this framework and are often “guesstimated”.
The significance of NP fits involving observables are hence dependent on the assumptions made for the size of the hadronic contributions [2]. There have been theoretical calculations of the power corrections within the LCSR formalism [3] together with exploring the analyticity of the amplitude [4] with recent results [5] suggesting a smaller size compared to the previous calculations [3]. The power corrections can alternatively be directly fitted to the data [6, 7]. For the latter approach, we make a statistical comparison with the NP fit to the same data. However, to be able to make such a comparison, the two scenarios should be embedded [7]. The most general description of unknown power corrections (up to higher order terms in ) which respects the analyticity structure of the amplitude is given by [8]
| (2) | ||||
where considering the nine parameters to be complex, is altogether described by eighteen free parameters. With such a description, the scenario with contributions to is indeed embedded in this hadronic description.
We also suggest another description of the power corrections which offers the embedding of NP contributions to with a smaller number of parameters [9]
| (3) |
where for each helicity, is described by one real free parameter (or two parameters, if assumed to be complex). With this three (six) parameter description, there is a better chance of getting a meaningful statistical comparison with the NP fit. Although this minimal description might not be adequate for describing a general behaviour of the hadronic contributions, it can capture the distinct behaviours for the three different helicities (unlike the NP contribution which is the same for all three helicities) and hence it can be used as a null test for NP.
2 NP and hadronic fits to recent data on observables
We use the latest LHCb angular analysis of with 4.7 fb-1 of data [10] together with its branching ratio in the low -bins below the charm resonances as well as the branching ratio of , resulting in overall 47 observables (see Ref. [9] for more details). We have used SuperIso 4.1 [11] for calculating the observables resulting in . We first consider NP fits with contribution to assuming it to be real or complex (see Table 1) with no uncertainty from power corrections.
| observables | () | ||
|---|---|---|---|
| best-fit value | PullSM | ||
| (real) | |||
| (complex) | |||
In the next step we make two hadronic fits considering the 18 parameter description of Eq. 2 and the 6 parameter description of Eq. 3. In the 18 parameter fit, although the central values of the fitted parameters are non-zero, they are compatible with zero at the level (see left panel of Table 2). This can be understood by the large number of free parameters which cannot be strongly constrained with the current data.
| observables | ||
|---|---|---|
| () | ||
| Real | Imaginary | |
| observables | |
|---|---|
| () | |
| best-fit value | |


A potential solution to overcome this is by considering a hadronic description with fewer free parameters as given in Eq. 3. Here, the fitted central values for the three different helicities are not the same (see right panel of Table 2), hinting that would not be able to offer a similarly good description, however, the fitted parameters are compatible with each other at level and hence with the current data no conclusive judgment can be made.
The NP and the hadronic fits both give better descriptions of the data compared to the SM, as can be seen at the observable level in Figure 1 for and . Besides the significance of the improvement of each of the fits compared to the SM which is at the level of and more, we can also make statistical comparisons between the NP and the hadronic fits as the former is embedded in the latter. From the second row of Table 3, we can see that by adding 5 (17) more parameters compared the NP explanation there is only a slight improvement with significances of less than . This is a strong indication that with the current data, the NP interpretation is a valid option, although with the current data, the situation remains inconclusive.
| observables; low- bins up to 8 GeV2 | ||||
|---|---|---|---|---|
| nr. of free | 1 | 2 | 6 | 18 |
| parameters | ||||
| 0 (plain SM) | ||||
| 1 (Real ) | — | |||
| 2 (Comp. ) | — | — | ||
| 6 (Comp. ) | — | — | — | |
3 Future projections
We consider future projections of our statistical comparisons for three benchmark cases with an integrated luminosity of 13.9/fb at the end of Run 2, as well as 50/fb at the end of the first upgrade and finally 300/fb at the end of the second LHC upgrade (see Ref. [9] for further details). Keeping present central values, the three benchmark cases do not give acceptable fits (with -values). Instead, we assume two extreme (but equally well-justified) scenarios where we consider the experimental data such that: A) the central value of fit to remains the same B) the central values of the hadronic fit remain the same.
In Table 4 we give the improvement of the fits compared to the SM and also compare the hadronic and NP fits with each other via the Wilks’ test. In the left panel, within scenario A, by construction, the NP fit has a PullSM of more than significance already with 13.9/fb luminosity. Since the NP fit is embedded in the hadronic fit we also get very good fits for the latter. However, there is no improvement compared to the NP description, and looking into the fitted values for the 18 parameters, we can see that the uncertainties of most of them are very large indicating they are not needed to describe the data. On the other hand, in scenario B as given in the table on the right, with 13.9/fb luminosity both the NP and the hadronic fits have large PullSM, and while the hadronic fit gives a better description with significance, the -value of the NP fit is also good and the situation remains inconclusive. It is only with the 50/fb projection that the hadronic description is significantly better than the NP one and also the latter has a very small -value.
| Central value of fit to remains the same | ||||||
| luminosity | 13.9 fb-1 | 50 fb-1 | 300 fb-1 | |||
| plain SM | ||||||
| Real | — | — | — | |||
| Central values of the hadronic fit remain the same | ||||||
| luminosity | 13.9 fb-1 | 50 fb-1 | 300 fb-1 | |||
| plain SM | ||||||
| Real | — | — | — | |||
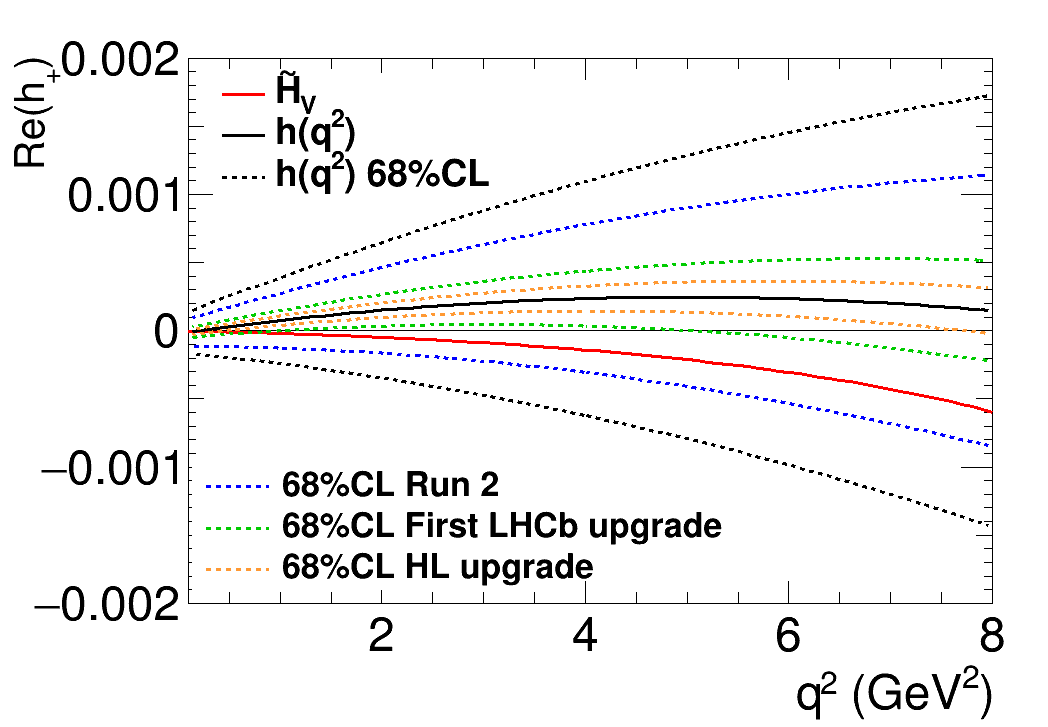
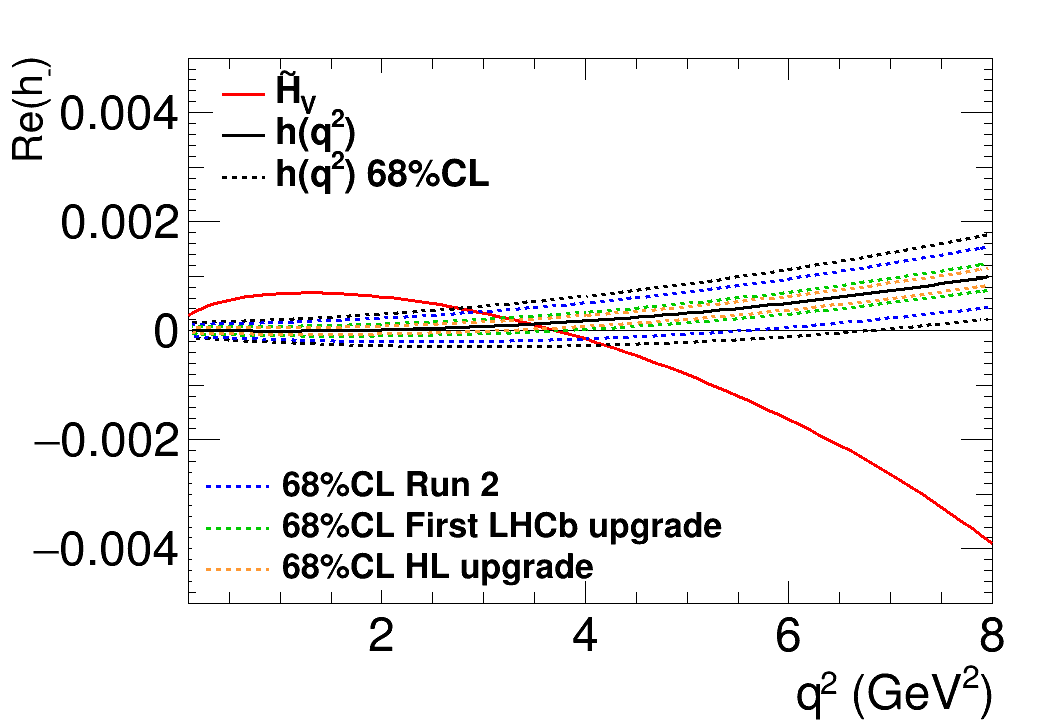
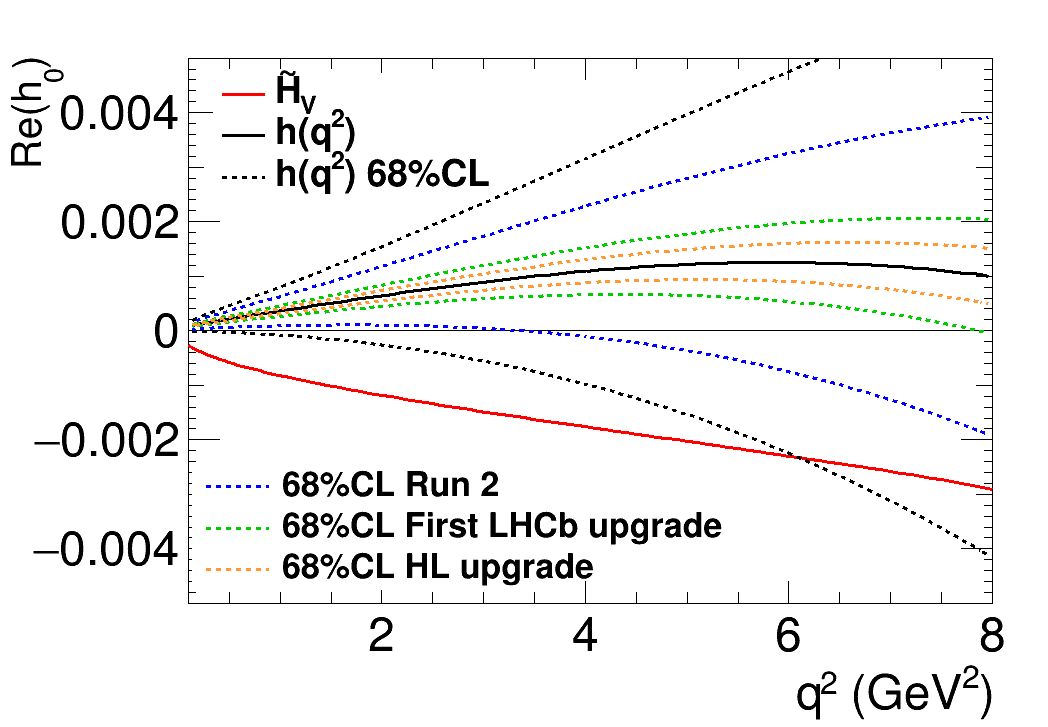
The central value and the corresponding 68% confidence level regions of the hadronic fit projections for the three benchmark cases of scenario B are shown in Figure 2. It is only after the first LHCb upgrade that the fitted parameters are no longer consistent with zero.


4 Conclusions
A data-driven approach to clarify whether the source of tensions in is due to underestimated hadronic corrections or genuine New Physics effect is by considering the statistical comparison between fits of these two explanations to the data. In this study, we used two statistical tests to make comparisons and found out that while with the current data a conclusive judgment is not possible, with future data there is a good chance of disentangling the source of the anomalies, especially after the first LHCb upgrade.
References
- [1] LHCb collaboration, R. Aaij et al., Measurement of Form-Factor-Independent Observables in the Decay , Phys. Rev. Lett. 111 (2013) 191801, [arXiv:1308.1707].
- [2] T. Hurth, F. Mahmoudi and S. Neshatpour, On the anomalies in the latest LHCb data, Nucl. Phys. B909 (2016) 737–777, [arXiv:1603.00865].
- [3] A. Khodjamirian, T. Mannel, A. A. Pivovarov and Y. M. Wang, Charm-loop effect in and , JHEP 09 (2010) 089, [arXiv:1006.4945].
- [4] M. Chrzaszcz, A. Mauri, N. Serra, R. Silva Coutinho and D. van Dyk, Prospects for disentangling long- and short-distance effects in the decays , JHEP 10 (2019) 236, [arXiv:1805.06378].
- [5] N. Gubernari, D. van Dyk and J. Virto, “Non-local matrix elements in ,” [arXiv:2011.09813].
- [6] M. Ciuchini, M. Fedele, E. Franco, S. Mishima, A. Paul, L. Silvestrini and M. Valli, decays at large recoil in the Standard Model: a theoretical reappraisal, JHEP 06 (2016), 116 JHEP 06 (2016) 116, [arXiv:1512.07157].
- [7] V. G. Chobanova, T. Hurth, F. Mahmoudi, D. Martinez Santos and S. Neshatpour, Large hadronic power corrections or new physics in the rare decay ?, JHEP 07 (2017) 025, [arXiv:1702.02234].
- [8] A. Arbey, T. Hurth, F. Mahmoudi and S. Neshatpour, Hadronic and New Physics Contributions to Transitions, Phys. Rev. D98 (2018) 095027, [arXiv:1806.02791].
- [9] T. Hurth, F. Mahmoudi and S. Neshatpour, “Implications of the new LHCb angular analysis of : Hadronic effects or new physics?,” Phys. Rev. D102 (2020) 055001, [arXiv:2006.04213].
- [10] LHCb collaboration, R. Aaij et al., Measurement of -averaged observables in the decay, Phys. Rev. Lett. 125 (2020) 011802, [arXiv:2003.04831].
- [11] F. Mahmoudi, SuperIso: A Program for calculating the isospin asymmetry of in the MSSM, Comput. Phys. Commun. 178 (2008) 745–754, [arXiv:0710.2067]; F. Mahmoudi, SuperIso v2.3: A Program for calculating flavor physics observables in Supersymmetry, Comput. Phys. Commun. 180 (2009) 1579–1613, [arXiv:0808.3144]; F. Mahmoudi, SuperIso v3.0, flavor physics observables calculations: Extension to NMSSM, Comput. Phys. Commun. 180 (2009) 1718–1719.