MAGIC observations of the nearby short gamma-ray burst GRB 160821B
Abstract
The coincident detection of GW170817 in gravitational waves and electromagnetic radiation spanning the radio to MeV gamma-ray bands provided the first direct evidence that short gamma-ray bursts (GRBs) can originate from binary neutron star (BNS) mergers. On the other hand, the properties of short GRBs in high-energy gamma rays are still poorly constrained, with only 20 events detected in the GeV band, and none in the TeV band. GRB 160821B is one of the nearest short GRBs known at . Recent analyses of the multiwavelength observational data of its afterglow emission revealed an optical-infrared kilonova component, characteristic of heavy-element nucleosynthesis in a BNS merger. Aiming to better clarify the nature of short GRBs, this burst was automatically followed up with the MAGIC telescopes, starting from 24 seconds after the burst trigger. Evidence of a gamma-ray signal is found above 0.5 TeV at a significance of during observations that lasted until 4 hours after the burst. Assuming that the observed excess events correspond to gamma-ray emission from GRB 160821B, in conjunction with data at other wavelengths, we investigate its origin in the framework of GRB afterglow models. The simplest interpretation with one-zone models of synchrotron-self-Compton emission from the external forward shock has difficulty accounting for the putative TeV flux. Alternative scenarios are discussed where the TeV emission can be relatively enhanced. The role of future GeV-TeV observations of short GRBs in advancing our understanding of BNS mergers and related topics is briefly addressed.
[0000-0001-8307-2007]V. A. Acciari
1 Introduction
Gamma-ray bursts (GRBs) are brief but extremely luminous flashes of radiation that occur at cosmological distances. Their prompt emission is observed primarily as keV-MeV photons with durations ranging from milliseconds to minutes. This is accompanied by afterglow emission that fades more gradually over timescales of hours to months and covers a much broader range of wavelengths compared to the prompt emission. The prompt emission is believed to arise from transient, ultrarelativistic jets triggered by cataclysmic events involving neutron stars or stellar-mass black holes. The nature of the afterglow is well understood as non-thermal emission produced by electrons accelerated in external shocks, driven by the interaction of the jet with the ambient medium (Kumar & Zhang 2015 and references therein).
Although GRB afterglows have frequently been observed to span the radio to GeV bands, they had eluded detection in TeV gamma rays for a long time, despite numerous searches over many decades. A detection in the TeV band was finally achieved for GRB 190114C with the Major Atmospheric Gamma Imaging Cherenkov (MAGIC) telescopes, starting from 60 seconds after the burst in the energy range 0.2-1 TeV and beyond, which provided the first strong evidence for inverse Compton emission from the afterglow (Mirzoyan et al., 2019; MAGIC Collaboration et al., 2019a, b), as well as new constraints on Lorentz invariance violation (Acciari et al., 2020). The detection of gamma rays with energies above 0.1 TeV with the High Energy Stereoscopic System (H.E.S.S.) telescopes was later reported for GRB 180720B from 10 hours after the burst (Abdalla et al., 2019), and GRB 190829A from 4 hours after the burst (de Naurois & H. E. S. S. Collaboration, 2019).
The duration and spectra of GRB prompt emission exhibit a bimodal distribution that indicates two different classes of events. With denoting the time interval containing 90% of the prompt photon counts, long GRBs with durations 2 s, which include GRB 190114C and GRB 180720B, are widely acknowledged to be generated during the core collapse of massive stars (Woosley & Bloom, 2006). The origin of short GRBs with 2 s has been less certain. Mergers of binary neutron stars (BNS) were long suspected and supported by circumstantial evidence (Berger, 2014). An infrared excess observed in the afterglow of GRB 130603B, a short GRB at , was interpreted as emission from a kilonova (or macronova, hereafter simply kilonova) (Tanvir et al., 2013), a distinctive signature of a BNS merger powered by associated r-process nucleosynthesis of heavy elements (Metzger, 2019) 111Candidate kilonovae have also been found in retrospective searches in past short GRBs (Jin et al., 2018, 2020; Rossi et al., 2020).. However, strong evidence for a BNS origin of short GRBs was lacking until recently. Decisive progress occurred with the discovery of GW170817 in gravitational waves, in coincidence with GRB 170817A and the optical-infrared transient AT2017gfo, ascertained to be a kilonova (Abbott et al., 2017). Together with radio evidence for a collimated outflow (Mooley et al., 2018; Ghirlanda et al., 2019), these observations provided the first strong indication that a BNS merger indeed triggers a short GRB (Nakar 2019 and references therein).
Nevertheless, the properties of short GRBs remain much less understood compared to long GRBs, particularly their emission at energies above the GeV band. Of the 186 GRBs detected by the Large Area Telescope aboard the Fermi Gamma-Ray Space Telescope (Fermi-LAT; Atwood et al. 2009) from August 2008 until August 2018, only 17 are short GRBs (Ajello et al., 2019a). Of the latter, only GRB 090510, a bright event at , has a measured redshift (Ackermann et al., 2010). No detection of TeV-band gamma rays from a short GRB has been reported to date.
GRB 160821B is a short GRB discovered by the Burst Alert Telescope of the Neil Gehrels Swift Observatory (Swift-BAT; Gehrels et al. 2004; Barthelmy et al. 2005) and the Fermi Gamma-ray Burst Monitor (Fermi-GBM; Meegan et al. 2009). It is identified with a host galaxy at , making it one of the nearest short GRBs known. Recent analysis and modeling of the multiwavelength data of this GRB covering the radio to X-ray bands by two independent groups revealed good evidence for a kilonova superposed on its non-thermal afterglow emission (Troja et al., 2019; Lamb et al., 2019). So far it is the best sampled kilonova without a gravitational wave detection. However, while both groups agree on the presence of a kilonova, the detailed interpretation and inferred properties of the non-thermal afterglow as well as the kilonova differ quite significantly between the two groups.
Aiming to better understand the properties of short GRBs at energies above a few tens of GeV, follow-up observations of GRB 160821B were conducted with MAGIC telescopes. The low redshift of the burst is particularly important at these energies, as it mitigates the effect of photon attenuation due to interactions with the extragalactic background light (Dwek & Krennrich 2013 and references therein). As the limited field of view of Cherenkov telescopes such as MAGIC preclude finding GRBs on their own, the standard strategy is automated follow-up of GRBs that are identified, localized and alerted by wide-field satellite instruments, which entails a time delay until the start of the observations. Within the MAGIC GRB follow-up program (Berti et al., 2019), the observation of GRB 160821B automatically started 24 seconds after the burst trigger, the shortest delay realized so far (13 seconds until MAGIC received the alert plus 11 seconds for the response of the telescopes).
An excess of gamma rays is found at the GRB position above 500 GeV during the observations that continued until 4 hours after the burst. This paper reports the results of these observations, together with interpretations of the multiwavelength data based on detailed numerical modeling of the non-thermal afterglow emission.
Section 2 presents an overview of the observations of this GRB with MAGIC, Fermi and other facilities. Section 3 describes the results of the data analysis for Fermi-LAT and MAGIC. Section 4 discusses the theoretical interpretations of these results, in combination with multiwavelength data. We summarize in Section 5.
2 Observations
2.1 Radio to GeV Gamma-ray Observations
GRB 160821B triggered the Swift-BAT detector at 22:29:13 UT on 21 August 2016 (hereafter ; Siegel et al. 2016). With the reported burst duration , the event is classified as a short GRB. The spectrum of the prompt emission in the keV-MeV range is described by a power-law with an exponential high-energy cutoff, with photon index , peak energy keV and fluence (Palmer et al., 2016). The prompt emission was also detected by Fermi-GBM at the same trigger time as Swift-BAT, with (Stanbro et al. 2016; refined later to ; von Kienlin et al. 2020.) The spectrum is fit with a cutoff power-law function 222https://heasarc.gsfc.nasa.gov/W3Browse/fermi/fermigbrst.html with keV and fluence . A host galaxy was identified (Xu et al., 2016) with spectroscopic redshift (Levan et al., 2016; Troja et al., 2019; Lamb et al., 2019), making this one of the nearest short GRBs to date. With this redshift, the isotropic energy is estimated to be erg, which is toward the low end of the known distribution for short GRBs, but not unusual (Berger, 2014).
At the time of the GBM trigger, the burst was near the border of the standard field of view (FoV) of Fermi-LAT ( 60 degrees). No emission was detected by LAT in the energy range 0.3-3 GeV (See 3.1 for more details).
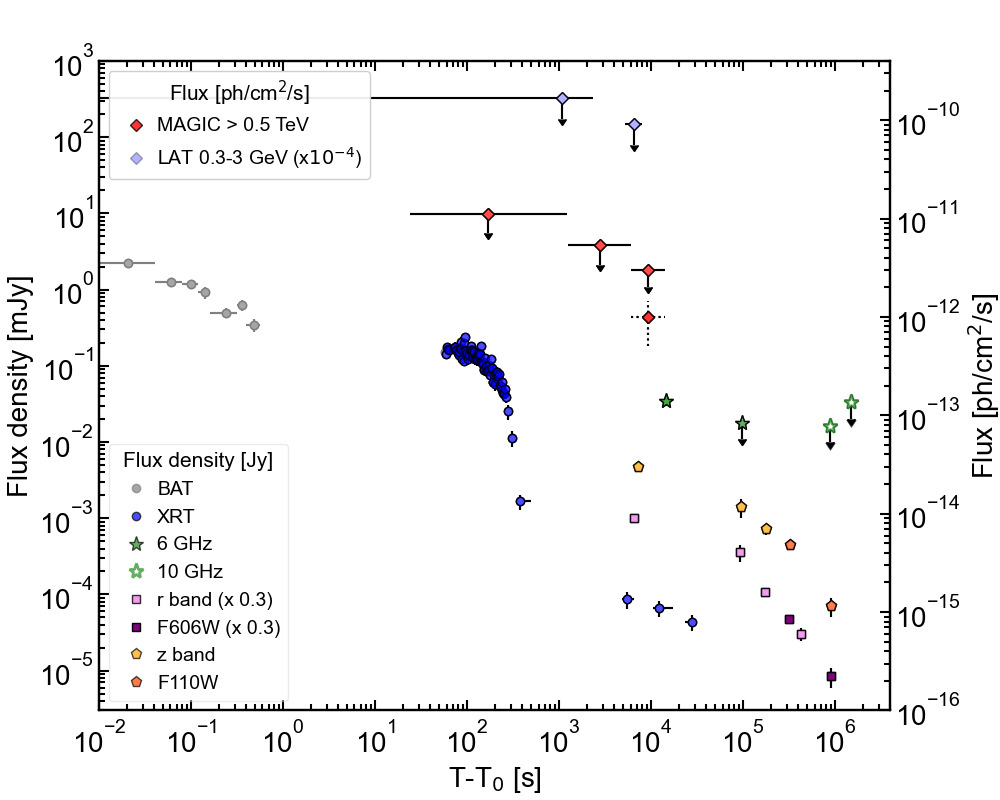
Follow-up observations were performed in the radio, optical and X-ray bands (see corresponding light curves in Fig. 1). Swift X-Ray Telescope (XRT) (Burrows et al., 2005) started observations 57 s after the BAT trigger. The X-ray light curve, retrieved from the public on-line repository (Evans et al., 2009), reveals complex behavior, with an initial plateau followed by a steep decay. After s, a more commonly observed type of decay is seen, with , where is time since (Troja et al., 2019).
The optical afterglow was first reported by the Nordic Optical Telescope (Xu et al., 2016), and confirmed by the William Herschel Telescope (Levan et al., 2016), Gran Telescopio Canarias (Jeong et al., 2016), and the Hubble Space Telescope (Troja et al., 2016). Observations at different epochs confirmed that the optical source was fading, with a reported magnitude mag at 0.95 hours after . The GRB is located in the outskirts of the host spiral galaxy, at 15 kpc projected distance from its center (Troja et al., 2019; Lamb et al., 2019). In the radio band, VLA (6 GHz) detected a fading source consistent with an afterglow (Fong et al., 2016).
2.2 MAGIC Observations and Data Analysis
MAGIC is a system composed of two imaging air Cherenkov telescopes, both with a mirror diameter of 17 m. The system is located at 2200 m above sea level, at the Roque de Los Muchachos Observatory in La Palma, Canary Islands, Spain. The integral sensitivity of the system is 0.66% of the Crab Nebula flux above 220 GeV with a 50-hour observation (Aleksić et al., 2016).
MAGIC started observing GRB 160821B at the Swift-BAT position (RA: +18h 39m 57s; Dec: +62d 23m 34s) on 21 August 2016, 22:29:37 UT, 24 seconds after . The observation started from a zenith angle of 34 degrees, and continued until 4 hours after (22 Aug, 2:29 UTC), reaching a zenith angle of 55 degrees. The level of the night sky background (NSB) light was relatively high, due to the presence of the Moon. The NSB quickly increased during the observations as the Moon rose, ranging from 2 to 8 times the level during dark nights (Ahnen et al., 2017). The first 1.7 hours of the data (until 0:10 UTC) were strongly affected by clouds, while the remaining 2.2 hours were taken under better weather conditions. The atmospheric transmission was measured using a LIDAR facility installed at the MAGIC site (Fruck & Gaug, 2015). In the first part of the observation, the transmission at a height of 9 km fluctuated between 40%-70% (average 60%) relative to that in good weather conditions, which prevented the use of standard analysis procedures. On the other hand, this was above 85% during the latter part, where the data quality was good enough for standard analysis with corrections for the transmission. Since the data for the first hours are potentially crucial for clarifying the physics of GRBs, we applied a dedicated analysis to recover this data, as described below.
The data analysis was performed entirely with the MAGIC standard analysis package called MARS (Zanin et al., 2013). The telescope performance, such as the sensitivity, energy threshold, and systematic errors for observations performed under nominal conditions can be found in Aleksić et al. (2016). In this analysis, however, we used dedicated software configurations optimized for high NSB levels. The description and performance study of this method can be found in Ahnen et al. (2017). After calibration of the data, we applied a more stringent image cleaning procedure compared to standard ones to remove a larger amount of spurious signals. As a consequence, the energy threshold is increased. We used data from known, bright gamma-ray sources (Crab Nebula, Mrk 421) observed under similar conditions (NSB and atmospheric transmission) to optimize the analysis cuts, in accordance with expected changes in the shower image parameters. The best sensitivity was obtained with a cut corresponding to an energy of 0.8 TeV. Thus, we used this threshold in order to maximize the sensitivity and search for possible signals.
3 Results
3.1 Fermi-LAT Results
The data were selected from a region of interest (RoI) of 12 degrees centered on the best GRB position provided by Swift-XRT. We analyzed the data up to 10000 seconds after , considering a zenith angle cut of 100 degrees to avoid Earth limb photons. A non-standard FoV limit of 70 degrees (in contrast to the normal 60 degrees) was chosen in order to account for all analyzable data, including the entire RoI of 12 degrees at the earliest times, when GRB 160821B was at a boresight angle of 61 degrees. The source went outside the Fermi-LAT FoV at + 2315 s. During this first interval, the source was mainly around the border of the FoV of the instrument due to a previous automatic re-pointing request in the direction of GRB 160821A (Longo et al., 2016a, b). It later reentered the FoV from + 5285 s up to s, following the standard survey mode, moving in the LAT FoV from 70 degrees down to 10 degrees with respect to the boresight.
No hints of a detection were registered, and upper limits were derived adopting a Bayesian approach. Pass8 Source data (Atwood et al., 2013) in the energy range 0.3 - 3 GeV were selected and analysed with the unbinned likelihood method, similar to that for the Second LAT GRB Catalog (Ajello et al., 2019b), using the FermiTools package version 1.2.1333Data and software are available from the Fermi Science Support Center https://fermi.gsfc.nasa.gov/ssc/data/, and the corresponding instrument response functions P8R3_SOURCE_V2. The GRB was modeled as a point-like source, having a fixed power-law spectrum with photon index -2. The spectral parameters of other sources were kept fixed to those derived from the 4FGL catalog (Abdollahi et al., 2020). For the background modeling, appropriate isotropic extragalactic and Galactic models iso_P8R3_SOURCE_V2_v1.txt, gll_iem_v07.fits444The background models are available at https://fermi.gsfc.nasa.gov/ssc/data/access/lat/BackgroundModels.html were employed. Two main time intervals were considered during which the source was in the FoV, from to s and from + 5285 s to s. The resulting upper limits in the 0.3 - 3 GeV energy band are respectively and .
3.2 MAGIC Results
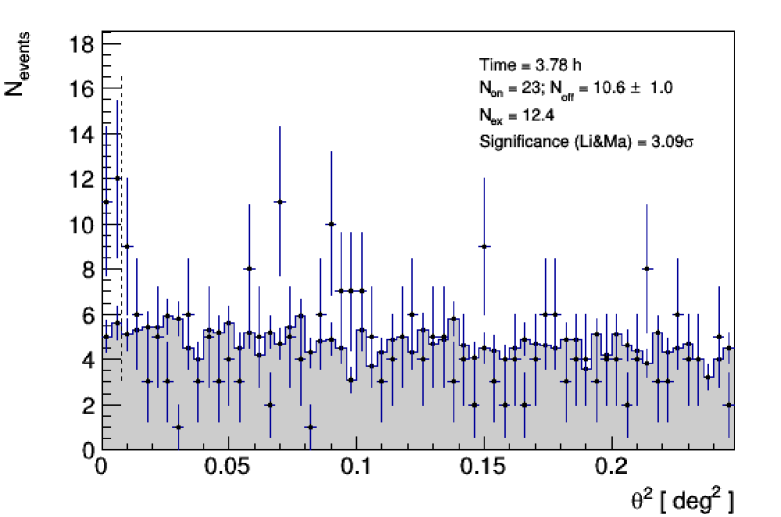
The excess significance at the GRB position observed by MAGIC is 3.1 (pre-trial). It is derived using the prescription of eq. 17 of Li & Ma (1983), based on the distribution of the squared angular distance () between the reconstructed source position and the nominal source position (Fig. 2). We tested two analysis cuts used for MAGIC data, the cut described above and an alternative cut that is optimized for low energy events, so that a trial factor of 2 should be considered, leading to a corrected significance value of 2.9 .
We also computed a significance sky map of the observation (Fig. 3) and found a spot with high significance (4.7 pre-trial) 0.05 deg away from the GRB position. The post-trial significance of seeing such a hot spot at any place in the sky map is 3.0 (1232 trials). Since this hot spot is close to the GRB position, we discuss whether it can be a possible signal from the GRB that appears displaced from its actual position.
The systematic error in the telescope pointing is typically 0.02 degrees and maximally 0.03 degrees even with strong wind gusts. Thus the offset of 0.05 degrees cannot be attributed to the telescope pointing alone. We also checked in the 4FGL catalog (Abdollahi et al., 2020) that there are no previously known GeV gamma-ray sources within 1 deg around the spot that could be potential TeV emitters.
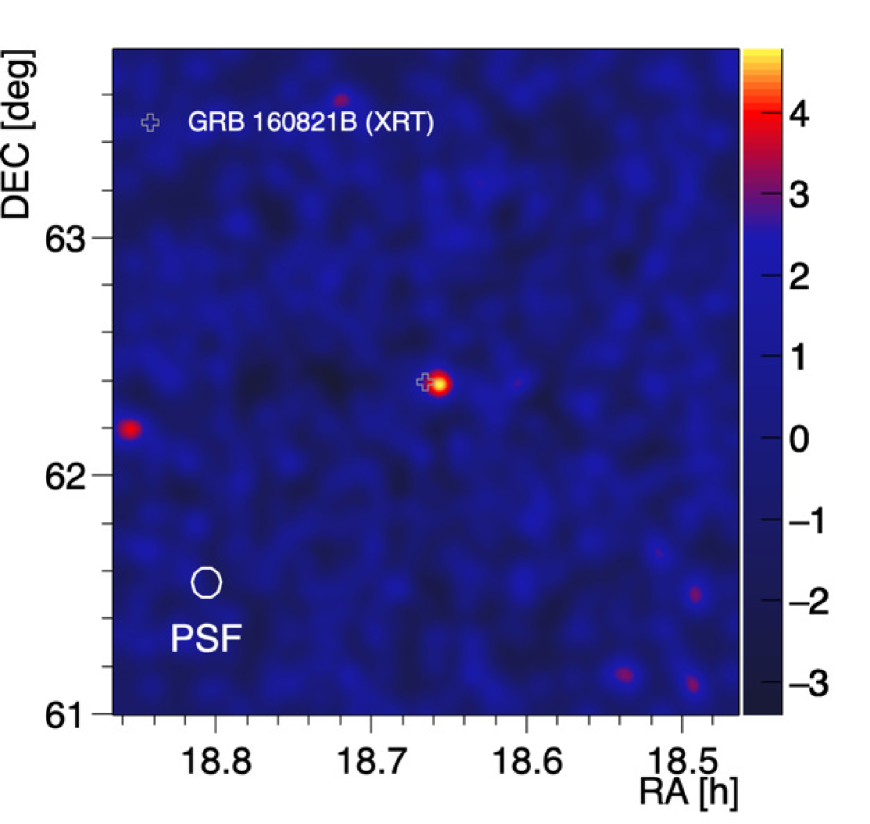
We considered possible shifts of the reconstructed source position for a weak source embedded in a background that is fluctuating at a comparable level. We performed a Monte Carlo study simulating the sky maps, and found that the centroid position of the hot spot can be spread over a larger area than that of the actual signal. The hot spot position is distributed as a 2-dimensional Gaussian with a width 2.6 times larger than that of the signal. The probability of the reconstructed position of such weak sources falling outside the original 1- contour of the point spread function (PSF, 0.045 deg in radius) is 24%. Therefore we conclude that the 0.05-degree offset seen in the skymap is well explained as statistical fluctuations in the case of weak signals, and that the significance of 3.1 (pre-trial) conservatively computed at the Swift-XRT position can be regarded as evidence of a signal from the GRB.
We note that in addition to the trial factor discussed above, follow-up observations of other GRBs in the MAGIC GRB program may be considered as further trials. Among the 69 GRBs followed up by MAGIC in stereoscopic mode since 2009 (Carosi et al., 2015; MAGIC Collaboration et al., 2020), the only short GRBs other than GRB 160821B observed under acceptable conditions were 140930B, 160927A, and 180715A, all with delays longer than 5000 seconds, and none with measured redshifts. Properly accounting for such observations as trials is difficult and not discussed in this paper, as they are subject to hidden observational and analysis biases, implying unequal trial factors.
In order to estimate flux values, we divided the data into two sets according to the weather conditions during the observations. The first 1.7 hours are characterized by low atmospheric transmission (average 60%), while the remaining 2.2 hours had good weather conditions. The first 1.7 hours are further subdivided into two time bins, to better represent the results on a logarithmic time scale. The resulting bins in time since are s to s, s to s, and s to s. The flux is estimated by integrating the signal above 0.5 TeV, the peak energy of the reconstructed gamma rays when assuming a power-law spectrum with photon index -2, convolved with the effective area. Because of the low significance in the first two time bins, we calculated 95% confidence-level flux upper limits using the method described in Rolke et al. (2005), obtaining 1.1 and 5.4, respectively. For the third time bin, we can similarly derive a flux upper limit of . On the other hand, despite the limited significance, we can also derive the flux for the last time bin, assuming that the excess is a real signal, which gives .
In order to check for the possibility of an unknown, unrelated gamma-ray source at the GRB position, we carried out an additional observation about a year after the GRB (11-14 Sep 2017, s) and obtained 7.6 hours of good quality data. The result is a flux upper limit of ( 0.5 TeV, 95% C.L.), which is about half of the value discussed above for the putative signal. If a steady source was present at the position, an observation of 7.6 hours (instead of 2.2 hours) should result in a flux measurement with a smaller error, . The confidence belts of the flux inferred earlier and the flux upper limit derived later marginally overlap at 2- level on both sides, so the hypothesis of a steady source is disfavored, although it does not exclude the possibility of a variable source that is unrelated to the GRB.
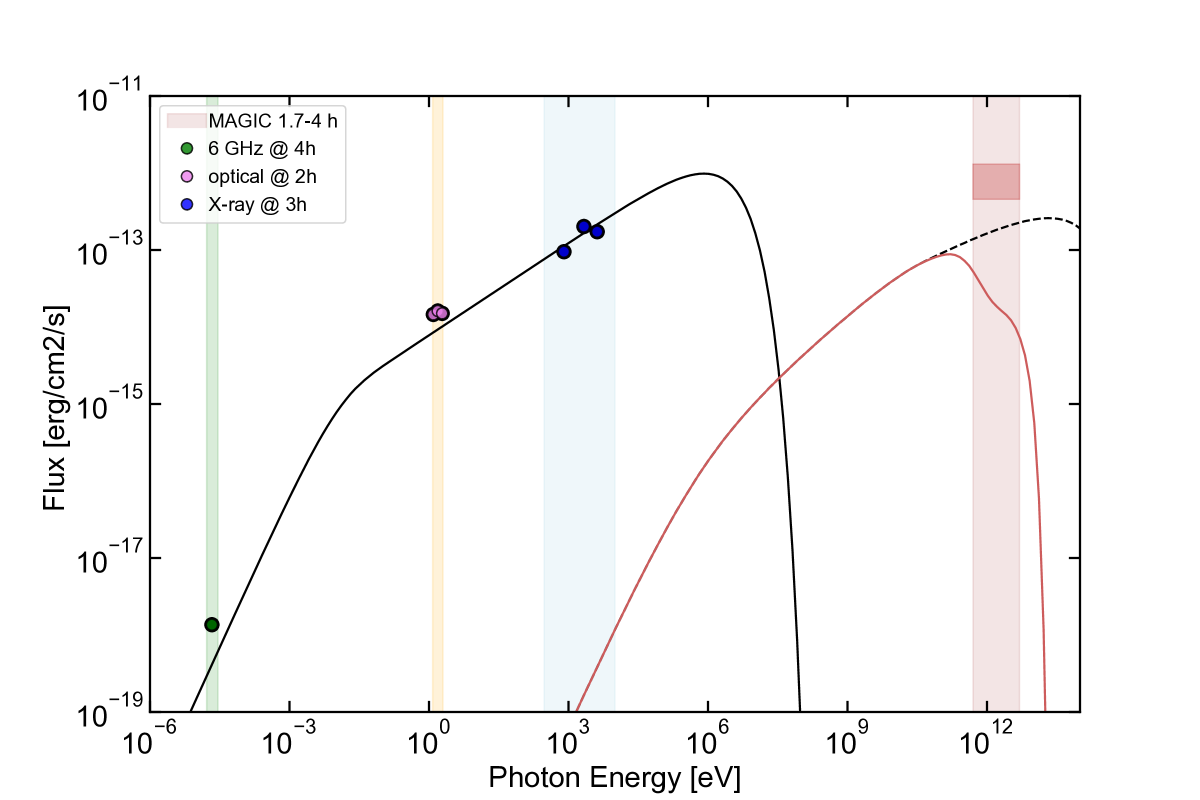
Because of the low significance, an unfolded spectral energy distribution could not be derived, even for the third time bin with data obtained during good weather. The error box shown in the right panel of Fig. 4 indicates only the reconstructed flux for this bin, derived from the photon flux by integrating over the energy range 0.5 - 5 TeV and assuming a power-law spectrum with photon index -2 (horizontal edges of the box). The height of the box corresponds only to statistical errors for the photon flux, and does not account for systematic errors related to the assumed spectral index.
4 Discussion
4.1 Modeling of Observations from Radio to X-rays
Several distinct components can contribute to the radio to X-ray emission of short GRBs after their prompt emission. The main component is synchrotron radiation from electrons accelerated in external forward shocks, triggered by interactions between the relativistic jet and the ambient medium (hereafter, simply “afterglow” radiation). In some cases, another component can arise from a reverse shock propagating into the jet ejecta. Two additional components are unique to short GRBs. Often seen in X-rays is “extended emission”, where a relatively shallow temporal decay during the first tens to hundreds of seconds is followed by a much steeper decay, widely thought to be related to long-lasting activity of the central engine (either a magnetar or a black hole resulting from a NS merger; Norris & Bonnell 2006; Lü et al. 2015). Finally, optical-infrared kilonova emission can occur on timescales of days, powered by freshly synthesized r-process elements ejected in NS mergers (Metzger, 2019).
All four of the aforementioned components are actually observed in GRB 160821B. Hereafter, our modeling focuses on the afterglow component from the external forward shock. Thus, we only consider the X-ray data at s, excluding the extended emission that can be clearly seen at earlier times in Fig. 1 (see also Zhang et al. 2018). The kilonova emission has been inferred to dominate the optical/nIR band from 1 day to 4 days after (Kasliwal et al., 2017; Jin et al., 2018; Troja et al., 2019; Lamb et al., 2019).
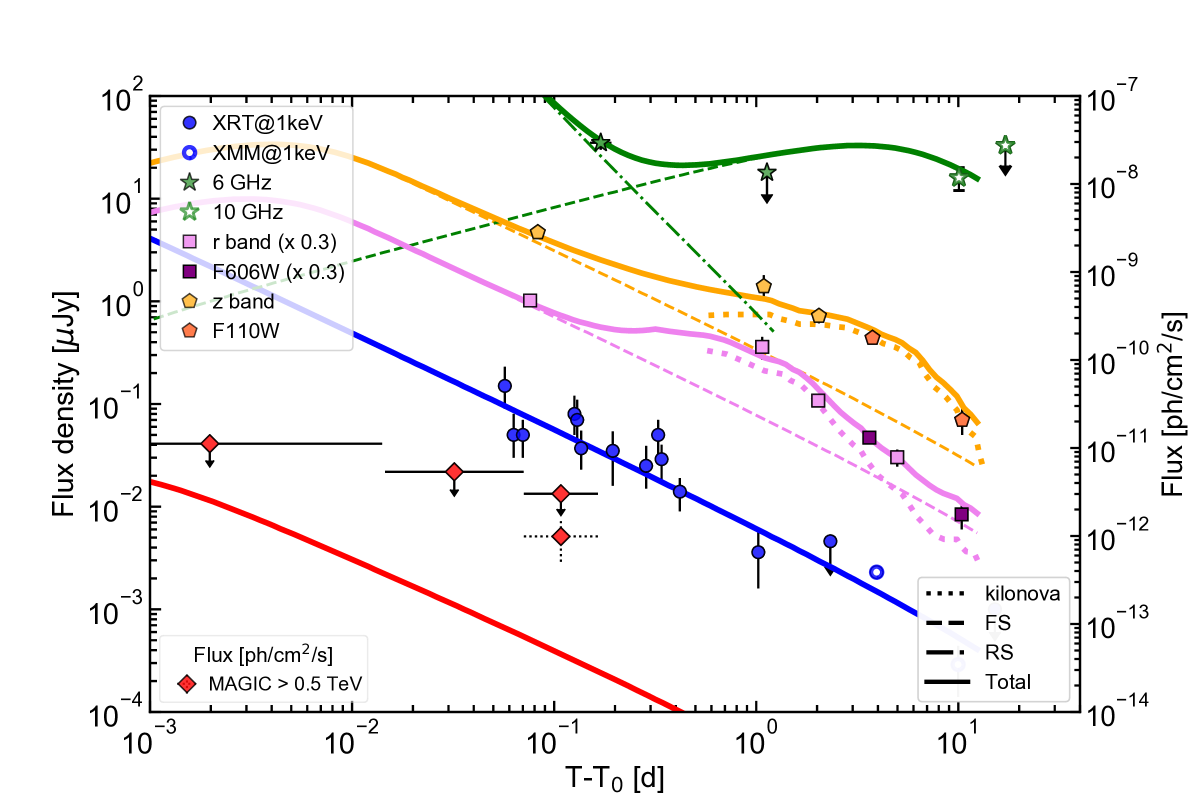
The broad-band light curves are shown in Fig. 4 (left-hand panel). We adopt the X-ray light curve from Troja et al. (2019) and model the broad-band emission as synchrotron emission from the external forward shock, considering the simplest case of impulsive energy injection. The modeling is performed with a numerical code that self-consistently solves the evolution of the electron distribution, accounting for continuous electron injection with a power-law energy distribution (), synchrotron, synchrotron-self-Compton (SSC) and adiabatic losses, synchrotron self-absorption and pair production (for a description of the code, see MAGIC Collaboration et al. 2019b and references therein).
The broad-band SED at 3 h is shown in Fig. 4 (right-hand panel). The consistency between the X-ray and optical spectral indices () suggests that the X-ray and optical bands are located between the characteristic synchrotron frequency and the cooling frequency . The radio data at 6 and 10 GHz together with optical and X-ray data constrain to be located between the radio and optical bands. The radio emission from the forward shock is then expected to increase with time (see dashed green curve in the left-hand panel of Fig. 4), implying that the observed radio emission at early times is dominated by another component, most likely from the reverse shock (Troja et al., 2019; Lamb et al., 2019; Lamb, 2020). To be consistent with the radio upper limits at later times, must cross the radio band. All together, these observations constrain its value to be Hz at s and mJy. The model parameter space is further constrained by the requirement up to at least 4 days (from the observed lack of a clear temporal break in X-rays). Order of magnitude estimates for the model parameters can be inferred by solving the equations
(see e.g., Sari et al. 1998; Granot & Sari 2002; Panaitescu & Kumar 2000), where is the initial, isotropic-equivalent kinetic energy, the density of the surrounding medium, and the fraction of energy dissipated behind the shock in accelerated electrons and the magnetic field, respectively, and the power-law index of the injected electron energy distribution.
We find good agreement for values of the model parameters within the following ranges: Log, Log, Log, Log, and . The inferred values are very similar to the values inferred by Troja et al. (2019).
There is degeneracy between the parameters, that can be understood as follows: since and for a fixed value of , the other parameters must satisfy and . erg would imply large values of and , resulting in .
The result of the modeling is compared with observations in Fig. 4. The reverse shock and kilonova components (dot-dashed and dotted curves in the left-hand panel) are taken from Troja et al. (2019).
Note that in contrast to Troja et al. (2019) and our modeling here, Lamb et al. (2019) proposed a different, multi-zone interpretation for the afterglow, invoking emission from a narrow jet component, as well as a slower outflow component caused by energy injection from the central engine at late times. The different interpretation is mainly driven by a different analysis of the X-ray data, resulting in an X-ray light curve with evidence for a double peak.
4.2 Modeling of the TeV Radiation
Assuming that the TeV -ray signal obtained from MAGIC observations of GRB 160821B is real, we discuss possible mechanisms for TeV emission in short GRBs and assess their viability in accounting for these observations.
4.2.1 Synchrotron-Self-Compton emission (SSC)
Considering the parameter space constrained from the observed synchrotron emission in the radio, optical and X-ray bands, we estimate the associated SSC component, and compare the results with MAGIC observations. Given the wide range of values still allowed, the expected flux of the SSC emission can vary by a few orders of magnitude.
The energy range covered by MAGIC observations lies in the range where the flux can be analytically estimated by
| (1) |
subject to corrections of order , where and (Sari & Esin, 2001).
The SED in the right-hand panel of Fig. 4 shows the inferred flux in the energy range 0.5-5 TeV under the assumption that the gamma-ray signal from GRB 160821B is real (thin red box). This TeV flux would imply a large amount of energy in the SSC component, with a Compton parameter . A large TeV flux is obtained for large values of , since they allow for lower and higher (see equations in Sec. 4.1). Adopting the following parameter values: Log, Log, Log, Log, and , at the time of the last MAGIC observation, the external shock radius is cm, the bulk Lorentz factor is , and the characteristic Lorentz factor of the electrons is . The expected SSC flux at 1 TeV is then erg cm-2 s-1. The expected SSC spectrum accounting for EBL attenuation (Domínguez et al., 2011) is shown as the red solid curve in Fig. 4. Compared with the flux suggested from MAGIC observations at 0.1 days, the maximum flux expected in one-zone SSC models falls short by about an order of magnitude.
4.2.2 Proton synchrotron emission
Synchrotron emission by protons accelerated to ultrahigh energies in the external shock has also been proposed as a mechanism for GeV-TeV emission in GRB afterglows (Vietri, 1997; Zhang & Mészáros, 2001), including the bright GeV emission observed in GRB 090510 (Razzaque, 2010). We discuss its viability for the putative TeV emission of GRB 160821B, following the analytic formulation of Zhang & Mészáros (2001).
The maximum expected energy of proton synchrotron emission in the observer frame is , where , , is the observer time after the burst in hours, and is a factor of order unity that characterizes the acceleration timescale. Even when assuming optimistic values of and , realizing TeV at h for a GRB at requires , much larger than typical for short GRBs ( erg, ; Berger 2014). It is also inconsistent with inferences from the radio to X-ray emission discussed in 4.1.
The requirement to reproduce the inferred TeV-band flux is likewise severe. For a power-law energy distribution with index for the accelerated protons, their synchrotron emission is expected to have a single power-law spectrum with photon index , from a minimum energy up to , where is the fraction in number of protons swept up by the shock that are accelerated, and is the fraction of energy in accelerated protons relative to that dissipated behind the shock. Assuming typically expected for shock acceleration, and that the spectrum extends to at least TeV, the energy flux at 0.5 TeV is , where is the luminosity distance of the GRB. With optimistic assumptions of , and , accounting for the inferred 0.5-1 TeV flux at h necessitates , far larger than expected and contradicting the constraints from lower energy bands. Thus, proton synchrotron emission is strongly disfavored as the origin of the TeV emission suspected in GRB 160821B.
Photohadronic cascade emission, triggered by interactions of ultrahigh-energy protons with ambient low-energy photons, is another potential GeV-TeV emission mechanism in GRB afterglows (Böttcher & Dermer, 1998; Zhang & Mészáros, 2001). However, as with proton synchrotron emission, its radiative efficiency is generally low, and is disfavored for similar reasons.
4.2.3 Other possibilities
The TeV emission inferred for GRB 160821B from MAGIC observations may be difficult to reproduce with hadronic emission models or the simplest, one-zone SSC emission models. Although detailed studies are beyond the scope of this paper, below we discuss some other processes that may potentially account for the putative TeV emission.
External Compton emission, whereby accelerated electrons Compton upscatter soft photons originating from outside the emission region, is a process that is widely discussed in the context of gamma-ray emission from blazars (Madejski & Sikora, 2016), but has received relatively little attention for GRBs (see however Murase et al. 2011). Potential sources of external soft photons for short GRB afterglows include the extended X-ray emission (Murase et al., 2018), emission from a cocoon surrounding the jet (Kimura et al., 2019), as well as the kilonova (Linial & Sari, 2019).
It is noteworthy that in contrast to Troja et al. (2019), Lamb et al. (2019) advocate a two-component jet for GRB 160821B, consisting of a fast, narrow component and an additional, slower component, to better account for observed features in the X-ray light curve. If the geometry is such that the two components are co-axial with the slower component surrounding the faster component, synchrotron photons from the former can act effectively as external soft photons for the latter and vice-versa, analogous to certain models developed for blazars in which inverse Compton emission can be enhanced compared to one-zone models (Ghisellini et al., 2005).
Besides radiation from a non-thermal electron population, Vurm & Beloborodov (2017) propose that inverse Compton upscattering of X-ray afterglow photons by thermal plasma at the forward shock can produce luminous TeV emission up to several hours after the burst. They suggest that this process can be relatively efficient for short GRBs occurring in low-density environments.
Finally, GRB 160821B shows clear evidence for a reverse shock component in the radio band (Troja et al., 2019; Lamb et al., 2019; Lamb, 2020). Emission up to TeV energies may be possible from the reverse shock due to the SSC process (Wang et al., 2001), adding to the TeV emission from the forward shock.
5 Summary and outlook
GRB 160821B is a short GRB found by Swift and Fermi that occurred at . Its afterglow emission was followed up by several telescopes, resulting in detections in the radio, optical-infrared, and soft X-ray bands. Optical-infrared observations clearly revealed the presence of a kilonova, dominating the emission at 1 day.
The MAGIC telescopes also followed up this event, starting from 24 seconds and lasting until 4 hours after the burst trigger. Non-optimal weather and observing conditions resulted in a high energy threshold for data analysis ( 0.5 TeV) and limited the effectiveness of the observations, especially at early times when the afterglow is expected to be brighter and the chances for detection of a possible TeV counterpart are higher. Nevertheless, we obtained a TeV gamma-ray excess with a significance of 3.1 (pre-trial). We also analyzed Fermi-LAT data and derived upper limits in the GeV energy range. Collecting radio, optical and X-ray data that are publicly available, the MAGIC observations were compared with those at lower energies. The estimated energy flux for the possible TeV detection after correcting for EBL attenuation is about 5-10 times larger than that measured in X-rays at the same time h. The data from radio to X-rays can be well described as synchrotron radiation from the forward shock, with a contribution to the radio flux at early times from the reverse shock and to the optical-UV flux from the kilonova.
Assuming that the 3.1- excess is indeed a gamma-ray signal associated with GRB 160821B, we discussed some models that may potentially account for such TeV emission from afterglows of short GRBs. Utilizing a one-zone numerical model of synchrotron emission from the external forward shock, we computed the accompanying SSC emission. Within the parameter space constrained by radio to X-ray observations, we find that the SSC flux is maximized for large values of , very low values of , and density cm-3. The TeV flux derived under these conditions falls short of the observationally inferred flux by about a factor of 10. Moreover, hadronic processes such as proton synchrotron emission are strongly disfavored as the origin of the possible TeV emission due to their low radiative efficiency. Thus, the simplest, one-zone SSC emission models or hadronic emission models are unable to account for the TeV emission of GRB 160821B indicated by the MAGIC observations.
Other possibilities for interpreting the putative TeV emission from GRB 160821B should be explored in the future, such as external Compton processes, particularly in the context of two-component jet models as favored by Lamb et al. (2019), inverse Compton upscattering by thermal plasma in the forward shock, and SSC emission from the reverse shock.
Finally, it is worth emphasizing that observations in the radio to X-ray bands alone are not necessarily sufficient for clearly characterizing short GRB afterglows, which comprise not only the nonthermal emission from the external forward shock, but also additional components including the reverse shock, extended emission, and the kilonova, all of which are seen in GRB 160821B. Through a detailed study of one-zone models, we have demonstrated that reproducing the available data from radio to X-rays still leaves a considerable degeneracy in the range of allowed afterglow parameters. It also remains uncertain whether multi-zone considerations (Lamb et al., 2019) are needed. In turn, this can leave fairly significant ambiguities in the inferred properties of the superposed kilonova, such as the mass, velocity and composition of the ejecta. Our modeling also shows that while staying consistent with the observed radio to X-ray data, the SSC flux at higher energies can vary by a few orders of magnitude, depending on the afterglow parameters. Future GeV-TeV observations of inverse Compton emission and other emission components beyond the synchrotron component in short GRB afterglows should play an important role in disentangling such uncertainties, and advancing our knowledge of the nature of short GRBs, BNS mergers, and the origin of heavy elements.
References
- Abbott et al. (2017) Abbott, B. P., et al. 2017, ApJ, 848, L12, doi: 10.3847/2041-8213/aa91c9
- Abdalla et al. (2019) Abdalla, H., Adam, R., Aharonian, F., et al. 2019, Nature, 575, 464, doi: 10.1038/s41586-019-1743-9
- Abdollahi et al. (2020) Abdollahi, S., Acero, F., Ackermann, M., et al. 2020, ApJS, 247, 33, doi: 10.3847/1538-4365/ab6bcb
- Acciari et al. (2020) Acciari, V. A., Ansoldi, S., Antonelli, L. A., et al. 2020, Phys. Rev. Lett., 125, 021301, doi: 10.1103/PhysRevLett.125.021301
- Ackermann et al. (2010) Ackermann, M., Asano, K., Atwood, W. B., et al. 2010, ApJ, 716, 1178, doi: 10.1088/0004-637X/716/2/1178
- Ahnen et al. (2017) Ahnen, M. L., Ansoldi, S., Antonelli, L. A., et al. 2017, Astroparticle Physics, 94, 29, doi: 10.1016/j.astropartphys.2017.08.001
- Ajello et al. (2019a) Ajello, M., Arimoto, M., Axelsson, M., et al. 2019a, ApJ, 878, 52, doi: 10.3847/1538-4357/ab1d4e
- Ajello et al. (2019b) —. 2019b, ApJ, 878, 52, doi: 10.3847/1538-4357/ab1d4e
- Aleksić et al. (2016) Aleksić, J., Ansoldi, S., Antonelli, L. A., et al. 2016, Astroparticle Physics, 72, 76, doi: 10.1016/j.astropartphys.2015.02.005
- Atwood et al. (2013) Atwood, W., Albert, A., Baldini, L., et al. 2013, arXiv e-prints, arXiv:1303.3514. https://arxiv.org/abs/1303.3514
- Atwood et al. (2009) Atwood, W. B., Abdo, A. A., Ackermann, M., et al. 2009, ApJ, 697, 1071, doi: 10.1088/0004-637X/697/2/1071
- Barthelmy et al. (2005) Barthelmy, S. D., Barbier, L. M., Cummings, J. R., et al. 2005, Space Sci. Rev., 120, 143, doi: 10.1007/s11214-005-5096-3
- Berger (2014) Berger, E. 2014, ARA&A, 52, 43, doi: 10.1146/annurev-astro-081913-035926
- Berti et al. (2019) Berti, A., Antonelli, L. A., Bosnjak, Z., et al. 2019, in International Cosmic Ray Conference, Vol. 36, 36th International Cosmic Ray Conference (ICRC2019), 634
- Böttcher & Dermer (1998) Böttcher, M., & Dermer, C. D. 1998, ApJ, 499, L131, doi: 10.1086/311366
- Burrows et al. (2005) Burrows, D. N., Hill, J. E., Nousek, J. A., et al. 2005, Space Sci. Rev., 120, 165, doi: 10.1007/s11214-005-5097-2
- Carosi et al. (2015) Carosi, A., et al. 2015, Proc. of 34th ICRC 809
- de Naurois & H. E. S. S. Collaboration (2019) de Naurois, M., & H. E. S. S. Collaboration. 2019, GRB Coordinates Network, 25566, 1
- Domínguez et al. (2011) Domínguez, A., Primack, J. R., Rosario, D. J., et al. 2011, MNRAS, 410, 2556, doi: 10.1111/j.1365-2966.2010.17631.x
- Dwek & Krennrich (2013) Dwek, E., & Krennrich, F. 2013, Astroparticle Physics, 43, 112, doi: 10.1016/j.astropartphys.2012.09.003
- Evans et al. (2009) Evans, P. A., Beardmore, A. P., Page, K. L., et al. 2009, MNRAS, 397, 1177, doi: 10.1111/j.1365-2966.2009.14913.x
- Fong et al. (2016) Fong, W., Alexander, K. D., & Laskar, T. 2016, GCN Circ., 19854
- Fruck & Gaug (2015) Fruck, C., & Gaug, M. 2015, Proc. of AtmoHEAD 2014, 02003
- Gehrels et al. (2004) Gehrels, N., Chincarini, G., Giommi, P., et al. 2004, ApJ, 611, 1005, doi: 10.1086/422091
- Ghirlanda et al. (2019) Ghirlanda, G., Salafia, O. S., Paragi, Z., et al. 2019, Science, 363, 968, doi: 10.1126/science.aau8815
- Ghisellini et al. (2005) Ghisellini, G., Tavecchio, F., & Chiaberge, M. 2005, A&A, 432, 401, doi: 10.1051/0004-6361:20041404
- Granot & Sari (2002) Granot, J., & Sari, R. 2002, ApJ, 568, 820, doi: 10.1086/338966
- Jeong et al. (2016) Jeong, S., et al. 2016, GCN Circ., 19847
- Jin et al. (2020) Jin, Z.-P., Covino, S., Liao, N.-H., et al. 2020, Nature Astronomy, 4, 77, doi: 10.1038/s41550-019-0892-y
- Jin et al. (2018) Jin, Z.-P., Li, X., Wang, H., et al. 2018, ApJ, 857, 128, doi: 10.3847/1538-4357/aab76d
- Kasliwal et al. (2017) Kasliwal, M. M., Korobkin, O., Lau, R. M., Wollaeger, R., & Fryer, C. L. 2017, ApJ, 843, L34, doi: 10.3847/2041-8213/aa799d
- Kimura et al. (2019) Kimura, S. S., Murase, K., Ioka, K., et al. 2019, ApJ, 887, L16, doi: 10.3847/2041-8213/ab59e1
- Kumar & Zhang (2015) Kumar, P., & Zhang, B. 2015, Phys. Rep., 561, 1, doi: 10.1016/j.physrep.2014.09.008
- Lamb (2020) Lamb, G. P. 2020, arXiv e-prints, arXiv:2006.05893. https://arxiv.org/abs/2006.05893
- Lamb et al. (2019) Lamb, G. P., Tanvir, N. R., Levan, A. J., et al. 2019, ApJ, 883, 48, doi: 10.3847/1538-4357/ab38bb
- Levan et al. (2016) Levan, A. J., et al. 2016, GCN Circ., 19846
- Li & Ma (1983) Li, T. P., & Ma, Y. Q. 1983, ApJ, 272, 317, doi: 10.1086/161295
- Linial & Sari (2019) Linial, I., & Sari, R. 2019, MNRAS, 483, 624, doi: 10.1093/mnras/sty3170
- Longo et al. (2016a) Longo, F., Bissaldi, E., Bregeon, J., et al. 2016a, GRB Coordinates Network, 19403, 1
- Longo et al. (2016b) Longo, F., Bissaldi, E., Vianello, G., et al. 2016b, GRB Coordinates Network, 19413, 1
- Lü et al. (2015) Lü, H.-J., Zhang, B., Lei, W.-H., Li, Y., & Lasky, P. D. 2015, ApJ, 805, 89, doi: 10.1088/0004-637X/805/2/89
- Madejski & Sikora (2016) Madejski, G. G., & Sikora, M. 2016, ARA&A, 54, 725, doi: 10.1146/annurev-astro-081913-040044
- MAGIC Collaboration et al. (2019a) MAGIC Collaboration, Acciari, V. A., Ansoldi, S., et al. 2019a, Nature, 575, 455, doi: 10.1038/s41586-019-1750-x
- MAGIC Collaboration et al. (2019b) —. 2019b, Nature, 575, 459, doi: 10.1038/s41586-019-1754-6
- MAGIC Collaboration et al. (2020) MAGIC Collaboration, et al. 2020, in prep.
- Meegan et al. (2009) Meegan, C., Lichti, G., Bhat, P. N., et al. 2009, ApJ, 702, 791, doi: 10.1088/0004-637X/702/1/791
- Metzger (2019) Metzger, B. D. 2019, Living Reviews in Relativity, 23, 1, doi: 10.1007/s41114-019-0024-0
- Mirzoyan et al. (2019) Mirzoyan, R., Noda, K., Moretti, E., et al. 2019, GRB Coordinates Network, 23701, 1
- Mooley et al. (2018) Mooley, K. P., Deller, A. T., Gottlieb, O., et al. 2018, Nature, 561, 355, doi: 10.1038/s41586-018-0486-3
- Murase et al. (2011) Murase, K., Toma, K., Yamazaki, R., & Mészáros, P. 2011, ApJ, 732, 77, doi: 10.1088/0004-637X/732/2/77
- Murase et al. (2018) Murase, K., Toomey, M. W., Fang, K., et al. 2018, ApJ, 854, 60, doi: 10.3847/1538-4357/aaa48a
- Nakar (2019) Nakar, E. 2019, arXiv e-prints, arXiv:1912.05659. https://arxiv.org/abs/1912.05659
- Norris & Bonnell (2006) Norris, J. P., & Bonnell, J. T. 2006, ApJ, 643, 266, doi: 10.1086/502796
- Palmer et al. (2016) Palmer, D. M., et al. 2016, GCN Circ., 19844
- Panaitescu & Kumar (2000) Panaitescu, A., & Kumar, P. 2000, ApJ, 543, 66, doi: 10.1086/317090
- Razzaque (2010) Razzaque, S. 2010, ApJ, 724, L109, doi: 10.1088/2041-8205/724/1/L109
- Rolke et al. (2005) Rolke, W. A., López, A. M., & Conrad, J. 2005, Nuclear Instruments and Methods in Physics Research A, 551, 493, doi: 10.1016/j.nima.2005.05.068
- Rossi et al. (2020) Rossi, A., Stratta, G., Maiorano, E., et al. 2020, MNRAS, 493, 3379, doi: 10.1093/mnras/staa479
- Sari & Esin (2001) Sari, R., & Esin, A. A. 2001, ApJ, 548, 787, doi: 10.1086/319003
- Sari et al. (1998) Sari, R., Piran, T., & Narayan, R. 1998, ApJ, 497, L17, doi: 10.1086/311269
- Siegel et al. (2016) Siegel, M. H., et al. 2016, GCN Circ., 19833
- Stanbro et al. (2016) Stanbro, M., Meegan, C., et al. 2016, GCN Circ., 19843
- Tanvir et al. (2013) Tanvir, N. R., Levan, A. J., Fruchter, A. S., et al. 2013, Nature, 500, 547, doi: 10.1038/nature12505
- Troja et al. (2016) Troja, E., et al. 2016, GCN Circ., 20222
- Troja et al. (2019) Troja, E., Castro-Tirado, A. J., Becerra González, J., et al. 2019, MNRAS, 489, 2104, doi: 10.1093/mnras/stz2255
- Vietri (1997) Vietri, M. 1997, Phys. Rev. Lett., 78, 4328, doi: 10.1103/PhysRevLett.78.4328
- von Kienlin et al. (2020) von Kienlin, A., Meegan, C. A., Paciesas, W. S., et al. 2020, The Astrophysical Journal, 893, 46, doi: 10.3847/1538-4357/ab7a18
- Vurm & Beloborodov (2017) Vurm, I., & Beloborodov, A. M. 2017, ApJ, 846, 152, doi: 10.3847/1538-4357/aa7ddb
- Wang et al. (2001) Wang, X. Y., Dai, Z. G., & Lu, T. 2001, ApJ, 556, 1010, doi: 10.1086/321608
- Woosley & Bloom (2006) Woosley, S. E., & Bloom, J. S. 2006, ARA&A, 44, 507, doi: 10.1146/annurev.astro.43.072103.150558
- Xu et al. (2016) Xu, D., et al. 2016, GCN Circ., 19834
- Zanin et al. (2013) Zanin, R., et al. 2013, Proc. of 33rd ICRC
- Zhang & Mészáros (2001) Zhang, B., & Mészáros, P. 2001, ApJ, 559, 110, doi: 10.1086/322400
- Zhang et al. (2018) Zhang, Q., Lei, W. H., Zhang, B. B., et al. 2018, MNRAS, 475, 266, doi: 10.1093/mnras/stx3229