Statistical matching and subclassification with a continuous dose: characterization, algorithm, and application to a health outcomes study
Abstract
Subclassification and matching are often used in empirical studies to adjust for observed covariates; however, they are largely restricted to relatively simple study designs with a binary treatment and less developed for designs with a continuous exposure. Matching with exposure doses is particularly useful in instrumental variable designs and in understanding the dose-response relationships. In this article, we propose two criteria for optimal subclassification based on subclass homogeneity in the context of having a continuous exposure dose, and propose an efficient polynomial-time algorithm that is guaranteed to find an optimal subclassification with respect to one criterion and serves as a 2-approximation algorithm for the other criterion. We discuss how to incorporate dose and use appropriate penalties to control the number of subclasses in the design. Via extensive simulations, we systematically compare our proposed design to optimal non-bipartite pair matching, and demonstrate that combining our proposed subclassification scheme with regression adjustment helps reduce model dependence for parametric causal inference with a continuous dose. We apply the new design and associated randomization-based inferential procedure to study the effect of transesophageal echocardiography (TEE) monitoring during coronary artery bypass graft (CABG) surgery on patients’ post-surgery clinical outcomes using Medicare and Medicaid claims data, and find evidence that TEE monitoring lowers patients’ all-cause -day mortality rate.
keywords:
, and
1 Introduction
1.1 Application: The effect of TEE monitoring during CABG surgery
Transesophageal echocardiography (henceforth TEE) is an ultrasound-based, cardiac imaging modality often used in cardiac surgeries to monitor patients’ hemodynamics. TEE may potentially improve post-surgery clinical outcomes by facilitating intraoperative surgery decision making and managing complications related to cardiopulmonary bypass (Hahn et al., 2013; Nishimura et al., 2017); indeed, MacKay et al. (2020a) found perioperative TEE use was associated with lower -day all-cause mortality among patients undergoing open cardiac valve repair or replacement surgery. Coronary artery bypass graft (henceforth CABG) surgery is the most widely performed surgery in the United States (The Society of Thoracic Surgeons, 2016). Compared to open valve surgery, evidence supporting the use of TEE during isolated CABG surgery is more equivocal: TEE monitoring is classified by American Heart Association/American College of Cardiology (AHA/ACC) guidelines as a Class IIb recommendation, meaning its “usefulness/efficacy is less well established by evidence/opinion” (Hillis et al., 2011). MacKay et al. (2020b, 2021) proposed to study TEE’s effect on clinical outcomes using providers’ preference for TEE as an instrumental variable (IV).
One challenge in the study design is that the IV-defined exposure, providers’ preference in this case, is continuous. A straightforward strategy to deal with a continuous exposure is to dichotomize it according to some pre-specified dichotomization scheme. Despite its simplicity and popularity, this practice suffers from at least two major drawbacks. First, defining the potential outcome under a dichotomized exposure potentially violates the stable unit treatment value assumption (SUTVA) (Rubin, 1980, 1986). Let denote the continuous exposure and the associated dichotomized version, e.g., being the median. The potential outcome under is well-defined only when the potential outcome remains unchanged for all exposure doses exceeding the pre-specified threshold . This is at best an approximation to the complicated reality in most circumstances. Moreover, dichotomizing the continuous exposure inevitably censors the rich information contained in the original dose and prevents researchers from investigating a dose-response relationship. Therefore, we would prefer a study design that preserves the continuous exposure dose (Lopez et al. 2017).
In their original study protocol, MacKay et al. (2020b) embed observational data from Centers for Medicare and Medicaid Services (CMS) into a paired cluster-randomized encouragement experiment. MacKay et al. (2020b) matched hospitals with similar patient population and hospital-level characteristics but distinct preference for TEE using a design technique called optimal non-bipartite pair match (Lu et al., 2001, 2011; Baiocchi et al., 2010, 2012). A non-bipartite matching algorithm is distinct from bipartite matching algorithms suited only for statistical matching and subclassification with a binary treatment (Rosenbaum, 1989, 1991; Stuart, 2010) and matching algorithms based on generalized propensity score (Yang et al., 2016; Lopez et al., 2017; Wu et al., 2018); see Supplementary Material A for a detailed literature review. Figure 1 gives a graphical representation of pair matching in a bipartite and a non-bipartite setting. With a binary treatment, there are well-defined treated and control groups, and there is little ambiguity in the ultimate goal of statistical matching: the matching algorithm aims to “construct” or “design” a matched control group (or comparison group) that resembles the treated group in baseline covariates. On the other hand, with a continuous exposure, there are no pre-defined treated and control groups: in principle, any unit can be matched to any other unit similar in covariates. This structural difference between bipartite and non-bipartite settings makes it more challenging to characterize optimal subclassification and design efficient algorithms in the non-bipartite context.
1.2 Pair matching is not optimal
Full matching is a more flexible subclassification scheme that divides units into non-overlapping matched sets (or subclasses) of size at least, but not necessarily, equal to two. With a binary treatment, Rosenbaum (1991) found:
[T]here may be no pair matching and no matching with multiple controls that is an optimal subclassification. … [A] best pair match may be arbitrarily poor compared with the optimal full matching.
These statements remain true in the non-bipartite setting with a continuous dose. To see this, it suffices to consider the following simple example with units and the associated distance matrix
with . The entry of M represents a measure of distance, e.g., the Mahalanobis distance of observed covariates, between unit and . An optimal pair match produces the following three matched pairs:
On the other hand, consider the following full match:
It is evident that achieves a better matched-sets homogeneity, which we will carefully define later, compared to when ; see Figure 2 for a transparent graphical representation. Moreover, since can be arbitrarily larger than , can be arbitrarily better than according to any reasonable homogeneity measure. In the most extreme case where , there exists no admissible pair match exhausting six units; however, there exists a feasible full match, and a good one when is small.
Another concern with pair matching is that it is often not flexible enough to deliver a subclassification that is simultaneously homogeneous in units’ observed covariates and reasonably heterogeneous in units’ exposure doses; in fact, units are often removed in the design stage (Baiocchi et al., 2010, 2012) to achieve both goals. For instance, MacKay et al. (2020b) removed of all hospitals in their matched-pair design using a design device known as “sinks” (Baiocchi et al., 2010). Ideally, we would prefer a design that utilizes all units while maintaining homogeneity in covariates and good separation in exposure doses. Lastly, one minor issue with pair matching is that, when the number of units is odd, say , the design necessarily discards one unit to produce two matched pairs.
These limitations of a non-bipartite pair match design and the abundance of observational studies with a continuous or many-level exposure motivate us to study optimal subclassfication in the non-bipartite setting.
1.3 Outline: a characterization of optimal non-bipartite subclassification, an algorithm, two simulation studies, and an application
Two subclassification homogeneity measures and optimal subclassification with respect to each measure are defined in Section 2. Section 3 proves a useful relationship between the two homogeneity measures; this relationship suggests that any algorithm that finds a subclassification with respect to one homogeneity measure is automatically a 2-approximation algorithm for the other measure. An efficient, polynomial-time algorithm that finds an optimal subclassification with respect to one homogeneity measure and suitable weights is presented in Section 4. Section 5 discusses how to further incorporate the treatment dose in the design stage, and how to probe the middle ground between an optimal pair match and an optimal subclassification. Two simulation studies, one examining how combining the proposed subclassification scheme with regression adjustment helps reduce bias of the regression estimator, and the other systematically comparing the proposed subclassification method to optimal pair matching, are presented in Section 6 and 7, respectively. We leverage the proposed novel design and conduct randomized-based inference to study the effect of TEE monitoring during CABG surgery on patients’ 30-day all-cause mortality in Section 8. We conclude with a brief discussion in Section 9.
2 Two measures of subclassification homogeneity
Let denote a set of units and its power set, i.e., the collection of all subsets of . Let denote a subclassification (or partition) of these units into non-overlapping subclasses such that each subclass consists of units, , and their union recovers these units. The number of subclasses is not fixed a priori. Finally, let be the set of all possible subclassifications. We first develop two notions of subclass homogeneity.
Definition 2.1 (Average pairwise homogeneity).
Let denote a distance between unit and . Average pairwise homogeneity of subclass , denoted as , refers to the following quantity:
| (1) |
According to Definition 2.1, is the average distance of all pairwise comparisons among units in the subclass . For instance, in the TEE/CABG application with a hospital-preference-based instrumental variable exposure, could measure some distance between IV-outcome confounders (e.g., patient composition and hospital characteristics) of hospital and , and would then measure the homogeneity in these IV-outcome confounders of hospitals in the same subclass .
Associated with a subclassification and is the following homogeneity measure of :
| (2) |
where is a shorthand for a pre-specified weighting scheme that maps each possible subclass to a non-negative real number.
Definition 2.2.
A subclassification is said to be optimal with respect to the homogeneity measure if
In full matching with a binary exposure, each subclass consists of either one treated unit and multiple control units or one control unit and multiple treated units, and subclass homogeneity is measured by averaging over all pairwise comparisons between the treated unit and each control unit (or the control unit and each treated unit); see Rosenbaum (1991, Section 3). This structure motivates a second sensible homogeneity measure as follows.
Definition 2.3 (Star homogeneity).
Let be a reference unit in subclass . Star homogeneity refers to the following quantity:
| (3) |
Unlike which averages over all pairwise comparisons, first picks a reference unit (e.g., the unit with the highest or lowest dose in each subclass; see Section 5.1 for how to enforce this choice), compares all other units to this reference unit, and then averages over such comparisons. In the TEE/CABG application, if the hospital with the highest preference for TEE in the subclass is chosen as the reference unit , then measures how close in patient composition and hospital characteristics the other hospitals in the same subclass are compared to this highest-preference hospital.
Associated with a subclassification , the star homogeneity, a vector of reference units , and a weighting scheme is a second homogeneity measure of :
| (4) |
Definition 2.4.
A subclassification with reference units
, , is said to be optimal with respect to the homogeneity measure if
where minimization is taken over all subclassifications and all possible reference units in each subclass.
Remark.
In the special case of pair matching, it is easy to check that for all and for all , , i.e., two measures of subclass homogeneity reduce to the same measure. Moreover, under a weighting scheme that assigns the same weight to all matched pairs, we have and this optimal solution is precisely returned by an optimal non-bipartite pair matching algorithm (Lu et al., 2001, 2011).
3 Relationship between two optimal solutions
A subclassification is optimal with respect to the homogeneity measure and a weighting scheme . A natural question arises as to what can be said about its homogeneity under the other measure , and how compares to the optimal homogeneity under the same weights. This section establishes a revealing relationship between and .
Lemma 3.1.
Let be a subclass with size and a distance that satisfies the triangle inequality. We have
and
In particular, when , we have , .
Proof.
All proofs in this article are in Supplementary Material B. ∎
Let be the minimum homogeneity of a subclass among all reference units . Define
Corollary 3.2.
For any subclass , we have
Moreover, for any subclassification and weighting scheme , we have
Corollary 3.2 establishes a link between two homogeneity measures and : any subclassification has its sandwiched between and . Proposition 3.3 is an important consequence of Corollary 3.2.
Proposition 3.3.
Let be an optimal partition with respect to the homogeneity measure and weighting scheme , and optimal with respect to and the same weighting scheme. We have
In words, is optimal under the homogeneity measure , and its homogeneity under the other measure is no worse than the optimal homogeneity under by a factor of .
In the computer science and operations research literature, an approximation algorithm refers to an algorithm that finds an approximate solution to an optimization problem with a provable guarantee on the distance between the approximate solution and the optimal solution; see Vazirani (2013) and Williamson and Shmoys (2011) for general discussion. A -approximation algorithm refers to an approximation algorithm that returns an approximate solution whose objective function value is no worse than that of the optimal solution by a factor of , i.e.,
Corollary 3.4.
Corollary 3.4 is important and useful because efficient, polynomial-time algorithms exist for finding with respect to suitable weights, as we demonstrate in the next section.
4 An efficient, polynomial-time algorithm
4.1 Graph, edge cover, and suitable weights
We introduce some useful terminologies from the graph theory to carry forward the discussion. Let denote a graph with vertex set and edge set . We use , to denote an edge connecting vertex and , in which case we say vertex (and similarly ) is incident to edge . A subset of edges is said to form a star if ; is often referred to as the internal node or center of the star, and leaves.
An edge cover of graph is a subset of edges such that all vertices in are incident to at least one edge in . Let denote the class of all edge covers of graph , and each edge be associated with a nonnegative cost . The cost of an edge cover is defined to be
Figure 3 gives two examples of an edge cover in the same graph. The cost of the edge cover in the left panel is and that in the right panel is .
Lemma 4.1 states that for a suitable choice of weights, homogeneity measure corresponds to the cost of a particular edge cover.
Lemma 4.1.
Let be a partition, and a weighting scheme that assigns to subclass . Then
| (5) |
and is equal to the cost of an edge cover with connected components , each connected component being a star with internal vertex and leaves , and cost of any edge connecting two nodes and being .
4.2 A minimum cost edge cover induces an optimal subclassification with respect to suitable weights
A minimum cost edge cover, i.e., the edge cover that attains the minimum cost among all edge covers of , can be efficiently found in polynomial time (Schrijver, 2003); in fact, the problem of finding a minimum cost edge cover can be reduced to the problem of finding a minimum cost matching in an expanded non-bipartite graph. Moreover, Proposition 4.2 states that a minimum cost edge cover induces an optimal subclassification with respect to the homogeneity measure when the edge cost is nonnegative.
Proposition 4.2.
Let be a graph and a nonnegative cost function. Then
-
1.
There exists a minimum cost edge cover whose connected components are all stars; call this minimum cost star-tiled edge cover ;
-
2.
Let the cost function of edge be the distance , then
In other words, induces an optimal subclassification with respect to the homogeneity measure .
4.3 An efficient algorithm that finds minimum cost edge cover
Algorithm 1 transforms the problem of finding a minimum cost edge cover into an optimal non-bipartite matching problem (Schrijver, 2003), the computation complexity of which is in a graph with vertices. Algorithm 1 returns a minimum cost edge cover ; we may further process as described in the proof of Proposition 4.2 to obtain , a minimum cost edge cover consisting of all stars. The complexity of finding a minimum cost edge cover is the same as optimal non-bipartite matching. The algorithm is further illustrated in Supplementary Material D. We will refer to the subclassification scheme induced by as a “non-bipartite full match design.”
-
1.
Create a copy of with the same topology and edge cost; denote it as .
-
2.
For each and its counterpart , add an edge ; a total of edges are added.
-
3.
Assign a cost equal to to each edge , where denotes the minimum cost among all edges incident to .
-
4.
Solve an optimal non-bipartite matching problem in the graph ; let denote this optimal matching.
-
5.
Delete from any edge in ; replace any edge of the form in with an edge such that ; denote by the result;
-
6.
Return the minimum cost edge cover .
5 Additional design considerations
5.1 Dose caliper
With a binary treatment, there is a distance between each treated unit and each control unit, and this distance unequivocally measures the closeness of the treated and control units in their observed covariates. With a continuous or many-level treatment/encouragement dose, homogeneity in observed covariates is still an important aspect; however, distances in this case may further take into account the treatment/encouragement dose in order to design matched sets that are homogeneous in observed covariates and well-separated in their exposure doses (Lu et al., 2001).
This is in particular relevant in our TEE/CABG application with an IV-defined continuous exposure. It is widely acknowledged that confidence intervals obtained from weak instruments are often excessively long and non-informative (Imbens and Rosenbaum, 2005). A large encouragement dose, on the other hand, would typically create stronger incentives for units to accept the treatment, increase the compliance rate, and eventually render the statistical inference substantially more powerful (Baiocchi et al., 2010; Heng et al., 2019; Zhang et al., 2021a). For instance, Heng et al. (2019) derived the asymptotic relative efficiency (ARE) of some commonly-used test statistics when testing the same proportional treatment effect model (Small and Rosenbaum, 2008) with two instrumental variables of different strengths. They found that for a weaker IV with compliance rate to achieve the same efficiency as a stronger IV with compliance rate , the weaker IV needs to have a sample size times larger than that of a stronger IV. Analytic results of this kind provide incentives to separate exposure doses in the design stage.
How to pursue this design aspect in a non-bipartite full match? We borrow the idea of a “caliper” from the literature on “caliper matching” (Cochran and Rubin, 1973) and “propensity score caliper” (Rosenbaum and Rubin, 1985). Let measure the distance between observed covariates, and and the encouragement doses of unit and , respectively. One straightforward way to incorporate the encouragement dose is to define a new distance , where is called a dose caliper and a large penalty applied when and differ by less than or equal to the caliper size. Hence, a large would discourage an edge cover from connecting unit and whenever their doses are within the caliper size. Analogous to a propensity score caliper, a dose caliper may be implemented both as a hard constraint, by setting or equivalently removing edges , or as a soft constraint by setting to a large but finite number (Zhang et al., 2021b, Section 2.3). In Supplementary Material C.1, we illustrate the dose caliper using a simulation study.
A dose caliper facilitates interpreting the chosen reference unit in each subclass. Consider implementing a hard caliper with size . Let be the dose of the internal node of a subclass and the collection of doses of leaves in . By definition of a hard dose caliper, the dose of the internal node necessarily satisfies
for all . In the former case, the internal node corresponds to the unit with the highest dose (and at least higher in dose than any other unit in the same subclass) and we may view it as a pseudo-treated unit in the subclass; in the latter case, it is one with the lowest dose and can be viewed as a pseudo-control unit. This particular structure, one pseudo-treated and a variable number of pseudo-control units (or one pseudo-control and a variable number of pseudo-treated units) is analogous to that of full matching with a binary exposure (Hansen, 2004; Hansen and Klopfer, 2006); see Figure 4 for an illustration. In the TEE/CABG application, matching with a dose caliper forces each matched set to have one high-preference hospital and a few low-preference hospitals, or one low-preference hospital and a few high-preference hospitals, and comparisons in the health outcomes will be made among high-preference and low-preference hospitals within each formed subclass.
5.2 Incorporating matched-sets-cardinality penalty
In a bipartite full matching, there are two parameters controlling for the maximum number of treated and control units in each matched set, respectively. Options max.controls and min.controls of function fullmatch in the R pacakge optmatch (Hansen and Klopfer, 2006; Hansen, 2007) serve this purpose. For example, setting would restrict the matched set to have at most treated subjects for one control, and at most controls for one treated; together, they restrict the cardinality of matched sets to be at most .
In the context of non-bipartite matching with a continuous dose, we may also want to have some control over the size of subclasses and hence how many subclasses in a subclassification. To this end, we consider adding to a homogeneity measure a proper penalty on the cardinality of subclasses. Let the homogeneity measure be , and consider the following modified homogeneity measure:
Definition 5.1.
A subclassification with reference units , , is said to be optimal with respect to the homogeneity measure if
When , this definition reduces to Definition 2.4; when , reduces to the solution to an optimal non-bipartite pair match because for matched pairs. As increases from to , we explore the middle ground between a subclassification that is optimal with respect to and an optimal non-bipartite pair matching.
With suitable weights , we can find efficiently via a slightly modified version of Algorithm 1; in fact, it suffices to modify Step 3 in Algorithm 1 as follows:
-
Assign a cost equal to to each edge , where denotes the minimum cost among all edges incident to .
Let denote the output from the modified Algorithm 1. Following a similar argument in the proof of Proposition 4.2, we may further process to obtain , an edge cover consisting of all stars. In Supplementary Material B.5, we prove a result analogous to Proposition 4.2, which states that induces a subclassification that is optimal with respect to . Supplementary Material C.2 illustrates how to choose with a simulation study.
6 Simulation studies I: non-bipartite matching as a preprocessing step to remove bias in parametric causal inference with a continuous treatment dose
6.1 Goal and structure
It is widely acknowledged that with a binary treatment, combining statistical matching with regression adjustment renders analysis more robust to model misspecification and helps remove bias in treatment effect estimation (Rubin, 1973, 1979); hence, many authors advocate using statistical matching as a nonparametric preprocessing step before parametric causal inference (Ho et al., 2007; Stuart, 2010). The primary goal of this section is to assess if combining the non-bipartite full matching developed in this article and regression adjustment helps reduce model dependence and remove bias in the continuous treatment setting.
Our simulation studies in this section can be compactly represented as a factorial study with the following factors:
-
Factor 1: treatment effect estimator: and .
-
Factor 2: dimension of covariates, : and .
-
Factor 3: sample size, : and .
-
Factor 4: treatment dose model: a multi-level treatment ; two continuous treatments and so that the continuous treatment Z has mean and variance .
-
Factor 5: observed covariates distribution: , with and with and .
-
Factor 6: response model: with , , , and , and .
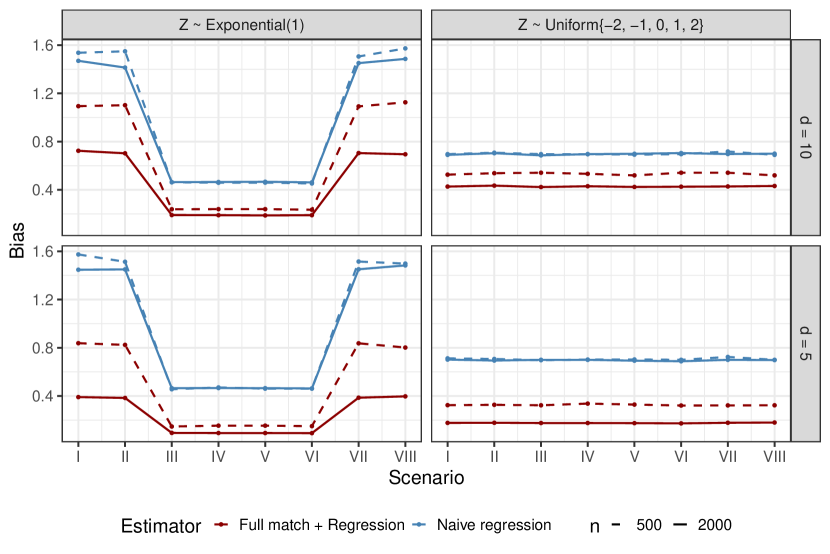
Factor defines the procedures, and Factor through define the data generating processes. In particular, we considered three different models for a non-binary treatment, and closely followed Rubin (1979) and Zhang et al. (2021b) in specifying the data generating processes for the observed covariates and the response surfaces ; see Rubin (1979, Section 3) and Zhang et al. (2021b, Section 5.1) for some rationals behind these data generating processes. While both Rubin (1979) and Zhang et al. (2021b) considered an additive effect for a binary treatment, we considered an effect proportional to the magnitude of the treatment dose. Two treatment effect estimators being considered here are , the naive regression adjustment estimator, and , the regression adjustment estimator with a fixed effect for each matched set after non-bipartite full matching. We calculate the bias, standard error, and mean squared error of both estimators under each of the data generating processes defined by Factor 2 through 6.
6.2 Simulation results
Using non-bipartite matching as a preprocessing step followed by regression adjustment seems to help reduce bias and mean squared error in circumstances. Supplementary Material C.3 summarizes the bias and mean squared error of and under each data generating process. Figure 5 visualizes the gain in bias reduction under a wide range of data-generating processes. We also observe that for a fixed , the gain from using statistical matching as a nonparametric preprocessing step seems to increase as increases, which is as expected because with a larger ratio, matched sets formed by non-bipartite matching tend to be more homogeneous; on the other hand, when the model is misspecified, a larger sample size does not seem to help remove bias of a naive regression estimator. For instance, when , , , has a bias of when and a bias of when , while has a bias of when and the bias reduces to when .
Consistent with the binary treatment case studied in Rubin (1973, 1979) and discussed in Ho et al. (2007), our simulation results seem to suggest that using non-bipartite matching as a nonparametric preprocessing step before regression analysis with a continuous treatment dose helps reduce model dependence and remove some bias.
7 Simulation studies II: comparing non-bipartite full matching to pair matching
7.1 Goal and structure
In this section, we systematically compare non-bipartite full matching with non-bipartite pair matching. We consider a continuous dose , , and the following factors that define a data generating process:
-
Factor 1: sample size, : and .
-
Factor 2: observed covariates distribution: , with and with , , , and .
We compare the non-bipartite full matching procedure as in Algorithm 1 and the optimal non-bipartite pair matching procedure in Lu et al. (2001, 2011). This is the third factor:
-
Factor 3: matching procedure: non-bipartite full matching and optimal non-bipartite pair matching .
For both matching procedures, we consider the following distance:
As discussed in Section 5.1, may incorporate the treatment/encouragement dose by adjusting the dose caliper and letting be a large penalty. Throughout the simulations, we let and be the fourth factor:
-
Factor 4: dose caliper size, : , , , , and .
To conclude, Factor and define the data generating processes and Factor and define the procedures to be studied.
7.2 Measurements of success
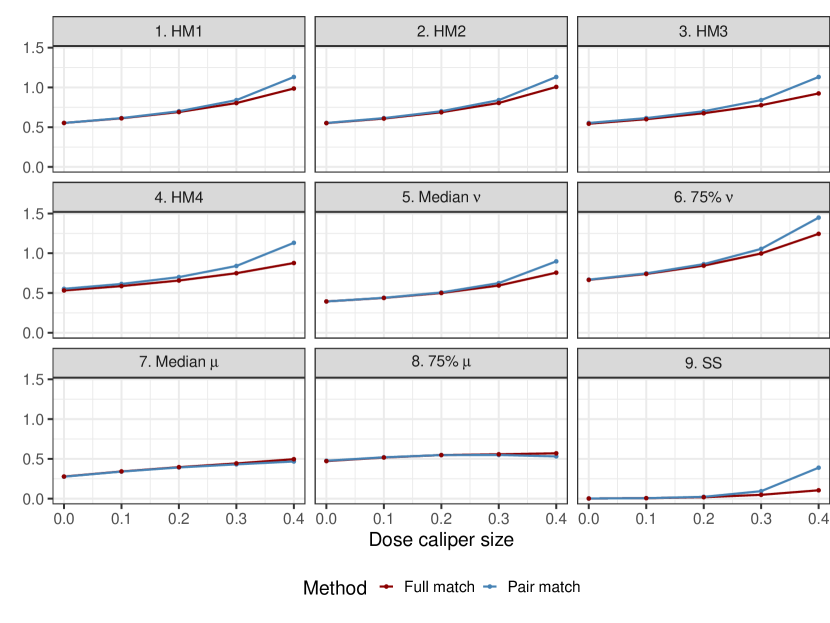
For a subclassification , we compute , the average Mahalanobis distance among all pairwise comparisons in each subclass , and then report the th, th (median), th, and th empirical quantiles of . We also report two weighted averages of . The weighting scheme assigns an equal weight to each matched set, regardless of its size, which corresponds to letting in Definition 2.2; denote by HM1 this first measure. The second weighting scheme assigns as described in Lemma 4.1. Denote by HM2 this second measure.
Next, for each subclass, we compute , the minimum (based on the Mahalanobis distance) among all as defined in Definition 2.4. We also report two weighted averages of : one with the weighting scheme and the other . Denote by HM3 and HM4 these two measures. Smaller values of HM1 through HM4 indicate better matched-sets homogeneity. Note that all four measures reduce to the same measure when the subclassification consists of only matched pairs.
We also consider a measurement of overall balance. In each subclass , let denote the average value of the ith observed covariate of units with treatment dose greater than or equal to the median treatment dose, and that of units with treatment dose below the median. For instance, if the subclass consists of units, each with the first observed covariate and treatment dose , then and for this subclass. Let denote the difference in means of the th covariate, and define to be the sum of the squared differences over all or observed covariates. In an ideal randomization experiment where treatment dose assignment is indeed randomized, distributions of observed covariates in the high and low dose groups are identical, and SS is small. Hence, smaller SS values signal better overall balance.
For each subclass , we further calculate , the average absolute “internal-node-minus-leaf” difference in as defined in Section 5.1. We report the minimum, th, th (median), and th empirical quantiles of . Finally, we report the number of matched set , and the average pairwise Mahalanobis distance and balance measure SS before matching.
7.3 Simulation results
Figure 6 summarizes the simulation results for selected measures when , , and . Simulation results for the other cases are qualitatively similar, and details can be found in Supplementary Material C.4.
We observe three consistent trends. First, when the dose caliper and the only goal of statistical matching is homogeneity in covariates , non-bipartite full matching and non-bipartite pair matching produce similar matched sets and have very similar performance with respect to all measures. Second, we observe that the number of matched sets in non-bipartite full matching decreases as increases. Third, for both full matching and pair matching, all four homogeneity measures HM1 to HM4 deteriorate as the dose caliper increases; however, non-bipartite full matching is capable of striking a better balance between homogeneity in covariates and heterogeneity in doses compared to non-bipartite pair matching. In fact, when , , , and , non-bipartite full matching outperforms non-bipartite pair matching simultaneously in all measurements of matched-sets homogeneity ( quantiles of and HM1 through HM4), measurements of heterogeneity in treatment/encouragement doses ( quantiles of ), and the overall balance SS. For instance, when , the median within-matched-sets Mahalanobis distance (i.e., th of ) is equal to for pair matching and for full matching, and the overall balance measurement SS is for pair matching and as small as for full matching.
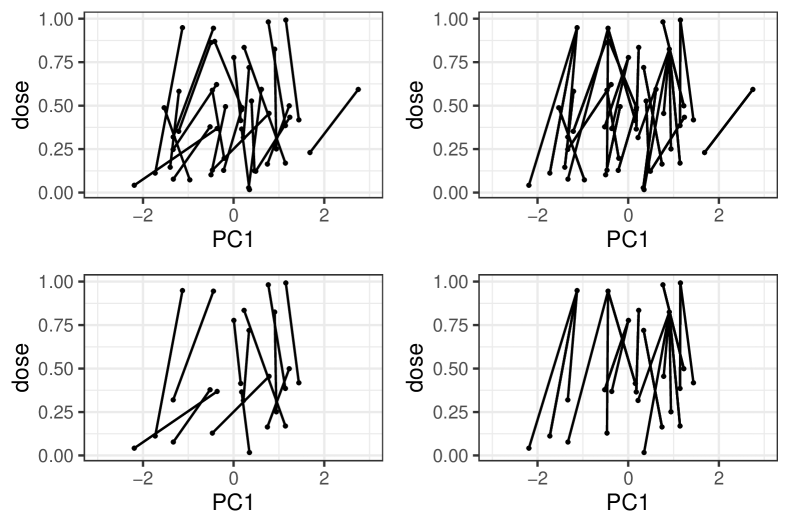
Finally, Figure 7 helps visualize the difference between an optimal non-bipartite pair match structure and an optimal non-bipartite full match structure using a small simulated dataset with , , and . To facilitate data visualization, we do a principle component analysis (PCA) and plot each unit’s dose against its first principle component (PC1). Top left panel and top right panel depict the match structure of the optimal non-bipartite pair match and optimal non-bipartite full match, both with . Two bottom panels eliminate matched pairs that are identical in two matches and focus on the match structure that are different in two matches. It is evident that the full match (corresponding to the bottom right panel) tends to connect units that are more different in the dose (i.e., larger difference in the y-axis) but similar in the first PC (i.e., small difference in the x-axis), compare to the pair match (corresponding to the bottom left panel).
8 The effect of TEE monitoring during CABG surgery on 30-day mortality
8.1 Data and study design
We obtained data on patients undergoing isolated CABG surgery from Centers for Medicare and Medicaid Services (CMS). We identified patients’ hospitals using the National Provider Identifier (NPI) numbers and obtained hospitals’ characteristics data from the American Hospital Association Survey. Patient-level data were merged to hospitals’ characteristics data using their unique NPI numbers. The study cohort consisted of all fee-for-service Medicare beneficiaries with a Part A (hospitalization) Medicare claim for isolated CABG surgery. Following MacKay et al. (2020b), we excluded (1) beneficiaries enrolled under managed care and not fee-for-service, (2) beneficiaries with less than six months of continuous enrollment in Medicare prior to the index admission for CABG surgery, (3) beneficiaries with age years, (4) beneficiaries without a cardiovascular or cardiac surgery-related Diagnosis Related Group (DRG) codes, (5) beneficiaries with a neurologic or stroke diagnosis as indicated by an ICD-9-cm code within the six months prior to the index admission or a stroke diagnosis with a “present on admission” (POA) indicator.
We follow MacKay et al. (2020b, 2021) and consider a cluster-level, instrumental variable analysis where each hospital defines a natural cluster and each hospital’s preference for TEE usage (defined as the fraction of CABG surgeries using TEE monitoring) is considered a valid instrumental variable after controlling for patients’ composition including average age, percentage of male patients, percentage of white patients, percentage of elective CABG surgeries, and percentage of patients having each of the following important comorbid conditions: arrhythmia, diabetes, congestive heart failure (CHF), hypertension, obesity, pulmonary diseases, and renal diseases, and hospital’s characteristics including total hospitals beds, teaching status, presence of any cardiac intensive care unit, total number of full-time registered nurses, and annual cardiac surgical volume. Our goal in the design stage is to divide hospitals into subclasses with good subclass homogeneity, overall balance, and good separation in their encouragement doses.
8.2 Matched samples
The first columns of Table 1 summarize the patient composition and hospital characteristics of hospitals whose preference for using TEE during CABG surgery is above the median preference and those below the median preference. We observe a systematic difference between the “above median” and “below median” groups before matching: many standardized differences (defined as the difference in means divided by the standard deviation) are above and two-sample Kolmogorow–Smirnov tests suggest that the distribution of covariates, including annual cardiac surgical volume, hospital beds, etc, are statistically different at level.
We then applied the developed non-bipartite full matching algorithm to the data using a dose-incorporating distance with being the Mahalanobis distance between observed pretreatment covariates, a large penalty, , and various choices of the dose caliper size . We followed the advice in Rubin (2007) and conducted the design without access to the outcome data in order to assure the objectivity of the design.
In particular, non-bipartite full matching with divides these hospitals into matched pairs, matched sets of size , of size , and of size . To get a sense of the balance after matching, we collect hospitals with higher doses in each matched set (including the one with median dose in a matched set with odd cardinality) and refer to them as the “high dose” group. The “high dose” group thus consists of hospitals. Similarly, we define the other hospitals as “low dose” hospitals. In an ideal (yet unattainable) randomized controlled trial where the dose assignment within each matched set is indeed randomized, the “high dose” and “low dose” groups would have similar distributions of patient composition and hospital characteristics. Non-bipartite full matching seems to replicate this ideal experimental benchmark, as seen from the last columns in Table 1: the “high dose” and “low dose” groups have similar covariate distributions and in fact no Kolmogorov-Smirnov test is significant at level. Moreover, before matching, the median Mahalanobis distance among all hospitals is , while the median “average pairwise Mahalanobis distance” is as small as after matching. Matched sets also have a good separation in their encouragement doses: the average internal-node-minus-leaf difference in the encouragement dose is among all matched sets. In Supplementary Material E, we further report the covariate balance of non-bipartite full matches under other choices of . We conduct inference with matched samples under because among all matches satisfying the stringent balance requirements (all standardized differences less than and no Kolmogorov-Smirnov tests significant at level), the match with produces the best separation in the encouragement doses. Compared to the original matched-pair design that discards approximately of hospitals, the full match design achieves similar balance while preserving all study units, and the outcome analysis based on the full match design is likely to have better generalizability (Cole and Stuart, 2010).
| Before Matching | After Matching | |||||||
| Below Median (n = 608) | Above Median (n = 609) | Std. Diff. | K-S Test -Value | Low Dose (n = 588) | High Dose (n = 629) | Std. Diff. | K-S Test -Value | |
| Patient Composition | ||||||||
| Mean age, yrs | 75.10 | 75.29 | -0.11 | 75.18 | 75.21 | -0.02 | 0.18 | |
| Male, % | 0.67 | 0.69 | -0.15 | 0.02 | 0.68 | 0.68 | -0.06 | 0.92 |
| White, % | 0.85 | 0.85 | 0.01 | 0.05 | 0.85 | 0.85 | 0.01 | 0.20 |
| Elective, % | 0.46 | 0.47 | -0.05 | 0.32 | 0.47 | 0.47 | 0.00 | 0.76 |
| Diabetes, % | 0.17 | 0.17 | -0.02 | 0.42 | 0.17 | 0.17 | 0.01 | 0.93 |
| Renal diseases, % | 0.09 | 0.09 | -0.07 | 0.07 | 0.09 | 0.09 | -0.01 | 0.69 |
| Arrhythmia, % | 0.11 | 0.12 | -0.10 | 0.11 | 0.11 | -0.02 | 0.08 | |
| CHF, % | 0.11 | 0.12 | -0.09 | 0.12 | 0.12 | 0.12 | -0.01 | 0.27 |
| Hypertension, % | 0.29 | 0.30 | -0.05 | 0.32 | 0.30 | 0.29 | 0.04 | 0.96 |
| Obesity, % | 0.06 | 0.06 | -0.06 | 0.03 | 0.06 | 0.06 | -0.03 | 0.36 |
| Pulmonary diseases, % | 0.02 | 0.02 | -0.12 | 0.02 | 0.02 | -0.05 | 0.43 | |
| Hospital Characteristics | ||||||||
| Cardiac surgical volume | 456 | 571 | -0.21 | 489 | 537 | -0.09 | 0.09 | |
| Teaching hospital, yes/no | 0.15 | 0.20 | -0.13 | 0.47 | 0.18 | 0.18 | 0.01 | 0.99 |
| Hospital beds | 336 | 419 | -0.33 | 370 | 386 | -0.06 | 0.12 | |
| Full-time registered nurses | 534 | 722 | -0.33 | 609 | 646 | -0.06 | 0.14 | |
| Cardiac ICU, yes/no | 0.70 | 0.72 | -0.04 | 0.99 | 0.71 | 0.71 | 0.02 | 0.99 |
8.3 Statistical inference: notation, potential outcomes, and a cluster-level sharp null hypothesis
Does using TEE during CABG surgery reduce patients’ 30-day mortality? In this section, we generalize the cluster-level, non-bipartite pair match set-up considered in Zhang et al. (2021a) to the current full match setting, and discuss how to test Fisher’s sharp null hypothesis of no treatment effect under the new design.
Suppose we have formed matched sets, indexed by , each with hospitals, indexed by , so that index uniquely identifies one hospital and there are a total of hospitals in total. Each hospital is associated with hospital-level covariates and a hospital-level continuous instrumental variable (or encouragement dose) . There are patients in each hospital , indexed by , so that index uniquely identifies one patient. Each patient is associated with a treatment indicator , outcome of interest , and individual-level covariates . In our application, we have formed matched sets so ; is the number of hospitals in each matched set so , , , or in our design; hospital-level instrumental variable is hospital’s preference for TEE during CABG surgery; is the number of patients undergoing CABG surgery in hospital ; is a binary indicator equal to if patient receives TEE monitoring and otherwise; is patient ’s 30-day mortality status; finally, describes hospital ’s characteristics and patient ’s characteristics. Following Zhang et al. (2021a), we assume that after controlling for patient composition and hospital characteristics, preference for TEE usage is a valid cluster-level instrumental variable.
Let denote the potential treatment received of patient when the hospital-level IV is set to , and is a shorthand for . Let denote unit ’s potential outcome under and . Under exclusion restriction, we have . Finally, let denote the collection of IV doses in matched set .
A cluster-level Fisher’s sharp null hypothesis states that
| (6) |
for all , , and such that . The null hypothesis generalizes the proportional treatment effect model in Small and Rosenbaum (2008) and Zhang et al. (2021a), and states that the mean difference of the hospital-aggregate potential outcomes when comparing any pair of two IV doses is proportional to the mean difference of the potential treatment received under IV dose and with structural parameter ; see Baiocchi et al. (2010) and Zhang et al. (2021a) for other causal null hypotheses that may be of interest. We consider testing the causal null hypothesis , i.e., TEE received during CABG has no effect whatsoever on patients’ 30-day mortality, against , i.e., TEE received during CABG lowers patients’ 30-day mortality.
8.4 Randomization-based inference
There are three key ingredients to perform a Fisher-style randomization-based test: a sharp null hypothesis, a randomized treatment assignment scheme, and a test statistic (Rosenbaum, 2002, 2010; Ding, Feller and Miratrix, 2016).
-
1.
Sharp null hypothesis: is sharp null hypothesis that allows us to impute the potential aggregate-outcome of cluster under any IV doses ; see, e.g., Zhang et al. (2021a, Section 3.1).
-
2.
Randomized treatment dose assignment: In a typical matched-pair design with matched pairs, there are a total of possible randomization configurations. In a full match design, within each matched set of hospitals, there are many IV dose assignments, each with equal probability; therefore, there are a total of randomizations induced by a full match design. Let denote this collection of all randomizations and one realization.
-
3.
Test statistic: In principle, any test statistic that depends on the treatment dose assignment and the potential outcomes only via potential outcomes’ dependence on can be combined with the randomization scheme to deliver a valid test for ; see, e.g., Ding, Feller and Miratrix (2016). With a binary treatment, a commonly-used test statistic for a full match design is the rank-sum test; see Rosenbaum (2002, 2004); Heng et al. (2021). We modify the rank-sum test statistic to reflect the continuous dose. Let , , and . Consider the following double rank sum statistic:
(7) where is the rank of among all doses , and the rank of among all the responses.
Researchers first impute all missing potential outcomes under and then enumerate all possible dose assignments. For each enumerated , calculate the corresponding under and the test statistic . The distribution of is then the exact null distribution of the test statistic under and conditional on the matched samples. By comparing to this exact null distribution, the exact -value is obtained. In practice, researchers may sample with replacement from and report a Monte Carlo -value.
8.5 Results
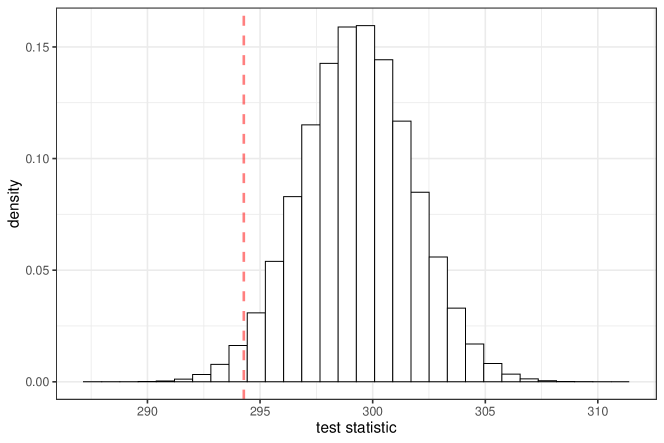
For matched sets we formed in the design stage, we generated the reference distribution using samples from all possible randomizations; see Figure 8. We calculated ; hence, one-sided -value is and the null hypothesis is rejected at level in favor of the alternative hypothesis that , i.e., using TEE during CABG surgery lowers patients’ 30-day mortality rate.
9 Discussion
In this paper we have systematically studied statistical matching and subclassification with a many-level or continuous exposure dose. We propose two optimality criteria for subclassification, each based on a natural subclass homogeneity measure. We characterize the relationship between these two criteria and leverage this relationship to develop an efficient polynomial-time algorithm that finds a subclassification that is guaranteed to be optimal with respect to one criterion and near-optimal with respect to the other criterion.
Our developed algorithm also allows empirical users to control separation in the exposure dose and cardinalities of formed subclasses. There are three tuning parameters involved in our flexible algorithm: dose caliper size , dose caliper penalty , and cardinality penalty . In many practical situations, we recommend setting to a minimum dose difference that would yield a meaningful difference in the potential outcomes, and (or a very large number) to enforce dose separation specified by . This way to specify tuning parameters is similar to setting propensity score calipers in a bipartite match; see, e.g., Zhang et al. (2021b, Section 2.3). We recommend setting the cardinality penalty by default to deliver an optimal full match; in the case where some subclasses have too many study units, should be gradually increased.
Our extensive simulations suggest that non-bipartite matching combined with regression adjustment helps remove bias in parametric causal inference; thus, we would recommend routinely using non-bipartite matching as a pre-processing step, as advocated by many researchers (Rubin, 1973, 1979; Ho et al., 2007; Stuart, 2010) in a binary treatment setting. Moreover, we found non-bipartite full match is advantageous over non-bipartite pair match in separating the treatment/encouragement doses and maintaining good subclass homogeneity and overall balance; therefore, the new design may be particularly useful in instrumental variable studies where separation of the IVs (or encouragement doses) would render outcome analysis much more efficient (Baiocchi et al., 2010).
Proofs, additional simulation studies, and more details on the application \sdescriptionSupplementary Material A contains a detailed literature review on bipartite and non-bipartite matching. Supplementary Material B.1-B.5 contain proofs of Lemma 3.1, Lemma 4.1, Corollary 3.2, Proposition 3.3 and 4.2. Supplementary Material B.6 proves that the output from the modified Algorithm 1 induces a subclassification that is optimal with respect to . Supplementary Material C.1 and C.2 illustrate a dose caliper and choice of using simulation studies. Supplementary Materials C.3 and C.4 provide additional simulation results. Supplementary Material D illustrates how to find a minimum-cost edge cover. Supplementary Material E provides further details on statistical matching in the application with different choices of the tuning parameter . {supplement} \stitlenbpfull_0.1.0.zip \sdescriptionR code implementing the proposed non-bipartite full match algorithm.
References
- Baiocchi et al. (2010) {barticle}[author] \bauthor\bsnmBaiocchi, \bfnmMike\binitsM., \bauthor\bsnmSmall, \bfnmDylan S\binitsD. S., \bauthor\bsnmLorch, \bfnmScott\binitsS. and \bauthor\bsnmRosenbaum, \bfnmPaul R\binitsP. R. (\byear2010). \btitleBuilding a stronger instrument in an observational study of perinatal care for premature infants. \bjournalJournal of the American Statistical Association \bvolume105 \bpages1285–1296. \endbibitem
- Baiocchi et al. (2012) {barticle}[author] \bauthor\bsnmBaiocchi, \bfnmMike\binitsM., \bauthor\bsnmSmall, \bfnmDylan S\binitsD. S., \bauthor\bsnmYang, \bfnmLin\binitsL., \bauthor\bsnmPolsky, \bfnmDaniel\binitsD. and \bauthor\bsnmGroeneveld, \bfnmPeter W\binitsP. W. (\byear2012). \btitleNear/far matching: a study design approach to instrumental variables. \bjournalHealth Services and Outcomes Research Methodology \bvolume12 \bpages237–253. \endbibitem
- Cochran and Rubin (1973) {barticle}[author] \bauthor\bsnmCochran, \bfnmWilliam G\binitsW. G. and \bauthor\bsnmRubin, \bfnmDonald B\binitsD. B. (\byear1973). \btitleControlling bias in observational studies: A review. \bjournalSankhyā: The Indian Journal of Statistics, Series A \bpages417–446. \endbibitem
- Cole and Stuart (2010) {barticle}[author] \bauthor\bsnmCole, \bfnmStephen R\binitsS. R. and \bauthor\bsnmStuart, \bfnmElizabeth A\binitsE. A. (\byear2010). \btitleGeneralizing evidence from randomized clinical trials to target populations: the ACTG 320 trial. \bjournalAmerican Journal of Epidemiology \bvolume172 \bpages107–115. \endbibitem
- Ding, Feller and Miratrix (2016) {barticle}[author] \bauthor\bsnmDing, \bfnmPeng\binitsP., \bauthor\bsnmFeller, \bfnmAvi\binitsA. and \bauthor\bsnmMiratrix, \bfnmLuke\binitsL. (\byear2016). \btitleRandomization inference for treatment effect variation. \bjournalJournal of the Royal Statistical Society: Series B (Statistical Methodology) \bvolume78 \bpages655-671. \bdoi10.1111/rssb.12124 \endbibitem
- Hahn et al. (2013) {barticle}[author] \bauthor\bsnmHahn, \bfnmRebecca T\binitsR. T., \bauthor\bsnmAbraham, \bfnmTheodore\binitsT., \bauthor\bsnmAdams, \bfnmMark S\binitsM. S., \bauthor\bsnmBruce, \bfnmCharles J\binitsC. J., \bauthor\bsnmGlas, \bfnmKathryn E\binitsK. E., \bauthor\bsnmLang, \bfnmRoberto M\binitsR. M., \bauthor\bsnmReeves, \bfnmScott T\binitsS. T., \bauthor\bsnmShanewise, \bfnmJack S\binitsJ. S., \bauthor\bsnmSiu, \bfnmSamuel C\binitsS. C., \bauthor\bsnmStewart, \bfnmWilliam\binitsW. \betalet al. (\byear2013). \btitleGuidelines for performing a comprehensive transesophageal echocardiographic examination: recommendations from the American Society of Echocardiography and the Society of Cardiovascular Anesthesiologists. \bjournalJournal of the American Society of Echocardiography \bvolume26 \bpages921–964. \endbibitem
- Hansen (2004) {barticle}[author] \bauthor\bsnmHansen, \bfnmBen B\binitsB. B. (\byear2004). \btitleFull matching in an observational study of coaching for the SAT. \bjournalJournal of the American Statistical Association \bvolume99 \bpages609–618. \endbibitem
- Hansen (2007) {barticle}[author] \bauthor\bsnmHansen, \bfnmBen B\binitsB. B. (\byear2007). \btitleOptmatch: Flexible, optimal matching for observational studies. \bjournalR News \bvolume7 \bpages18–24. \endbibitem
- Hansen and Klopfer (2006) {barticle}[author] \bauthor\bsnmHansen, \bfnmBen B\binitsB. B. and \bauthor\bsnmKlopfer, \bfnmStephanie Olsen\binitsS. O. (\byear2006). \btitleOptimal full matching and related designs via network flows. \bjournalJournal of Computational and Graphical Statistics \bvolume15 \bpages609–627. \endbibitem
- Heng et al. (2019) {barticle}[author] \bauthor\bsnmHeng, \bfnmSiyu\binitsS., \bauthor\bsnmZhang, \bfnmBo\binitsB., \bauthor\bsnmHan, \bfnmXu\binitsX., \bauthor\bsnmLorch, \bfnmScott A\binitsS. A. and \bauthor\bsnmSmall, \bfnmDylan S\binitsD. S. (\byear2019). \btitleInstrumental Variables: to Strengthen or not to Strengthen? \bjournalarXiv preprint arXiv:1911.09171. \endbibitem
- Heng et al. (2021) {barticle}[author] \bauthor\bsnmHeng, \bfnmSiyu\binitsS., \bauthor\bsnmKang, \bfnmHyunseung\binitsH., \bauthor\bsnmSmall, \bfnmDylan S.\binitsD. S. and \bauthor\bsnmFogarty, \bfnmColin B.\binitsC. B. (\byear2021). \btitleIncreasing power for observational studies of aberrant response: An adaptive approach. \bjournalJournal of the Royal Statistical Society: Series B (Statistical Methodology) \bvolume83 \bpages482-504. \bdoihttps://doi.org/10.1111/rssb.12424 \endbibitem
- Hillis et al. (2011) {barticle}[author] \bauthor\bsnmHillis, \bfnmL David\binitsL. D., \bauthor\bsnmSmith, \bfnmPeter K\binitsP. K., \bauthor\bsnmAnderson, \bfnmJeffrey L\binitsJ. L., \bauthor\bsnmBittl, \bfnmJohn A\binitsJ. A., \bauthor\bsnmBridges, \bfnmCharles R\binitsC. R., \bauthor\bsnmByrne, \bfnmJohn G\binitsJ. G., \bauthor\bsnmCigarroa, \bfnmJoaquin E\binitsJ. E., \bauthor\bsnmDiSesa, \bfnmVerdi J\binitsV. J., \bauthor\bsnmHiratzka, \bfnmLoren F\binitsL. F., \bauthor\bsnmHutter, \bfnmAdolph M\binitsA. M. \betalet al. (\byear2011). \btitle2011 ACCF/AHA guideline for coronary artery bypass graft surgery: a report of the American College of Cardiology Foundation/American Heart Association Task Force on Practice Guidelines developed in collaboration with the American Association for Thoracic Surgery, Society of Cardiovascular Anesthesiologists, and Society of Thoracic Surgeons. \bjournalJournal of the American College of Cardiology \bvolume58 \bpagese123–e210. \endbibitem
- Ho et al. (2007) {barticle}[author] \bauthor\bsnmHo, \bfnmDaniel E\binitsD. E., \bauthor\bsnmImai, \bfnmKosuke\binitsK., \bauthor\bsnmKing, \bfnmGary\binitsG. and \bauthor\bsnmStuart, \bfnmElizabeth A\binitsE. A. (\byear2007). \btitleMatching as nonparametric preprocessing for reducing model dependence in parametric causal inference. \bjournalPolitical Analysis \bvolume15 \bpages199–236. \endbibitem
- Imbens and Rosenbaum (2005) {barticle}[author] \bauthor\bsnmImbens, \bfnmGuido W\binitsG. W. and \bauthor\bsnmRosenbaum, \bfnmPaul R\binitsP. R. (\byear2005). \btitleRobust, accurate confidence intervals with a weak instrument: quarter of birth and education. \bjournalJournal of the Royal Statistical Society: Series A (Statistics in Society) \bvolume168 \bpages109–126. \endbibitem
- Lopez et al. (2017) {barticle}[author] \bauthor\bsnmLopez, \bfnmMichael J\binitsM. J., \bauthor\bsnmGutman, \bfnmRoee\binitsR. \betalet al. (\byear2017). \btitleEstimation of causal effects with multiple treatments: a review and new ideas. \bjournalStatistical Science \bvolume32 \bpages432–454. \endbibitem
- Lu et al. (2001) {barticle}[author] \bauthor\bsnmLu, \bfnmBo\binitsB., \bauthor\bsnmZanutto, \bfnmElaine\binitsE., \bauthor\bsnmHornik, \bfnmRobert\binitsR. and \bauthor\bsnmRosenbaum, \bfnmPaul R\binitsP. R. (\byear2001). \btitleMatching with doses in an observational study of a media campaign against drug abuse. \bjournalJournal of the American Statistical Association \bvolume96 \bpages1245–1253. \endbibitem
- Lu et al. (2011) {barticle}[author] \bauthor\bsnmLu, \bfnmBo\binitsB., \bauthor\bsnmGreevy, \bfnmRobert\binitsR., \bauthor\bsnmXu, \bfnmXinyi\binitsX. and \bauthor\bsnmBeck, \bfnmCole\binitsC. (\byear2011). \btitleOptimal nonbipartite matching and its statistical applications. \bjournalThe American Statistician \bvolume65 \bpages21–30. \endbibitem
- MacKay et al. (2020a) {barticle}[author] \bauthor\bsnmMacKay, \bfnmEmily J\binitsE. J., \bauthor\bsnmNeuman, \bfnmMark D\binitsM. D., \bauthor\bsnmFleisher, \bfnmLee A\binitsL. A., \bauthor\bsnmPatel, \bfnmPrakash A\binitsP. A., \bauthor\bsnmGutsche, \bfnmJacob T\binitsJ. T., \bauthor\bsnmAugoustides, \bfnmJohn G\binitsJ. G., \bauthor\bsnmDesai, \bfnmNimesh D\binitsN. D. and \bauthor\bsnmGroeneveld, \bfnmPeter W\binitsP. W. (\byear2020a). \btitleTransesophageal Echocardiography, Mortality, and Length of Hospitalization after Cardiac Valve Surgery. \bjournalJournal of the American Society of Echocardiography. \endbibitem
- MacKay et al. (2020b) {barticle}[author] \bauthor\bsnmMacKay, \bfnmEmily Jane\binitsE. J., \bauthor\bsnmZhang, \bfnmBo\binitsB., \bauthor\bsnmHeng, \bfnmSiyu\binitsS. and \bauthor\bsnmYe, \bfnmTing\binitsT. (\byear2020b). \btitleProtocol for a Retrospective, Comparative Effectiveness Study of the Association Between Transesophageal Echocardiography (TEE) Monitoring Used in Coronary Artery Bypass Graft (CABG) Surgery and Clinical Outcomes. \bjournalmedRxiv. \bdoi10.1101/2020.05.23.20110528 \endbibitem
- MacKay et al. (2021) {barticle}[author] \bauthor\bsnmMacKay, \bfnmEmily J\binitsE. J., \bauthor\bsnmZhang, \bfnmBo\binitsB., \bauthor\bsnmHeng, \bfnmSiyu\binitsS., \bauthor\bsnmYe, \bfnmTing\binitsT., \bauthor\bsnmNeuman, \bfnmMark D\binitsM. D., \bauthor\bsnmAugoustides, \bfnmJohn G\binitsJ. G., \bauthor\bsnmFeinman, \bfnmJared W\binitsJ. W., \bauthor\bsnmDesai, \bfnmNimesh D\binitsN. D. and \bauthor\bsnmGroeneveld, \bfnmPeter W\binitsP. W. (\byear2021). \btitleAssociation between transesophageal echocardiography and clinical outcomes after coronary artery bypass graft surgery. \bjournalJournal of the American Society of Echocardiography \bvolume34 \bpages571–581. \endbibitem
- Nishimura et al. (2017) {barticle}[author] \bauthor\bsnmNishimura, \bfnmRick A\binitsR. A., \bauthor\bsnmOtto, \bfnmCatherine M\binitsC. M., \bauthor\bsnmBonow, \bfnmRobert O\binitsR. O., \bauthor\bsnmCarabello, \bfnmBlase A\binitsB. A., \bauthor\bsnmErwin, \bfnmJohn P\binitsJ. P., \bauthor\bsnmFleisher, \bfnmLee A\binitsL. A., \bauthor\bsnmJneid, \bfnmHani\binitsH., \bauthor\bsnmMack, \bfnmMichael J\binitsM. J., \bauthor\bsnmMcLeod, \bfnmChristopher J\binitsC. J., \bauthor\bsnmO’Gara, \bfnmPatrick T\binitsP. T. \betalet al. (\byear2017). \btitle2017 AHA/ACC focused update of the 2014 AHA/ACC guideline for the management of patients with valvular heart disease: a report of the American College of Cardiology/American Heart Association Task Force on Clinical Practice Guidelines. \bjournalJournal of the American College of Cardiology \bvolume70 \bpages252–289. \endbibitem
- The Society of Thoracic Surgeons (2016) {bmisc}[author] \bauthor\bsnmThe Society of Thoracic Surgeons (\byear2016). \btitleThe STS Adult Cardiac Surgery Database (ACSD). \endbibitem
- Rosenbaum (1989) {barticle}[author] \bauthor\bsnmRosenbaum, \bfnmPaul R\binitsP. R. (\byear1989). \btitleOptimal matching for observational studies. \bjournalJournal of the American Statistical Association \bvolume84 \bpages1024–1032. \endbibitem
- Rosenbaum (1991) {barticle}[author] \bauthor\bsnmRosenbaum, \bfnmPaul R\binitsP. R. (\byear1991). \btitleA characterization of optimal designs for observational studies. \bjournalJournal of the Royal Statistical Society: Series B (Statistical Methodology) \bvolume53 \bpages597–610. \endbibitem
- Rosenbaum (2002) {bbook}[author] \bauthor\bsnmRosenbaum, \bfnmPaul R\binitsP. R. (\byear2002). \btitleObservational Studies. \bpublisherSpringer. \endbibitem
- Rosenbaum (2004) {barticle}[author] \bauthor\bsnmRosenbaum, \bfnmPaul R\binitsP. R. (\byear2004). \btitleDesign sensitivity in observational studies. \bjournalBiometrika \bvolume91 \bpages153–164. \endbibitem
- Rosenbaum (2010) {bbook}[author] \bauthor\bsnmRosenbaum, \bfnmPaul R\binitsP. R. (\byear2010). \btitleDesign of Observational Studies. \bpublisherSpringer. \endbibitem
- Rosenbaum and Rubin (1985) {barticle}[author] \bauthor\bsnmRosenbaum, \bfnmPaul R.\binitsP. R. and \bauthor\bsnmRubin, \bfnmDonald B.\binitsD. B. (\byear1985). \btitleConstructing a Control Group Using Multivariate Matched Sampling Methods That Incorporate the Propensity Score. \bjournalThe American Statistician \bvolume39 \bpages33-38. \bdoi10.1080/00031305.1985.10479383 \endbibitem
- Rubin (1973) {barticle}[author] \bauthor\bsnmRubin, \bfnmDonald B\binitsD. B. (\byear1973). \btitleMatching to remove bias in observational studies. \bjournalBiometrics \bpages159–183. \endbibitem
- Rubin (1979) {barticle}[author] \bauthor\bsnmRubin, \bfnmDonald B\binitsD. B. (\byear1979). \btitleUsing multivariate matched sampling and regression adjustment to control bias in observational studies. \bjournalJournal of the American Statistical Association \bvolume74 \bpages318–328. \endbibitem
- Rubin (1980) {barticle}[author] \bauthor\bsnmRubin, \bfnmDonald B\binitsD. B. (\byear1980). \btitleRandomization analysis of experimental data: The Fisher randomization test comment. \bjournalJournal of the American Statistical Association \bvolume75 \bpages591–593. \endbibitem
- Rubin (1986) {barticle}[author] \bauthor\bsnmRubin, \bfnmDonald B\binitsD. B. (\byear1986). \btitleStatistics and causal inference: Comment: Which ifs have causal answers. \bjournalJournal of the American Statistical Association \bvolume81 \bpages961–962. \endbibitem
- Rubin (2007) {barticle}[author] \bauthor\bsnmRubin, \bfnmDonald B\binitsD. B. (\byear2007). \btitleThe design versus the analysis of observational studies for causal effects: parallels with the design of randomized trials. \bjournalStatistics in Medicine \bvolume26 \bpages20–36. \endbibitem
- Schrijver (2003) {bbook}[author] \bauthor\bsnmSchrijver, \bfnmAlexander\binitsA. (\byear2003). \btitleCombinatorial optimization: polyhedra and efficiency. \bpublisherSpringer Science & Business Media. \endbibitem
- Small and Rosenbaum (2008) {barticle}[author] \bauthor\bsnmSmall, \bfnmDylan S\binitsD. S. and \bauthor\bsnmRosenbaum, \bfnmPaul R\binitsP. R. (\byear2008). \btitleWar and wages: the strength of instrumental variables and their sensitivity to unobserved biases. \bjournalJournal of the American Statistical Association \bvolume103 \bpages924–933. \endbibitem
- Stuart (2010) {barticle}[author] \bauthor\bsnmStuart, \bfnmElizabeth A\binitsE. A. (\byear2010). \btitleMatching methods for causal inference: A review and a look forward. \bjournalStatistical Science \bvolume25 \bpages1–21. \endbibitem
- Vazirani (2013) {bbook}[author] \bauthor\bsnmVazirani, \bfnmVijay V\binitsV. V. (\byear2013). \btitleApproximation Algorithms. \bpublisherSpringer Science & Business Media. \endbibitem
- Williamson and Shmoys (2011) {bbook}[author] \bauthor\bsnmWilliamson, \bfnmDavid P\binitsD. P. and \bauthor\bsnmShmoys, \bfnmDavid B\binitsD. B. (\byear2011). \btitleThe Design of Approximation Algorithms. \bpublisherCambridge University Press. \endbibitem
- Wu et al. (2018) {barticle}[author] \bauthor\bsnmWu, \bfnmXiao\binitsX., \bauthor\bsnmMealli, \bfnmFabrizia\binitsF., \bauthor\bsnmKioumourtzoglou, \bfnmMarianthi-Anna\binitsM.-A., \bauthor\bsnmDominici, \bfnmFrancesca\binitsF. and \bauthor\bsnmBraun, \bfnmDanielle\binitsD. (\byear2018). \btitleMatching on generalized propensity scores with continuous exposures. \bjournalarXiv preprint arXiv:1812.06575. \endbibitem
- Yang et al. (2016) {barticle}[author] \bauthor\bsnmYang, \bfnmShu\binitsS., \bauthor\bsnmImbens, \bfnmGuido W\binitsG. W., \bauthor\bsnmCui, \bfnmZhanglin\binitsZ., \bauthor\bsnmFaries, \bfnmDouglas E\binitsD. E. and \bauthor\bsnmKadziola, \bfnmZbigniew\binitsZ. (\byear2016). \btitlePropensity score matching and subclassification in observational studies with multi-level treatments. \bjournalBiometrics \bvolume72 \bpages1055–1065. \endbibitem
- Zhang et al. (2021a) {barticle}[author] \bauthor\bsnmZhang, \bfnmBo\binitsB., \bauthor\bsnmHeng, \bfnmSiyu\binitsS., \bauthor\bsnmMacKay, \bfnmEmily J\binitsE. J. and \bauthor\bsnmYe, \bfnmTing\binitsT. (\byear2021a). \btitleBridging preference-based instrumental variable studies and cluster-randomized encouragement experiments: Study design, noncompliance, and average cluster effect ratio. \bjournalBiometrics (in press). \endbibitem
- Zhang et al. (2021b) {barticle}[author] \bauthor\bsnmZhang, \bfnmB.\binitsB., \bauthor\bsnmSmall, \bfnmD. S.\binitsD. S., \bauthor\bsnmLasater, \bfnmK. B.\binitsK. B., \bauthor\bsnmMcHugh, \bfnmM.\binitsM., \bauthor\bsnmSilber, \bfnmJ. H.\binitsJ. H. and \bauthor\bsnmRosenbaum, \bfnmP. R.\binitsP. R. (\byear2021b). \btitleMatching one sample according to two criteria in observational studies. \bjournalJournal of the American Statistical Association \bvolume0 \bpages1-12. \bdoi10.1080/01621459.2021.1981337 \endbibitem