∎
Indian Institute of Technology, Bombay, India.
Tel.: +91-7506144481
22email: utkarshverma@iitb.ac.in 33institutetext: Narayan Rangaraj 44institutetext: Department of industrial engineering and operations research,
Indian Institute of Technology, Bombay, India.
Analysis of multi-registry kidney exchange program with individual rationality constraints
Abstract
Kidney exchange programs have been developed to overcome the compatibility challenges for the patient with incompatible donors in kidney transplantation. A registry of such incompatible donor-recipient pairs is created, and compatibility is achieved through the exchange of donors. Single-center kidney exchange registries do not have a significant pool size for achieving the full benefits of the kidney exchange program. Thus multi-registry exchange transplants seem to be a natural way forward. There are various challenges in multi-registry exchange programs, such as different constraints for each registry, varying bound on cycle lengths, and data sharing among registries. Researchers have proposed different merging mechanisms with a sequential merger, full merger with fair allocations, and full merger without any restrictions. To form a stable multi-registry sharing mechanism, registries should be individually rational both in the long run as well as in the short run. In this paper, an Integer Programming model for a multi-registry exchange program has been proposed with individual rationality constraints for each registry. A simulation study is conducted to compare the benefits of multi-registry programs with individual registry allocations on Indian data, and multiple analyses have been done. It was concluded that registries with lower arrival rates could benefit 7-9% in terms of the number of transplants and 4-6% in terms of quality of matches in a typical kidney exchange registry. Registry with more hard to match patients will benefit significantly larger than registries with more easy to match patients.
Keywords:
Kidney exchange program Integer programming Multi-agent kidney exchange transplants Compact formulation1 Introduction
The kidney exchange program is being practiced over the last two decades where an incompatible donor-recipient pair can exchange their donors to achieve compatibility j1 ; j2 ; j7 ; j9 ; j10 ; j11 ; j12 ; j13 . The growth of such programs has increased significantly in recent years with international and global kidney exchanges. In India, single-center exchange registries and combined hospital exchange registries are functioning, but those are not sufficient to reduce the burden of kidney transplants due to small registry sizes and logistical constraints. Multi-registry exchange programs seem to be a natural way forward to reduce the logistical challenges and increase the benefit of such exchange programs. In Europe, international collaborations for kidney exchanges have been practiced for a few years now, started with the first international exchange transplants between the Czech Republic and Austria in 2016 j20 . Two other functioning international collaborations for kidney exchanges are Spain-Italy-Portugal and Sweden-Norway-Denmark in the Scandiatransplant programme (STEP) j21 . Since state policies for exchange transplants can differ in a different state in India, inter-state transplants will be equivalent to international exchanges within Europe.
There are multiple challenges in multi-registry/international exchange programs (mKEP) like data among registries, different bounds on cycle lengths, and simultaneous or non-simultaneous execution of transplants j14 . It has been shown that there could be cases where individual registries have incentives not to share full data to mKEP, which restrict registries from forming a coalition naturally. There are currently two data sharing mechanisms among international/multi-registry setup, sequential merger, and full merger. The Czech Republic and Austria share their full registry data and allow algorithms to find solutions across registries. In Spain-Italy-Portugal collaboration, countries find their internal matches first and share the remaining data with other countries j14 . US also started multi-hospital exchange programs in 2008 j27 . An incentive-based allocation mechanism has also been proposed that will allow countries to share full data and fairly divide the benefit of mKEP to registries in the long run. However, long-term results may create trust among registries over time, but securing individual rationality for registries in each round will ensure no loss to registries, and a multi-registry setup can be created straightforwardly. A model with individual rationality would be better than sequential mergers as it will allow registries to share full data and secure a minimum number of transplants as found in individual allocation. Also, it provides an opportunity for patients to receive higher quality matches. In this paper, an Integer Programming (IP) model for mKEP is proposed, which ensures individual rationality for participating registries in each round, and a simulation study is conducted to compared mKEP solution with individual allocations.
Since all these registries started on their own, they came up with their own mechanism for allocation. This becomes a hurdle for registries to participate in mKEP. Registries could have different bounds on cycle length, a different scoring system for defining the quality of matches, different frequency of match runs, etc. Some of these issues can be solved by standardizing the process for mKEP and having a common frequency of matching runs and scoring system to define the quality of matches. The proposed IP model here includes constraints for creating different cycle bounds and a common bound on mKEP, which will restrict cycle length for each registry with their own bound and a global bound on mKEP cycles.
One of the practical challenges in setting up mKEP is the different rules for exchange cycle execution. For example, in India, the ASTRA registry in Mumbai performs simultaneous exchange cycles, but the IKDRC registry in Ahmadabad performs non-simultaneous exchanges as well j6 ; j19 . Now, in these types of scenarios, coordination among registries will be required for the execution of mKEP, and common ground on a simultaneous exchange can be created.
In the next section, the IP model for mKEP is given, and simulations on this model are shown thereafter.
2 IP model for multi-registry exchange program
Here, a compact integer programming formulation for mKEP is proposed where constraints are developed to ensure individual rationality for each registry. Let be the graph with set of nodes and set of directed arcs from one node to another if the donor at a node is compatible with the recipient at other nodes. Let be the set of registries participating in the multi-registry exchange. Let k registries are participating in a global coalition, so . Let represents the number of nodes in registry . and let represents the independent solution for registry . Registries can have different bound on cycle lengths, let be the set of bounds possessed by each registry. Now, registries will have a common bound for multi-registry exchanges, let the bound be .
For compact formulation, graph G is replicated M times, which is half of the number of nodes . Let the decision variables be
| (3) |
| (4) |
| (5) |
| (6) |
| (7) |
| (8) |
| (9) |
| (10) |
In the above model, Constraint 5,6 and 7 are the new constraints for mKEP, other constraints are standard flow constraints for usualy KEP. Constraint 5 ensures that each registry is bounded by it own cycle bound. The cycle bound for mKEP is ensured by constraints 6. Constraint 7 ensures that each registry will have a more or equal number of transplants in the global solution, thus ensuring individual rationality. All other constraints are the same as the compact formulation for KEP.
Here, non-directed donor chains are not included in the model but it can be modified easily to incorporate those chains as well.
3 Simulation plan
There are multiple factors to be analyzed in a global coalition of registries, such as how much additional benefit can be generated for each registry, how the size of registries affects the relative gain of each registry, what are the effects of blood group distribution of pairs in a global coalition. Peter et al. have compared two benefit-sharing schemes, which were based on Benefit value and Shapley Value and concluded that both schemes are similar with Shapley value based scheme having lower standard deviation j24 .
Various analysis of multi-registry KEP (mKEP) is done here to compared it with current allocation processes. The important consideration would be to analyze mKEP with different blood group distribution and varying registry sizes. This will allow us to understand the effects of heterogeneity and homogeneity among different registries. For the simulation, only two registry case were considered but it could be extended to multiple countries as well.
-
1.
Number of registries = 2
-
2.
Blood group distribution of registries - based on ASTRA and General blood group distribution in India
-
3.
Number of simulation runs = 12 (One for each three months for three years)
-
4.
Number of replications = 20 (To average out the randomness created in generation of blood group distribution and failure probabilities, each simulation run was replicated 20 times)
-
5.
Arrival rate = Small-Uniform(5-10), Medium-Uniform(10-20)
-
6.
Dropout probability - Probability of an un-match pair to exit the registry before the next round. Low (probability = 0.2) and High (probability = 0.4)
-
7.
Bound on cycle length - 2 (swap exchange, usually performed simultaneously), 3 (multi-way exchange, can be performed simultaneously or non simultaneously) and 6 (Large exchange cycles, usually performed non simultaneously)
-
8.
Parameters to be compared (Individual vs. Global registry) - Number of compatible transplants, Optimal score based on Human Leukocyte Antigen (HLA) and age data, relative gain of the multi-registry solution to independent registries solutions for number of transplants and optimal score, Blood group-wise comparison of number of patients matched, number of dropouts and their blood groups.
-
9.
Compatible matches - Included in the model and only those edges which had more edge score than the individual score was considered in the network.
3.1 Scoring system
In living donor kidney transplants, certain parameters become important in defining the quality of matches. Human Leukocyte Antigen (HLA) and age difference between donor and recipient are two main factors that define the quality of the match. In this chapter, a scoring system with these two parameters is considered, and edge weights in the model were based on these parameters. Graft survival of a transplanted kidney depends upon the quality of the match, higher quality of match results in better graft survival. So it becomes important to optimize the quality of matches simultaneously with number of transplants.
HLA parameters - There are several types of HLA antigens in a human body of which some are more considerable than the others. Here 6 HLA antigens types namely - HLA A1, A2, B1, B2, DR1 and DR2 are considered for defining the quality of a match. HLA matches are usually counted in mismatches of antigens between donor and recipient, and lesser the mismatch indicated better quality match. A total score of 100 is assigned to HLA mismatches and the scoring criteria is the following,
| Number of HLA mismatch | Score |
| 0 | 100 |
| 1 | 85 |
| 2 | 70 |
| 3 | 55 |
| 4 | 40 |
| 5 | 25 |
| 6 | 10 |
Age parameter - Another important parameter considered for quality of the match is the age difference between the donor and recipient. Graft survival of kidney increase with a decrease in age difference. Since age difference is a continuous variable, a function was defined to calculate the score for each compatible edges. It is assumed that score increased linearly with a decrease in age difference, and the function was truncated at a difference of 40. If the age difference between a donor and recipient is less than 40 then it gets a 0 age score otherwise, the score function is the following,
| (11) |
where x is the age difference between donor and recipient.
These two parameters are the ones that affect the quality of a match, other parameters like vascular access failure, waiting time of dialysis, hypertension, previously failed transplants etc. are considered for fairness of the allocation. For simulations, only these two parameters were considered for edge weights other parameters can be included in the scoring system when allocation will be done on real data.
4 Various analysis in mKEP
Several parameters affect the outcome of multi-registry KEP, such as size, blood group distribution, the proportion of hard to match patients, dropout probabilities, and bound on cycle length. This section will analyze the effect of change in parameters for all registries and each blood group type since there are two ways to merge different registries, sequential mergers and full mergers. In a sequential merger, countries do their internal matching first, and whatever data is remaining is shared with other registries. Italy, Spain, and Portugal merge their registry sequentially. Another way is a full merger of registries, where all the data is shared, and matching is found in that merged registries. In this simulation, a full merger of two registries was considered with a constraint that each country would have at least the same number of transplants that they could have achieved independently in that period. This will ensure that individual rationality will hold for each country in that round of simulation. There was no bound on the overall quality of transplants for each country as that will restrict the quality for multi-registry transplants.
With the above condition, the analysis of mKEP was done. A comparison of individual functioning registries with merged registries was performed and analyzed in the following sections.
4.1 Comparison with varying arrival rates of registries
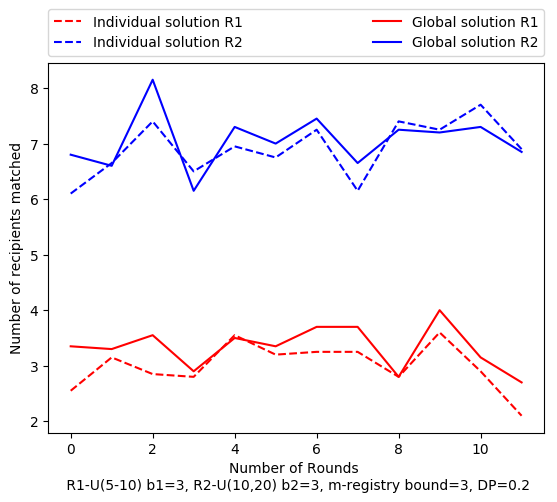
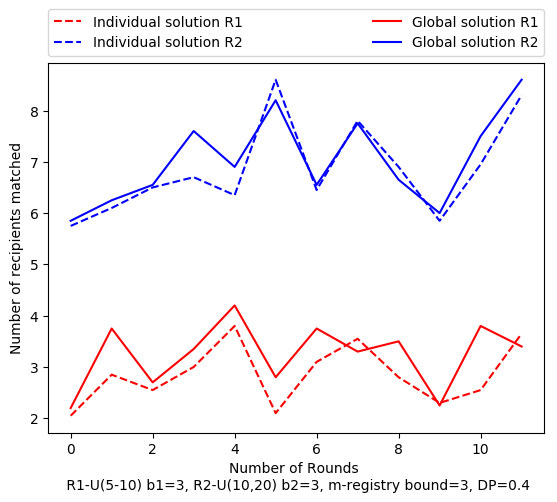
One of the important understandings required for mKEP is the effect of the registries’ pool size over the potential benefit. It could be possible that potential benefits might vary according to the size of registries. It is intuitive that smaller size registries might benefit more than the larger size registries in an imbalance registry size scenario. An estimate of the benefits for different size registries would be an important factor for registries to join the multi-registry KEP. In this analysis, a comparison of different size registries for two registry case is shown, number of patients matched, and blood group comparison is also presented.
| Registry 1 | Registry 2 | |||||
| Arrival rate | DP | mKEP/Ind Solution | mKEP/Ind Solution | Relative Gain | ||
| Transplants | Optimal Score | Transplants | Optimal Score | Transplants, Score | ||
| R1=U(5,10) R2=U(5,10) | 0.2 | 39.5/36.3 | 3064.4/2659.6 | 39.4/37.6 | 3049.3/2804 | 5, 650.1 |
| R1=U(5,10) R2=U(5,10) | 0.4 | 38.4/34.6 | 2912.2/2523.7 | 37.6/34.8 | 2864.9/2521 | 6.6, 732.4 |
| R1=U(5,10) R2=U(10,20) | 0.2 | 40/36 | 3197.3/2649.2 | 84.7/83 | 6805.7/6518.6 | 5.7, 835.2 |
| R1=U(5,10) R2=U(10,20) | 0.4 | 39/34.3 | 3086/2505.8 | 84.4/82.3 | 6688.5/6330.8 | 6.85, 937.9 |
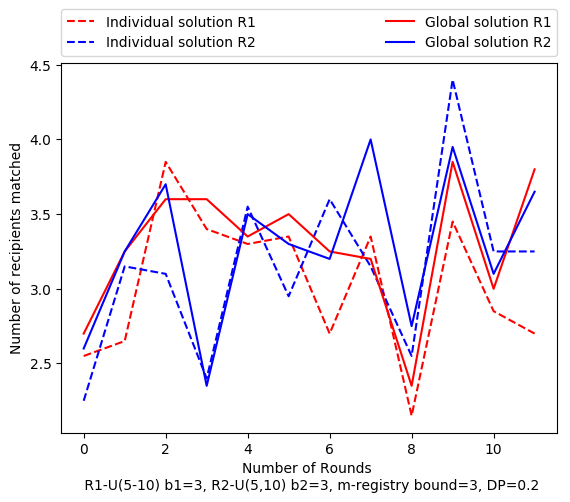
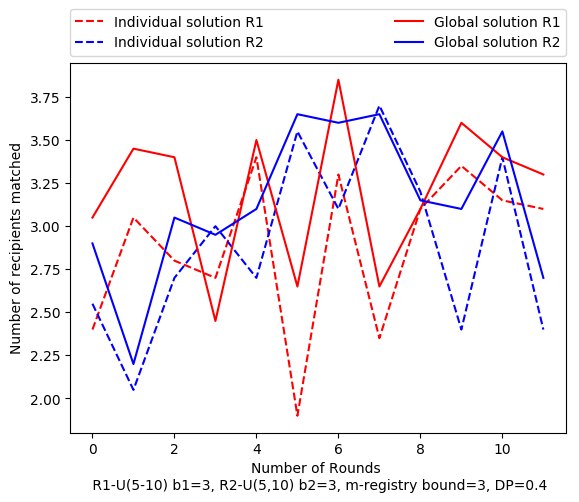
Table 2 shows the comparison of multi-registry KEP (mKEP) to individual functioning registries with different arrival rates and dropout probabilities. Here, it seems even with low arrival rates and smaller dropout probability, there were additional 5 transplants possible, and a significant improvement could be achieved in terms of quality of matches. As dropout probability increased from 0.2 to 0.4, relative gain also increases to additional 1.6 transplants, which will mean that if there is a high chance of dropping out, then mKEP will perform better than individual functioning registries. Multi-registry KEP had 6.8% and 9.5% additional transplants than the sum of individual allocations for similar arrival rates. Now, if a registry has a double rate of arrival than the other registry, then also both registries benefit significantly, and the overall benefit reduces to 4.8% and 5.9% for different dropout probabilities, which means that with higher arrival rates, registries will become self-sufficient to achieve the benefit of KEP in terms of number of transplants.
The average increase in edge score for registry 1 with a lower arrival rate was around 5.8%, and for registry 2 it was around 3.8%. Now with an increase in dropout probability, the average increase in edge score also drops to 4% for registry 1 and increases to 5.2% for registry 2. In other cases where registry 2 has double the arrival rate to registry 1, the average increase in edge score was 8% for registry 1 and 2.3% for registry 2. With higher dropout probability, the average increase in edge score increases to 8.4% for registry 1 and increases to 3.1% for registry 2. This implies that smaller size registries would benefit more than larger size registries in terms of the number of transplants and average edge scores, but there is a significant gain for larger-sized registries as well.
| Registry 1 | Registry 2 | ||||||||
| mKEP/Ind Solution | mKEP/Ind Solution | ||||||||
| Arrival rate | DP | O type | A type | B type | AB type | O type | A type | B type | AB type |
| R1=U(5,10) R2=U(5,10) | 0.2 | 2.5/ 2 | 18.3/ 16.5 | 17.4/ 16.6 | 1.3/ 1.3 | 2.5/ 2.5 | 16.9/ 16.5 | 18.1/ 16.6 | 1.9/ 1.9 |
| R1=U(5,10) R2=U(5,10) | 0.4 | 2.9/ 1.6 | 17.5/ 15.3 | 16.3/ 15.9 | 1.8/ 1.8 | 2.3*/ 2.4 | 15.9/ 15.1 | 17.8/ 15.6 | 1.7/ 1.7 |
| R1=U(5,10) R2=U(10,20) | 0.2 | 2/ 1.8 | 18.4/ 16.5 | 18.4/ 16.6 | 1/ 1 | 5.6/ 5.3 | 37.8/ 37.5 | 38/ 36.9 | 3.3/ 3.3 |
| R1=U(5,10) R2=U(10,20) | 0.4 | 2.9/ 2.4 | 16.6/ 15.3 | 17.9/ 15 | 1.7/ 1.7 | 5.8/ 5.6 | 38.2/ 36.5 | 37.7/ 37.4 | 2.7/ 2.7 |
Another important aspect of the comparison is the effect of mKEP on different blood type patients. Table 3 shows the comparison with different scenarios. O type patients are the most worrisome because of the compatibility of blood types as they can get a kidney only from an O type donor. So it is important that there should not be much loss to O type patients for every registry. The simulations show that with smaller dropout probability, the difference for O type patients was very small, and both A and B type patients gained additional transplants. However, with higher dropout probability and lower arrival rates, the mKEP solution might adversely affect O-type patients for some registries, but the overall number of transplants for O type patients increases. AB-type patients were not affected by the merging of registries. Since the difference for O-type patients was small, and the overall number of transplants remains the same, it should be acceptable for registries to have multi-registry exchange programs.
4.2 Comparison with varying blood group distribution
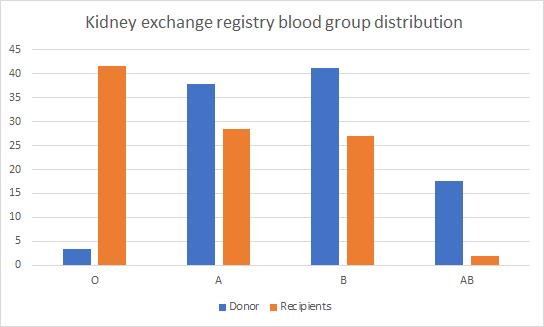
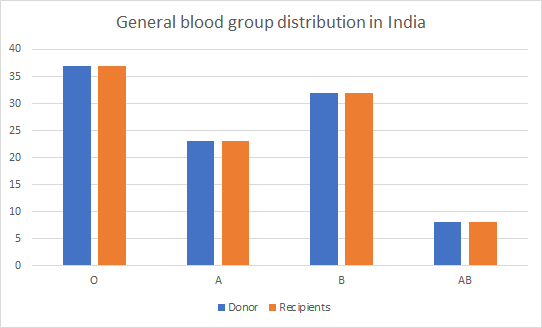
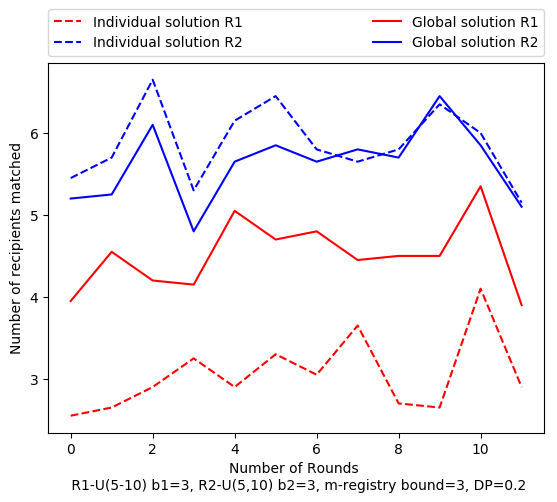
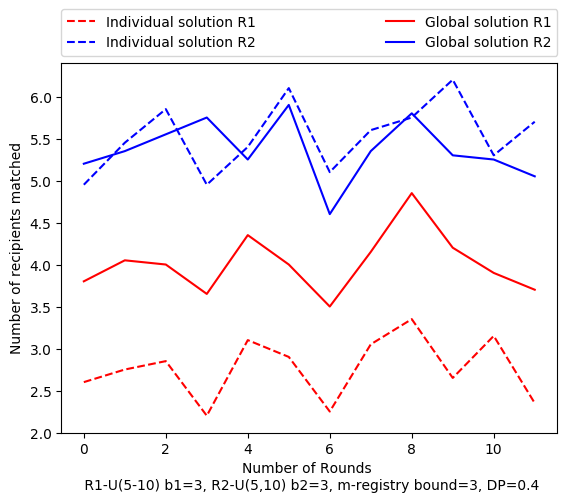
Another comparison in multi-registry KEP (mKEP) is to analyze its behavior when registries have different blood group distributions. Registries can have different distributions for donor and recipient blood groups, which can affect the outcome of the mKEP. So in this simulation, two different types of blood group distribution were considered, one was based on ASTRA registry distribution, and another one based on India’s general blood group distribution. For achieving the maximum benefit of KEP, donor and recipient blood group distributions should be similar so that there is no lack of kidneys of any blood type. In practice, usually compatible pairs do not register for exchange programs, but if they do, then donor and recipient blood group distribution will be similar, and the maximum benefit of KEP can be achieved. In a typical exchange registry, there would be lot more O type patients and AB type donors in comparison to O type donors and AB type recipients, respectively, which happens due to the compatibility of blood types. So it would be nice to compare a typical KEP registry distribution to the general blood group distribution of that region to analyze its effect over mKEP. Both the distributions are given in annex 1.
| Registry 1 | Registry 2 | |||||
| Arrival rate | DP | mKEP/Ind Solution | mKEP/Ind Solution | Relative Gain | ||
| Transplants | Optimal Score | Transplants | Optimal Score | Transplants, Score | ||
| R1=U(5,10) R2=U(5,10) | 0.2 | 54.1/36.6 | 4088.8/2730.8 | 67.4*/70.5 | 5222.5/5174.1 | 14.5, 1406.4 |
| R1=U(5,10) R2=U(5,10) | 0.4 | 48.2/33.2 | 3556.3/2369.9 | 64.4*/66.4 | 4967.6/4818.4 | 13, 1335.5 |
| C1=U(5,10) C2=U(10,20) | 0.2 | 63/35 | 4936.4/2622.8 | 150.9*/158.3 | 12138.8*/12266 | 20.5, 2186.4 |
| C1=U(5,10) C2=U(10,20) | 0.4 | 59.8/35.9 | 4714.4/2570.5 | 149.3*/150.6 | 11827.7/11639.1 | 22.6, 2332.6 |
| R1=U(10,20) R2=U(5,10) | 0.2 | 110/89.3 | 8730.1/7029.8 | 65.4*/69.7 | 5287.9/5117.3 | 16.4, 1871 |
| R1=U(10,20) R2=U(5,10) | 0.4 | 103.3/81.9 | 8112.5/6330.3 | 64.6*/67.1 | 5137.9/4888.5 | 18.9, 2031.7 |
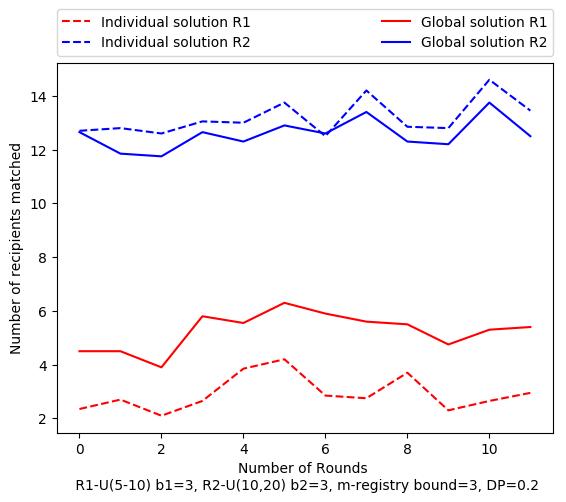
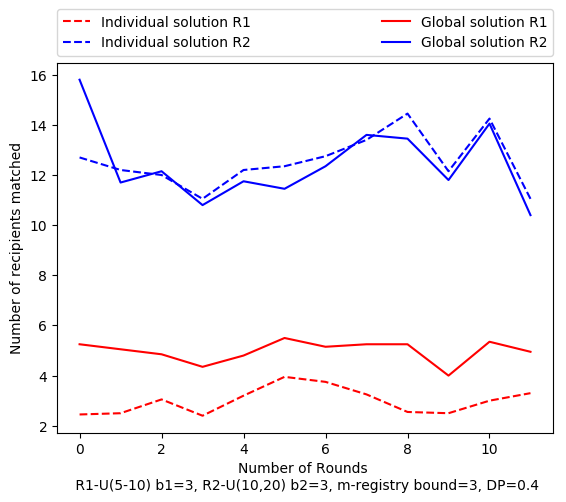
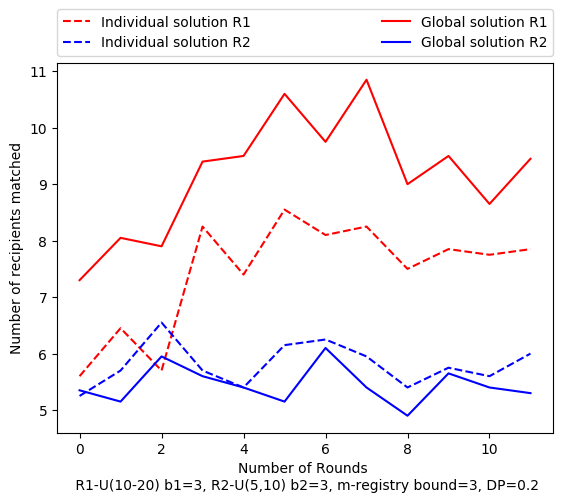
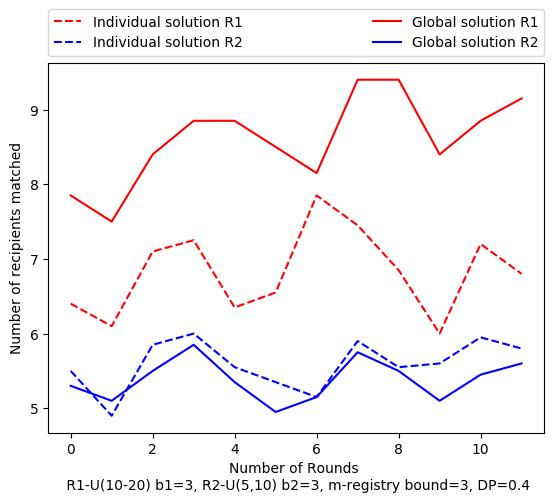
Table 4 shows that the registry with more number of easy to match pairs (i.e. Registry 2) might suffer a bit in terms of number of transplants but the overall gain is much more than the sum of an individual solution. Registry 2 has suffered a loss ranges between 0.9-6.6% (Percentage loss for all cases - 4.6, 3.1, 4.9, 0.9, 6.6, 3.9 ) for different arrival rates, the worst case occurred when registry 1 had double the size of registry 2. Registry 1 gain ranges between 23.2-80% (Percentage gain for all cases - 47.8, 45.2, 80, 66.6, 23.2, 26.1) in terms of number of transplants of which the largest gain achieved when registry 2 has double the rate of arrival as compared to registry 1. This is quite significant as there will be at least an additional 10% (Percentage gain for all cases - 13.1, 13, 10.6, 12.11, 10.3, 12.7) transplants in the combined registry.
In terms of quality of matches, registry 2 achieves more average edge scores for a transplant than individual allocations, which encourage them to participate in a multi-registry setup. Percentage gain in average edge score varies from 2.5% to 10.2% (Percentage gain - 5.6, 6.2, 3.7, 2.5, 10.2, 9) for registry 2, and the maximum gain is achieved when registry 1 has twice the arrival rate of registry 2. Registry 1 had a smaller increase in terms of average edge score for similar arrival rates (Percentage gain - 1.3, 3.4), but the gain increased for greater arrival rate for registry 2. Here, with an increase in dropout probability, the relative gain of mKEP increases except for the scenario where registry 1 has the same arrival rate of registry 2. Also, when registry 2 had a double arrival rate than registry 1, then loss occurred to it was decreased with an increase in dropout probability. However, overall gain improved quite a lot, which suggests that a large registry with more number of easy to match pairs can merge to a smaller registry with harder to match patients as the overall gain increases significantly and the loss to the large registry is relatively small. Also, if a larger registry with more hard to match patients joins a smaller registry with easier to match patients, then the larger registry gains significantly, and loss to the smaller registry decreases with an increase in dropout probability.
| Registry 1 | Registry 2 | ||||||||
| mKEP/Ind Solution | mKEP/Ind Solution | ||||||||
| Arrival rate | DP | O type | A type | B type | AB type | O type | A type | B type | AB type |
| R1=U(5,10) R2=U(5,10) | 0.2 | 13.1/ 2.5 | 19.7/ 16.2 | 20/ 16.6 | 1.3/ 1.3 | 17.6*/ 21.4 | 17.8/ 17.1 | 25/ 24.8 | 7.2/ 7.2 |
| R1=U(5,10) R2=U(5,10) | 0.4 | 10.7/ 1.5 | 17.5/ 15.2 | 18.3/ 14.8 | 1.7/ 1.7 | 17.8*/ 20.3 | 17/ 16.8 | 23.9/ 23.5 | 5.7/ 5.7 |
| R1=U(5,10) R2=U(10,20) | 0.2 | 19.6/ 1.8 | 19.1/ 15.7 | 22.5/ 15.8 | 1.5/ 1.8 | 41.8*/ 48.8 | 39.5/ 39.1 | 54.3*/ 55 | 15.3/ 15.3 |
| R1=U(5,10) R2=U(10,20) | 0.4 | 16.9/ 2.3 | 19.8/ 16 | 21.4/ 16 | 1.6/ 1.6 | 42.1*/ 46.8 | 41.8/ 38.7 | 50.8/ 50.6 | 14.7/ 14.4 |
| R1=U(10,20) R2=U(5,10) | 0.2 | 20.5/ 6.2 | 41.8/ 39 | 43.6/ 40 | 4/ 4 | 15.2*/ 20.4 | 18.8/ 17.7 | 24.1*/ 24.3 | 7.3/ 7.3 |
| R1=U(10,20) R2=U(5,10) | 0.4 | 19/ 5.5 | 39./ 34.8 | 41/ 36.6 | 3.5/ 3.5 | 14.9*/ 19.5 | 17.3/ 16 | 25.2/ 24.3 | 7.3/ 7.3 |
In table 5, blood group analysis of mKEP with varying blood group distribution is shown. It can be observed that mostly the O type patients in registry 2 suffer, but other blood type patients are better than individual solutions except for A-type patients in some cases. Even though there registry 2 does not get its fair share for O types patients, the total number of additional O type patients getting a compatible match has increased significantly and ranges between 20.1% to 36.3% (29.5, 30.7, 21.3, 20.1, 34.2, 36.3). Registry 1 gain quite largely in all blood group type patients except AB-type patients, which had similar results to individual allocation. When registry 2 had double the arrival rate of registry 1, then the loss to its O type patient becomes small and overall transplant of O type patients still increases by 20%. A registry with easy to match pairs could merge with a registry hard to match patients to increase its pool’s utility and for the better good of the patients with kidney failure.
4.3 Comparison with varying bound on cycle lengths
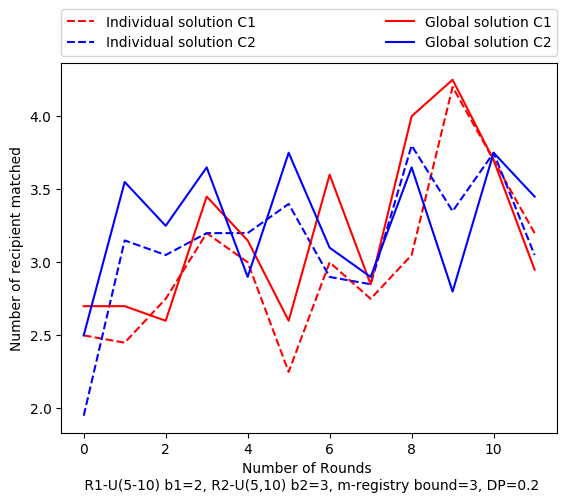
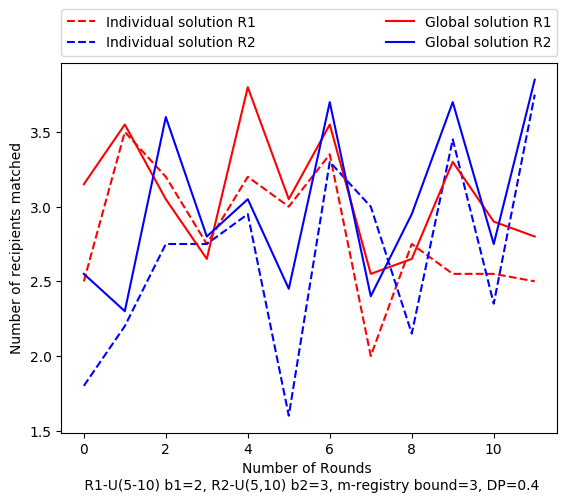
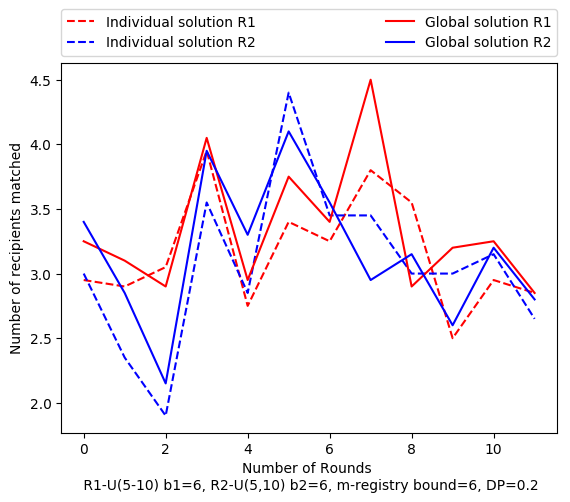
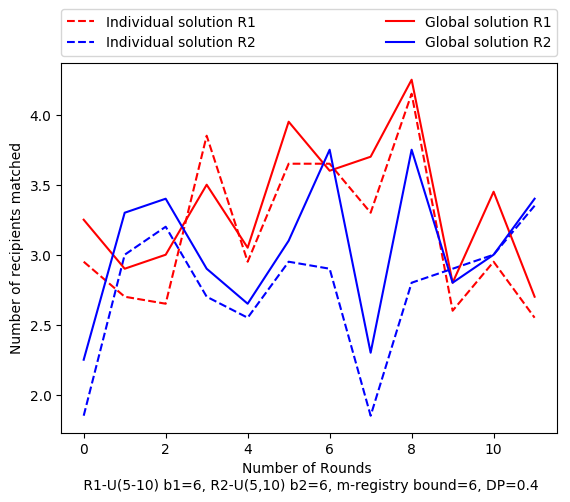
Another important parameter which can affect mKEP outcomes is the bound on cycle length for each registry. It can happen that registries have different bounds on cycle length due to various reasons like if a registry is managed by single-center or multicenter, hospital capacity of managing transplants and transplants are done simultaneously or non simultaneously, etc. In this section, comparison of mKEP with the individual solution with varying bounds is given. Blood group distribution was based on registry data from ASTRA, and lower arrival rates were considered for comparison.
| Registry 1 | Registry 2 | |||||
| Arrival rate | DP | mKEP/Ind Solution | mKEP/Ind Solution | Relative Gain | ||
| Transplants | Optimal Score | Transplants | Optimal Score | Transplants, Score | ||
| R1=U(5,10), b1=2 R2=U(5,10), b2=3 bound mKEP=3 | 0.2 | 38.6/36.1 | 2989.6/2588.6 | 39.3/37.7 | 3045.6/2763.9 | 4.1, 682.8 |
| R1=U(5,10), b1=2 R2=U(5,10), b2=3 bound mKEP=3 | 0.4 | 37/33.9 | 2807.8/2407.6 | 36.1/32.1 | 2737.5/2325.1 | 7.2, 812.6 |
| R1=U(5,10), b1=3 R2=U(5,10), b2=3 bound mKEP=3 | 0.2 | 39.5/36.3 | 3064.4/2659.6 | 39.4/37.6 | 3049.3/2804 | 5, 650.1 |
| R1=U(5,10), b1=3 R2=U(5,10), b2=3 bound mKEP=3 | 0.4 | 38.4/34.6 | 2912.2/2523.7 | 37.6/34.8 | 2864.9/2521 | 6.6, 732.4 |
| R1=U(5,10), b1=6 R2=U(5,10), b2=6 bound mKEP=6 | 0.2 | 40.1/37.9 | 3248.1/2855.1 | 38/36.8 | 3068.6/2772.1 | 3.5, 689.5 |
| R1=U(5,10), b1=6 R2=U(5,10), b2=6 bound mKEP=6 | 0.4 | 40.2/38 | 3175.1/2817.1 | 36.6/33.1 | 2852.5/2412.4 | 5.8, 798.1 |
Here it can be observed that, with similar arrival rates, the relative gain of mKEP is more for registry 1 (i.e. 2.5 additional transplants) which had tighter bound on cycle length as compared to registry 2 (i.e. 1.6). As dropout probability increases, the gain in terms of the number of transplants becomes higher for registry 2 (i.e. 4 ) compared to registry 1 (i.e. 3.1). This implies that as dropout probability increases, registry with tighter bound will lose out on additional transplants. Even with similar bound on cycle lengths, registries could have different gains in terms of the number of transplants and average edge scores. This could happen because of edge weights and some registry might benefit more than the other one. For these kinds of problems, the credit-based mechanism for mKEP was proposed by Peter et al. where they compared multiple benefit-sharing mechanisms. Now when the bound on both registries is large enough to execute it non simultaneously, the relative gain in terms of number of transplants decreases overall but the average edge score increases by 7% for both registries. This increase decreased slightly with an increase in dropout probability.
Thus registries with tighter bound will be benefiting by joining mKEP, and there will not be any loss to other registries. With non-simultaneous transplants, a larger bound on cycle length can be achieved, and a higher average edge score can be obtained, thus improving the quality of matches on an average.


| Registry 1 | Registry 2 | ||||||||
|---|---|---|---|---|---|---|---|---|---|
| mKEP/Ind Solution | mKEP/Ind Solution | ||||||||
| Arrival rate | DP | O type | A type | B type | AB type | O type | A type | B type | AB type |
| R1=U(5,10), b1=2 R2=U(5,10), b2=3 bound mKEP=3 | 0.2 | 2.5/ 1.8 | 18.2/ 16.4 | 16.6/ 16.6 | 1.3/ 1.3 | 2.5/ 2.8 | 16.8/ 16.6 | 18.3/ 16.6 | 1.7/ 1.7 |
| R1=U(5,10), b1=2 R2=U(5,10), b2=3 bound mKEP=3 | 0.4 | 1.8/ 1.5 | 17.3/ 15.6 | 16.6/ 15.6 | 1.3/ 1.3 | 2.6/ 2.3 | 15.4/ 13.9 | 16.4/ 14.2 | 1.8/ 1.8 |
| R1=U(5,10), b1=3 R2=U(5,10), b2=3 bound mKEP=6 | 0.2 | 2.5/ 2 | 18.3/ 16.5 | 17.4/ 16.6 | 1.3/ 1.3 | 2.5/ 2.5 | 16.9/ 16.5 | 18.1/ 16.6 | 1.9/ 1.9 |
| R1=U(5,10), b1=3 R2=U(5,10), b2=3 bound mKEP=6 | 0.4 | 2.9/ 1.6 | 17.5/ 15.3 | 16.3/ 15.9 | 1.8/ 1.8 | 2.3*/ 2.4 | 15.9/ 15.1 | 17.8/ 15.6 | 1.7/ 1.7 |
| R1=U(5,10), b1=6 R2=U(5,10), b2=6 bound mKEP=6 | 0.2 | 2.5/ 2 | 17.3/ 17.1 | 18.9/ 17.3 | 1.5/ 1.5 | 2*/ 2.5 | 18.2/ 16.8 | 16.8/ 16.4 | 1.1/ 1.1 |
| R1=U(5,10), b1=6 R2=U(5,10), b2=6 bound mKEP=6 | 0.4 | 2.6/ 2.1 | 17.7/ 16.9 | 17.9/ 17 | 2/ 2 | 2.3/ 1.7 | 16.4/ 14.8 | 16.4/ 15.1 | 1.5/ 1.5 |
In blood group-wise comparison, A-type and B type patients in registry 1 benefits more than respective patients from registry 2 as the benefit was more for the restricted registry. With a similar bound on cycle length, there could be a possibility that B type patients in one registry might suffer a bit lost, but overall there will be additional matches with B type patients. O type patients had no adverse effect for a particular registry except a case where registry 1 had a slight loss, but the similar gain was achieved by registry 2.
5 Conclusion
A multi-registry exchange program might be the way forward in the future of kidney transplants. It creates a platform for improving the number of transplants as well as the quality of matches. In this section, various analysis of mKEP was done on Indian data, and results showed that significant benefit could be achieved through it. The analysis suggested that small registries should come together to increase the pool size, which will result in a higher number of transplants and better quality matches. Registries with more number of hard to match patients will be better of by joining a registry with more easy to match patients, but the later does not have much incentive in terms of number of transplants, and they will consider joining the mKEP to achieve a significant gain in the quality of matches. The bound on cycle length also become crucial for registries to consider mKEP as registries with tighter bound will improve allot both in terms of number of transplant and quality of matches. If one considers non-simultaneous exchanges, then the bound of cycle length could be relaxed, and the benefit of mKEP will reduce as individual registries will start performing better.
On average mKEP will give an additional 7-9% for lower arrival rates, which might reduce a bit around 5-6% for higher arrival rates in a typical KEP registry. These percentages will increase with an increase in dropout probability, so registries, where dropout probabilities are high should consider participating in mKEP. Similarly, the quality of matches will improve by 4-6% with lower arrival rates, and smaller size registries will gain around 8-9% by joining a larger size registry in terms of quality of matches.
Blood group-wise comparison shows that mKEP will improve benefits for each type of patient, and no blood group will suffer by participating in mKEP. O blood type patients in easy-to-match registries might suffer in terms of number of transplants to that registry, but the overall significant increase can be seen for those patients, so from a patient’s point of view mKEP will always be better off than individual allocations.
References
- (1) Roth AE, Sonmez T, Unver MU, Pairwise Kidney Exchange, Journal of Economics Theory 2004, 151-188.
- (2) Roth, AE, Tayfun S, and Ünver MU, A Kidney Exchange Clearinghouse in New England, American Economic Review, 2005, 95 (2): 376-380.
- (3) Segev DL, Gentry SE, Melancon JK and Montgomery RA, Characterization of waiting times in a simulation of kidney paired donation, American Journal of Transplantation, 2005, 5 (10):2448-2455.
- (4) Karami F, Gentili M, Nayebpour M, Koizumi N, Melancon JK. Optimal integration of desensitization protocols into kidney paired donation (KPD) programs,Operations Research for Health Care, 2019, 22: 100198.
- (5) Veale J, Hil G., The National Kidney Registry: Transplant Chains–Beyond Paired Kidney Donation, Clinical Transplants 2009, Chapter 21.
- (6) Billa V, Verma U, Usulumarty D, Rangaraj N, Kumar R, Sanap G, Kothari J and Bichu S ”A novel method to increase the kidney donor pool: A fusion model linking the deceased donor waitlist to a paired kidney exchange program” Indian J Transplant 2018;12:187-92.
- (7) Ferrari P, Weimar W, Johnson RJ, Lim WH, Tinckam KJ, Kidney paired donation: principles, protocols and programs, Nephrol Dial Transplant (2015) 30: 1276–1285.
- (8) Rees M, Roberts J, Lentine K, Roth A, Leichtman A, Xiao H, Rafizadeh S, Neidich E, Melcher M, NEAD Chains Do Not Disadvantage Blood Type O, Black, or Highly Sensitized Patients. Am J Transplant. 2016;16 (suppl 3).
- (9) Kute VB, Agarwal SK, Sahay M, Kumar A, Rathi M, Prasad N, et al. Kidney-paired donation to increase living donor kidney transplantation in India: Guidelines of Indian Society of Organ Transplantation 2017. Indian Journal of Nephrol 2018; 28:1-9.
- (10) Wallis CB, Samy KP, Roth AE, Rees MA, Kidney paired donation, Nephrology Dialysis Transplantation 2011, 26(7): 2091-2099.
- (11) Abraham DJ, Blum A, Sandholm T, Clearing Algorithms for Barter Exchange Markets: Enabling Nationwide Kidney Exchanges, 8th ACM conference on Electronic commerce 2007, 295-304.
- (12) Anderson R, Ashlagib I, Gamarnik D, Roth AE, Finding long chains in kidney exchange using the traveling salesman problem, PNAS Early Edition 2014.
- (13) Constantino M, Klimentova X, Viana A, Rais A, New insights on integer-programming models for the kidney exchange problem, European Journal of Operational Research 2013, 57-68.
- (14) Mincu R, Biró P, Gyetvai M, Popa A, Verma U, IP solutions for international kidney exchange programmes. Central European Journal of Operations Research (CEJOR) 2020, 1-21. https://doi.org/10.1007/s10100-020-00706-5
- (15) Chen H, John PD, Avinatan H, Tuomas S and David S, Strategy-Proof and Efficient Kidney Exchange Using a Credit Mechanism, Proceedings of the Twenty-Ninth AAAI Conference on Artificial Intelligence, 2015, Pages 921-928.
- (16) Klimentova X,Pedroso JP and Viana A, Maximising expectation of the number of transplants in kidney exchange programmes, Computers and Operations Research, 2016, vol 73, pages 1-11.
- (17) Nickholds L and Mak-Hau V, Heuristic approaches for multi-criteria optimisation in kidney exchange programs, Proceedings of the 21st International Congress on Modelling and Simulation, Modelling and Simulation Society of Australia and New Zealand, 2015, pp. 1780-1786.
- (18) Biro P, Kern W, Palvolgyi D, Paulusma D, Generalized Matching Games for International Kidney Exchange, Proceedings of the 18th International Conference on Autonomous Agents and MultiAgent Systems (AAMAS) 2019, pp. 413-421, 9 p.
- (19) Kute VB, Patel HV, Shah PR, Modi PR, Shah VR, Rizvi SJ et al. Seventy-seven kidney paired donation transplantations at a single transplant centre in India led to an increase in living donor kidney transplantations in 2015, Clinical Kidney Journal, 2017, vol. 10, no. 5, 709–714.
- (20) Biro, P, van de Klundert J, Manlove D, et al. Modeling and optimization in European Kidney Exchange Programs. EUROPEAN JOURNAL OF OPERATIONAL RESEARCH, 2019 article in press.
- (21) Biro P , Haase-Kromwijk B , Andersson T , Ásgeirsson EI , Baltesová T , Boletis I , Bolotinha C , Bond G , Böhmig G , Burnapp L et. al, Building kidney exchange programs in Europe - an overview of exchange practices and activities, Transplantation, 2019, 103: 7 pp. 1514-1522.
- (22) Ashlagi I and Roth AE. New Challenges in Multi-hospital Kidney Exchange. American Economic Review 2012, 102 (3): 354-59.
- (23) Kute VB, Patel HV, Shah PR, Modi PR, Shah VR, Rizvi SJ, Pal BC, Shah PS, Wakhare PS, Shinde SG, Ghodela VA, Varyani UT, Patel MH, Trivedi VB, Trivedi HL. International kidney paired donation transplantations to increase kidney transplant of O group and highly sensitized patient: First report from India. World J Transplant. 2017, 7(1):64-69. doi: 10.5500/wjt.v7.i1.64.
- (24) Biró P, Gyetvai M, Klimentova X, Pedroso JP, Pettersson W, Viana A. Compensation Scheme With Shapley Value For Multi-Country Kidney Exchange Programmes. ECMS 2020: 129-136.
- (25) Klimentova X, Pedroso JP, Viana A. Maximising expectation of the number of transplants in kidney exchange programmes. Computers and Operations Research, 2016, 73: 1-11.
- (26) Alvelos FP, Klimentova X, Viana A. Maximizing the expected number of transplants in kidney exchange programs with branch-and-price. Annals of Operations Research, 2019, 272(1-2): 429-444.
- (27) Hanto RL, Reitsma W, Delmonico FL. The development of a successful multiregional kidney paired donation program. Transplantation. 2008;86(12):1744-8. doi: 10.1097/TP.0b013e3181909035.
Here, some data and algorithms are shown which was used the simulations.
Algorithm for simulation - Here the aim is to compare mKEP solution to individual solution by solving different IP models. The objective of the IP model is to maximize the number of transplants considering the quality of matches.
Appendix A Data distribution
The following blood group distribution was used for the simulations.
