capbtabboxtable[][\FBwidth]
Radio-Frequency Interference at the McGill Arctic Research Station
Abstract
The frequencies of interest for redshifted 21 cm observations are heavily affected by terrestrial radio-frequency interference (RFI). We identify the McGill Arctic Research Station (MARS) as a new RFI-quiet site and report its RFI occupancy using 122 hours of data taken with a prototype antenna station developed for the Array of Long-Baseline Antennas for Taking Radio Observations from the Sub-Antarctic. Using an RFI flagging process tailored to the MARS data, we find an overall RFI occupancy of 1.8% averaged over 20–125 MHz. In particular, the FM broadcast band (88–108 MHz) is found to have an RFI occupancy of at most 1.6%. The data were taken during the Arctic summer, when degraded ionospheric conditions and an active research base contributed to increased RFI. The results quoted here therefore represent the maximum-level RFI environment at MARS.
keywords:
radio astronomy; site testing†Corresponding author: taj.dyson@mail.mcgill.ca
; ; ;
1 Introduction
One of the greatest challenges facing contemporary radio astronomy experiments is terrestrial radio-frequency interference (RFI), which has steadily worsened over time as the globe has been populated with an increasing number of transmitters and other radiating sources. Radio astronomy experiments are often forced to operate from remote locations, where the RFI background is minimized, but the remoteness requirement is directly at odds with the simultaneous need for accessibility and logistical infrastructure. The need for RFI-quiet locations is especially important for cosmic dawn experiments measuring globally averaged 21-cm emission of neutral hydrogen (DiLullo et al., 2020; Nhan et al., 2019; Philip et al., 2019; Bowman et al., 2018; Singh et al., 2018). Because these experiments measure total power, the requirements on background RFI levels are far more stringent than the typical requirements for interferometric experiments, which benefit from cross-correlation. The problem is further compounded by the observing frequency range for cosmic dawn (–200 MHz), which encompasses the FM broadcast band.
We have identified the McGill Arctic Research Station (MARS)111https://www.mcgill.ca/mars/ as a new location with an exceptionally quiet RFI environment that can serve as an observing site for future low-frequency radio astronomy experiments. This paper presents spectral measurements below 125 MHz that were taken from MARS during July 2019, the methodology for identifying RFI in the data, and an assessment of the RFI occupancy.
2 Instrument
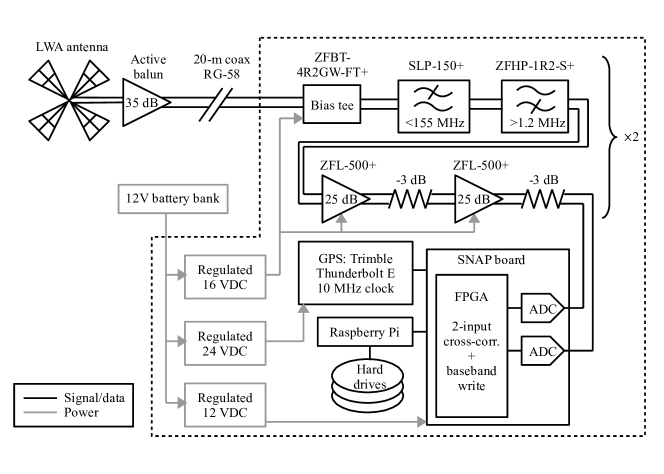
The primary data presented in this paper were recorded by a single pathfinder antenna station that was developed for the Array of Long Baseline Antennas for Taking Radio Observations from the Sub-Antarctic (ALBATROS; Chiang et al., 2020). Figure 1 shows a schematic diagram of the ALBATROS station. Incoming signals are received by a dual-polarization Long Wavelength Array (LWA) dipole antenna (Ellingson & Kramer, 2005), outfitted with an active-balun front-end electronics (FEE) module that provides dB gain (Hicks et al., 2012). The FEE is powered with 16 V, which is passed through the coaxial cable via bias tees. The back-end RF electronics consist of high- and low-pass filters from Minicircuits that band-limit the signal to 1.2–155 MHz, and amplifiers and attenuators that together provide an additional dB gain. A Smart Network ADC Processor (SNAP; Hickish et al., 2016) board digitizes the RF signals at 250 Msamp/s, and the ADCs are locked to a 10-MHz reference produced by a Trimble Thunderbolt E GPS-disciplined clock module. The SNAP FPGA computes auto- and cross-spectra of the two inputs over the full 0–125 MHz frequency range, with 2048 frequency channels and accumulation over few-second intervals. (The FPGA also computes channelized baseband data for each polarization over tunable frequency windows within the 0–125 MHz operating range, but these data are not used in the analysis presented here.) The low-pass filter cutoff in the back-end is intentionally set higher than the Nyquist frequency to alias in the 137–138 MHz downlink signal from the ORBCOMM satellite constellation. Thus, any RFI observed above 95 MHz may have been aliased from 125–155 MHz. A Raspberry Pi 3B+ single board computer controls the SNAP board and receives the auto- and cross-spectra via GPIO connections, and the spectra are saved to an on-board SD card. The back-end electronics (within the dashed box in Figure 1) are portable, but the LWA antenna and front-end are not. At the sites surrounding MARS (Figure 3), RFI measurements were taken with a LoWavz LW-10K60M antenna outfitted with its impedence matcher, a Mini-Circuits ZFL-500LN+ amplifier providing dB gain, and a bias tee to block the DC voltage supplied by the back-end electronics. While the LoWavz antenna is not sufficiently sensitive for cosmological observations, especially above 60 MHz, it suffices for an RFI survey.
3 Observations
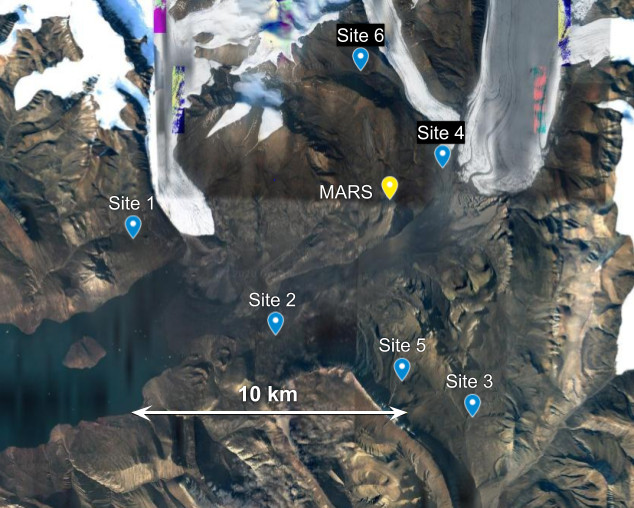
MARS is a small research base located at N, W, approximately 40 km inland at the head of Expedition Fjord on Axel Heiberg Island, Nunavut. MARS is accessible during April–August via small chartered aircraft from Resolute Bay (540 km south). The closest radio transmitters are Eureka (120 km northeast), Grise Fjord (360 km south), Resolute Bay, and Alert (590 km northeast), suggesting that MARS and its surroundings should have low levels of RFI. Furthermore, MARS is attractive for low-frequency radio astronomy because favourable ionospheric conditions are expected at high latitudes, especially during the Arctic winter when the polar ionosphere is only weakly ionized in the prolonged absence of solar radiation. Simulations using the International Reference Ionosphere model (Bilitza, 2018) suggest that the summer and winter plasma cutoff frequencies differ by about a factor of two at MARS. Additionally, measurements taken during the Arctic winter are free of solar RFI during the continuous night. Thus, due to its isolation from radio transmitters, its polar latitude, and its reasonable accessibility, MARS is a promising candidate location for ground-based low-frequency radio astronomy and is being investigated as a potential site for the ALBATROS and MIST222http://www.physics.mcgill.ca/mist experiments. To assess the RFI environment at MARS, observations were taken using the instrumentation described in §2 at the main MARS base and at several surrounding sites shown in Figure 3.
| \topruleSite Label | Latitude | Longitude |
|---|---|---|
| (∘ N) | (∘ W) | |
| \colruleMARS | 79.415 | 90.749 |
| 1 | 79.402 | 91.209 |
| 2 | 79.370 | 90.953 |
| 3 | 79.343 | 90.601 |
| 4 | 79.425 | 90.654 |
| 5 | 79.355 | 90.726 |
| 6 | 79.457 | 90.801 |
| \botrule |
[\Xhsize][]
3.1 MARS base
The RFI measurements discussed in this paper are derived from data taken at the MARS base during July 9–21, 2019. A total of 122 and 106 hours of data were recorded from the east-west and north-south antenna polarizations, respectively. During the summer period, the sun remains above the horizon continually, raising the ionospheric plasma cutoff frequency in comparison to winter conditions. Furthermore, when the base is actively used by researchers, power is supplied primarily by solar panels and a power inverter, which generate a large amount of RFI. Data were therefore recorded during overnight periods while the MARS power system was turned off to eliminate the largest source of local RFI. Some weaker sources of local RFI (e.g., personal electronics) remained present, particularly as the base population increased during the summer period. Because of slightly elevated local RFI and degraded ionospheric conditions, the data presented here likely represents the worst-case RFI environment at MARS.
3.2 Survey sites
To investigate potential local variation in the RFI environment, data were also recorded at several sites within 10 km of MARS, as shown in Figure 3 and listed in Table 3. These sites are candidate locations for future ALBATROS antenna installations because they have suitable terrain and are accessible by foot. All data at these sites were taken while the MARS power inverter and electronics were on; however, the RFI emitted at the base is not visible at few-km separation distances. The observing period at sites 1–5 was minutes each, and data were recorded at site 6 for hours.
4 RFI identification methodology
The MARS RFI environment was characterized by analyzing autospectra with the processing steps described below, which focus on identifying narrow-band features. Each of the two antenna polarizations for each night of data, comprising hours of obervation, is treated independently. Since RFI can be many orders of magnitude brighter than Galactic emission, the analysis procedure is performed on the autospectra on an arbitrary decibel scale.
[(3)]
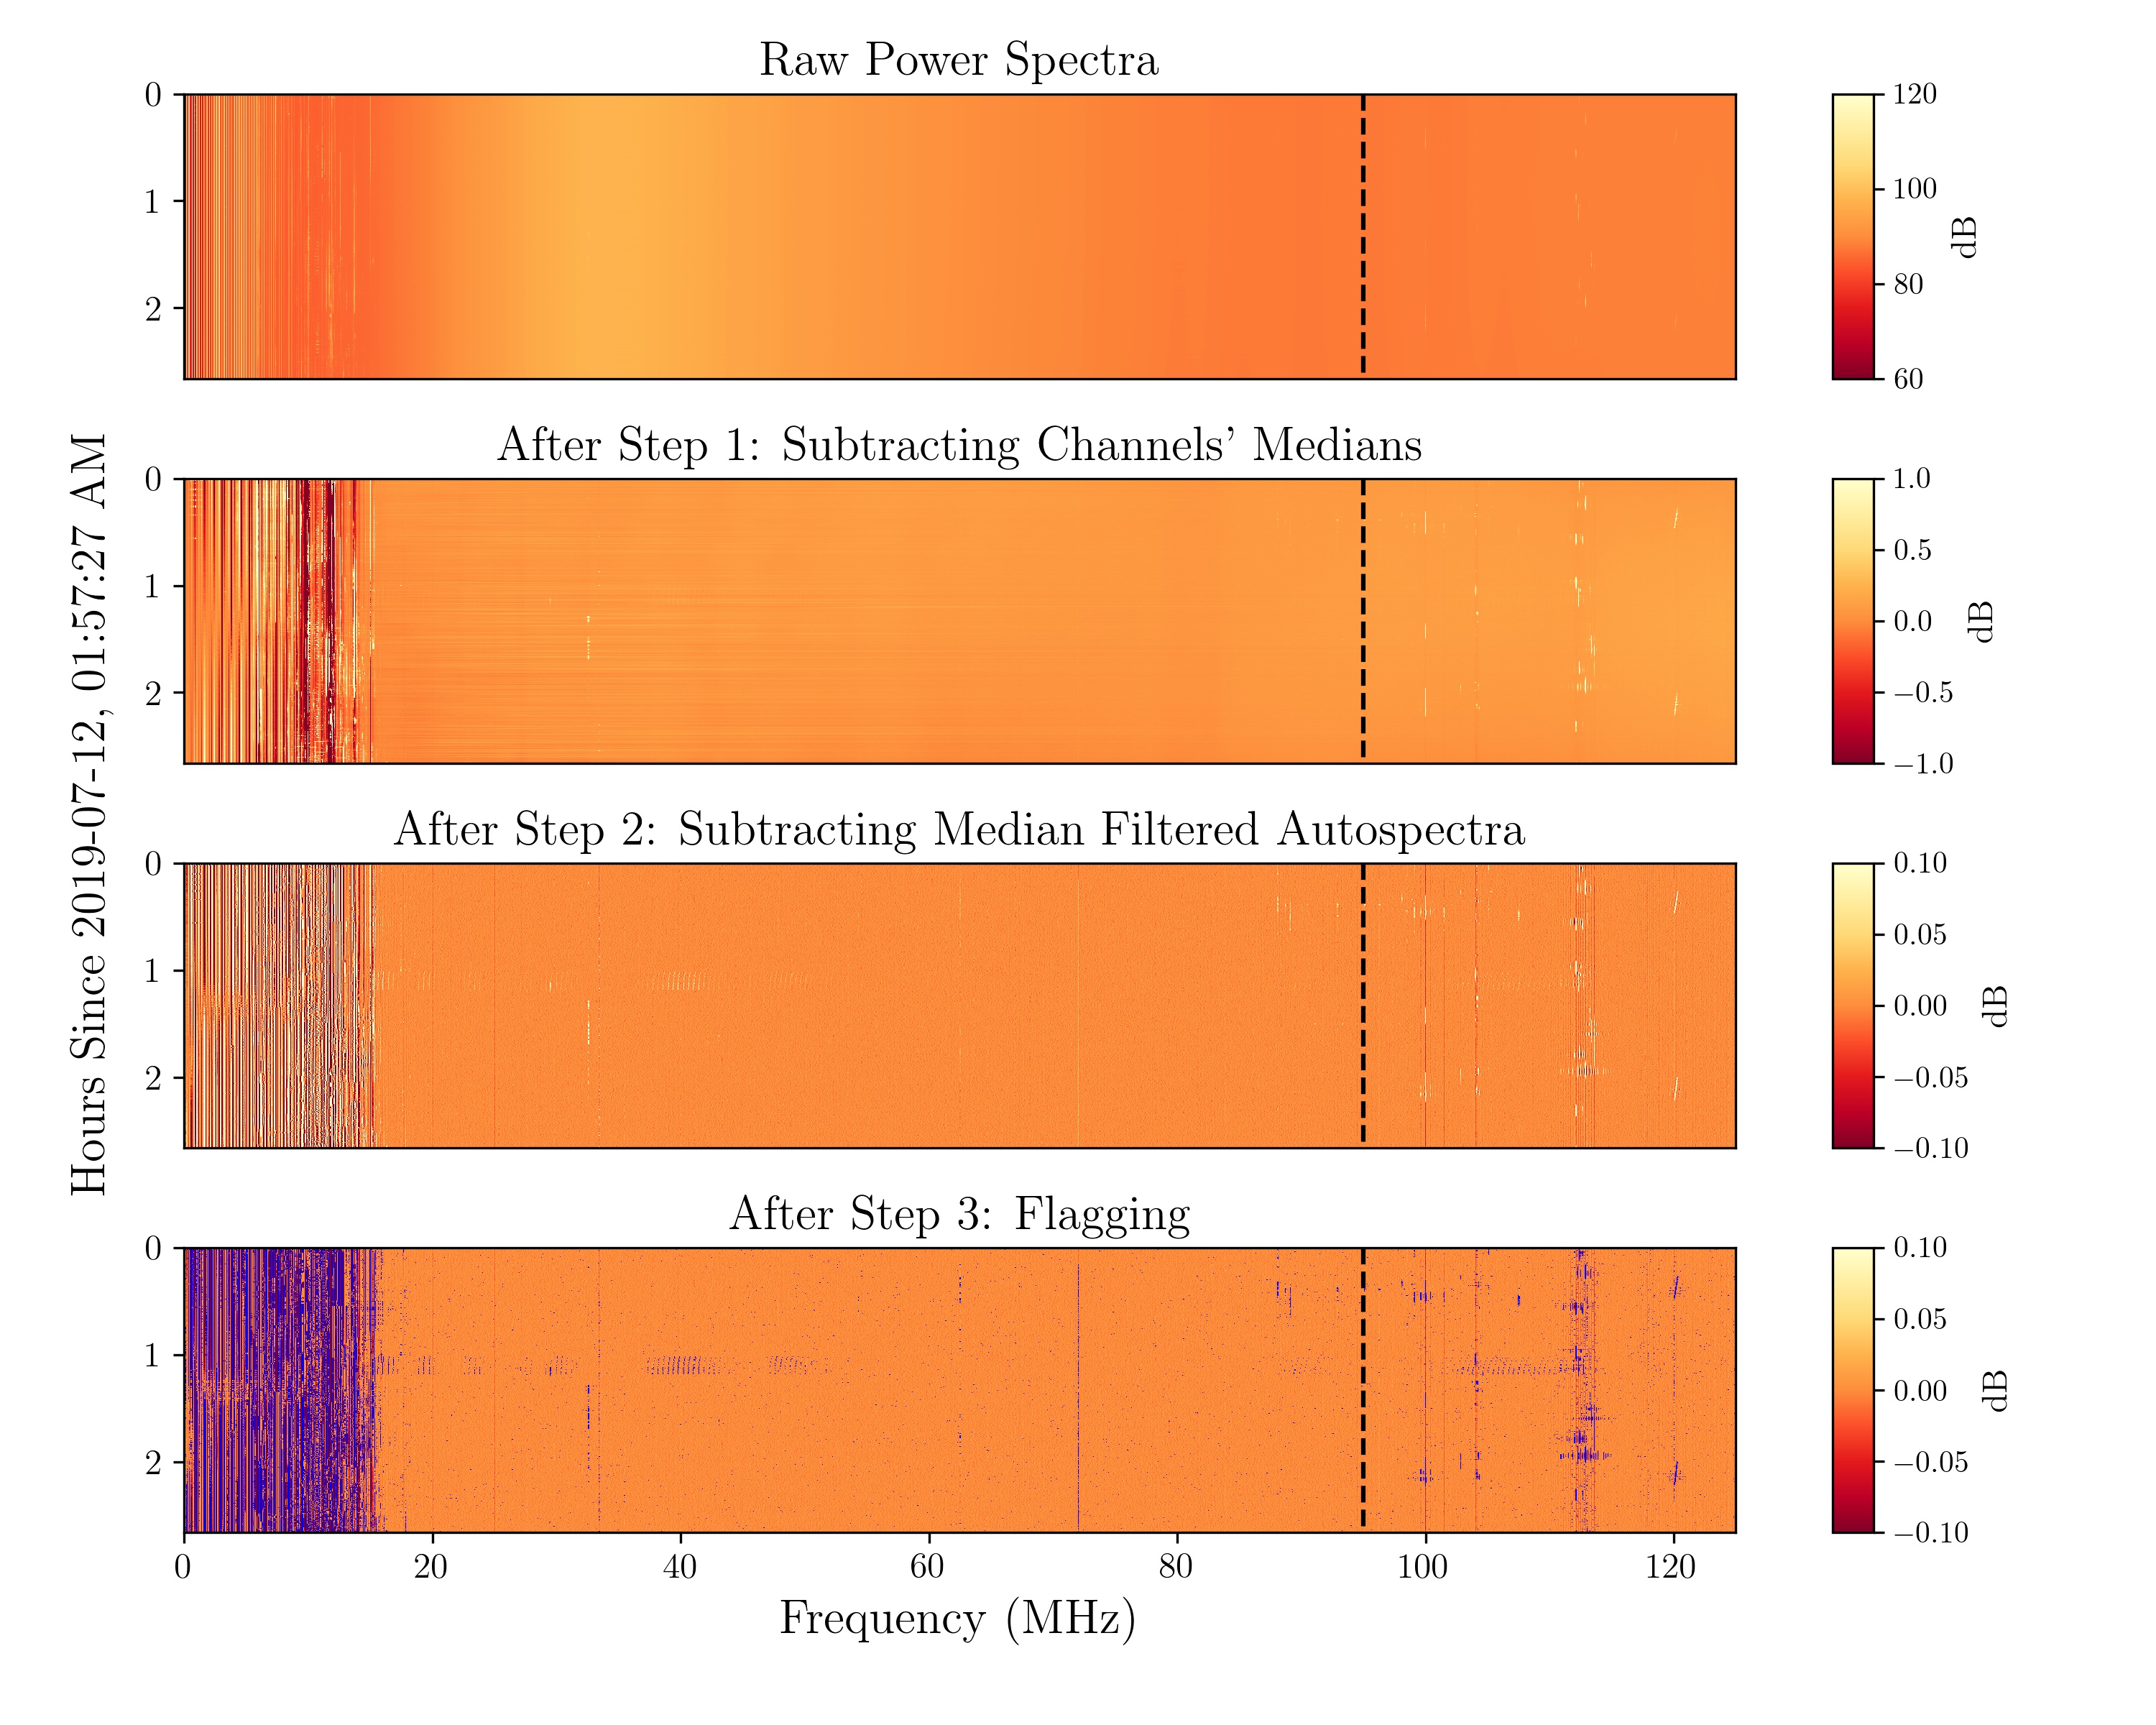
The median of each frequency channel across the duration of the observation is subtracted from that channel. This step removes most of the large-scale Galactic spectral structure, flattening the signal in preparation for the median filter applied in the next step. The first and second panels of Figure 4 show the data before and after this step, respectively.
Each autospectrum is passed through a median filter with a window of 300 kHz (5 channels), which roughly corresponds to the width of the narrowest non-RFI features, which are caused by cable reflections. Each median-filtered autospectrum is then subtracted from each original autospectrum to remove any signal that varies arbitrarily quickly in time but only slowly in frequency, such as the Galaxy’s diurnal variation. The data after subtracting the median filtered autospectra are shown in the third panel of Figure 4.
All points more than five median absolute deviations (MADs) above the median taken over the whole observation are flagged as RFI. Flagged data are shown in blue in the bottom panel of Figure 4.
After the data are flagged, the RFI occupancy is calculated as the ratio of flagged samples to total samples for each frequency channel. Statistical noise in the data contribute a small false flagging rate. For Gaussian noise, 1 MAD , and the flagging threshold of 5 MADs therefore corresponds to 3.35. The expected false flagging rate, corresponding to the percentage of noise , is thus 0.04% at a minimum (variations in noise level during an observation due to changing Galactic brightness could cause higher false flagging rates).
The above flagging procedure has two main limitations. First, the flagging breaks down for RFI-saturated frequency channels, where the true RFI occupancy is above 50%. During the Arctic summer, shortwave and HF radio reflected from the ionosphere cause this saturation at frequencies below roughly 20 MHz. Although RFI occupancy is calculated over the full frequency range, the values below 20 MHz are likely underestimated and are omitted when computing the average levels. Second, the flagging procedure is insensitive to low-intensity broadband RFI features, which cannot be distinguished from broadband non-RFI signal variation (such as gain fluctuations). The removal of these types of signals can be seen in Figure 4, where faint horizontal striping features are subtracted between the second and third panels. Because the flagging procedure can potentially remove bright broadband RFI as well, we searched for these high-amplitude events separately by examining the distribution of root mean square (RMS) values of each median filtered autospectrum (computed as part of step 2) for frequencies above 20 MHz. No outliers were detected, and the median and maximum RMS values are 0.1 dB and 0.3 dB respectively over all nights at MARS, thus confirming the absence of bright broadband RFI.
5 Results and conclusion
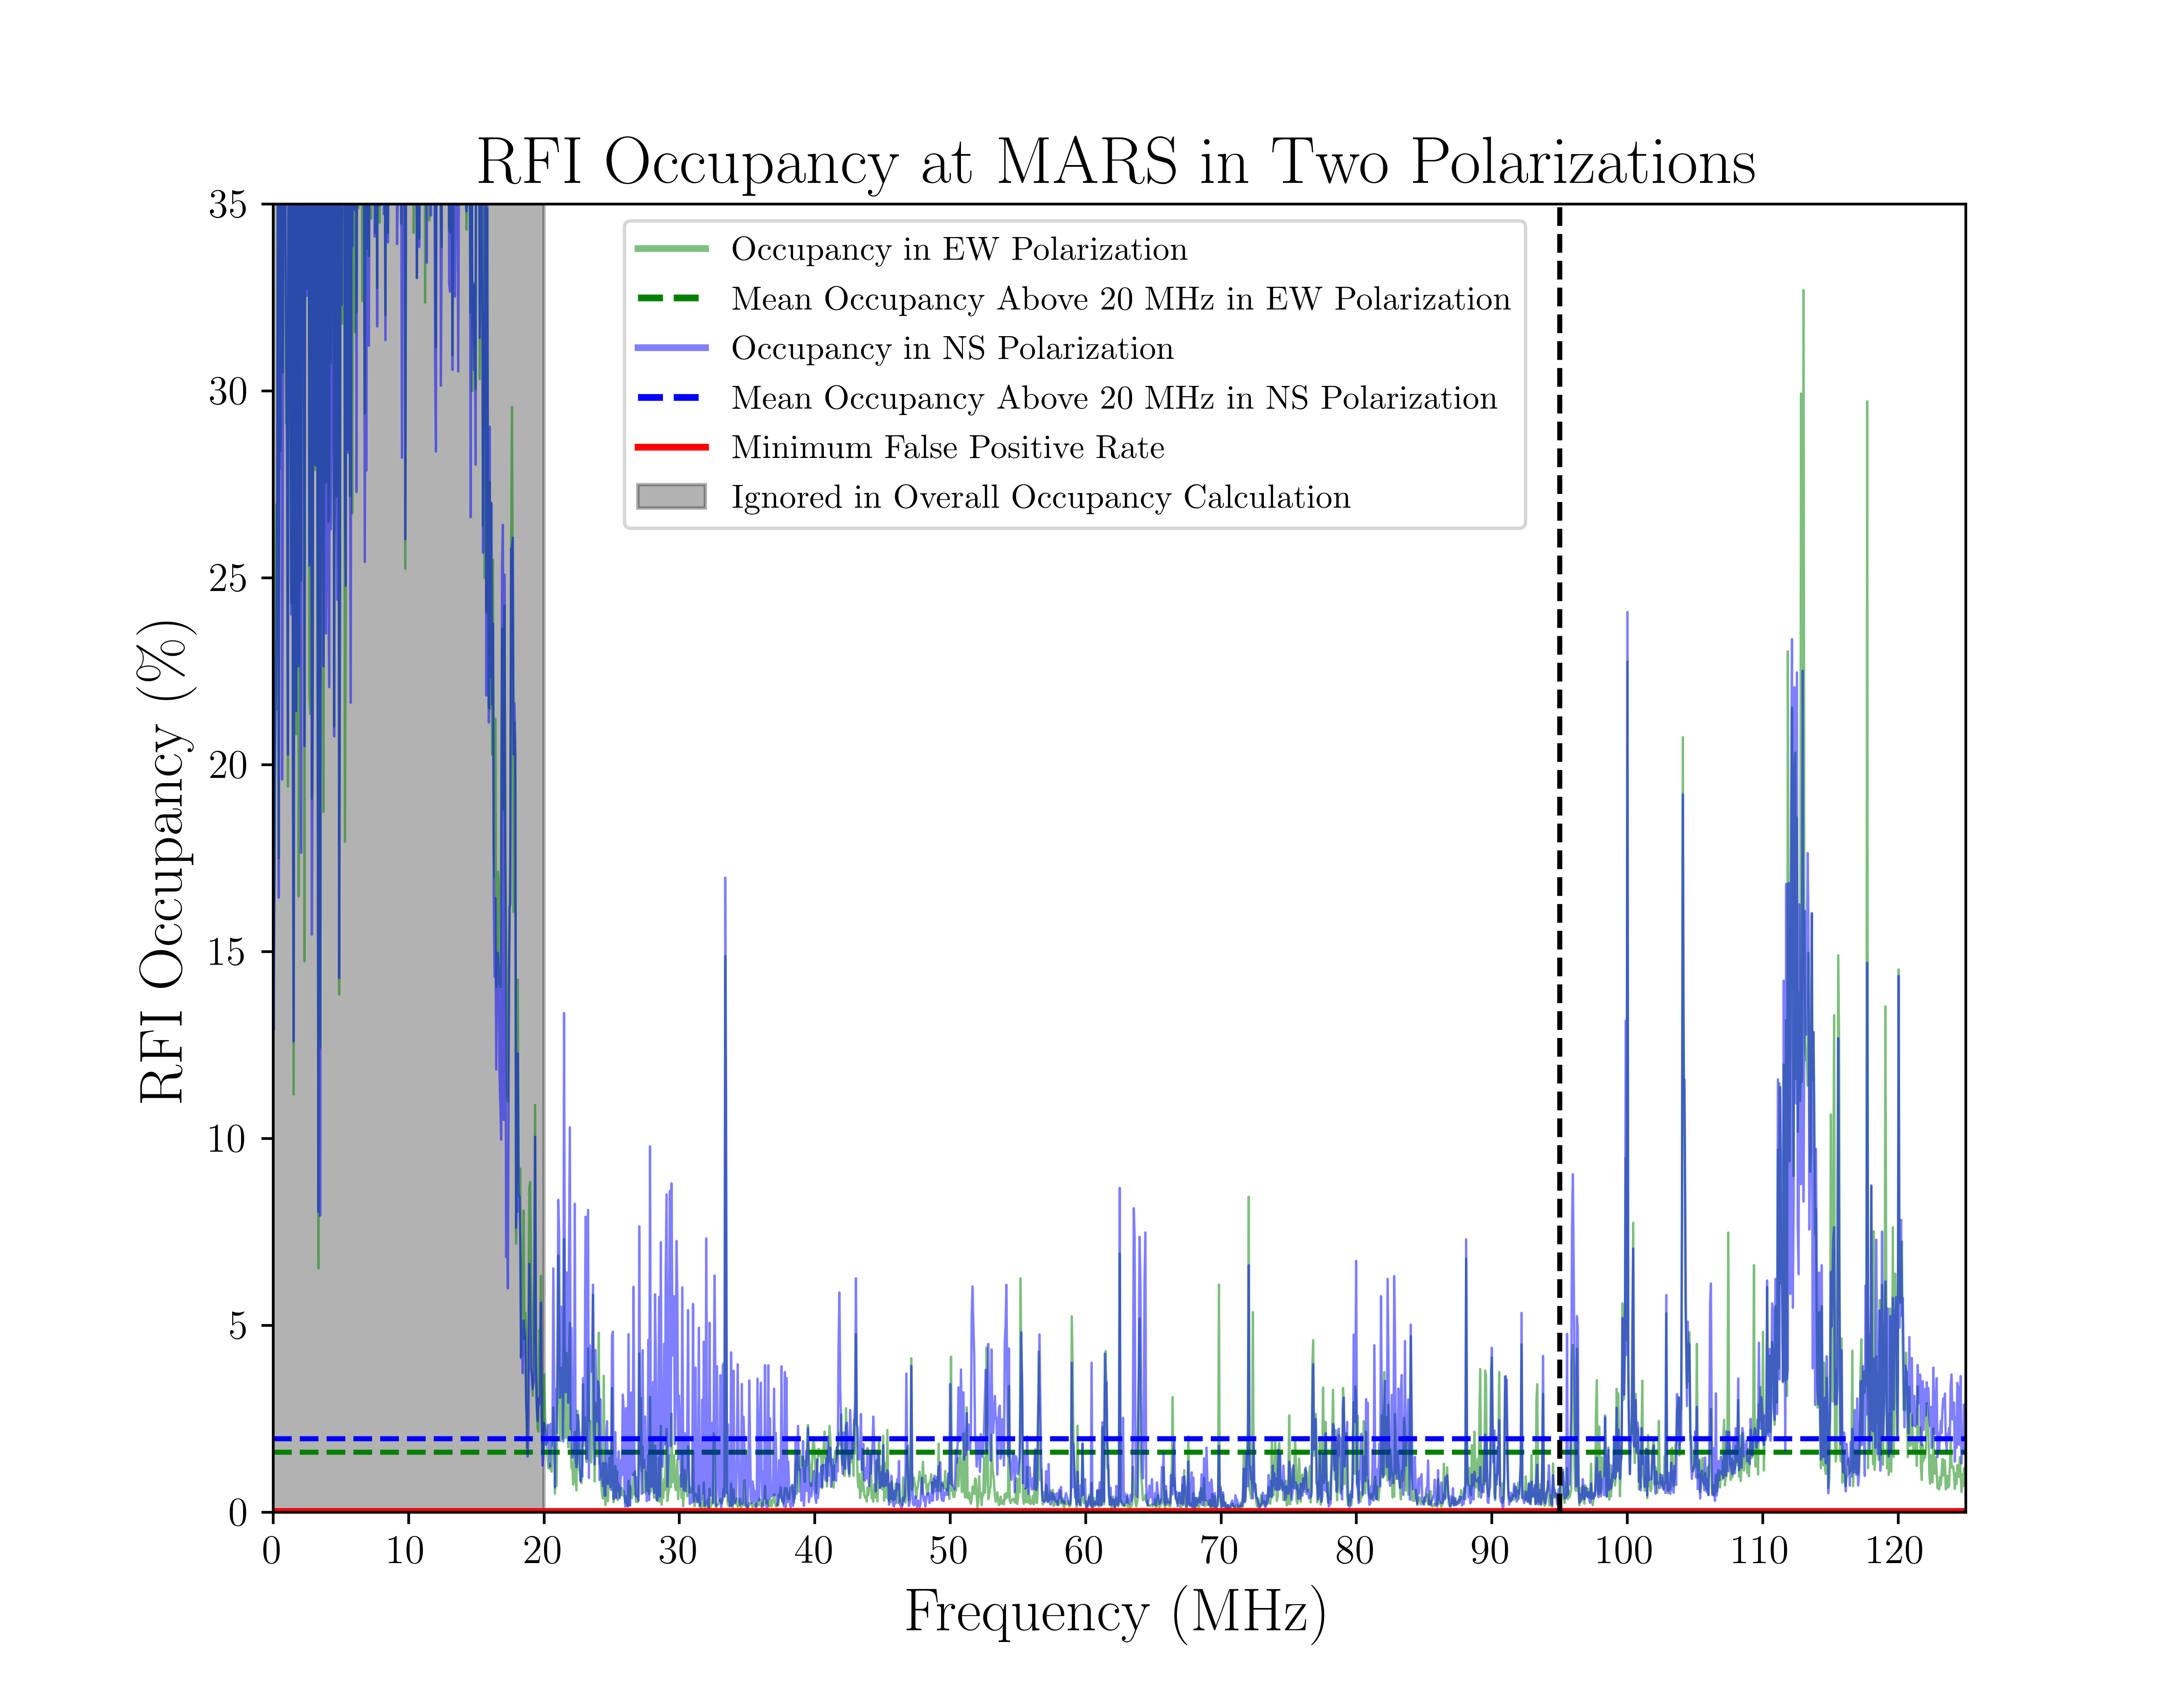
Figure 5 shows the RFI occupancy as a function of frequency for all data recorded at the MARS base. Excluding frequencies below 20 MHz, the overall RFI occupancy is 1.6% in east-west polarized data and 2.0% in north-south polarized data.
At frequencies above the 20 MHz ionospheric cutoff, the RFI environment of MARS is exceptionally clean. The RFI occupancy over the FM band (88–108 MHz), averaged over each polarization, is 1.6%. Because the low-pass filter in the readout electronics has a 155 MHz cutoff that lies above the Nyquist frequency, signals that appear above 95 MHz may have been aliased from 125–155 MHz. For this reason, the RFI occupancy in the FM band is an upper bound. The most prominent RFI feature is located at 112–113 MHz and is consistent with aliased transmission from the ORBCOMM satellite constellation, which broadcasts at 137–138 MHz. Since higher frequency RFI is more attenuated by distance and the Galactic signal is relatively weak above 125 MHz, we expect that the inclusion of the ORBCOMM signal is the only significant consequence of the aliasing. Other intermittent RFI features at MHz are likely air-to-ground sources such as aeronautical radionavigation or weather and mobile satellites333https://www.ic.gc.ca/eic/site/smt-gst.nsf/eng/sf10759.html. The full MARS data set exhibits a single meteor event, when distant radio transmitting sources reflect off of the meteor’s ionization trails and appear briefly in the observed spectra (Mallama & Espenak, 1999). During the observed meteor event, which encompassed only one time sample, a dense cluster of RFI lines appeared in the range of 70–100 MHz, corresponding to frequencies allocated to ground-based broadcasts.
The RFI occupancy at the remote sites surrounding MARS (Figure 3) is qualitatively consistent with the measurements recorded at the base, taking into account greater uncertainty from the significantly smaller data volumes at the remote sites and the different response of the antenna used during surveying. The results suggest that locally-generated RFI at MARS is not visible at few-km distances (measurements were recorded while the MARS power system was turned on) and that there are no additional major local sources of RFI.
The results presented here indicate that MARS is exceptionally clear of terrestrial RFI, even during summer conditions when the RFI levels are expected to be at their maximum. Observations that take place throughout the Arctic winter will further benefit from improved ionospheric conditions and reduced levels of local RFI from the absence of human activity at the research base. The quiet RFI conditions, in combination with well developed infrastructure and regular summer access, make MARS an excellent candidate site for the development of radio astronomy experiments. MARS is well suited for the deployment of antennas that occupy relatively small footprints, and the location is therefore particularly promising for future observations of cosmic dawn, exploratory measurements for the cosmic dark ages, and radio transients from ultra-high energy neutrinos.
Acknowledgments
We gratefully acknowledge the support of the Natural Sciences and Engineering Research Council of Canada (grant numbers RGPIN-2019-04506, RGPNS-2019-534549, funding reference number 508480) and the Fonds de recherche du Québec – Nature et technologies. We also acknowledge the Polar Continental Shelf Program for providing funding and logistical support for our research program, and we extend our sincere gratitude to the Resolute staff for their generous assistance and bottomless cookie jars. This research was undertaken, in part, thanks to funding from the Canada 150 Program. This research was enabled in part by support provided by SciNet (www.scinethpc.ca), Compute Canada (www.computecanada.ca), and the Hippo cluster at the University of KwaZulu–Natal. The authors would like to thank Chris Omelon, Wayne Pollard, and all of the MARS researchers for their invaluable advice and field help.
References
- Bilitza (2018) Bilitza, D. 2018, Advances in Radio Science, 16, 1
- Bowman et al. (2018) Bowman, J. D., Rogers, A. E. E., Monsalve, R. A., Mozdzen, T. J., & Mahesh, N. 2018, Nature, 555, 67
- Chiang et al. (2020) Chiang, H. C., Dyson, T., Egan, E., et al. 2020, arXiv e-prints, arXiv:2008.12208
- DiLullo et al. (2020) DiLullo, C., Taylor, G. B., & Dowell, J. 2020, arXiv e-prints, arXiv:2005.10669
- Ellingson & Kramer (2005) Ellingson, S. W., & Kramer, T. C. 2005, in 2005 IEEE Antennas and Propagation Society International Symposium, Vol. 3A, 561–564 vol. 3A
- Hickish et al. (2016) Hickish, J., Abdurashidova, Z., Ali, Z., et al. 2016, Journal of Astronomical Instrumentation, 5, 1641001
- Hicks et al. (2012) Hicks, B. C., Paravastu-Dalal, N., Stewart, K. P., et al. 2012, PASP, 124, 1090
- Mallama & Espenak (1999) Mallama, A., & Espenak, F. 1999, Publications of the Astronomical Society of the Pacific, 111, 359
- Nhan et al. (2019) Nhan, B. D., Bordenave, D. D., Bradley, R. F., et al. 2019, ApJ, 883, 126
- Philip et al. (2019) Philip, L., Abdurashidova, Z., Chiang, H. C., et al. 2019, Journal of Astronomical Instrumentation, 8, 1950004
- Singh et al. (2018) Singh, S., Subrahmanyan, R., Shankar, N. U., et al. 2018, Experimental Astronomy, 45, 269