Automatic Test Suite Generation for Key-Points Detection DNNs using Many-Objective Search (Experience Paper)
Abstract.
Automatically detecting the positions of key-points (e.g., facial key-points or finger key-points) in an image is an essential problem in many applications, such as driver’s gaze detection and drowsiness detection in automated driving systems. With the recent advances of Deep Neural Networks (DNNs), Key-Points detection DNNs (KP-DNNs) have been increasingly employed for that purpose. Nevertheless, KP-DNN testing and validation have remained a challenging problem because KP-DNNs predict many independent key-points at the same time—where each individual key-point may be critical in the targeted application—and images can vary a great deal according to many factors.
In this paper, we present an approach to automatically generate test data for KP-DNNs using many-objective search. In our experiments, focused on facial key-points detection DNNs developed for an industrial automotive application, we show that our approach can generate test suites to severely mispredict, on average, more than 93% of all key-points. In comparison, random search-based test data generation can only severely mispredict 41% of them. Many of these mispredictions, however, are not avoidable and should not therefore be considered failures. We also empirically compare state-of-the-art, many-objective search algorithms and their variants, tailored for test suite generation. Furthermore, we investigate and demonstrate how to learn specific conditions, based on image characteristics (e.g., head posture and skin color), that lead to severe mispredictions. Such conditions serve as a basis for risk analysis or DNN retraining.
1. Introduction
Automatically detecting key-points (e.g., facial key-points or finger key-points) in an image or a video is a fundamental step for many applications, such as face recognition (Zhang and Meng, 2016), facial expression recognition (Li and Lam, 2015), and drowsiness detection (Jabbar et al., 2018). With the recent advances in Deep Neural Networks (DNNs), Key-Points detection DNNs (KP-DNNs) have been widely studied (Huang et al., 2017, 2015; Jabbar et al., 2018; Song et al., 2020).
To ensure the reliability of KP-DNNs, it is essential to check how accurate the DNNs are when applied to various test data. Nevertheless, testing KP-DNNs is still often focused on pre-recorded test data, such as publicly available datasets (Wolf et al., 2011; Andriluka et al., 2014; Sapp and Taskar, 2013) that are typically not collected or generated according to any systematic strategy, and therefore provide limited test results and confidence. Further, since 3rd parties with ML expertise often provide such KP-DNNs, the internal information of the KP-DNNs is usually not available to the engineers who integrate them into their application systems (Lin et al., 2020; Papernot et al., 2017). As a result, black-box testing approaches should be favored, preferably one that is dedicated and adapted to KP-DNNs to maximize test effectiveness within acceptable time constraints, which is the objective of this paper.
To automatically generate new and diverse test data, one may opt to use advanced DNN testing approaches that have been recently proposed by several researchers. For example, Tian et al. (2018) presented DeepTest, an approach that generates new test images from training images by applying simple image transformations (e.g., rotate, scale, and for and rain effects). Wicker et al. (2018) generated adversarial examples, i.e., small perturbations that are almost imperceptible by humans but causing DNN misclassifications, using feature extraction from images. Gambi et al. (2019) presented AsFault, an approach that generates virtual road networks in computer simulations using search-based testing for testing a DNN-based automated driving system. However, none of the existing DNN testing approaches take into account the following testing challenges that are specific to KP-DNNs predicting multiple key-points at the same time. First, accuracy for individual key-points is of great importance, and therefore one should not simply consider average prediction errors across all key-points. Second, the number of key-points is typically large, e.g., our evaluation uses a facial KP-DNN that detects 27 key-points in an image. Third, depending on the performance of the KP-DNN under test, it may be infeasible to generate a test image causing a significant misprediction for some particular key-points. Therefore, if such infeasibility is observed at run time, it is essential to dynamically and efficiently distribute the computational resources dedicated to testing to the other key-points. This implies that using one of the existing DNN testing approaches is not an option. It also prevents us from running an independent search for each individual key-point.
To address the above challenges, we recast the problem of KP-DNN testing as a many-objective optimization problem. Since the severe misprediction of each individual key-point becomes one objective, many-objective optimization algorithms can potentially be effective and efficient at generating test data that causes the KP-DNN to mispredict individual key-points. Though our approach is applicable to any KP-DNNs, we focus our experiments on a particular but common industrial application, Facial KP-DNNs (FKP-DNN). The experimental subjects are provided by our industry partner IEE in the automotive domain, who is working on driver gaze detection systems that either warn the driver or take the control of the vehicle when the driver is apparently not paying attention on the road while driving. Our empirical investigation shows that our approach is effective at generating test data that cause most of the key-points (93% on average) to be severely mispredicted. Though many of these mispredictions are not avoidable because a key-point can be invisible due to, for example, a shadow, characterizing them is important to analyze risks and a large number of them can still be addressed by retraining or other means. We further investigate (1) the degree of mispredictions caused by test data generated by alternative search algorithms and (2) how to learn specific conditions (e.g., head posture) leading to severe mispredictions of individual key-points. Our ultimate goal is to provide practical recommendations on how to test KP-DNNs and how to analyze test results to support risk analysis and retraining.
The contributions of this paper are summarized as follows:
-
1)
We formalize the problem definition of KP-DNN testing. Our formalism specifies KP-DNN input and output variables, as well as the notion of severe misprediction for a key-point, and characterises the specific testing challenges in this context.
-
2)
We propose a way to automatically generate test data for KP-DNNs using many-objective search algorithms and simulation.
-
3)
We investigate how automatically generated test data and results can be effectively used to reveal and possibly address the root causes of inaccuracy in FKP-DNNs under test.
-
4)
We present empirical results and lessons learned drawn from our experience in applying the approach in an industrial context.
The rest of the paper is organized as follows. Section 2 provides background information on KP-DNNs and search-based testing with simulation. Section 3 formalises the problem of KP-DNN testing. Section 4 positions our work with respect to related work. Section 5 describes our approach. Section 6 evaluates our approach with an industrial case study and summarizes lessons learned. Section 7 concludes the paper.
2. Background
2.1. Search-based Testing
Search-based software testing (SBST) (McMinn, 2011) uses meta-heuristic algorithms to automate software testing tasks, such as test case generation (Fraser and Arcuri, 2011) and prioritization (Li et al., 2007), for a specific system under test. The key idea is to formulate a software testing problem as an optimization problem by defining proper fitness functions. For example, EvoSuite (Fraser and Arcuri, 2011) uses a search-based approach to automatically generate unit test cases for a Java program to satisfy a coverage criterion, such as branch coverage. In this case, the fitness function is defined based on the coverage achieved by unit test cases.
Recently, SBST has also been used for DNN testing. For example, AsFault (Gambi et al., 2019) automatically generates virtual roads to make vision-based DNNs go out of lane, and DeepJanus (Riccio and Tonella, 2020) uses multi-objective search to generate a pair of similar test inputs that cause the DNN under test to misbehave for one test input but not for the other.
However, when the number of objectives is above three, multi-objective search algorithms, such as NSGA-II (Deb et al., 2002), do not scale well (Knowles and Corne, 2007; Ciro et al., 2016). This is where many-objective search algorithms come into play. For example, NSGA-III (Deb and Jain, 2013) is a generic many-objective search algorithm that extends NSGA-II with the idea of virtual reference points to increase the diversity of optimal solutions even when there are more than three objectives. Panichella et al. (Panichella et al., 2017) proposed a Many-Objective Sorting Algorithm (MOSA), another extension of NSGA-II, that is tailored for test suite generation. In contrast to NSGA-III, MOSA aims to efficiently achieve each objective individually. To do this, MOSA has three main features: (1) it focuses search towards uncovered objectives, (2) it uses a novel preference criterion to rank solutions rather than diversifying them, and (3) it saves the best test case for each objective in an archive. MOSA has shown to outperform alternative search algorithms in the context of coverage-based unit testing for traditional software programs (Panichella et al., 2015; Panichella et al., 2017). Recently, Abdessalem et al. (Abdessalem et al., 2018b) proposed FITEST, an extension of MOSA, to further improve the efficiency of many-objective search. The idea is to dynamically reduce the number of candidates (i.e., the population size) to be considered by focusing on the uncovered objectives only. Hence, FITEST’s population size decreases as more objectives are achieved, whereas MOSA’s population size is fixed throughout the search.
Notice that MOSA and FITEST are carefully designed for search-based test suite generation when the number of objectives is above three. Therefore, they are a priori suitable to address the problem of test suite generation for KPF-DNNs, as detailed in Section 3.
2.2. Simulation-based Testing
Testing cyber-physical, safety-critical systems can be done in two ways: (1) in a real-world environment and (2) in a virtual environment, relying on simulators. In the former case, software is deployed in the real-world environment, a form of testing which is often expensive and dangerous. The latter case, referred to as simulation-based testing, can raise concerns about simulation’s fidelity but has two major benefits. First, simulation-based testing offers controllability, meaning that test drivers can control static and dynamic features of the simulation (e.g., light, face features), and can thus automatically cover a wide range of scenarios. Second, because we can control simulation parameters and can get image information from the simulator, we know the ground truth (actual FKPs) and can thus apply search-based solutions to perform safe and fully automated testing of safety-critical software (Abdessalem et al., 2018a, c; Ben Abdessalem et al., 2016).
In many cyber-physical fields, simulation models are developed before implementing actual products. These simulation models help engineers in various activities, such as early verification and validation of the system under test (Menghi et al., 2020; Hou et al., 2015). In such contexts, simulated-based testing is highly recommended as it is economical, faster, safer and flexible (Hou et al., 2015).
3. Problem Definition
In this section, we provide a general but precise problem description regarding test data generation for FKP-DNNs. Though we use a specific application domain for the purpose of exemplification, this description can easily be generalized to all situations where key-points must be detected in an image, such as hand key-point detection (Simon et al., 2017) and human pose key-points detection (Newell et al., 2016), regardless of the content of that image.
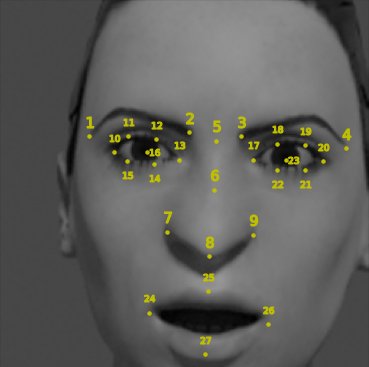
A FKP-DNN takes as input a facial image (real or simulated) and returns the predicted positions of its key-points; Figure 1 shows an example image with the actual positions of key-points. An image can be defined by various factors, such as face size, skin color, and head posture. Using a labeled image that contains the actual positions of key-points, one can measure the degree of prediction errors for an FKP-DNN under test. The goal of test suite generation for FKP-DNNs is to generate labeled images that cause an FKP-DNN under test to inaccurately predict the positions of key-points, to an extent which affects the safety of the system relying on such predictions.
More specifically, let be a labeled test image composed of a tuple where represents image characteristics, such as face size, skin color, and head posture, and represents the actual positions of key-points in . can be further decomposed as where for is the actual position of the -th key-point in and is the total number of key-points. Depending on , some key-points may not actually be visible in . For example, if the head is turned 90 to the right, the right eye key-point will be invisible in the image taken from the front camera. In this case, the actual positions of invisible key-points are null. is a set of indices for visible key-points in , and is the total number of visible key-points in . An FKP-DNN can be considered as a function where is the predicted position of the -th key-point in . The Normalized Mean Error (NME) of for all key-points in can be defined as follows:
where is the Normalized Error of the predicted position with respect to the actual position , ranging between 0 and 1. For example, in our case study, if one measures the error using the Euclidean distance between the actual and predicted positions in an image, then the normalization can be done by dividing the distance by the height or width of the face111This can be easily calculated with the actual positions of key-points., whichever is larger. Such a normalization allows error values to be compared for faces of different sizes.
Generating a critical test image for such that it maximizes could be the goal of test case generation. However, it does not properly account for the fact that accuracy for individual key-points is of great importance, and therefore that averaging prediction errors across key-points may be misleading. This is, indeed, a major concern for our industry partner IEE, who is developing DNN-based gaze detection systems that either warn the driver or take the control of the vehicle when the driver is not paying attention while driving. By considering individual key-points, we may observe that certain key-points’ predictions are particularly inaccurate. Such information can be used by IEE to (1) focus the retraining of on these key-points for improving its accuracy or (2) select accurate key-points to be primarily relied upon—when there are alternative choices—by the applications using them to make decisions.
To verify if correctly predicts individual key-points for , we need to check if is less than a small threshold for all key-points. Therefore, though that may not be possible, test suite generation aims to generate a minimal set of test cases that satisfies for all for some . Note that the value of is usually application specific; for example, IEE uses because is considered critical in their applications.
Test suite generation for FKP-DNNs entails several challenges. First, the test input space is too large to be exhaustively explored. For IEE, this is clear when considering the features that characterize a facial image, including head posture and facial characteristics, such as different shapes of eyes, noses, and mouths. Second, the number of key-points is typically large (e.g., 27 key-points for IEE’s DNN) and, increasing the complexity of the problem, individual key-points are independent as people may exhibit different relative positions for the same key-points. Third, depending on the accuracy of the DNN under test, it may be infeasible to find an image causing the normalized error to exceed the threshold for some key-points. Considering a limited time test budget, if finding a critical image for a key-point seems infeasible, it is essential to dynamically and efficiently distribute computation time at run time to find critical images for the other key-points. Fourth, it is not easy to manually label the actual positions of key-points for a large number of test images. While there are publicly available real-world datasets for various key-point detection problems (Wolf et al., 2011; Andriluka et al., 2014; Sapp and Taskar, 2013), such datasets limit the exploration of the input space to what data is available since there are no publicly available simulators to generate additional images. Last but not least, FKP-DNNs, like other DNNs in practice, are often provided by third parties with expertise in ML, who typically do not provide access to the trained DNN’s internal information. Therefore, test suite generation for FKP-DNNs should be black-box, in the sense that it should not rely on DNN internal information.
To address the above challenges, as described in detail in Section 5, we suggest to apply many-objective search algorithms, which can be effective and efficient for achieving many independent objectives within a limited time budget. These algorithms are a priori a good match to our problem since requirements for individual key-points (i.e., for ) can be translated into objective functions. Furthermore, this approach is DNN-agnostic as it considers the DNN under test as a black-box.
4. Related Work
Many automated techniques are available in the literature for testing DNNs. One type of automatic test data generation techniques is to generate adversarial examples (Yuan et al., 2019) that are imperceptible for humans but cause the DNN under test to misbehave. Guo et al. (2018) proposed DLFuzz, an approach that iteratively applies small perturbations to original images to maximize neuron coverage (i.e., the rate of activated neurons) and prediction differences between the original and synthesized images. Zhou et al. (2020) and Kong et al. (2020) proposed DeepBillboard and PhysGAN, respectively, two similar approaches that generate adversarial images that can be placed on drive-by billboards, both digitally or physically, to induce failures in DNN-based automated driving systems. Wicker et al. (2018) presented an approach to generate adversarial images using feature extraction techniques, such as Scale Invariant Feature Transform (SIFT), to extract features from original images. Rozsa et al. (2019) introduced a Fast Flipping Attribute (FFA) technique to effectively generate adversarial images for DNNs detecting facial attributes (e.g., male or female). However, in contrast to our objective of verifying the safety of DNN predictions for a large variety of plausible test inputs, adversarial examples mainly target security attacks where an attacker intentionally introduces human-imperceptible changes (i.e., attacks) to cause the DNN to generate incorrect predictions.
Another important line of work is to generate new test data from already labeled data (e.g., training data) by applying label-preserving changes to avoid labeling problems for newly generated test inputs. Pei et al. (2019) proposed DeepXplore, an approach that generates label-preserving test images to maximize both neuron coverage and differential behaviors of multiple DNNs for the generated images. Tian et al. (2018) introduced DeepTest, an approach that synthesizes label-preserving test images by applying affine transformations and effect filters, such as rain and snow, to original images in order to maximize neuron coverage. Zhang et al. (2018) presented DeepRoad, an approach that uses Generative Adversarial Networks (GANs), instead of simple transformations and effect filters, to generate more realistic images. Du et al. (2018) proposed DeepCruiser, an approach that generates label-preserving sequences of test data to test stateful deep learning systems, based on Recurrent Neural Networks (RNNs) using special coverage criteria for RNNs converted to Markov Decision Process (MDP). Recently, Xie et al. (2019) presented DeepHunter, an extensible coverage-guided testing framework extending DeepTest to further utilize multiple coverage criteria, with more label-preserving transformation strategies. While these works enable engineers to generate more realistic test data from existing data, generating label-preserving test images inherently limits the search space when the objective is to identify critical situations in the most comprehensive way possible. Furthermore, when relying on a simulator, labeling is not a critical issue.
To overcome the limitation of label-preserving test data generation, simulation-based testing is increasingly used for testing DNNs, especially in the context of DNN-based automated driving systems. Gambi et al. (2019) presented AsFault, a search-based approach to generates different types of road topologies in a simulated environment to test the lane keeping functionality of self-driving DNNs. Tuncali et al. (2018) introduced Sim-ATAV, a framework for testing closed-loop behaviors of DNN-based systems in simulated environments using requirement falsification methods. Riccio and Tonella (2020) presented DeepJanus, an approach to generate pairs of similar test inputs, using search-based testing with simulations, that cause the DNN under test to misbehave for one test input but not for the other. Although the solutions in this category successfully used simulation to generate critical test data, they are inadequate for the test suite generation of FKP-DNNs, because they do not consider many independent outputs individually. Therefore, even when it seems infeasible to find a critical image for a certain key-point, these solutions cannot dynamically redistribute computational resources to to other key-points.
In summary, existing work does not address the fundamental and specific challenges of test suite generation for KP-DNNs, as described in Section 3. To this end, we propose a solution, based on many-objective optimization, that automatically generates test suites whose objective is to cause KP-DNNs to severely mispredict the positions of individual key-points and then use machine learning to explain such mispredictions.
5. Search-based Test Suite Generation
This section provides a solution to the problem of test suite generation for KP-DNNs, described in Section 3, by applying many-objective search algorithms. Similar to Section 3, although our approach is not specific to the domain of facial key-points, to root the presentation into concrete examples, we describe the approach in the context of test suite generation for FKP-DNNs.
Recall that MOSA (Panichella et al., 2017) and FITEST (Abdessalem et al., 2018b) take as input (1) a set of objectives, (2) a set of fitness functions indicating the degree to which individual objectives have been achieved, and (3) a time budget; it then returns a set of solutions that maximally achieve each objective individually within the given time budget. Therefore, we can apply the algorithms to our problem by carefully defining a set of corresponding objectives and fitness functions.
Based on the problem definition in Section 3, we can define that an objective for each key-point is to find a test image that makes a FKP-DNN under test severely mispredict the key-point position. Specifically, for a FKP-DNN , the set of objectives to be achieved by a many-objective search algorithm is for all where is the normalized error of the predicted position with respect to the actual position for the -th key-point and is a small threshold pre-defined by domain experts. Naturally, the set of fitness functions corresponding to the objectives is for all .
While it seems intuitive to define the sets of objectives and fitness functions for many-objective search algorithms, the issue in practice is how to determine the actual positions of key-points in an automated manner; a simulator plays a key role here.
Figure 2 shows the overview of the search-based test suite generation process for a FKP-DNN using a simulator. It is composed of four main components: a search engine, a simulator, the DNN under test, and a fitness calculator. The process begins with the search engine generating a set of new input values for image characteristics (e.g., head posture and skin color). The input values are used by the simulator to generate a new test image as well as the actual positions of key-points for all . The FKP-DNN under test takes as input and returns the predicted positions of the key-points . Then, the fitness calculator computes the fitness score of using for each . The fitness score is fed back to the search engine to generate new and better input values over the next iterations. This process continues until either a given time budget runs out or all the objectives are achieved. The process ends with returning a test suite such that each satisfies for some . In the following subsections, we will explain each of the approach components in more detail.

5.1. Search Engine
The search engine drives the whole process based on a meta-heuristic search algorithm. For a given set of objectives with fitness functions and a time budget, it iteratively generates new test inputs for image characteristics () to ultimately provide engineers with the most effective test suite. Search algorithms, such as Random Search (RS), MOSA (Panichella et al., 2017), and FITEST (Abdessalem et al., 2018b), vary in the way they generate new test inputs based on the fitness results from previous iterations.
For example, MOSA starts with an initial set of randomly generated test cases that forms an initial population; then, it creates new test cases using crossover and mutation operators that are typically used in Genetic Algorithms (GA) to find better candidates while promoting their diversity. Unlike GA, the selection in MOSA is performed by considering both the non-dominance relation and the uncovered objectives. Specifically, for each uncovered objective , a test case will have a higher chance of remaining in the next generation if is non-dominated by the others and is the closest to cover . To form the final test suite, MOSA uses an archive that keeps track of the best test cases that cover individual objectives. FITEST is basically the same as MOSA, except that it dynamically reduces the population size with each iteration, according to the number of uncovered objectives.
More specifically, Algorithm 1 presents the pseudo-code of MOSA and FITEST. It takes as input a set of objectives and returns an archive (i.e., a test suite) that aims to maximally achieve individual objectives in . To do that, the algorithm begins with initializing , the set of uncovered objectives , and the population (lines 1–1). The algorithm then computes the set of covered objectives by calculating the fitness scores of for (line 1), updates to include test cases from , which are best at achieving (line 1), and updates to remove the covered objectives in (line 1). Until the stopping criterion is met, the algorithm repeats the followings: (1) generating a set of new test cases from using crossover and mutation (line 1), (2) updating , , and for , as done for (lines 1–1), and (3) generating the next generation from the current and considering using selection (line 1). The algorithm ends by returning . The main difference between MOSA and FITEST is in the getNextGeneration function (line 1): MOSA keeps , whereas FITEST reduces as decreases.
To improve the performance of MOSA and FITEST, we can also consider their variants, namely MOSA+ and FITEST+. These variants are identical to the originals, but the crossover strategy is changed to only consider fitness scores for uncovered (not-yet-achieved) objectives to better guide new test cases towards them. In other words, the higher the fitness score for uncovered objectives, the more similar children are to parents. This is done by dynamically updating the distribution index of the Simulated Binary Crossover (SBX), based on the fitness score of parents, for uncovered objectives.
In practice, using an effective and efficient search algorithm, for a given problem, is critical for testing at scale and therefore be applicable in industrial contexts. This is also the case here for generating better test suites for FKP-DNNs.
5.2. Simulator
The simulator is one of the key enablers of our approach because it takes as input and generates labeled with . It should be able to generate diverse test images by manipulating various s, such that there is variation in head posture, gender, skin color, and mouth size. At the same time, it should be able to generate individual test images within reasonable time since this strongly affects the efficiency of the entire search-based process.
To achieve this, one can use 3D modeling tools, such as MakeHuman (Community, 2020) and Blender (Community, 2018). MakeHuman can be used to create parameterized 3D face models with detailed morphological characteristics, such as skin color and hair style. Blender, on the other hand, can be used to manipulate the 3D models according to selected values (Briceno and Paul, 2019). Since a 3D model is basically a textured polygonal mesh (i.e., a collection of nodes and edges in 3D) that defines the shape of a polyhedral object, an engineer can mark the actual positions of key-points in the model by selecting the corresponding nodes in the textured mesh. Then, using the simulator, it is easy to generate a 2D image capturing the face labeled with the actual key-point positions.
5.3. Fitness Calculator and Fitness Functions
The fitness calculator takes and and returns for each . As mentioned in Section 3, one way to calculate is to compute the Euclidean distance between and and then normalize it using the height or width of the actual face, whichever is larger. Normalization enables the comparison of the error values of different 3D models having different face sizes.
6. Empirical Evaluation
In this section, we report on the empirical evaluation of our many-objective, search-based test suite generation approach when applied to an industrial FKP-DNN developed by IEE. We aim to answer the following research questions.
RQ1: How do alternative many-objective search algorithms fare in terms of test effectiveness? RQ1 aims to check whether using many-objective search algorithms, such as MOSA and FITEST, is indeed a suitable solution for the problem of test suite generation for FKP-DNNs. To answer this, we investigate how many key-points are severely mispredicted (according to our earlier definition) by test suites that are automatically generated by the search algorithms, and how alternative algorithms compare to each other and to a simple random search.
RQ2: Can we further distinguish search algorithms using the degree of mispredictions caused by the test suites they generate? Since RQ1 only considers the number of severely mispredicted key-points, differences in effectiveness across search algorithms may not appear clearly and completely. For example, two test suites generated by different algorithms may cause the same number of severely mispredicted key-points. However, since the level of risk entailed by mispredictions may be proportional to the distance between the actual and predicted key-points, a test suite with a higher degree of mispredictions may be more amenable to risk analysis, depending on the application context. Based on this, RQ2 compares how severely key-points are mispredicted by test suites generated across different search algorithms.
RQ3: Can we explain individual key-point mispredictions in terms of image characteristics? In addition to the cost-effective, automated testing of FKP-DNNs, engineers need to understand why severe mispredictions occur for individual key-points. This is critical for engineers to analyze and address the root causes of mispredictions, or, when the latter is not possible, at the very least assess the risks. For example, if engineers know that a certain key-point is significantly mispredicted for a specific head posture range, they can generate more test images in that range and retrain the DNN to improve its prediction accuracy. To this end, RQ3 aims to investigate whether it is possible to provide accurate and interpretable explanations of mispredictions based on image characteristics used by the simulator to generate test images.
6.1. Case Study Design
We use a proprietary FKP-DNN, denoted IEE-DNN (described in detail in § 6.1.1), developed by IEE to build a driver’s gaze detection component for autonomous vehicles. To enable simulation-based testing, we also use an in-house simulator, namely IEE-SIM (described in detail in § 6.1.2), developed by IEE to generate large numbers of labeled facial images to train the IEE-DNN.
6.1.1. DNN
IEE-DNN takes as input a 256x256 pixel image; it returns the predicted positions of 27 facial key-points in the input image. Figure 1 depicts the actual positions of the 27 key-points for a sample image.
The IEE-DNN is based on the stacked hourglass architecture (Newell et al., 2016) with an adaptive wing loss function (Wang et al., 2019). Specifically, it consists of two hourglass modules, each of which contains four residual modules for downsampling and another four for upsampling. It is trained on 18,120 syntactic images generated by the IEE-SIM. Against an independent set of 2,738 syntactic test images, the IEE-DNN achieved a low NME value of , on average. Given that the threshold for labelling mispredictions as severe for individual key-points is , such NME value implies that, if we just consider the average prediction error for all key-points, the IEE-DNN is sufficiently accurate according to the test set. Note that our approach is independent from any specific DNN architecture as it does not require any DNN internal information.
6.1.2. Simulator
IEE-SIM takes as input various image characteristics, such as head posture, light intensity, and the position of a (virtual) camera, and returns a corresponding facial image with the actual positions of the 27 key-points.
The IEE-SIM is based on MakeHuman (Community, 2020) and Blender (Community, 2018). To decrease its execution time, IEE engineers carefully designed many 3D face models in advance, by considering the diversity in skin colors and the shapes and sizes of faces, mouths, and noses. By doing this, we can quickly generate an image by specifying a pre-defined 3D model ID to use instead of dynamically generating the 3D models from scratch at run time. As a result, the average execution time for generating one labeled image is around 6 seconds on an iMac (3GHz 6-Core Intel i5 CPU, 40GB memory, and Radeon Pro 570X 4GB graphic card).
The main concern of IEE is to verify the accuracy of the IEE-DNN for diverse head postures and drivers. Therefore, we manipulate four feature values when varying image characteristics: roll, pitch, and yaw values for controlling head posture and the 3D model ID for indirectly the face features to be used. The ranges of the roll, pitch, and yaw values are limited between -30 and +30 to mimic realistic ways in which drivers position their head. For 3D models, we use the subset of 10 different models that IEE considered to be of main interest.
6.2. RQ1: Effectiveness of Test Suites
6.2.1. Setup
To answer RQ1, we generate a test suite using our approach for a fixed time budget and measure the Effectiveness Score (ES) of the test suite, defined as the proportion of key-points that are severely mispredicted by the IEE-DNN according to the test suite over the total number of key-points. ES ranges between 0 and 1, where higher values, when possible, are desirable.
To better understand how ES varies across different search algorithms, we compare MOSA (Panichella et al., 2017), FITEST (Abdessalem et al., 2018b), and their variants MOSA+ and FITEST+ (see Section 5.1). We use Random Search (RS) as a baseline. RS randomly generates a test suite for each iteration and keeps the best until the search process ends; RS provides insights into how easy the search problem is and helps us assess if other, more complex search algorithms are indeed necessary.
One might consider using NSGA-III as another baseline that tries to achieve many objectives collectively. However, it is not readily tailored to test suite generation as explained in Section 2.1, and therefore requires addressing the problem of how to encode test suites into chromosomes, which is a research subject that is beyond the scope of our paper.
For MOSA, FITEST, and their variants, the initial population size is the number of objectives. To be consistent, we set the number of randomly generated test cases at each iteration of RS to be the number of objectives. For the other parameters, such as mutation and crossover rates in MOSA, FITEST, and their variants, we use the default values recommended in the original studies.
To account for randomness in search algorithms, we repeat the experiment 20 times. For each run, we use the same time budget of two hours for all search algorithms, based on our preliminary evaluation showing that two hours are enough to converge. We apply the non-parametric Mann–Whitney U test (Mann and Whitney, 1947) to assess the statistical significance of the difference in ES between algorithms. We also measure Vargha and Delaney’s (Vargha and Delaney, 2000) to capture the effect size of the difference.
6.2.2. Results
Figure 3 depicts the differences in ES across search algorithms. RS only achieves on average across 20 runs. Though such value may seem a priori high, one must recall that it cannot be interpreted as a failure rate in the normal sense since certain key-points are impossible to predict, e.g., some key-points are hidden by a shadow. In general, it is to be expected that such DNNs will have inherent limitations that cannot be addressed by retraining or any other means. It is up to the system using a DNN to adequately address such limitations, for example by not using key-point predictions in shadowed areas and relying on the other key-points for decisions. Therefore, the purpose of ES values is only to compare the test effectiveness of different algorithms and not to assess the accuracy of the DNN under test. In contrast to RS, MOSA, MOSA+, and FITEST+ reach in at least one run, meaning that these algorithms could generate test suites that cause the IEE-DNN to severely mispredict all 27 key-points. Across 20 runs, the many-objective search algorithms achieve on average, implying that our approach seems indeed effective at generating test suites that cause severe mispredictions for many key-points.
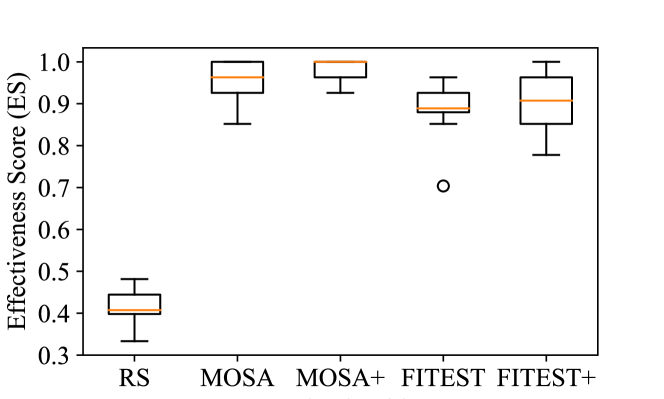
Table 1 shows the results of statistical comparisons between different search algorithms. Under the Pair column, sub-columns A and B indicate the two search algorithms being compared. Under the ES column, sub-columns -value and indicate the statistical significance and the effect size, respectively, when comparing ES distributions between A and B.
| Pair | ES | MS | |||
|---|---|---|---|---|---|
| A | B | -value | -value | ||
| MOSA | RS | ||||
| MOSA+ | RS | ||||
| FITEST | RS | ||||
| FITEST+ | RS | ||||
| MOSA | FITEST | ||||
| MOSA+ | FITEST | ||||
| FITEST+ | FITEST | ||||
| MOSA | FITEST+ | ||||
| MOSA+ | FITEST+ | ||||
| MOSA+ | MOSA | ||||
At a level of significance = 0.01, we can see that MOSA is significantly better than FITEST, with large effect size (0.84). Comparing MOSA+ and FITEST+ shows the same result, with an even larger effect size (0.86). This implies that (dynamically) reducing the population size at each iteration significantly degrades the effectiveness of the search algorithms for test suite generation, as it decreases their ability to explore the search space. When comparing MOSA (and FITEST) and MOSA+ (and FITEST+), their differences in ES are statistically insignificant, implying that dynamically controlling the similarity between parents and children in crossover does not significantly improve effectiveness. In RQ2, we will further compare the many-objective search algorithms by considering the degree of misprediction severity across the test suites they generate.
To summarize, the answer to RQ1 is that our approach is effective in generating test suites that cause IEE-DNN—which is already rather accurate (NME = for the test dataset) as one might expect from an industrial model—to severely mispredict more than 93% of all key-points on average. This number is also much higher than that obtained with random search (41%). While MOSA and MOSA+ are significantly better than FITEST and FITEST+ in terms of ES, there is no significant difference between MOSA and MOSA+, which will be investigated further in RQ2.
6.3. RQ2: Misprediction Severity for Individual Key-Points
6.3.1. Setup
To answer RQ2, following the same procedure as for RQ1, we measure the Misprediction Severity (MS) of a test suite for each key-point, defined as the maximum value observed when running the test suite. As for , MS ranges between 0 and 1, where 1 implies the maximum prediction error.
Since RQ2 aims to further distinguish the search algorithms by considering the MS values of test suites they generated in RQ1, we use the test suites from RQ1 and report the average MS of individual key-points for each algorithm. We apply the non-parametric Wilcoxon signed-rank test to statistically compare MS distributions for each key-point between search algorithms, and measure Vargha and Delaney’s to capture the effect size of the difference.
6.3.2. Results
Figure 4 shows average MS values of the test suites generated by different search algorithms, for individual key-points. For example, we can see that the average MS value with MOSA+ for the 26th key-point (i.e., KP26) is around 0.8.
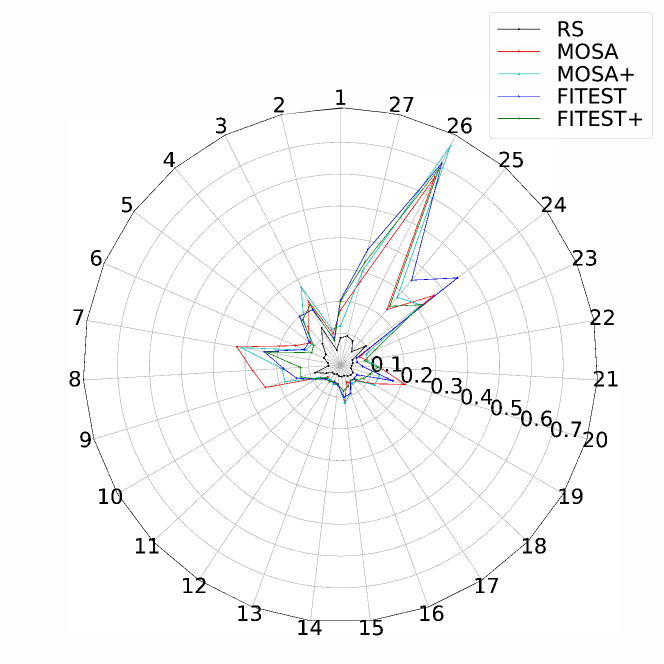
Comparing MOSA, FITEST, and their variants, we can see that the overall patterns shown in the radar chart are similar. This implies that the many-objective test suite generation algorithms yield similar patterns in terms of which individual key-points tend to get higher MS values. To further assess the difference between them, we need to check the results of the statistical tests.
Table 1 shows the results of statistical comparisons between different search algorithms. Under the MS column, sub-columns -value and indicate the statistical significance and the effect size, respectively, when comparing the MS distributions of two algorithms under columns A and B.
In Table 1, with , there is no statistically significant difference in MS between MOSA and MOSA+, and between FITEST and FITEST+. This implies that, consistent with RQ1, dynamically adjusting the distribution index in crossover does not increase misprediction severity for individual key-points.
As for MOSA and FITEST, which were significantly different with respect to ES in RQ1, they are no longer significantly different regarding MS. This inconsistency between RQ1 and RQ2 happens because, even though MOSA (and MOSA+) is better than FITEST (and FITEST+) in making the values of more key-points exceed , FITEST (and FITEST+) yields higher values than MOSA (and MOSA+) for some key-points. When it comes to MOSA+ and FITEST+, MOSA+ is significantly better than FITEST+ with a small effect size (0.56). The results between MOSA and FITEST, and MOSA+ and FITEST+, imply that dynamically reducing the population size during the search increases the degree of mispredictions for some key-points, but the overall impact is limited.
Interestingly, Figure 4 shows that some key-points (i.e., KP7, KP24, KP25, KP26, and KP27) are more severely mispredicted than the others. A detailed analysis found two distinct reasons that together affect the accuracy of the DNN: the under-representation of some key-points in the training data and a large variation in the shape and size of the mouth across different 3D models. For KP7, we found that it is only included in 79% of the training data. One possible explanation is that, as shown in Figure 1, KP7 can easily become invisible depending on the head posture. Interestingly, KP9, which has a symmetrical position to KP7 in the face, is included in a larger proportion of the training data (84%). Such situations typically happen when the training set is not built in a systematic fashion. This implies that key-points that are under-represented in training data, because they happen not to be visible on numerous occasions, are more likely to be severely mispredicted. On the other hand, KP24, KP25, KP26, and KP27 are more severely mispredicted than the others, even though they are included in most of the training images (more than 92%). These four key-points are severely mispredicted because they are related to the mouth, which shows the largest variation among face features; the mouth can be opened and closed, and is larger than the eyes. Therefore, the positions of the mouth key-points vary more than other key-points in the face, even when the head posture is fixed. As a result, learning the position of the mouth key-points is more difficult than that for other key-points. This implies that, during training, we need to focus more on certain key-points whose actual positions can vary more than the others across images.
To summarize, the answer to RQ2 is that, by additionally considering MS, we cannot further distinguish MOSA and FITEST, and their variants. Instead, through a detailed analysis of the most severely mispredicted key-points, we identified important insights to prevent severe mispredictions: (1) since some key-points may not actually be visible in an image, depending on image characteristics (e.g., head posture), for each key-point, it is important to ensure that the training data contains enough images where the key-point is visible, (2) more training is required for certain key-points, whose positions tend to vary significantly more across the face and which are harder to predict than the others. Such observations can obviously generalize to other types of images and key-points.
6.4. RQ3: Explaining Mispredictions
6.4.1. Setup
To answer RQ3, decision trees (Breiman et al., 1984) are learnt to infer how the (normalized prediction error) of the FKP-DNN for individual key-points relate to image characteristics used by the simulator to generate test images. We use decision trees because they are easy to interpret due to their hierarchical decision-making process (Murdoch et al., 2019), though alternative forms of rule-based learning could be considered as well. Interpretability is essential for engineers to assess the risks associated with a DNN in the context of a given application and to devise ways to improve the DNN, for example, through additional training data. Specifically, we build a decision tree for each key-point to identify conditions describing how varies according to input variables, i.e., roll, pitch, yaw, and 3D model ID. Since our test suite generation approach generates many test images specified by roll, pitch, yaw, and 3D model, and given that values are calculated for individual key-points during the search process, we can use this information as a set of observations for building decision trees and explain mispredictions. To mimic a practical scenario in which engineers use our approach overnight (e.g., ten hours), we use the information collected from five random runs (i.e., equivalent to ten hours) of MOSA+ (i.e., the most effective search algorithm according to RQ1 and RQ2). Since the target variable (i.e., ) is continuous, we use regression trees to explain and predict the degree of mispredictions. Specifically, we use REPTree (i.e., fast tree learner using information-gain and reduced-error pruning) implemented in Weka (Witten and Frank, 2002).
To evaluate the (predictive) accuracy of generated regression trees, we measure the Mean Absolute Error (MAE) using 10-fold cross validation. Note that, to provide interpretable explanations, the simplicity of the resulting regression trees is just as important as its accuracy. In particular, as the number of nodes in a regression tree increases, it becomes increasingly difficult for engineers to interpret the results. As a trade-off between accuracy and simplicity, we set the minimum number of observations per leaf node to 40, based on preliminary experiments. For the other parameters for REPTree, we use default values provided by Weka.
6.4.2. Results
Figure 5 shows the MAE and size (i.e., number of nodes) distributions for all 27 trees built based on 3854 test images obtained from five runs of MOSA+. The average MAE is 0.01 and the average size is 25.7. We can see that the trees are accurate as there is an average difference of 0.01 between the actual and predicted values, which is far below the threshold that IEE finds acceptable (0.05). The trees are also of reasonable size and therefore easy to interpret as they lead to simple rules, as further shown below.
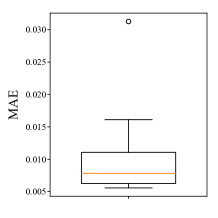
Table 2 shows some representative rules derived from the tree generated for KP26, the most severely mispredicted key-point in RQ2. All the remaining rules and the trees for the other key-points are available in the supporting material 222All the decision trees are available on https://figshare.com/s/0433751b88282b07ea12. Unfortunately, the full replication package could not be made publicly available since the IEE-SIM and the IEE-DNN are proprietary assets.. In Table 2, column -condition shows conditions on values of the image characteristics, i.e., Roll (R), Pitch (P), Yaw (Y), and 3D Model ID (M); column shows the average value for all test images satisfying the condition. For example, the first row from the table means that, for test images such that 3D model ID is 9 and pitch is less than 18.41, the average is 0.04. Recall that each 3D model ID corresponds to implicit facial characteristics. For example, for model ID 9, skin color is brown, face structure is broad, nose type is aquiline, and mouth structure is uneven.
| -condition | |
|---|---|
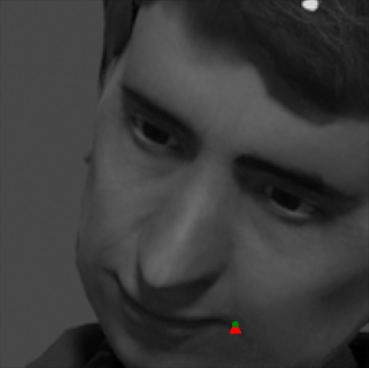
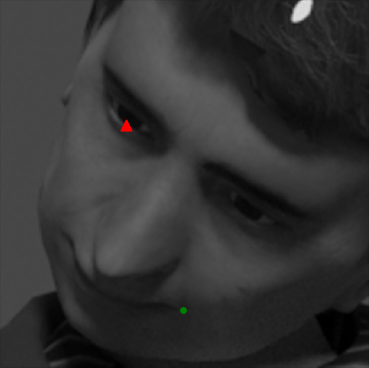
Using such conditions, engineers can easily identify when the FKP-DNN leads to severe mispredictions, for individual key-points. For example, by comparing the first and third conditions in Table 2, we can see that, for the same 3D model, changing the head posture toward specific ranges leads to a significant increase of the prediction error of the IEE-DNN for KP26. To better visualize the example above, we present two test images, in Figures 6a and 6b, satisfying the first and third conditions, respectively. In each image, the green dots and red triangle indicate the actual and predicted positions of KP26. While there is a small prediction error () in Figure 6a, it gets much larger () when turning the head further down and to the right, as shown in Figure 6b. Engineers can further investigate the root causes of severe mispredictions using targeted additional images. For example, based on Figure 6b, we generated a targeted image that differs only in the direction of the shadow (by changing the position of the light source in the 3D model) and could confirm that the shadow was indeed the root cause of the large value.
Knowing under what conditions severe mispredictions are occurring can help engineers in two ways. First, it helps to assess the risks associated with individual key-points for specific conditions, in the context of a specific application. For example, if the head posture can be constrained to in the context of a certain application of the FKP-DNN, the risk of severe misprediction for KP26 is reduced according to the conditions in Table 2. Second, it enables the generation of specific test images, using the simulator, that are expected to cause particularly severe mispredictions and can be used for retraining the DNN. For example, from the conditions in Table 2, we can generate new images satisfying , which will likely lead to high values, and can be used to help retrain and improve the DNN by augmenting its training data set.
To summarize, the answer to RQ3 is that, by building regression trees using the information that is produced by executing our test generation approach, we can largely explain the variance in individual key-point mispredictions in terms of image characteristics that are controllable in the simulator. These conditions can help engineers assess risks for individual key-points and generate specific images for retraining of the DNN in a way that is more likely to have an impact on its accuracy.
6.5. Threats to Validity
In RQ1, we have used a threshold () for deciding if a key-point is severely mispredicted or not. This may affect the results. However, this threshold value was set by IEE domain experts, accounting for the specific application of their DNN. Furthermore, we checked that using other small threshold values does not severely affect overall trends but only slightly affect ES values.
We have used 3D face models with various facial characteristics shared by IEE. IEE engineers have prepared the 3D models by marking key-points’ actual positions manually. The manual marking can be erroneous and such error can affect the quality of data generated for training and testing the DNN. To mitigate such threats, IEE engineers have done extensive testing for each 3D model and carefully validated the generated data.
Though we focused, in our case study, on one FKP-DNN developed by IEE, it is representative of what one can find in industry (Huang et al., 2015; Chen et al., 2017; Jabbar et al., 2018), in terms of prediction accuracy, inputs and outputs, and training procedure. Though there are no publicly available KP-DNNs coupled with a simulator, additional industrial case studies are, however, required to improve the generalizability of our results.
Since we focused on syntactic images generated by a simulator, the transferability of our results from simulation to real-world facial key-points detection is not in the scope of this work. Nevertheless, we want to note that Haq et al. (2020) already provided an experimental methodology to quantify such transferability and reported that simulator-generated data can be a reliable substitute to real-world data for the purpose of DNN testing.
6.6. Lessons Learned
Lesson 1: Automated test suite generation is indeed useful in practice.
Although we have presented here the evaluation results using the latest IEE-DNN version, our approach has been continuously applied to previous versions during its development process. Indeed, test suites automatically generated by our approach and the analysis of testing results for mispredicted key-points have helped assess and improve IEE-DNNs. In particular, our approach led IEE to augment their training dataset (e.g., diversity and sample size) and thus improve the generalization of the IEE-DNN against various inputs. In summary, based on the results, IEE has been (1) continuously enriching their dataset by adding more training images from diverse 3D face models and (2) improving the IEE-DNN’s architecture by doubling the number of hidden layers to drastically increase its accuracy.
Our approach has been also used for improving the simulator. For example, during a detailed analysis of the testing results, we revealed a critical issue: the labeled key-point positions on test images, generated by the IEE-SIM, were not accurate and, after analysis, engineers realized there was a misalignment between the texture and nodes of the 3D mesh that are used to define the actual position of key-points.
IEE also plans to use our approach in various ways. Since the test suites generated by our approach cause severe mispredictions for many key-points, retraining the DNN using these test suites—given that the DNN architecture is now adequate—is expected to help improve the accuracy of the DNN. We will further investigate to what extent such accuracy can be improved in our future work.
Lesson 2: Understanding mispredictions is critical.
Though explaining DNNs (Samek et al., 2017) is important in many circumstances, the complex structure of such models makes it challenging. Instead of analyzing the internals of the IEE-DNN, we simply built decision trees for inferring conditions characterizing key-point mispredictions in terms of input variables, i.e., roll, pitch, yaw, and 3D model ID. Even such analysis cannot directly explain the behavior of the IEE-DNN in detail, knowing such conditions brings several benefits to IEE. First, it helps them demonstrate the robustness of the DNN under certain conditions which, for generated test images, do not lead to severe mispredictions. If those conditions match the conditions of the intended application, then engineers can conclude that the DNN is likely to be safe for use. Second, it facilitates the investigation of the root causes of mispredictions. This is critical because, similar to the severe misprediction in Figure 6b discussed in § 6.4.2, some mispredictions are not avoidable and can only be addressed by engineering the system using the DNN for robustness (e.g., by identifying shadowed areas and not using predictions for the key-points in these areas). Such finding led IEE to better target their development resources to improve the driver’s gaze detection system rather than just focusing on the IEE-DNN itself.
Lesson 3: Simulation-based testing brings key benefits.
As discussed in Section 5.2, a simulator is one of the key enablers of our approach as it generates labeled test images in a controlled manner. However, the simulator can also be a limiter as test suites generated by our approach depend on what the simulator can generate. Ideally, one would like access to a high-fidelity and configurable simulator that is able to generate diverse images, accounting for all major factors that affect the behavior of the DNN under test. For example, the IEE-SIM has been developed to support the configuration of various image characteristics, such as head posture, face size, and skin color, that are essential because of their effect on facial key-point detection. Thanks to the simulator, we can generate as many different test images as we need, with known key-points, and drive effectively automated test generation. Given the usefulness of our approach, the cost of having a simulator, with sufficient fidelity and configurability, benefits the development and testing of KP-DNNs by enabling efficient automation.
7. Conclusion
In this paper, we formalize the problem definition of KP-DNN testing and present an approach to automatically generate test data for KP-DNNs with many independent outputs, a common situation in many applications. We empirically compare state-of-the-art, many-objective search algorithms and their variants tailored for test suite generation. We find MOSA+ to be significantly more effective than random search (baseline) and other many-objective search algorithms, e.g., FITEST, with large effect sizes. We also observe that our approach can generate test suites to severely mispredict more than 93% of all key-points on average, while random search, as a comparison, can do so for 41% of them. We further investigate and demonstrate a way, based on regression trees, to learn the conditions, in terms of image characteristics, that cause severe mispredictions for individual key-points. These conditions are essential to engineers to assess the risks associated with using a DNN and to generate new images for DNN retraining, when possible.
As a part of future work, we plan to devise effective retraining strategies and assess to what extent the accuracy of FKP-DNNs can be improved through retraining. We also plan to tailor NSGA-III, a generic many-objective search algorithm, for test suite generation and empirically evaluate its performance.
Acknowledgements.
This work has received funding from Luxembourg’s National Research Fund (FNR) under grant BRIDGES2020/IS/14711346/FUNTASY, the European Research Council under the European Union’s Horizon 2020 research and innovation programme (grant agreement No 694277), IEE S.A. Luxembourg, and NSERC of Canada under the Discovery and CRC programs. Donghwan Shin was partially supported by the Basic Science Research Programme through the National Research Foundation of Korea (NRF) funded by the Ministry of Education (2019R1A6A3A03033444).References
- (1)
- Abdessalem et al. (2018a) Raja Ben Abdessalem, Shiva Nejati, Lionel C. Briand, and Thomas Stifter. 2018a. Testing Vision-Based Control Systems Using Learnable Evolutionary Algorithms. In Proceedings of the 40th International Conference on Software Engineering (Gothenburg, Sweden) (ICSE ’18). Association for Computing Machinery, New York, NY, USA, 1016–1026. https://doi.org/10.1145/3180155.3180160
- Abdessalem et al. (2018b) Raja Ben Abdessalem, Annibale Panichella, Shiva Nejati, Lionel C. Briand, and Thomas Stifter. 2018b. Testing Autonomous Cars for Feature Interaction Failures Using Many-Objective Search. In Proceedings of the 33rd ACM/IEEE International Conference on Automated Software Engineering (Montpellier, France) (ASE 2018). Association for Computing Machinery, New York, NY, USA, 143–154. https://doi.org/10.1145/3238147.3238192
- Abdessalem et al. (2018c) Raja Ben Abdessalem, Annibale Panichella, Shiva Nejati, Lionel C. Briand, and Thomas Stifter. 2018c. Testing Autonomous Cars for Feature Interaction Failures Using Many-Objective Search. In Proceedings of the 33rd ACM/IEEE International Conference on Automated Software Engineering (Montpellier, France) (ASE 2018). Association for Computing Machinery, New York, NY, USA, 143–154. https://doi.org/10.1145/3238147.3238192
- Andriluka et al. (2014) Mykhaylo Andriluka, Leonid Pishchulin, Peter V. Gehler, and Bernt Schiele. 2014. 2D Human Pose Estimation: New Benchmark and State of the Art Analysis. In 2014 IEEE Conference on Computer Vision and Pattern Recognition, CVPR 2014, Columbus, OH, USA, June 23-28, 2014. IEEE Computer Society, Columbus, OH, 3686–3693. https://doi.org/10.1109/CVPR.2014.471
- Ben Abdessalem et al. (2016) Raja Ben Abdessalem, Shiva Nejati, Lionel C. Briand, and Thomas Stifter. 2016. Testing Advanced Driver Assistance Systems Using Multi-Objective Search and Neural Networks. In Proceedings of the 31st IEEE/ACM International Conference on Automated Software Engineering (Singapore, Singapore) (ASE 2016). Association for Computing Machinery, New York, NY, USA, 63–74. https://doi.org/10.1145/2970276.2970311
- Breiman et al. (1984) Leo Breiman, J. H. Friedman, R. A. Olshen, and C. J. Stone. 1984. Classification and Regression Trees. Wadsworth.
- Briceno and Paul (2019) Leyde Briceno and Gunther Paul. 2019. MakeHuman: A Review of the Modelling Framework. In Proceedings of the 20th Congress of the International Ergonomics Association (IEA 2018), Sebastiano Bagnara, Riccardo Tartaglia, Sara Albolino, Thomas Alexander, and Yushi Fujita (Eds.). Springer International Publishing, Cham, 224–232.
- Chen et al. (2017) Yu Chen, Jian Yang, and Jianjun Qian. 2017. Recurrent neural network for facial landmark detection. Neurocomputing 219 (2017), 26–38.
- Ciro et al. (2016) Guillermo Campos Ciro, Frédéric Dugardin, Farouk Yalaoui, and Russell Kelly. 2016. A NSGA-II and NSGA-III comparison for solving an open shop scheduling problem with resource constraints. IFAC-PapersOnLine 49, 12 (2016), 1272–1277.
- Community (2018) Blender Online Community. 2018. Blender - a 3D modelling and rendering package. Blender Foundation. http://www.blender.org
- Community (2020) Makehumancommunity Online Community. 2020. Makehumancommunity.org. Makehumancommunity. www.Makehumancommunity.org
- Deb and Jain (2013) Kalyanmoy Deb and Himanshu Jain. 2013. An evolutionary many-objective optimization algorithm using reference-point-based nondominated sorting approach, part I: solving problems with box constraints. IEEE transactions on evolutionary computation 18, 4 (2013), 577–601.
- Deb et al. (2002) Kalyanmoy Deb, Amrit Pratap, Sameer Agarwal, and TAMT Meyarivan. 2002. A fast and elitist multiobjective genetic algorithm: NSGA-II. IEEE transactions on evolutionary computation 6, 2 (2002), 182–197.
- Du et al. (2018) Xiaoning Du, Xiaofei Xie, Yi Li, Lei Ma, Jianjun Zhao, and Yang Liu. 2018. DeepCruiser: Automated Guided Testing for Stateful Deep Learning Systems. CoRR abs/1812.05339 (2018). arXiv:1812.05339 http://arxiv.org/abs/1812.05339
- Fraser and Arcuri (2011) Gordon Fraser and Andrea Arcuri. 2011. EvoSuite: Automatic Test Suite Generation for Object-Oriented Software. In Proceedings of the 19th ACM SIGSOFT Symposium and the 13th European Conference on Foundations of Software Engineering (Szeged, Hungary) (ESEC/FSE ’11). Association for Computing Machinery, New York, NY, USA, 416–419. https://doi.org/10.1145/2025113.2025179
- Gambi et al. (2019) Alessio Gambi, Marc Mueller, and Gordon Fraser. 2019. Automatically Testing Self-Driving Cars with Search-Based Procedural Content Generation. In Proceedings of the 28th ACM SIGSOFT International Symposium on Software Testing and Analysis (Beijing, China) (ISSTA 2019). Association for Computing Machinery, New York, NY, USA, 318–328. https://doi.org/10.1145/3293882.3330566
- Guo et al. (2018) Jianmin Guo, Yu Jiang, Yue Zhao, Quan Chen, and Jiaguang Sun. 2018. DLFuzz: Differential Fuzzing Testing of Deep Learning Systems. In Proceedings of the 2018 26th ACM Joint Meeting on European Software Engineering Conference and Symposium on the Foundations of Software Engineering (Lake Buena Vista, FL, USA) (ESEC/FSE 2018). Association for Computing Machinery, New York, NY, USA, 739–743. https://doi.org/10.1145/3236024.3264835
- Haq et al. (2020) Fitash Ul Haq, Donghwan Shin, Shiva Nejati, and Lionel C. Briand. 2020. Comparing Offline and Online Testing of Deep Neural Networks: An Autonomous Car Case Study. In 2020 IEEE 13th International Conference on Software Testing, Validation and Verification (ICST). 85–95. https://doi.org/10.1109/ICST46399.2020.00019
- Hou et al. (2015) Yunfei Hou, Yunjie Zhao, Aditya Wagh, Longfei Zhang, Chunming Qiao, Kevin F Hulme, Changxu Wu, Adel W Sadek, and Xuejie Liu. 2015. Simulation-based testing and evaluation tools for transportation cyber–physical systems. IEEE Transactions on Vehicular Technology 65, 3 (2015), 1098–1108.
- Huang et al. (2017) Di Huang, Renke Zhang, Yuan Yin, Yiding Wang, and Yunhong Wang. 2017. Local feature approach to dorsal hand vein recognition by centroid-based circular key-point grid and fine-grained matching. Image and Vision Computing 58 (2017), 266–277.
- Huang et al. (2015) Yichao Huang, Xiaorui Liu, Lianwen Jin, and Xin Zhang. 2015. Deepfinger: A cascade convolutional neuron network approach to finger key point detection in egocentric vision with mobile camera. In 2015 IEEE International Conference on Systems, Man, and Cybernetics. IEEE, IEEE, Kowloon, 2944–2949.
- Jabbar et al. (2018) Rateb Jabbar, Khalifa Al-Khalifa, Mohamed Kharbeche, Wael Alhajyaseen, Mohsen Jafari, and Shan Jiang. 2018. Real-time driver drowsiness detection for android application using deep neural networks techniques. Procedia computer science 130 (2018), 400–407.
- Knowles and Corne (2007) Joshua Knowles and David Corne. 2007. Quantifying the Effects of Objective Space Dimension in Evolutionary Multiobjective Optimization. In Evolutionary Multi-Criterion Optimization, Shigeru Obayashi, Kalyanmoy Deb, Carlo Poloni, Tomoyuki Hiroyasu, and Tadahiko Murata (Eds.). Springer Berlin Heidelberg, Berlin, Heidelberg, 757–771.
- Kong et al. (2020) Zelun Kong, Junfeng Guo, Ang Li, and Cong Liu. 2020. PhysGAN: Generating Physical-World-Resilient Adversarial Examples for Autonomous Driving. In 2020 IEEE/CVF Conference on Computer Vision and Pattern Recognition, CVPR 2020, Seattle, WA, USA, June 13-19, 2020. IEEE, Seattle, WA, USA, 14242–14251. https://doi.org/10.1109/CVPR42600.2020.01426
- Li and Lam (2015) J. Li and E. Y. Lam. 2015. Facial expression recognition using deep neural networks. In 2015 IEEE International Conference on Imaging Systems and Techniques (IST). IEEE, Macau, 1–6. https://doi.org/10.1109/IST.2015.7294547
- Li et al. (2007) Zheng Li, Mark Harman, and Robert M Hierons. 2007. Search algorithms for regression test case prioritization. IEEE Transactions on software engineering 33, 4 (2007), 225–237.
- Lin et al. (2020) Junyu Lin, Lei Xu, Yingqi Liu, and Xiangyu Zhang. 2020. Black-box adversarial sample generation based on differential evolution. Journal of Systems and Software 170 (2020), 110767.
- Mann and Whitney (1947) Henry B Mann and Donald R Whitney. 1947. On a test of whether one of two random variables is stochastically larger than the other. The annals of mathematical statistics (1947), 50–60.
- McMinn (2011) Phil McMinn. 2011. Search-Based Software Testing: Past, Present and Future. In Proceedings of the 2011 IEEE Fourth International Conference on Software Testing, Verification and Validation Workshops (ICSTW ’11). IEEE Computer Society, USA, 153–163. https://doi.org/10.1109/ICSTW.2011.100
- Menghi et al. (2020) Claudio Menghi, Shiva Nejati, Lionel Briand, and Yago Isasi Parache. 2020. Approximation-Refinement Testing of Compute-Intensive Cyber-Physical Models: An Approach Based on System Identification. In Proceedings of the ACM/IEEE 42nd International Conference on Software Engineering (Seoul, South Korea) (ICSE ’20). Association for Computing Machinery, New York, NY, USA, 372–384. https://doi.org/10.1145/3377811.3380370
- Murdoch et al. (2019) W James Murdoch, Chandan Singh, Karl Kumbier, Reza Abbasi-Asl, and Bin Yu. 2019. Definitions, methods, and applications in interpretable machine learning. Proceedings of the National Academy of Sciences 116, 44 (2019), 22071–22080.
- Newell et al. (2016) Alejandro Newell, Kaiyu Yang, and Jia Deng. 2016. Stacked Hourglass Networks for Human Pose Estimation. In Computer Vision – ECCV 2016, Bastian Leibe, Jiri Matas, Nicu Sebe, and Max Welling (Eds.). Springer International Publishing, Cham, 483–499.
- Panichella et al. (2015) A. Panichella, F. M. Kifetew, and P. Tonella. 2015. Reformulating Branch Coverage as a Many-Objective Optimization Problem. In 2015 IEEE 8th International Conference on Software Testing, Verification and Validation (ICST). IEEE, Graz, Austria, 1–10. https://doi.org/10.1109/ICST.2015.7102604
- Panichella et al. (2017) Annibale Panichella, Fitsum Meshesha Kifetew, and Paolo Tonella. 2017. Automated test case generation as a many-objective optimisation problem with dynamic selection of the targets. IEEE Transactions on Software Engineering 44, 2 (2017), 122–158.
- Papernot et al. (2017) Nicolas Papernot, Patrick McDaniel, Ian Goodfellow, Somesh Jha, Z. Berkay Celik, and Ananthram Swami. 2017. Practical Black-Box Attacks against Machine Learning. In Proceedings of the 2017 ACM on Asia Conference on Computer and Communications Security (Abu Dhabi, United Arab Emirates) (ASIA CCS ’17). Association for Computing Machinery, New York, NY, USA, 506–519. https://doi.org/10.1145/3052973.3053009
- Pei et al. (2019) Kexin Pei, Yinzhi Cao, Junfeng Yang, and Suman Jana. 2019. DeepXplore: Automated Whitebox Testing of Deep Learning Systems. GetMobile: Mobile Comp. and Comm. 22, 3, 36–38. https://doi.org/10.1145/3308755.3308767
- Riccio and Tonella (2020) Vincenzo Riccio and Paolo Tonella. 2020. Model-Based Exploration of the Frontier of Behaviours for Deep Learning System Testing. Association for Computing Machinery, New York, NY, USA, 876–888. https://doi.org/10.1145/3368089.3409730
- Rozsa et al. (2019) Andras Rozsa, Manuel Günther, Ethan M Rudd, and Terrance E Boult. 2019. Facial attributes: Accuracy and adversarial robustness. Pattern Recognition Letters 124 (2019), 100–108.
- Samek et al. (2017) Wojciech Samek, Thomas Wiegand, and Klaus-Robert Müller. 2017. Explainable Artificial Intelligence: Understanding, Visualizing and Interpreting Deep Learning Models. arXiv:1708.08296 [cs.AI]
- Sapp and Taskar (2013) B. Sapp and B. Taskar. 2013. MODEC: Multimodal Decomposable Models for Human Pose Estimation. In 2013 IEEE Conference on Computer Vision and Pattern Recognition. IEEE, Portland, OR, USA, 3674–3681. https://doi.org/10.1109/CVPR.2013.471
- Simon et al. (2017) Tomas Simon, Hanbyul Joo, Iain Matthews, and Yaser Sheikh. 2017. Hand keypoint detection in single images using multiview bootstrapping. In Proceedings of the IEEE conference on Computer Vision and Pattern Recognition. IEEE, Honolulu, HI, 1145–1153.
- Song et al. (2020) Guanglu Song, Yu Liu, Yuhang Zang, Xiaogang Wang, Biao Leng, and Qingsheng Yuan. 2020. KPNet: Towards Minimal Face Detector. arXiv:2003.07543 [cs.CV]
- Tian et al. (2018) Yuchi Tian, Kexin Pei, Suman Jana, and Baishakhi Ray. 2018. DeepTest: Automated Testing of Deep-Neural-Network-Driven Autonomous Cars. In Proceedings of the 40th International Conference on Software Engineering (Gothenburg, Sweden) (ICSE ’18). Association for Computing Machinery, New York, NY, USA, 303–314. https://doi.org/10.1145/3180155.3180220
- Tuncali et al. (2018) Cumhur Erkan Tuncali, Georgios Fainekos, Hisahiro Ito, and James Kapinski. 2018. Simulation-based adversarial test generation for autonomous vehicles with machine learning components. In 2018 IEEE Intelligent Vehicles Symposium (IV). IEEE, IEEE, Changshu, China, 1555–1562.
- Vargha and Delaney (2000) András Vargha and Harold D. Delaney. 2000. A Critique and Improvement of the CL Common Language Effect Size Statistics of McGraw and Wong. Journal of Educational and Behavioral Statistics 25, 2 (2000), 101–132. https://doi.org/10.3102/10769986025002101 arXiv:https://doi.org/10.3102/10769986025002101
- Wang et al. (2019) Xinyao Wang, Liefeng Bo, and Fuxin Li. 2019. Adaptive Wing Loss for Robust Face Alignment via Heatmap Regression. Seoul, Korea (South), 6970–6980. https://doi.org/10.1109/ICCV.2019.00707
- Wicker et al. (2018) Matthew Wicker, Xiaowei Huang, and Marta Kwiatkowska. 2018. Feature-Guided Black-Box Safety Testing of Deep Neural Networks. In Tools and Algorithms for the Construction and Analysis of Systems, Dirk Beyer and Marieke Huisman (Eds.). Springer International Publishing, Cham, 408–426.
- Witten and Frank (2002) Ian H Witten and Eibe Frank. 2002. Data mining: practical machine learning tools and techniques with Java implementations. Acm Sigmod Record 31, 1 (2002), 76–77.
- Wolf et al. (2011) L. Wolf, T. Hassner, and I. Maoz. 2011. Face recognition in unconstrained videos with matched background similarity. In CVPR 2011. IEEE, IEEE, Providence, RI, 529–534. https://doi.org/10.1109/CVPR.2011.5995566
- Xie et al. (2019) Xiaofei Xie, Lei Ma, Felix Juefei-Xu, Minhui Xue, Hongxu Chen, Yang Liu, Jianjun Zhao, Bo Li, Jianxiong Yin, and Simon See. 2019. DeepHunter: A Coverage-Guided Fuzz Testing Framework for Deep Neural Networks. In Proceedings of the 28th ACM SIGSOFT International Symposium on Software Testing and Analysis (Beijing, China) (ISSTA 2019). Association for Computing Machinery, New York, NY, USA, 146–157. https://doi.org/10.1145/3293882.3330579
- Yuan et al. (2019) Xiaoyong Yuan, Pan He, Qile Zhu, and Xiaolin Li. 2019. Adversarial examples: Attacks and defenses for deep learning. IEEE transactions on neural networks and learning systems 30, 9 (2019), 2805–2824.
- Zhang et al. (2018) Mengshi Zhang, Yuqun Zhang, Lingming Zhang, Cong Liu, and Sarfraz Khurshid. 2018. DeepRoad: GAN-based metamorphic testing and input validation framework for autonomous driving systems. In 2018 33rd IEEE/ACM International Conference on Automated Software Engineering (ASE). IEEE, IEEE, Montpellier, France, 132–142.
- Zhang and Meng (2016) Shutong Zhang and Chenyue Meng. 2016. Facial keypoints detection using neural network. Stanford Report (2016), 1.
- Zhou et al. (2020) Husheng Zhou, Wei Li, Zelun Kong, Junfeng Guo, Yuqun Zhang, Bei Yu, Lingming Zhang, and Cong Liu. 2020. DeepBillboard: Systematic Physical-World Testing of Autonomous Driving Systems. In Proceedings of the ACM/IEEE 42nd International Conference on Software Engineering (Seoul, South Korea) (ICSE ’20). Association for Computing Machinery, New York, NY, USA, 347–358. https://doi.org/10.1145/3377811.3380422