The Cepheid Distance to the Narrow-Line Seyfert 1 Galaxy NGC 4051
Abstract
We derive a distance of Mpc ( mag) to the archetypal narrow-line Seyfert 1 galaxy NGC 4051 based on Cepheid Period–Luminosity relations and new Hubble Space Telescope multiband imaging. We identify 419 Cepheid candidates and estimate the distance at both optical and near-infrared wavelengths using subsamples of precisely-photometered variables (123 and 47 in the optical and near-infrared subsamples, respectively). We compare our independent photometric procedures and distance-estimation methods to those used by the SH0ES team and find agreement to 0.01 mag. The distance we obtain suggests an Eddington ratio for NGC 4051, typical of narrow-line Seyfert 1 galaxies, unlike the seemingly-odd value implied by previous distance estimates. We derive a peculiar velocity of km s-1 for NGC 4051, consistent with the overall motion of the Ursa Major Cluster in which it resides. We also revisit the energetics of the NGC 4051 nucleus, including its outflow and mass accretion rates.
1 Introduction
The distance to an astronomical object is one of the most fundamental measurements that can be made, and yet it is also one of the most difficult. Without an accurate distance, measurements of many other parameters are of limited utility. In the case of the nearest active galactic nuclei (AGNs), the lack of accurate and precise distance measurements to these objects precludes a robust calibration of their physical properties, even though, compared to the general AGN population, their detailed structure is best resolved and their dynamics and energetics are the most easily studied. Thus, obtaining accurate distances is the most urgent priority toward achieving an accurate physical description of the accretion, feedback, and energetics of nearby AGNs.
NGC 4051, one of the original six Seyfert galaxies (Seyfert, 1943) and one of the lowest-redshift AGNs (), illustrates some of the difficulties. NGC 4051 is the archetype of the subclass of AGNs known as “narrow-line Seyfert 1 galaxies” (NLS1s; Osterbrock & Pogge, 1985), which are thought to be high Eddington ratio objects; the Eddington ratio is defined as the ratio of mass accretion rate to the Eddington accretion rate, . Since the accretion rate is where is the bolometric luminosity and is the efficiency, as long as is independent of , we can also write where is the Eddington luminosity. To compute the bolometric luminosity, we must know the distance. Unfortunately, redshift-independent distances for NGC 4051 are ambiguous. Distances quoted in the literature cover a wide range, from a low of 8.8 Mpc (Sorce et al., 2014) to a high close to 18 Mpc (Wang et al., 2014; Yoshii et al., 2014). If NGC 4051 is at the lower end of this range, which is close to the redshift-based distance of 9.5 Mpc, its Eddington ratio is surprisingly low for an NLS1 galaxy. By using the bolometric correction and weighted mean mass and luminosity from Dalla Bontà et al. (2020), we find that at a distance of 9 Mpc the Eddington ratio would be , which is fairly typical of other local Seyfert galaxies. However, if NGC 4051 is at the high end of this distance range, at 18 Mpc, , which is more typical of NLS1s.
NGC 4051 is the first AGN for which strong evidence for inflows in molecular gas was found using near-infrared integral field spectroscopy (Riffel et al., 2008). The inferred geometry of the inflow depends strongly on the distance to the galaxy, taken to be 9.3 Mpc in that work. Similarly, X-ray spectra reveal a fast ionized outflow that loses kinetic energy by interaction with the interstellar medium in the host galaxy (Pounds, 2014); the energetics and timescales again strongly depend on the distance to the AGN and are consequently systematically uncertain by a factor of several. Moreover, spatially resolved observations of the narrow-line region reveal a strong outflow component (Fischer et al., 2013), and again the energetics are uncertain on account of the poorly constrained distance. The quantitative results of these observations are important because they are probes of the feedback mechanisms through which supermassive black hole (SMBH) accretion can modify the interstellar medium and regulate star formation in the host galaxy. Understanding the physical mechanisms at work in both feeding and feedback, and determining whether or not the feedback mechanisms of theoretical models actually work in nature, requires detailed observations of the complex inner structure of AGNs. Nearby galaxies afford the only opportunity to test in detail — i.e., on sub-hundred pc scales — the prescriptions used in models of galaxy and SMBH co-evolution. It is on scales of less than 100 pc that morphological differences between active and quiescent galaxies appear (Simões Lopes et al., 2007; García-Burillo & Combes, 2012; Hicks et al., 2013; Davies et al., 2014). There is observational and theoretical evidence that disk processes are important in feeding AGNs across broad ranges of redshift and luminosity (e.g., Hopkins & Quataert, 2010; Schawinski et al., 2012; Kocevski et al., 2012; Riffel et al., 2013; Schnorr-Müller et al., 2014; Storchi-Bergmann & Schnorr-Müller, 2019), so what we learn about local AGNs is applicable to galaxies at , where co-evolution largely occurs.
Finally, it is only in the nearest AGNs that we can compare SMBH masses measured from stellar or gas dynamical modeling, which are distance-dependent, with those measured by reverberation mapping (RM), which are distance-independent. NGC 4051 is challenging as the SMBH radius of influence (, where is the BH mass and is the stellar bulge velocity dispersion) is pc; whether or not it is spatially resolvable with either the Hubble or the James Webb Space Telescopes (HST, JWST) is unclear given the factor of 2–3 uncertainty in the SMBH mass and the factor of two uncertainty in the distance, but it should nevertheless be possible to get at least meaningful constraints on the central mass with the IFU on JWST.
Our goal is to eliminate distance-dependent ambiguities by determining a Cepheid-based distance to NGC 4051. The Cepheid Period–Luminosity Relation (PLR) or Leavitt Law (Leavitt & Pickering, 1912) is a widely-used empirical standard candle with a reach of at least Mpc (Riess et al., 2016). It has been extensively applied to dozens of extragalactic systems, including Bentz et al. (2019) and Yuan et al. (2020, hereafter Y20) who recently measured the Cepheid-based distances to the Seyfert 1 galaxies NGC 6814 and NGC 4151, respectively.
In this work, we derive a Cepheid distance to NGC 4051 using multiband HST observations. The rest of this paper is organized as follows. We present the observations, data reduction, and photometry in §2 and our Cepheid selection methods in §3. Our main result, the Cepheid distance to NGC 4051, is given in §4 and we discuss its implications in §5.
2 Observations, Data Reduction, and Photometry
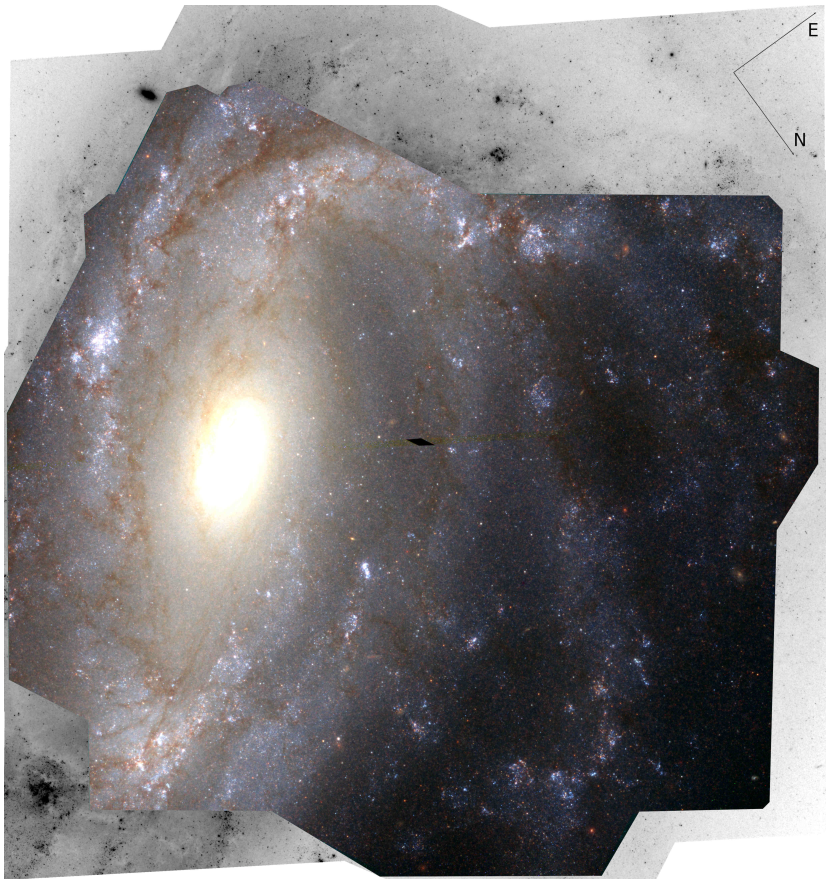
We observed NGC 4051 and carried out the subsequent analysis following the same strategy used by Y20 for NGC 4151. We obtained optical and near-infrared (NIR) HST images of a field that covers a large area of the disk (see Figure 1). We briefly summarize the observations, data reduction, and photometry procedure below and refer interested readers to Y20 for further details.
The NGC 4051 observations include 12, 3, 3, and 6 epochs in F350LP, F555W, F814W, and F160W, respectively. The observation baseline spans 73 days, during which the orientation angle of HST changed once. The observation log and exposure times are given in Table 1. We note that one of the two F555W images obtained in epoch 9 had a significantly worse FWHM, possibly due to increased jitter, and thus was excluded from further analysis.
| Epoch | MJD | DitherExposure Time (seconds) | |||
|---|---|---|---|---|---|
| F350LP | F555W | F814W | F160W | ||
| 1 | 58089.2 | 3350 | 2553 | ||
| 2 | 58107.8 | 3350 | 2550 | ||
| 3 | 58111.9 | 3350 | 2550 | ||
| 4 | 58117.4 | 3350 | 2553 | ||
| 5 | 58122.6 | 3350 | 2550 | ||
| 6 | 58129.0 | 3350 | 2553 | ||
| 7 | 58135.6 | 3350 | 2550 | ||
| 8 | 58141.0 | 3350 | 2553 | ||
| 9 | 58145.3 | 3350 | 2550a | ||
| 10 | 58149.6 | 3350 | 2553 | ||
| 11 | 58155.2 | 3350 | 2550 | ||
| 12 | 58162.1 | 3350 | 2553 | ||
Note. — : The first image of this set was excluded due to its poor FWHM, possibly due to increased jitter.
| R.A. | Dec. | F350LP | F555W | F814W |
|---|---|---|---|---|
| [J2000] | [mag(mmag)] | |||
| 180.76803 | 44.53942 | 23.520(13) | 23.604(18) | 22.862(16) |
| 180.77227 | 44.53125 | 23.943(15) | 24.202(21) | 23.034(14) |
| 180.77507 | 44.52808 | 23.601(23) | 23.707(19) | 23.372(30) |
| 180.77511 | 44.53187 | 23.566(17) | 23.772(20) | 22.798(20) |
| 180.77630 | 44.53949 | 23.089(21) | 23.228(20) | 23.009(30) |
| 180.77693 | 44.54960 | 23.822(19) | 24.041(23) | 22.981(21) |
| 180.78067 | 44.54180 | 23.060(18) | 23.309(23) | 22.898(24) |
| 180.78152 | 44.54246 | 22.434(11) | 22.603(13) | 21.713(11) |
| 180.78185 | 44.51941 | 22.824(20) | 22.894(15) | 22.462(28) |
| 180.78258 | 44.54943 | 23.771(18) | 23.959(24) | 23.325(31) |
Note. — Coordinates are based on the WCS solution of the first F350LP image. Uncertainties are given in parentheses and are expressed in units of mmag. This table is available in its entirety in machine-readable form.
We registered and drizzle-combined all images using the AstroDrizzle v2.2.6 package. We created master frames in each band by combining the respective images obtained in all epochs. We also created drizzled images of each F350LP epoch for variable detection. We modeled the surface brightness gradients across all images and subtracted them using the same methods as described by Y20.
We carried out point-spread function (PSF) photometry on the NGC 4051 images following identical procedures to those used in the case of NGC 4151 (Y20). We firstly derived a source list through a two-pass source detection on the F350LP master frame using DAOPHOT/ALLSTAR (Stetson, 1987), then performed ALLFRAME (Stetson, 1994) time-series photometry on the 12 epochs of images obtained through that filter. The frame-to-frame magnitude offsets were calculated based on 69 carefully-selected secondary standards which are listed in Table 2. We transformed the coordinates of the objects in the F350LP source list to carry out fixed-position PSF photometry in the F555W, F814W & F160W master frames (no time-series measurements were obtained, only mean magnitudes). We performed an additional detection step on the F160W master frame after removing the stars that were present in the F350LP source list.
3 Cepheid Identification and Characterization
We applied the same Cepheid selection procedures as described by Y20 and identified 419 Cepheid candidates in NGC 4051. We measured their periods, amplitudes, and crowding bias corrections.
3.1 Cepheid identification
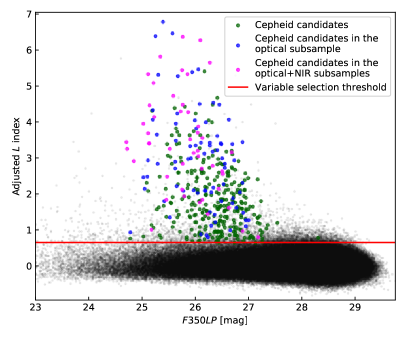
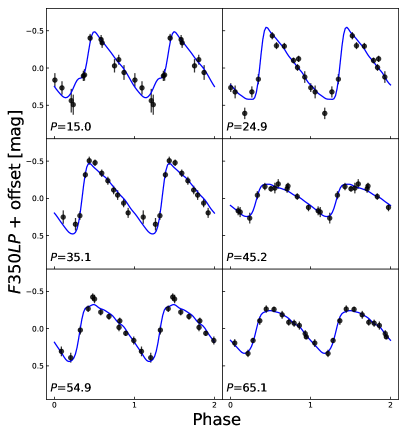
Our Cepheid identification included four steps: variability index cut (Stetson, 1996, adjusted for magnitude dependence), template fitting, period and amplitude cuts, and visual inspection. We firstly selected 4519 variable candidates with Stetson index . This threshold was slightly higher than the initial choice for NGC 4151 () for two reasons: (1) the minimum value for NGC 4151 Cepheids that were eventually used for distance determination was 0.9; (2) the NGC 4051 field contains more Cepheid-yielding star-forming regions, and thus the number of variables is not a limiting factor for the NGC 4051 distance determination. Our goal is not to discover the complete set of Cepheids in NGC 4051 but rather to identify a high-purity sample that enables a precise and accurate distance determination. The –magnitude distribution for NGC 4051 and our updated threshold are shown in Figure 2. Secondly, we fit the Yoachim et al. (2009) Cepheid templates to the F350LP light curves of these variable candidates using the method described by Y20. Thirdly, we restricted the sample based on the best-fit periods and amplitudes as done in Y20; this yielded 2804 objects with d and peak-to-trough amplitudes between 0.4 and 1.7 mag. Finally, we visually inspected the phase-folded F350LP light curves of these 2804 objects and their overall matches to the best-fit Cepheid templates by overplotting measurements and templates. We identified 419 Cepheid candidates through this visual inspection process. Rejected objects are mostly non-variables with noisy measurements which passed our initial selection criteria. Light curves of all 2804 pre-selected objects are available as supplementary material. Figure 3 shows 6 examples to illustrate the light curve quality of the selected variables. The F350LP light curves of all 419 visually selected objects are given in Table 3. Our motivation for this inspection is to obtain a high-purity sample, which is superior to a larger but possibly contaminated sample for distance measurement. Though subjective, visual inspection remains an effective and widely-adopted method for the final Cepheid confirmation in extragalactic distance studies (e.g., Saha et al., 1996; Stetson et al., 1998; Fausnaugh et al., 2015; Hoffmann & Macri, 2015; Hoffmann et al., 2016; Bentz et al., 2019).
| Cepheid | ta | mag | |
|---|---|---|---|
| ID | [day] | [mag] | |
| 9734 | 0.729 | 26.518 | 0.062 |
| 9734 | 19.282 | 26.473 | 0.070 |
| 9734 | 23.394 | 26.610 | 0.055 |
| 9734 | 28.883 | 26.705 | 0.079 |
| 9734 | 34.113 | 26.199 | 0.045 |
| 9734 | 40.468 | 26.267 | 0.067 |
| 9734 | 47.088 | 26.703 | 0.111 |
| 9734 | 52.458 | 26.353 | 0.053 |
| 9734 | 56.823 | 26.135 | 0.051 |
| 9734 | 61.067 | 26.201 | 0.051 |
| 9734 | 66.699 | 26.537 | 0.051 |
| 9734 | 73.602 | 26.595 | 0.078 |
Note. — : JD2458089. This table is available in its entirety in machine-readable form.
Thanks to the template-fitting technique, Cepheid periods can be effectively recovered with sparsely sampled light curves. Typically, 12-epoch optical observations are designed to search for Cepheids in extragalactic systems and measure their periods (Madore & Freedman, 1991). Because there are only 4 free parameters (including the period) in the model, it is relatively easy to recover the Cepheid periods with 12 measurements. However, we note that the light curve sampling requires a span of 60-90 days and nonredundant spacings to ensure adequate phase coverage (Madore & Freedman, 2005). In this work, we solved the Cepheid periods using a nonlinear least-square fitting method, with the exact methodology described in Y20. To ensure the global least-square fit is reached, we included a grid of 150 logarithmically-spaced initial trial periods from 10 to 120 days. We note that the fitting algorithm is allowed to converge to any period within the entire range, regardless of the starting trial value. As a result, for a given object, the 150 initial trial periods usually converged to only a few final values where reached local minima. We adopted the output period with the lowest as the best fit. For the 419 Cepheid candidates, we further estimated their period accuracy using the bootstrapping method. We computed the template-fitting residuals for each light curve, resampled and added them back to the original light curve, and then determined the residual-resampled light curve period. This process was repeated 200 times, and the standard deviation of the resulting periods was adopted as the period uncertainty. We found a mean (median) relative period uncertainty of 2.0% (1.7%). The occurrences of 0.05 and 0.1 were 4% and 0.5%, respectively. Their contribution to the final distance error budget is studied in §4.2.
We considered whether the measurement uncertainty in period combined with the greater frequency of short period than long period Cepheids could bias the period determination. Using a realistic distribution of periods we found for the mean case where , the bias in the inferred period is about 2% of the period measurement uncertainty or =0.00015 and combined with the PL relation a bias in the inferred magnitude of 0.0004 mag. For Cepheids with periods closer to the span of the observations, 1.8, the mean bias rises to 5% of the uncertainty or =0.00035, still quite negligible. However, this bias can become important when the measurement uncertainty in exceeds 0.05 and the bias in the PLR approaches 0.01 mag.
3.2 Crowding correction and magnitude calibration
We applied crowding, aperture, and phase corrections to the Cepheid magnitudes, then calibrated our photometric measurements on the Vega system.
While we adopted the same crowding correction method as for NGC 4151, we slightly updated our procedure in F160W relative to Y20. In our previous work, we only measured the F160W magnitude and crowding bias for Cepheids with d. We removed such a restriction for this analysis; 379 of the optically discovered Cepheids were located in the smaller NIR field of view. Of these, 278 were detected and photometered. We determined their F160W crowding correction by carrying out three passes of the artificial star test procedure, compared to only one pass for NGC 4151. In the first pass, we determined the artificial star magnitudes using a PLR (with a slope fixed to mag/dex) based on Cepheids with d. In the next two passes, we based our calculation on Cepheids with mag as determined from the preceding pass. The restriction of d and mag yielded a more accurate estimation of the input artificial star magnitudes, and our tests converged faster.
| ID | R.A. | Dec. | Amp. | F350LP | F555W | F814W | F160W | Fe | F555W | F814W | F160W | |||
|---|---|---|---|---|---|---|---|---|---|---|---|---|---|---|
| [J2000]a | [day] | [mag] | [mag (mmag)]c | [mmag]f | ||||||||||
| 82977 | 180.769100 | 44.538239 | 24.4(0.4) | 1.69 | 0.938 | 26.236(103) | 26.742(132) | 25.362(150) | 24.062(601) | 308.0 | -7(106) | 3(120) | 518(587) | |
| 88413 | 180.769205 | 44.537613 | 13.4(0.1) | 2.27 | 1.157 | 26.617(133) | 26.843(166) | 26.142(239) | 26.284(573) | 295.3 | 57(145) | 59(205) | 1308(508) | |
| 142230 | 180.769992 | 44.531406 | 14.8(0.1) | 3.63 | 0.885 | 26.257(158) | 26.506(181) | 25.572(184) | 253.9 | 33(148) | -3(165) | |||
| 129685 | 180.771219 | 44.533581 | 14.0(0.2) | 0.86 | 0.479 | 26.440(113) | 26.759(145) | 25.610(178) | 25.161(638) | 251.5 | 13(127) | 28(152) | 926(614) | |
| 125827 | 180.771822 | 44.534374 | 76.8(7.1) | 3.70 | 0.436 | 25.147( 36) | 25.584( 69) | 24.152( 46) | 22.963(222) | 275.9 | H | 7( 37) | 9( 36) | 5(212) |
| 115396 | 180.771970 | 44.535775 | 20.2(0.4) | 0.71 | 0.830 | 26.049(171) | 26.450(202) | 25.146(292) | 23.554(601) | 304.2 | 67(156) | 20(209) | 692(592) | |
| 101787 | 180.772327 | 44.537594 | 58.6(2.2) | 0.95 | 0.418 | 24.757(105) | 25.149( 93) | 23.863(120) | 22.090(288) | 329.8 | I | -13( 66) | 10( 69) | 48(275) |
| 126388 | 180.772356 | 44.534583 | 11.0(0.1) | 0.69 | 1.306 | 26.866(261) | 27.180(311) | 26.225(280) | 284.8 | 11(272) | 57(240) | |||
| 42535 | 180.772570 | 44.545120 | 17.8(0.3) | 1.60 | 1.124 | 26.847(129) | 27.190(192) | 25.969(188) | 24.942(602) | 283.4 | 38(140) | 20(145) | 836(578) | |
| 3059861 | 180.772803 | 44.541936 | 31.3(0.6) | 1.92 | 0.873 | 25.746(225) | 26.104(289) | 25.114(181) | 453.3 | 203(280) | 133(153) | |||
| 116297 | 180.772926 | 44.536114 | 19.9(0.5) | 1.02 | 0.890 | 25.881(125) | 26.134(148) | 25.065(161) | 24.084(505) | 309.5 | 25(130) | -3(128) | 704(484) | |
| 113897 | 180.772936 | 44.536426 | 16.0(0.3) | 0.81 | 0.776 | 26.308(171) | 26.774(217) | 25.576(216) | 25.216(530) | 316.8 | 14(152) | 10(173) | 1172(504) | |
| 131049 | 180.772952 | 44.534324 | 46.7(1.0) | 2.95 | 0.711 | 25.158( 71) | 25.398( 92) | 24.384( 80) | 24.125(427) | 287.4 | I | 29( 79) | 23( 67) | 144(380) |
| 153160 | 180.772990 | 44.531602 | 64.4(4.3) | 3.01 | 0.728 | 25.693( 61) | 25.965( 98) | 24.992( 83) | 23.977(258) | 263.3 | o | 8( 60) | 3( 55) | -1(234) |
| 38213 | 180.773388 | 44.546094 | 32.8(0.7) | 3.74 | 0.812 | 25.618(118) | 26.034(130) | 24.824(121) | 23.711(491) | 280.3 | 20(121) | 38(108) | 315(485) | |
| 182138 | 180.773570 | 44.528351 | 26.3(0.7) | 2.29 | 0.773 | 25.642(110) | 25.953(142) | 24.943(135) | 24.022(457) | 259.5 | 74(128) | 42(116) | 153(447) | |
| 49235 | 180.773713 | 44.544866 | 12.8(0.2) | 0.87 | 0.711 | 26.690(211) | 26.850(246) | 25.791(277) | 293.0 | 80(234) | 46(254) | |||
| 71671 | 180.774197 | 44.542297 | 49.0(0.9) | 1.59 | 0.635 | 25.362(144) | 25.635(173) | 24.609(133) | 430.9 | 114(159) | 73( 99) | |||
| 81958 | 180.774332 | 44.541084 | 26.4(0.1) | 1.48 | 0.994 | 26.225(185) | 26.548(184) | 25.664(174) | 400.3 | -6(147) | 11(145) | |||
| 201732 | 180.774472 | 44.526389 | 38.5(0.3) | 1.95 | 0.888 | 25.739(104) | 26.046(141) | 24.944(113) | 24.225(342) | 239.1 | H | -20( 94) | -20( 91) | 44(276) |
Note. — : Coordinates from first F350LP image. : Period uncertainties are shown in the parentheses. : Fully-calibrated Vega-system magnitudes, including crowding corrections and their uncertainties. : F160W-band local surface brightness in units of counts/s/sq arcsec. : Cepheids used for PLR (I), for both and PLRs (H), or rejected from optical PLRs (o). : Crowding corrections and uncertainties. This table is available in its entirety in machine-readable form.
Unlike Y20, we derived aperture corrections using field stars (listed in Table 2) for F350LP, F555W, and F814W. In the case of F160W, we adopted the aperture correction value derived by Y20 due to the insufficient number of suitable stars in the respective master frame. All magnitudes presented in this paper are in the Vega system and were calibrated using the current STScI zeropoints (see §4.2 of Y20 for the detailed method). The adopted Vega zeropoints for “infinite aperture” magnitudes are 26.817, 25.843, 24.712, and 24.689 for F350LP, F555W, F814W, and F160W, respectively.
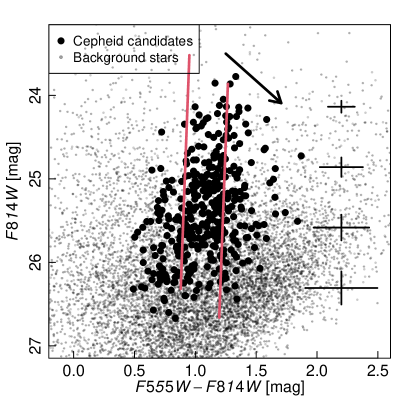
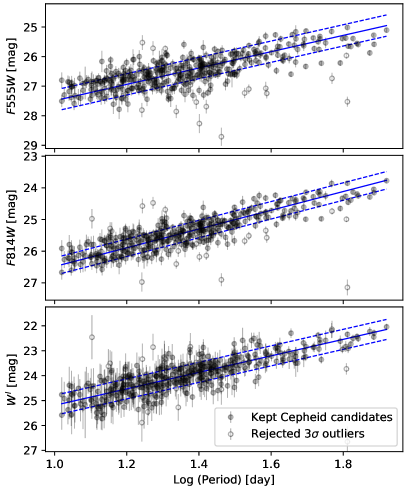
We present the Cepheid periods, amplitudes, fully calibrated magnitudes, and crowding corrections in Table 4. We adopted the Riess et al. (2019) PLR slopes of -2.76, -2.96, and -3.31 in F555W, F814W, and (defined below), respectively. We iteratively fit these PLRs to our sample, rejecting the single largest 3 outlier in each step until convergence. We arrived at a final optically-selected sample of 397 variables. Their color–magnitude diagram and optical PLRs are shown in Figure 4 and Figure 5, respectively.
4 Results
We determined a distance to NGC 4051 of Mpc, equivalent to a distance modulus of mag, by applying the reddening-free Wesenheit indices (Madore, 1982; Riess et al., 2019)
| (1) | |||||
| (2) |
to Cepheid subsamples with precise measurements and averaging the and PLR offsets relative to the LMC. In this section, we present the details of this selection, the corresponding distance determination, and a comparison to results obtained with an alternative procedure (Riess et al., 2016).
4.1 Selection of subsamples for distance determination
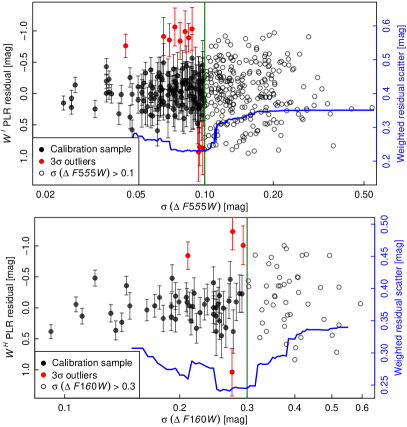
We selected high-quality subsamples of Cepheids for distance determination purposes, in order to obtain tight Cepheid PLRs and reduce the noise from poorly-measured outliers that were not detected in §3.2. The leading source of scatter in the index is the uncertainty in the F555W crowding correction . Thus, we empirically determined a cut of mag based on the weighted scatter of the PLR residuals, as shown in the upper panel of Figure 6. We applied an iterative 3 outlier rejection to obtain a subsample of 123 Cepheids for the optical distance determination. Similarly, we then applied a further empirical cut of mag to arrive at a “NIR distance subsample” of 47 Cepheids, as shown in the lower panel of Figure 6. The weighted scatter of the full and samples are 0.35 and 0.41 mag, respectively, while the corresponding values for the distance-determination subsamples are 0.23 and 0.24 mag, respectively.
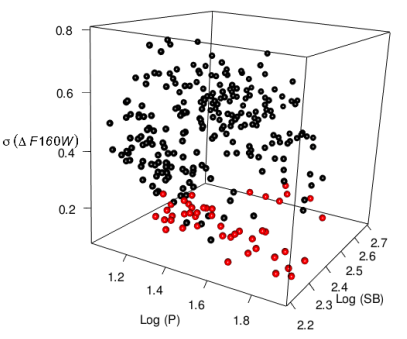
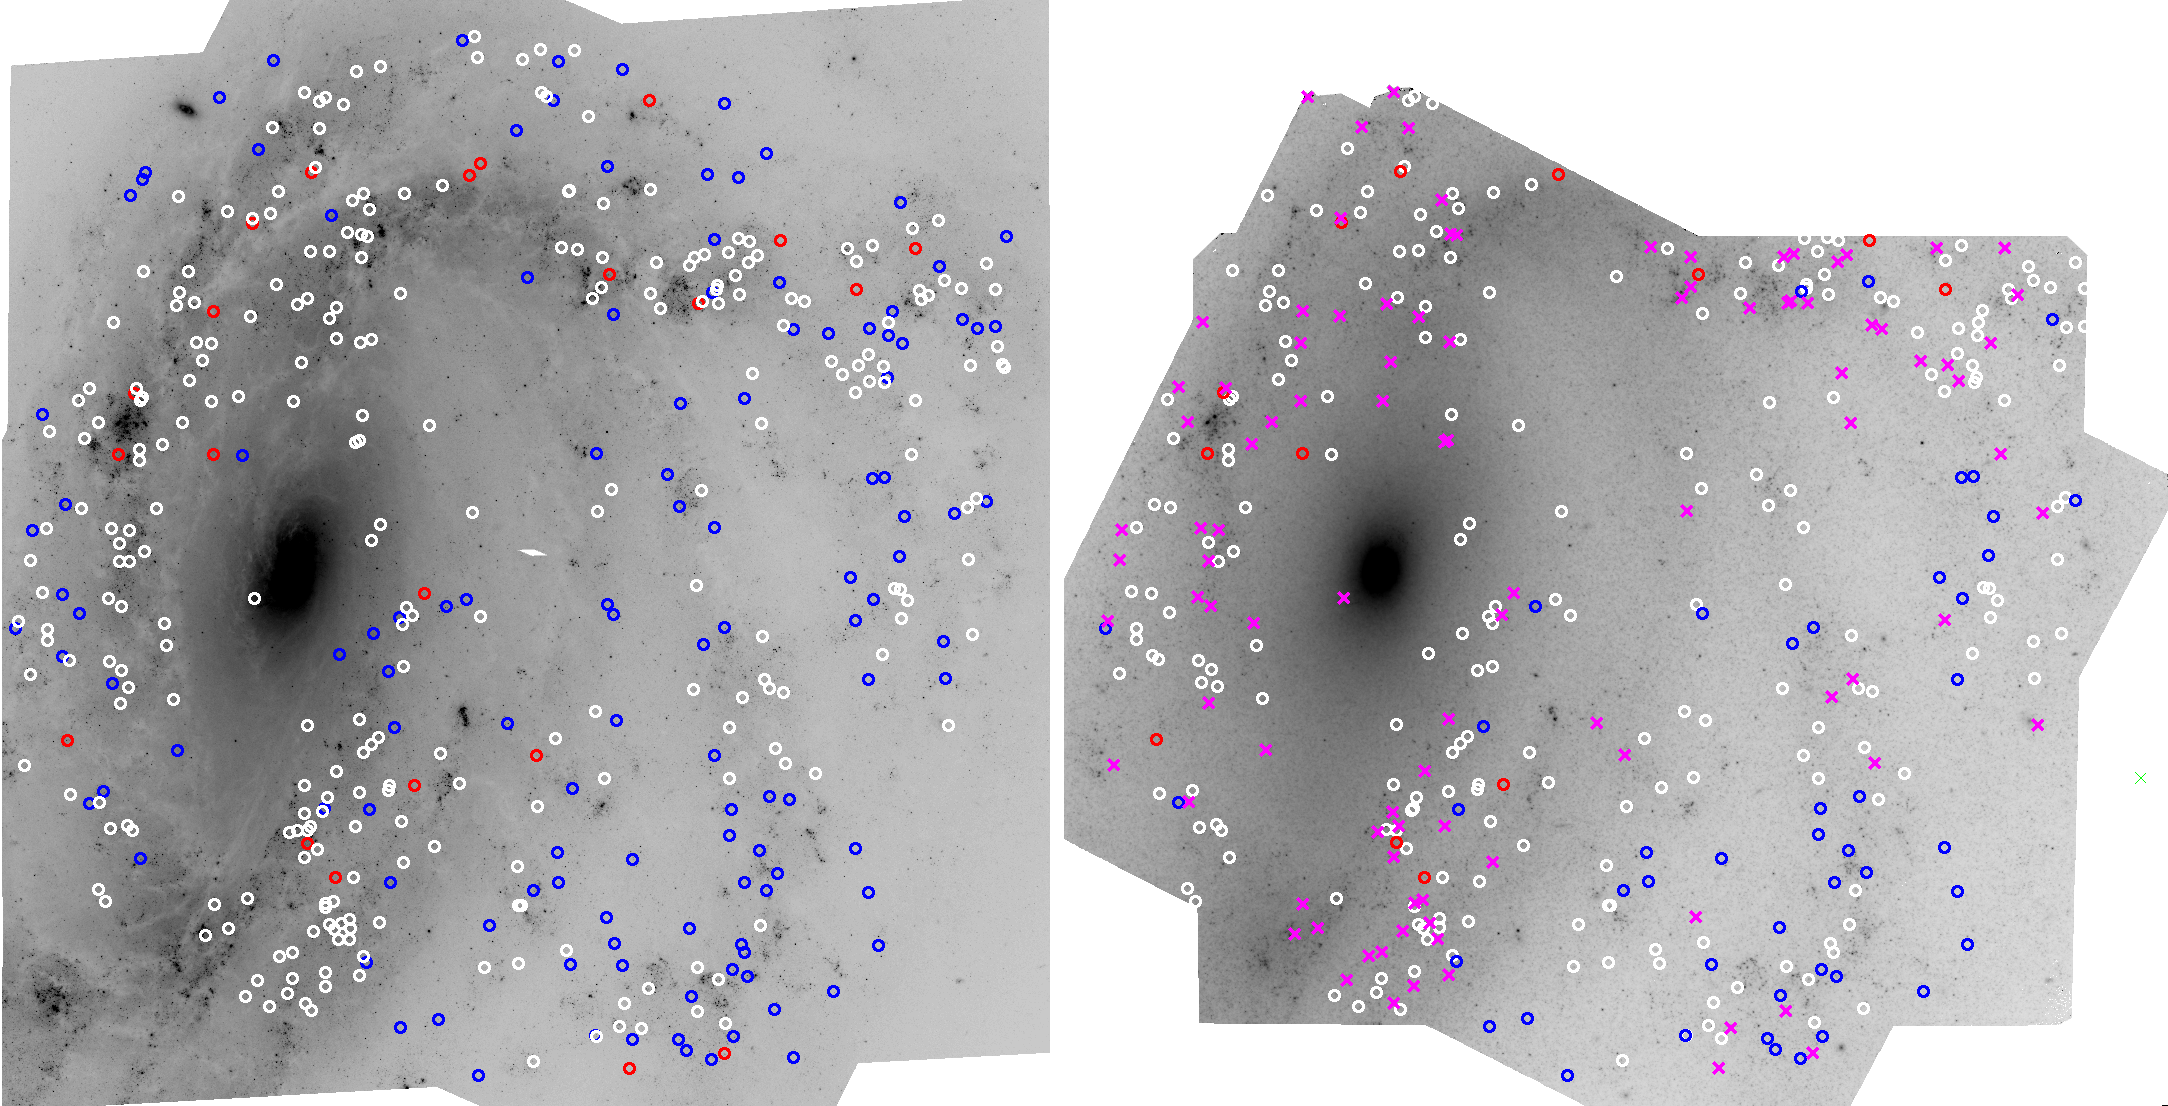

These selection criteria are different from those adopted by Y20, where we applied cuts on period and F160W surface brightness. Indeed, the crowding correction uncertainty is strongly correlated with period (or luminosity) and local surface brightness, as shown in Figure 7. We had noted in §4.3 of Y20 that a cut on yielded results consistent with those obtained via a cut on local surface brightness. Fig. 8 shows the positions of all Cepheids, color-coded by subsample. We expect that a long-period or low-crowding Cepheid subsample will be minimally impacted by systematics.
4.2 The distance to NGC 4051
We present the optical and NIR reddening-free Wesenheit PLRs for the distance-determination Cepheid subsamples in Figure 9. The PLR fit results are summarized in Table 5. The LMC-relative distance moduli are based on the Cepheid PLRs reported by Riess et al. (2019) and include a correction of mag to our F160W photometry to account for the difference in the adopted Vega-based zeropoint. The and PLRs yielded and mag, respectively. These two measurements are consistent within 1, and their combination yields mag. We note the combined uncertainty of 0.033 mag can be slightly underestimated as and are partially correlated due to the color term in . However, the F160W term is independent of and contributes more than the color term. Thus, we conclude that taking the weighted mean of the and based distances is a reasonable approximation. Madore & Freedman (1991), Groenewegen & Oudmaijer (2000) and Inno et al. (2013) suggested similar approaches that average distances from PLRs of different wavelengths. We adopt the LMC distance modulus of mag (Pietrzyński et al., 2019) to arrive at a distance modulus for NGC 4051 of mag, equivalent to a distance of Mpc.
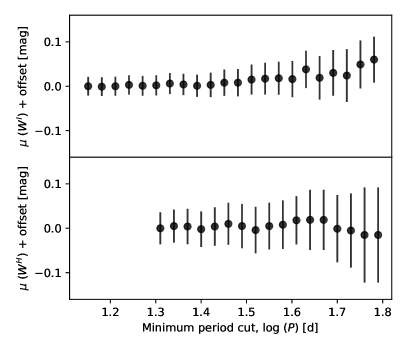
We present our error budget in Table 6 using the same format as for NGC 4151 by Y20, with the addition of an error term from Cepheid period uncertainties. We derived the latter with Monte Carlo simulations. We randomly drew periods from Gaussian distributions whose standard deviations are determined with bootstrapping (see §3.1), then fit PLR to these simulations 1000 times. We found the resulting distance modulus errors due to period uncertainty are 0.006 mag and 0.010 mag for and , respectively. Compared to our earlier work, we adopted a smaller and conservative magnitude calibration error of 0.01 mag for the optical PLR because we derived the F814W and F555W aperture corrections using field stars. The phase correction errors were also reduced as a result of the increased number of Cepheids in NGC 4051. The other entries are identical to NGC 4151. We estimated the uncertainty due to possible metallicity effects by using the [O/H] dispersion in 21 Cepheid hosts and the terms reported by Riess et al. (2016). We refer interested readers to §4.4 of Y20 for a detailed discussion of those systematics. We did not find a distance dependence on the minimum period cut for either the optical or NIR Cepheid subsamples, as shown in Figure 10.
We compared our distance determination to literature values, as compiled by the NASA/IPAC Extragalactic Database (NED). While the uncertainties in most of those previous determinations are too large to provide a statistically meaningful comparison against our result, Yoshii et al. (2014) derived a distance with comparable precision as ours. They used the AGN time-lag method and dust reverberation modeling to obtain a distance of Mpc. Their result is consistent with ours within 1.4, though we note that their distance determination for NGC 4151 is not consistent with ours, as reported by Y20.
| Index | Expression | Slope | Intercept | Weighted | |||
|---|---|---|---|---|---|---|---|
| LMC | N 4051 | scatter | |||||
| -3.31 | 15.933 | 28.535 | 0.23 | 123 | |||
| -3.26 | 15.915a | 28.587b | 0.24 | 47 | |||
Note. — : Corrected for the F160W-band count-rate nonlinearity; see Y20 for details. : Adjusted by 0.021 mag for the difference in adopted Vega zeropoints between Riess et al. (2019) and this study.
| Source | ||
|---|---|---|
| (mag) | (mag) | |
| PLR scatter | 0.021 | 0.035 |
| PLR slope | 0.033 | |
| Magnitude calibration | 0.01 | 0.02 |
| Metallicity | 0.03 | 0.02 |
| Phase correction | 0.009 | 0.004 |
| Reddening law | 0.01 | |
| Period error | 0.006 | 0.01 |
| Subtotal | 0.041 | 0.057 |
| Subtotal combined | 0.033 | |
| LMC distance | 0.026 | |
| Total | 0.048 | 0.062 |
| Total combined | 0.042 | |

4.3 Comparison to SH0ES procedure
The SH0ES project (Riess et al., 2016) measures Cepheid F160W magnitudes following a different procedure, which gives us an opportunity to compare the two photometry approaches. We carried out SH0ES photometry on the NGC 4051 F160W master image and derived NIR PLRs for a sample of Cepheids that were selected using the SH0ES criteria. Both methods use fixed-position PSF photometry in F160W, with positions derived from the higher signal-to-noise ratio and better-sampled optical master frame. Likewise, they both use artificial star tests to correct for crowding. Unlike this study, where we fixed positions for all sources appearing in both F350LP and F160W images, the SH0ES approach only fixes the positions for the Cepheids.
In addition, the SH0ES procedure includes two features to derive accurate photometry and Gaussian errors in magnitude space, as demonstrated in artificial star tests (see the bottom panel of Figure 11): (1) a large “protection” radius of FWHM to avoid spurious de-blends; (2) the selection of artificial stars that match the apparent source displacement of the Cepheid relative to the predicted optical position (a secondary consequence of blending, Riess et al., 2009). As a result, the SH0ES approach yielded unbiased photometry for a broader range of local crowding levels and thus resulted in a larger sample of Cepheids for distance determination. As shown in the top panel of Figure 11, the SH0ES criteria yielded 182 Cepheids and a distance modulus of 31.16 mag using the same aforementioned PLR slope. We also determined a distance modulus using the SH0ES-based photometry for 45 Cepheids that are in common with our NIR subsample, which yielded 31.17 mag (middle panel of Figure 11). Both are in excellent agreement (to within mag) with our results. We expect a statistical uncertainty between methods mostly due to the finite number of unique samples of artificial stars, 0.006 mag, and a systematic uncertainty arising from the choice of different PSFs, sky background regions, fitting techniques, etc., 0.02 mag.
This comparison is only a cross-check of the F160W photometry and the NIR subsample selection between the SH0ES approach and the methods adopted in this work. We refer interested readers to Javanmardi et al. (2021) for a comprehensive and fully independent comparison of all steps in the SH0ES methodology.
5 Discussion
Our Cepheid-based distance to NGC 4051 is close to the high end of the literature values, which range from 9 to 18 Mpc and are mostly based on the Tully & Fisher (1977) relationship. The bright central AGN in NGC 4051 is generally not accounted for in Tully–Fisher studies, thus biasing the studies that use blue imaging towards smaller distances (Robinson et al., submitted). Additionally, NGC 4051 may have increased star formation, when compared to comparable quiescent galaxies, as has been found for many active galaxies in the local universe (Xue et al., 2010). An elevated star formation rate may lead to an elevated surface brightness (e.g., Graves & Faber, 2010; Mould, 2020), which would also serve to bias Tully–Fisher distances towards smaller values. Finally, NGC 4051 has a lower inclination than is generally recommended for Tully–Fisher studies and thus increases the uncertainty in the resultant distance (Kourkchi et al., 2020). We discuss the implications of the Cepheid-based distance in §5.1 & §5.2, and the NGC 4051 galactic motion in §5.3.
5.1 Eddington ratio in NGC 4051
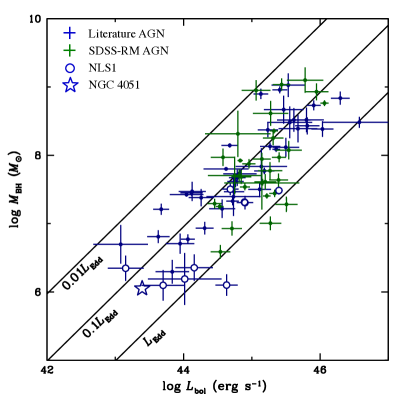
Peterson et al. (2004) and Collin et al. (2006) recognized that there might be a problem with the redshift-based distance to NGC 4051, and it was these concerns that led us to this investigation. Peterson et al. (2004, their Figure 16) and Collin et al. (2006, their Figure 6) showed that the Eddington ratio in NGC 4051 was surprisingly low for an NLS1 galaxy, one of only two such objects with (the other is MCG-06-30-15; Bentz et al., 2016). Now, at the corrected distance of 16.6 Mpc, the Eddington ratio is , a value more typical of NLS1 galaxies. In Figure 12, we update the mass–luminosity diagram of Peterson et al. (2004), where we see that the improved and increased distance places NGC 4051 in the same locus as other NLS1s, with , instead of the seemingly-odd value implied by previous distance estimates.
5.2 Revisiting the energetics of the nucleus
It seems that the most commonly assumed distance for NGC 4051 is the redshift-based distance of 9.3 Mpc, which is considerably smaller than the value reported here. This has a significant effect on linear distances within the galaxy, which now become a factor of 1.8 larger, and luminosity measures, which increase by a factor of 3.2.
Barbosa et al. (2009), for example, estimated the mass outflow rate and power along with three other Seyfert galaxies. Repeating their outflow calculation and increasing the diameter of the eastern outflow from 45 pc to 80 pc results in an outflow rate , where is the electron density in units of and is the volume filling factor, for which Barbosa et al. (2009) suggest a value of . We similarly correct the diameter of the western outflow from 44.5 pc to 79.2 pc, thus increasing the outflow rate to . The total outflow rate is the sum of these, . Similarly, recalculation of the kinetic luminosity gives
| (3) |
where is the outflow velocity.
Barbosa et al. (2009) compare the mass outflow rate to the mass accretion rate required to sustain the luminosity, but unfortunately using a bolometric luminosity that is much too low. The luminosity they use traces back to a Chandra X-ray observation obtained in 2000 April, when NGC 4051 was in an extremely faint X-ray state (Collinge et al., 2001); NGC 4051 has some history of the X-rays nearly turning off for long periods of time (Uttley et al., 1999; Peterson et al., 2000). We instead use the bolometric luminosity from Dalla Bontà et al. (2020), which adjusted to our distance of 16.6 Mpc becomes . It is worth noting at this point that the kinetic luminosity of the outflow is some six orders of magnitude less than the radiative luminosity for .
The corrected mass accretion rate is thus
| (4) |
where we have taken the efficiency to have the nominal value Barbosa et al. (2009) argue that if the total outflow rate exceeds the accretion rate, then the outflow must be comprised of accelerated circumnuclear material. In our revised calculation, this condition is met if .
On the other hand, the analysis of high-velocity outflows in NGC 4051 by Pounds (2014) does not need reassessment as a distance of 15.2 Mpc, based on a Tully–Fisher measurement, was assumed (Pounds & Vaughan, 2011a, b; Pounds & King, 2013). Adjustment to a distance of 16.6 Mpc results in little change.
5.3 Galactic motion
NGC 4051 is a member of what is often referred to as the Ursa Major Cluster (Tully et al., 1996). CosmicFlows-3 (Tully et al., 2016) reports an overall distance to Ursa Major of Mpc, which agrees with our Cepheid distance to NGC 4051 within the quoted uncertainty. Over the years, it has become clear that the Ursa Major complex is likely composed of several distinct bound groups (Karachentsev et al., 2013; Kourkchi & Tully, 2017). Both Karachentsev et al. (2013) and Kourkchi & Tully (2017) place NGC 4051 into a group with the lenticular galaxy NGC 4111 as the brightest member. Kourkchi & Tully (2017) list 14 members in the group, and have redshift-independent distances for five of these galaxies. With this information, they derive a weighted average group distance of 14.36 1.01 Mpc, which is broadly consistent with our derived Cepheid distance to NGC 4051 when taking into account the size of the group itself.
The observed velocity of NGC 4051 in the reference frame of the Local Group is km s-1 (Karachentsev & Makarov, 1996). Adopting a value of the Hubble constant of km s-1 Mpc-1 (Riess et al., 2019) allows us to calculate a peculiar velocity of km s-1. While seemingly high, we note that the vast majority of galaxies in the Ursa Majoris complex exhibit a negative peculiar velocity, with an average peculiar velocity with respect to the Local Group of km s-1 (Karachentsev et al., 2013). Similarly, Pak et al. (2014) identified 166 Ursa Major members and found that they lie in a redshift range of 620–1208 km s-1. Considering that all these galaxies are roughly equidistant, the peculiar velocity of NGC 4051 lies well within the inferred peculiar velocity range of other Ursa Major galaxies. When placed in this context, our derived distance to NGC 4051 is consistent with expectations.
6 Summary
We analyzed HST time-series observations for the Seyfert 1 galaxy NGC 4051 and identified 419 Cepheid candidates in this system. Using subsamples of Cepheids that were precisely measured at optical and NIR wavelengths, we derived a distance of Mpc, equivalent to a distance modulus of mag. We calculated the Eddington ratio of the AGN residing in this galaxy to be , thus confirming NGC 4051 as a typical NLS1 in terms of the AGN mass–luminosity ratio. We obtained a peculiar velocity of km s-1 for NGC 4051 and compared it to those of the other Ursa Major member galaxies. We revisited the energetics of the NGC 4051 nucleus based on Barbosa et al. (2009) and derived an outflow rate of and an outflow kinetic luminosity of if was assumed, as well as a mass accretion rate of .
Appendix A Supplementary Material
We include light curves (in electronic form) for 2804 objects that passed our initial cuts (prior to visual selection). Light curves are shown in the same form as one of the panels of Figure 3. The file names are in the format of <id>.pdf where <id> is our internal tracking identifier. The figures are compressed and grouped into two tarballs, selected.tar.gz and rejected.tar.gz, based on our visual inspection results.
References
- Barbosa et al. (2009) Barbosa, F. K. B., Storchi-Bergmann, T., Cid Fernandes, R., Winge, C., & Schmitt, H. 2009, MNRAS, 396, 2, doi: 10.1111/j.1365-2966.2009.14485.x
- Bentz et al. (2016) Bentz, M. C., Cackett, E. M., Crenshaw, D. M., et al. 2016, ApJ, 830, 136, doi: 10.3847/0004-637X/830/2/136
- Bentz et al. (2019) Bentz, M. C., Ferrarese, L., Onken, C. A., Peterson, B. M., & Valluri, M. 2019, ApJ, 885, 161, doi: 10.3847/1538-4357/ab48fb
- Collin et al. (2006) Collin, S., Kawaguchi, T., Peterson, B. M., & Vestergaard, M. 2006, A&A, 456, 75, doi: 10.1051/0004-6361:20064878
- Collinge et al. (2001) Collinge, M. J., Brandt, W. N., Kaspi, S., et al. 2001, ApJ, 557, 2, doi: 10.1086/321635
- Dalla Bontà et al. (2020) Dalla Bontà, E., Peterson, B. M., Bentz, M. C., et al. 2020, arXiv e-prints, arXiv:2007.02963. https://arxiv.org/abs/2007.02963
- Dalla Bontà et al. (2020) Dalla Bontà, E., Peterson, B. M., Bentz, M. C., et al. 2020, ApJ, 903, 112, doi: 10.3847/1538-4357/abbc1c
- Davies et al. (2014) Davies, R. I., Maciejewski, W., Hicks, E. K. S., et al. 2014, ApJ, 792, 101, doi: 10.1088/0004-637X/792/2/101
- Fausnaugh et al. (2015) Fausnaugh, M. M., Kochanek, C. S., Gerke, J. R., et al. 2015, MNRAS, 450, 3597, doi: 10.1093/mnras/stv881
- Fischer et al. (2013) Fischer, T. C., Crenshaw, D. M., Kraemer, S. B., & Schmitt, H. R. 2013, The Astrophysical Journal Supplement Series, 209, 1, doi: 10.1088/0067-0049/209/1/1
- García-Burillo & Combes (2012) García-Burillo, S., & Combes, F. 2012, in Journal of Physics Conference Series, Vol. 372, Journal of Physics Conference Series, 012050, doi: 10.1088/1742-6596/372/1/012050
- Graves & Faber (2010) Graves, G. J., & Faber, S. M. 2010, ApJ, 717, 803, doi: 10.1088/0004-637X/717/2/803
- Grier et al. (2017) Grier, C. J., Trump, J. R., Shen, Y., et al. 2017, ApJ, 851, 21, doi: 10.3847/1538-4357/aa98dc
- Groenewegen & Oudmaijer (2000) Groenewegen, M. A. T., & Oudmaijer, R. D. 2000, A&A, 356, 849. https://arxiv.org/abs/astro-ph/0002325
- Hicks et al. (2013) Hicks, E. K. S., Davies, R. I., Maciejewski, W., et al. 2013, ApJ, 768, 107, doi: 10.1088/0004-637X/768/2/107
- Hoffmann & Macri (2015) Hoffmann, S. L., & Macri, L. M. 2015, AJ, 149, 183, doi: 10.1088/0004-6256/149/6/183
- Hoffmann et al. (2016) Hoffmann, S. L., Macri, L. M., Riess, A. G., et al. 2016, ApJ, 830, 10, doi: 10.3847/0004-637X/830/1/10
- Hopkins & Quataert (2010) Hopkins, P. F., & Quataert, E. 2010, MNRAS, 405, L41, doi: 10.1111/j.1745-3933.2010.00855.x
- Inno et al. (2013) Inno, L., Matsunaga, N., Bono, G., et al. 2013, ApJ, 764, 84, doi: 10.1088/0004-637X/764/1/84
- Javanmardi et al. (2021) Javanmardi, B., Mérand, A., Kervella, P., et al. 2021, arXiv e-prints, arXiv:2102.12489. https://arxiv.org/abs/2102.12489
- Karachentsev & Makarov (1996) Karachentsev, I. D., & Makarov, D. A. 1996, AJ, 111, 794, doi: 10.1086/117825
- Karachentsev et al. (2013) Karachentsev, I. D., Nasonova, O. G., & Courtois, H. M. 2013, MNRAS, 429, 2264, doi: 10.1093/mnras/sts494
- Kocevski et al. (2012) Kocevski, D. D., Faber, S. M., Mozena, M., et al. 2012, ApJ, 744, 148, doi: 10.1088/0004-637X/744/2/148
- Kourkchi & Tully (2017) Kourkchi, E., & Tully, R. B. 2017, ApJ, 843, 16, doi: 10.3847/1538-4357/aa76db
- Kourkchi et al. (2020) Kourkchi, E., Tully, R. B., Eftekharzadeh, S., et al. 2020, ApJ, 902, 145, doi: 10.3847/1538-4357/abb66b
- Leavitt & Pickering (1912) Leavitt, H. S., & Pickering, E. C. 1912, Harvard College Observatory Circular, 173, 1
- Madore (1982) Madore, B. F. 1982, ApJ, 253, 575, doi: 10.1086/159659
- Madore & Freedman (1991) Madore, B. F., & Freedman, W. L. 1991, PASP, 103, 933, doi: 10.1086/132911
- Madore & Freedman (2005) —. 2005, ApJ, 630, 1054, doi: 10.1086/432108
- Mould (2020) Mould, J. 2020, Frontiers in Astronomy and Space Sciences, 7, 21, doi: 10.3389/fspas.2020.00021
- Osterbrock & Pogge (1985) Osterbrock, D. E., & Pogge, R. W. 1985, ApJ, 297, 166, doi: 10.1086/163513
- Pak et al. (2014) Pak, M., Rey, S.-C., Lisker, T., et al. 2014, MNRAS, 445, 630, doi: 10.1093/mnras/stu1722
- Peterson et al. (2000) Peterson, B. M., McHardy, I. M., Wilkes, B. J., et al. 2000, ApJ, 542, 161, doi: 10.1086/309518
- Peterson et al. (2004) Peterson, B. M., Ferrarese, L., Gilbert, K. M., et al. 2004, ApJ, 613, 682, doi: 10.1086/423269
- Pietrzyński et al. (2019) Pietrzyński, G., Graczyk, D., Gallenne, A., et al. 2019, Nature, 567, 200, doi: 10.1038/s41586-019-0999-4
- Pounds (2014) Pounds, K. 2014, Space Sci. Rev., 183, 339, doi: 10.1007/s11214-013-0008-4
- Pounds & King (2013) Pounds, K. A., & King, A. R. 2013, MNRAS, 433, 1369, doi: 10.1093/mnras/stt807
- Pounds & Vaughan (2011a) Pounds, K. A., & Vaughan, S. 2011a, MNRAS, 413, 1251, doi: 10.1111/j.1365-2966.2011.18211.x
- Pounds & Vaughan (2011b) —. 2011b, MNRAS, 415, 2379, doi: 10.1111/j.1365-2966.2011.18866.x
- Riess et al. (2019) Riess, A. G., Casertano, S., Yuan, W., Macri, L. M., & Scolnic, D. 2019, ApJ, 876, 85, doi: 10.3847/1538-4357/ab1422
- Riess et al. (2009) Riess, A. G., Macri, L., Casertano, S., et al. 2009, ApJ, 699, 539, doi: 10.1088/0004-637X/699/1/539
- Riess et al. (2016) Riess, A. G., Macri, L. M., Hoffmann, S. L., et al. 2016, ApJ, 826, 56, doi: 10.3847/0004-637X/826/1/56
- Riffel et al. (2008) Riffel, R., Pastoriza, M. G., Rodríguez-Ardila, A., & Maraston, C. 2008, MNRAS, 388, 803, doi: 10.1111/j.1365-2966.2008.13440.x
- Riffel et al. (2013) Riffel, R. A., Storchi-Bergmann, T., & Winge, C. 2013, MNRAS, 430, 2249, doi: 10.1093/mnras/stt045
- Saha et al. (1996) Saha, A., Sandage, A., Labhardt, L., et al. 1996, ApJ, 466, 55, doi: 10.1086/177493
- Schawinski et al. (2012) Schawinski, K., Simmons, B. D., Urry, C. M., Treister, E., & Glikman, E. 2012, MNRAS, 425, L61, doi: 10.1111/j.1745-3933.2012.01302.x
- Schnorr-Müller et al. (2014) Schnorr-Müller, A., Storchi-Bergmann, T., Nagar, N. M., & Ferrari, F. 2014, MNRAS, 438, 3322, doi: 10.1093/mnras/stt2440
- Seyfert (1943) Seyfert, C. K. 1943, ApJ, 97, 28, doi: 10.1086/144488
- Simões Lopes et al. (2007) Simões Lopes, R. D., Storchi-Bergmann, T., de Fátima Saraiva, M., & Martini, P. 2007, ApJ, 655, 718, doi: 10.1086/510064
- Sorce et al. (2014) Sorce, J. G., Tully, R. B., Courtois, H. M., et al. 2014, MNRAS, 444, 527, doi: 10.1093/mnras/stu1450
- Stetson (1987) Stetson, P. B. 1987, Publications of the Astronomical Society of the Pacific, 99, 191, doi: 10.1086/131977
- Stetson (1994) —. 1994, Publications of the Astronomical Society of the Pacific, 106, 250, doi: 10.1086/133378
- Stetson (1996) —. 1996, Publications of the Astronomical Society of the Pacific, 108, 851, doi: 10.1086/133808
- Stetson et al. (1998) Stetson, P. B., Saha, A., Ferrarese, L., et al. 1998, ApJ, 508, 491, doi: 10.1086/306443
- Storchi-Bergmann & Schnorr-Müller (2019) Storchi-Bergmann, T., & Schnorr-Müller, A. 2019, Nature Astronomy, 3, 48, doi: 10.1038/s41550-018-0611-0
- Tully et al. (2016) Tully, R. B., Courtois, H. M., & Sorce, J. G. 2016, AJ, 152, 50, doi: 10.3847/0004-6256/152/2/50
- Tully & Fisher (1977) Tully, R. B., & Fisher, J. R. 1977, A&A, 500, 105
- Tully et al. (1996) Tully, R. B., Verheijen, M. A. W., Pierce, M. J., Huang, J.-S., & Wainscoat, R. J. 1996, AJ, 112, 2471, doi: 10.1086/118196
- Uttley et al. (1999) Uttley, P., McHardy, I. M., Papadakis, I. E., Guainazzi, M., & Fruscione, A. 1999, MNRAS, 307, L6, doi: 10.1046/j.1365-8711.1999.02801.x
- Wang et al. (2014) Wang, J.-M., Du, P., Hu, C., et al. 2014, ApJ, 793, 108, doi: 10.1088/0004-637X/793/2/108
- Xue et al. (2010) Xue, Y. Q., Brandt, W. N., Luo, B., et al. 2010, ApJ, 720, 368, doi: 10.1088/0004-637X/720/1/368
- Yoachim et al. (2009) Yoachim, P., McCommas, L. P., Dalcanton, J. J., & Williams, B. F. 2009, AJ, 137, 4697, doi: 10.1088/0004-6256/137/6/4697
- Yoshii et al. (2014) Yoshii, Y., Kobayashi, Y., Minezaki, T., Koshida, S., & Peterson, B. A. 2014, ApJ, 784, L11, doi: 10.1088/2041-8205/784/1/L11
- Yuan et al. (2020) Yuan, W., Fausnaugh, M. M., Hoffmann, S. L., et al. 2020, ApJ, 902, 26, doi: 10.3847/1538-4357/abb377