COLLAPSE, CONNECTIVITY, AND GALAXY POPULATIONS
IN SUPERCLUSTER COCOONS: THE CASE OF A2142111Paper presented at the Fourth Zeldovich meeting, an international conference in honor of Ya. B. Zeldovich held in Minsk, Belarus on September 7–11, 2020. Published by the recommendation of the special editors: S. Ya. Kilin, R. Ruffini and G. V. Vereshchagin.
Maret Einasto
Tartu Observatory, Tartu University, Observatooriumi 1, 61602 Tõravere, Estonia
Abstract
The largest galaxy systems in the cosmic web are superclusters, overdensity regions of galaxies, groups, clusters, and filaments. Low-density regions around superclusters are called basins of attraction or cocoons. In my talk I discuss the properties of galaxies, groups, and filaments in the A2142 supercluster and its cocoon at redshift . Cocoon boundaries are determined by the lowest density regions around the supercluster. We analyse the structure, dynamical state, connectivity, and galaxy content of the supercluster, and its high density core with the cluster A2142. We show that the main body of the supercluster is collapsing, and long filaments which surround the supercluster are detached from it. Galaxies with very old stellar populations lie not only in the central parts of clusters and groups in the supercluster, but also in the poorest groups in the cocoon.
Keywords: galaxies: clusters: general – galaxies: groups: general – large-scale structure of Universe
1 Introduction
The large-scale distribution of galaxies can be described as the supercluster-void network or the cosmic web. The cosmic web consists of galaxies, galaxy groups, and clusters connected by filaments and separated by voids [1]. The largest systems in the cosmic web are galaxy superclusters, defined as the high-density regions in the cosmic web. Superclusters act as great attractors, growing through the inflow of matter from surrounding low-density regions. Therefore superclusters have also been defined as the regions of the dynamical influence where all galaxy flows inside it are converging [2]. High-density regions in the regions of the dynamical influence correspond to conventional superclusters, and low-density regions can be called as supercluster cocoons [3]. Supercluster cocoon boundaries follow the lowest density regions between superclusters [1].
The aim of a detailed study of the distribution and properties of galaxies and their systems in superclusters and in their cocoons is to clarify how the local and global environmental effects combine in determining the evolution and present-day dynamical state of superclusters and their components, along with the star-formation history of galaxies in these structures.
In our study we analysed the structure and galaxy content of the supercluster SCl A2142 at redshift , named after its richest cluster, A2142, and the cocoon region around it. We determined filaments in the cocoon, found the connectivity of groups and clusters in and around the supercluster, and the connectivity of the whole supercluster. The connectivity is defined as the number of filaments connected to a cluster, and it characterises the growth of cosmic structures [4]. To understand the evolution of groups and galaxies in them, and possible cosmic web detachments [5] we studied galaxies at various epochs of their star-formation history. Our study is the first study of a supercluster and its cocoon in which these aspects are combined [1]. We use the following cosmological parameters: the Hubble parameter km s-1 Mpc-1, matter density , and dark energy density [6].
2 Supercluster, group, and filament data and supercluster definition
We used data from supercluster, group, and filament catalogues, based on the Sloan Digital Sky Survey MAIN galaxy dataset, and available from the database of cosmology-related catalogues at http://cosmodb.to.ee/ [7, 8, 9] and [10]. Data on galaxy properties are taken from the SDSS DR10 web page 222http://skyserver.sdss3.org/dr10/en/help/browser/browser.aspx. Among many galaxy properties we used information about the index of galaxies, which is calculated as the ratio of the average flux densities in the band and . The index is correlated with the time passed from the most recent star formation event in a galaxy. It can be used as proxy for the age of stellar populations of galaxies, and star formation rates.
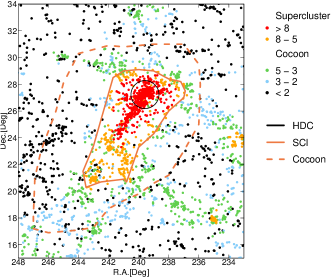
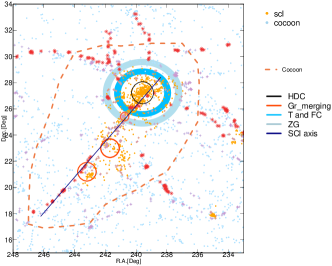
We used the luminosity-density field to determine the supercluster SCl A2142 and to find its cocoon boundaries. The supercluster centre is at the rich galaxy cluster A2142 at ∘ and ∘. The supercluster is defined as a volume around the cluster A2142 with luminosity-densities of (in units of mean luminosity-density, = 1.65 , in the luminosity-density field). Cocoon boundaries are defined as minima in the density field around the supercluster. We show the distribution of galaxies in SCl A2142 and in its environment in Fig. 1 (left panel). This figure shows that the supercluster has a high-density core (hereafter HDC) with the radius approximately Mpc. It is embedded in an almost spherical main body of the supercluster with the luminosity-density . The outer parts of the supercluster form its outskirts region. SCl A2142 has an almost straight tail, and the total length of the supercluster is approximately Mpc. The cocoon around the supercluster is elongated, with the maximum length of about Mpc.
3 Filaments and connectivity in the supercluster and in the cocoon
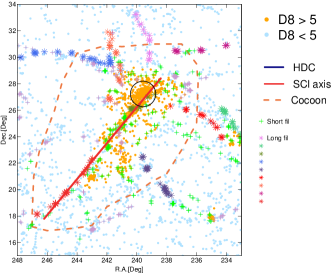
Figure 1 (right panel) shows long and short filaments in SCl A2142 and its cocoon. Filaments were identified using their member galaxies. A galaxy was considered as a member of a filament if its distance from the filament axis was Mpc. We found that six long filaments with length over Mpc begin near the supercluster main body. One long filament lies at the extension of the supercluster tail. Therefore, the connectivity of the supercluster main body is , and for the whole supercluster, it is . The most interesting among long filaments which surround the supercluster is a long filament, which lies at the extension of the supercluster tail. It has an almost straight shape in the sky plane. The total length of SCl A2142 together with this filament is approximately Mpc, which makes it the longest straight structure in the Universe described so far.
4 Dynamical state of the supercluster and its high-density core
We start the analysis of the dynamical state of the supercluster with the study of its HDC. We show the sky distribution of galaxies in it, and present its projected phase space (PPS) diagram in Fig. 2. In the PPS diagram line-of-sight velocities of galaxies with respect to the cluster mean velocity are plotted against the projected clustercentric distance (distance from the centre of A2142). Simulations show that in the PPS diagram galaxies at small clustercentric radii form an early infall (virialised) population E with infall times Gyr, and galaxies at large clustercentric radii form late or ongoing infall population L with Gyr. Figure 2 shows that the cluster A2142 is surrounded by substructures and groups, and the connectivity of A2142 is . They all lie in the infall zone of the cluster. Therefore, we may assume that the HDC is collapsing. This assumption can be tested by the analysis of the mass distribution in the supercluster, and by its comparison with the spherical collapse model, which is presented in Fig. 3. To calculate the radial mass distribution in the supercluster for finding density contrast we used dynamical masses of groups from the group catalogue.
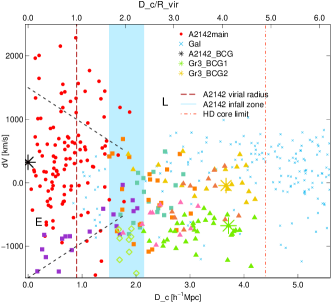
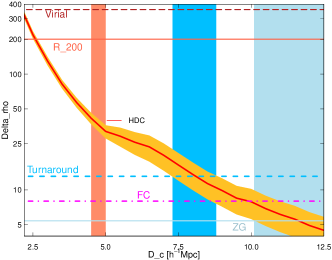
The spherical collapse model describes the evolution and dynamical state of a spherical perturbation in an expanding universe using various epochs, each of which has characteristic density contrast (see [11] for details and references). The first epoch is the ’turnaround’, with a density contrast of , defined as the epoch at which the collapse begins. Overdensity regions in which density contrast is not sufficient to collapse at present may collapse in the future, if their current overdensity is (FC denotes future collapse). The density contrast corresponds to a so-called zero gravity radius (ZG) where gravitation equals expansion. It borders the region which may stay gravitationally bound.
The HDC of the supercluster has density contrast at its borders . This suggests that the HDC has passed turnaround, and continues contracting. The radius of the turnaround region of the supercluster main body, Mpc. Turnaround region is populated by poor groups and single galaxies in short filaments. Long filaments do not reach the inner regions of the supercluster, and this may be related to the collapse of the supercluster main body, which have destroyed the structures in this region. The outer parts of the supercluster main body with radius Mpc will collapse in the future. Zero gravity region with a radius of Mpc approximately surrounds the supercluster main body. This means that regions at larger distances from the supercluster centre will not become gravitationally bound. Groups in the supercluster tail are merging, and will probably form at least three separate systems in the future. We note that these density contrasts correspond to cosmological model with matter density . If , then density contrast at runaround is [11], and the turnaround region of SCl A2142 is larger.
The characteristic radii in Fig. 3 were found using mass estimates of groups. These radii are in a good accordance with those at which long filaments are detached. This coincidence supports our interpretation that long filaments are detached because of the collapse. This suggests that the detailed study of filaments in and around superclusters together with the study of the dynamical state of superclusters can be used as a cosmological test.
5 Galaxy populations in the supercluster and in the cocoon
We analysed the spatial distribution of galaxies with different star formation histories in the supercluster and in cocoon, and found several interesting trends which are described in [1]. Next we focus on the distribution of galaxies with very old stellar populations (VO), defined as having index values . The value corresponds to the mean age of about Gyr [12].
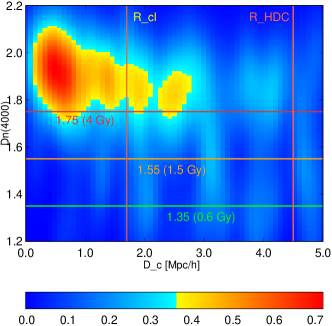
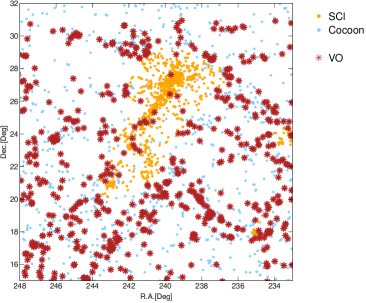
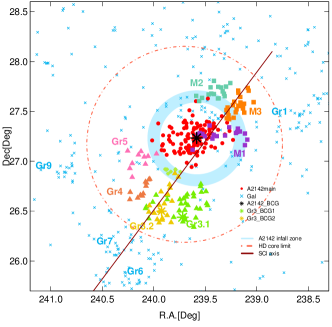
In Fig. 4 (left panel) we show the clustercentric distribution of VO galaxies in the HDC of SCl A2142. This figure shows that the central, virialised part of the cluster A2142 (the early infall region in the PPS diagram in Fig. 2) is populated with VO galaxies, and there are some VO galaxies also in the infalling structures. This is expected - galaxies which falled into the cluster during its formation, have been quenched there under influence of various processes [1, 13]. Therefore, we may expect that very dense environments are typical environments for VO galaxies. Figure 4 (right panel) shows the sky distribution of VO galaxies in the cocoon. Surprisingly, these galaxies can be found everywhere in the cocoon, in various structures from groups and filaments to single galaxies. The richness of their host groups vary from single galaxies to the richest cluster in our study, A2142, with several orders of host group mass range, from [1]. In filaments, they lie in the central parts, while outer parts are populated by star-forming galaxies [1]. Their properties are nearly independent of the global environmental density and, thus, the overall conditions for these galaxies to form and evolve had to be similar (or leading to similar galaxies) both in high- and low-global-density environments. This is unexpected owing to the very different conditions in rich and poor groups.
6 Summary
In our study of the supercluster SCl A2142 and its cocoon we determined the boundaries of the supercluster SCl A2142 cocoon using the luminosity-density field and studied the galaxy, group, and filament content therein. Our study showed that the connectivity of the supercluster and the galaxy content of groups and filaments are related to the evolution of the supercluster and its cocoon. Our results can be summarised as follows.
-
1)
The supercluster A2142, together with the long filament connected to it, forms the longest straight structure in the Universe detected so far, with a length of approximately Mpc. The length of the supercluster itself is Mpc, and the size of cocoon is Mpc.
-
2)
The supercluster main body is collapsing and six long filaments which surround it are detached from it at the turnaround region. The whole supercluster has connectivity .
-
3)
Among various trends in the properties of galaxies and groups related to the local (group and cluster) and global (supercluster and cocoon) environment we found that galaxies with the oldest stellar populations can be found in extremely different environments from the centre of the richest cluster in the superclusters to single galaxies in cocoon filaments.
The study of the supercluster SCl A2142, galaxies and galaxy groups in it and in its environment shows how the supercluster and structures around it evolve, making such type of studies a valuable tool in cosmology to study the evolution of the cosmic web. The supercluster has a long, straight filament as the extension of the supercluster, forming the longest straight structure detected so far. The presence of such structures may be a challenge for the theories of the structure formation in the Universe.
I thank my co-authors Boris Deshev, Peeter Tenjes, Pekka Heinämäki, Elmo Tempel, Lauri Juhan Liivamägi, Jaan Einasto, Heidi Lietzen, Taavi Tuvikene, and Gayoung Chon for fruitful and enjoyable collaboration. We are pleased to thank the SDSS Team for the publicly available data releases. The SDSS website is http://www.sdss.org/. We applied in this study R statistical environment.
Funding
The present study was supported by the ETAG projects IUT26-2, IUT40-2, PUT1627, by the European Structural Funds grant for the Centre of Excellence ”Dark Matter in (Astro)particle Physics and Cosmology” (TK133), and by MOBTP86.
References
- [1] M. Einasto, B. Deshev, P. Tenjes, P. Heinämäki et al., A&A, 641, A172 (2020).
- [2] R. B. Tully, H. Courtois, Y. Hoffman, D. Pomarède, Nature, 513, 71 (2014].
- [3] J. Einasto, I. Suhhonenko, L. J. Liivamägi, M. Einasto, A&A, 623, A97 (2019).
- [4] S. Codis, D. Pogosyan, C. Pichon, MNRAS, 479, 973 (2018).
- [5] M. A. Aragon Calvo, M. C. Neyrinck, J. Silk, The Open Journal of Astrophysics, 2, 2 (2019).
- [6] E. Komatsu, K. M. Smith, B. Dunkley, H. Gold et al., ApJS, 192, 18 (2011).
- [7] L. J. Liivamägi, E. Tempel, E. Saar, A&A, 539, A80 (2012).
- [8] E. Tempel, A. Tamm, M. Gramann, T. Tuvikene et al., A&A, 566, A1 (2014).
- [9] E. Tempel, R. S. Stoica, V. J. Martínez, L. J. Liivamägi et al., MNRAS, 438, 3465 (2014).
- [10] A. P. Aihara, C. Allende Prieto, D. An et al., ApJS, 193, 29 (2011).
- [11] M. Gramann, M. Einasto, P. Heinämäki et al., A&A, 581, A135 (2015).
- [12] G. Kauffmann, T. M. Heckman, S. D. M. White et al., MNRAS, 341, 33 (2003).
- [13] H. S. Hwang, J. Shin, H. Song, MNRAS, 489, 339 (2019).