Destruction of the central black hole gas reservoir through head-on galaxy collisions
Abstract
A massive black hole exists in almost every galaxy. They occasionally radiate a vast amount of light by releasing gravitational energy of accreting gas, with a cumulative active period of only a few , so-called the duty cycle of the Active Galactic Nuclei. Namely, many galaxies today host a starving massive black hole. Although galaxy collisions have been thought to enhance nucleus activity[1, 2], the origin of the duty cycle, especially the shutdown process, is a still critical issue[3]. Here we show that galaxy collisions are also capable of suppressing black hole fueling by using an analytic model and three-dimensional hydrodynamic simulations, applying the well-determined parameter sets for the galactic collision in the Andromeda galaxy[4, 5]. Our models demonstrate that a central collision of galaxies can strip the torus-shaped gas surrounding the massive black hole, the putative fueling source. The derived condition for switching-off the black hole fueling indicates that a significant fraction of currently bright nuclei can become inactive, reminiscent of fading/dying active nucleus phenomena[6, 7, 8, 9] associated with galaxy merging events. Galaxy collisions may therefore be responsible both for switching-off and turning-on the nucleus activity, depending on the collision orbit (head-on or far-off-centre).
Information Technology Center, The University of Tokyo, 5-1-5 Kashiwanoha, Kashiwa, Chiba 277-8589, Japan
Center for Computational Sciences, University of Tsukuba, 1-1-1 Tennodai, Tsukuba, Ibaraki 305-8577, Japan
Department of Economics, Management and Information Science, Onomichi City University, Onomichi, Hiroshima 722-8506, Japan
Visiting Scholar, National Astronomical Observatory of Japan, Mitaka, Tokyo 181-8588, Japan
Recent discoveries of very extended (radius ), photo-ionized regions around galaxies often show the fading/dying activity of Active Galactic Nuclei (AGN) over \citeprepenalty[ref.\@nociteLintott2009, Yoshida2002\@make@cite@list\@restore@auxhandle]\@restore@auxhandle. These galaxies often show kinematic signatures of outflows and morphological signatures of interacting or merging galaxies or postmerger morphologies (tidal tails). The extended structures seem to be the remnants of merging or interacting galaxies, with gas accretion activity onto the massive black holes (MBHs) of the central and/or the colliding satellite galaxies[7, 11]. These galaxies are in general radio-quiet, undermining the possibility that the large-scale gaseous structure is jet-induced. Subsolar metal abundances () are inferred from the line ratios of the gas in the outskirts of these galaxies[9, 8]. The very extended emission-line regions are most likely tidal debris of galactic interactions, illuminated by the past AGN, which has now faded by several orders of magnitudes. The above findings hint at a negative effect on the central activity by galaxy merger.
The study of galaxy mergers in the local universe has advanced rapidly in recent years. In the stellar halo of the Andromeda galaxy (M31), the giant southern stream (GSS) is the most prominent tidal debris feature originating from a past galaxy merger[12]. So far, gravitational -body simulations of a central (head-on) collision between a satellite dwarf galaxy and M31 reproduced the observed features of the GSS[13, 14]. The systematic search for the infalling orbit and the morphology of the progenitor galaxy constrained the possible orbital parameters and physical properties of the progenitor to a narrow range[4, 5]. The massive dwarf galaxy hits and blankets the galactic centre, and the MBH, originally at the centre of the progenitor, is currently wandering in the halo of M31[4, 11]. The disc of the dwarf galaxy must have anti-clockwise rotating in the sky to reproduce the observed asymmetric feature along the eastern edge of the GSS[15].
In this work, we investigate the possibility that central galaxy collisions diminish AGN activity. Firstly, we focus on M31, which harbours a radiatively quiescent central MBH with a mass \citeprepenalty[ref.\@nociteBender2005\@make@cite@list\@restore@auxhandle]\@restore@auxhandle and a quite low X-ray luminosity ( times the Eddington luminosity[17], a maximum luminosity beyond which radiation pressure will overcome gravity). The reason for its extremely low activity, with respect to other inactive galaxies[18], is still unknown. We use hydrodynamical calculations on scales (see Methods and Extended Data Figure 5), assuming that the activity is fuelled by a torus surrounding the central MBH. We introduce a critical parameter , where is the gas fraction of the infalling satellite and is the mass of the torus gas. Given the sizes of the torus and the satellite, is proportional to the gas column-density ratio of the two bodies.
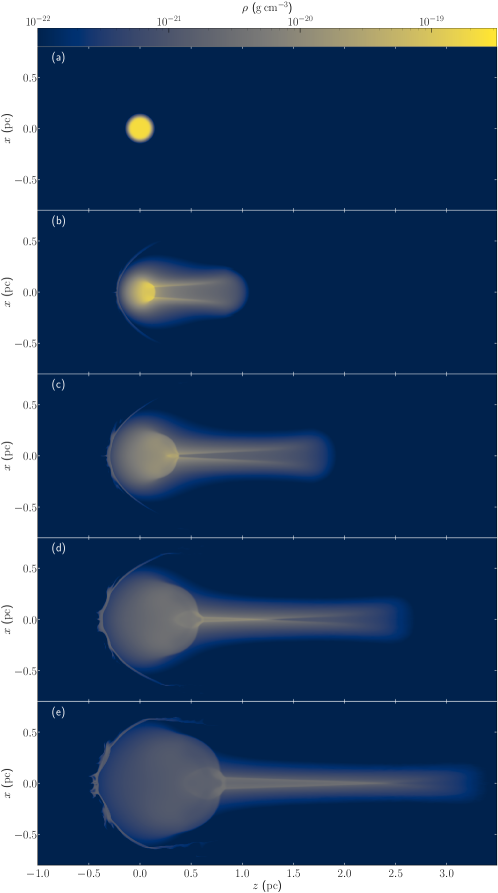
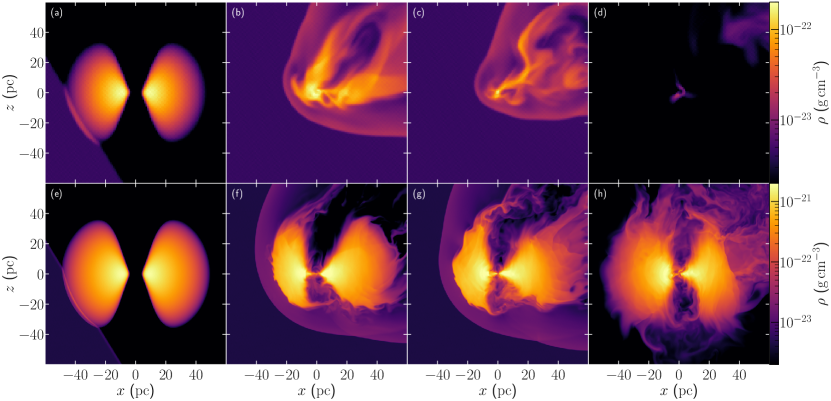
Figure 1 displays the time evolution of the torus density distribution in the meridian plane for (upper panels) and (lower panels). For the model, the propagation of the satellite gas causes intense compression of the torus gas. The torus gas is then accelerated by the infalling gas and is entirely pushed out of the gravitational potential well within a short time scale (). For model, the evolution of the torus gas is completely different from the case of . The gas is mildly ablated due to Kelvin–Helmholtz instabilities. As a result, there are many small irregularities in the surface of the torus gas. As the analytic model described in Methods predicts, the torus gas is completely stripped away from the central MBH for but survives for .
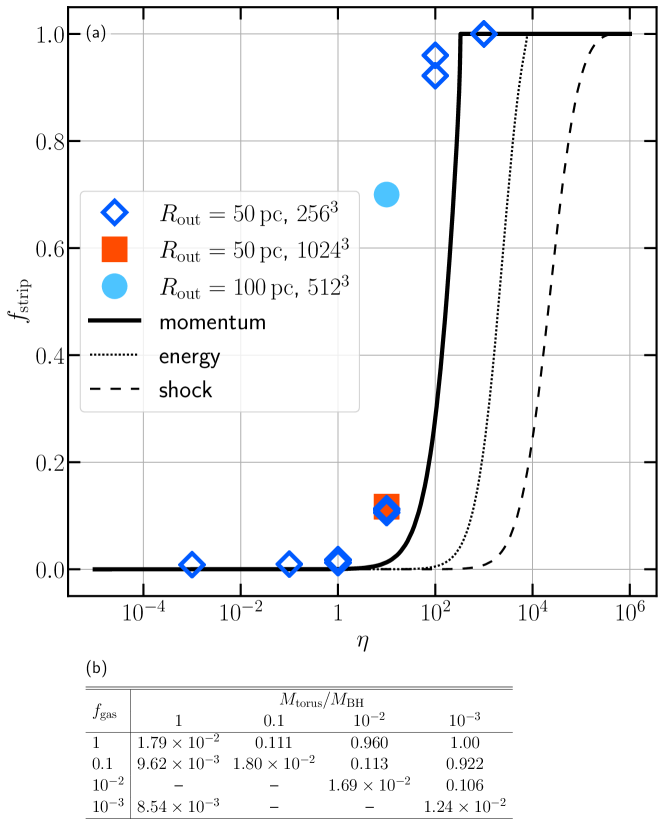
Figure 2a compares the numerical results (symbols) with the analytic model predictions (curves) as a function of , and Figure 2b lists the stripped fraction of the torus gas (see Methods). The result is almost identical to that in the normal resolution run ( grid points), indicating convergence with spatial resolution. Figure 2a shows how a sudden change of the stripped fraction occurs within the range of as predicted by the analytical model (solid curve in Figure 2a). It implies that a large amount of the torus gas is swept out via momentum transfer when the column-density of the torus gas is lower than that of the satellite galaxy (see also Extended Data Figure 6). Although both calculations show that the essential parameter driving the gas removal is the gas column-density ratio, , numerical simulations tend to strip more gas away from the central MBH than the analytical estimation.
There is, therefore, a critical value of (), beyond which the mass fueling onto the central MBH may be inhibited due to a diminished fuel reservoir. In contrast, if the column-density of the torus gas is high enough, there is little effect on the structure of the torus.
The stripped fraction for a torus double the radius, , but the same mass (for which we also double the adopt box size and the grid point numbers) is (sky-blue circle in Figure 2a). The larger torus size results in a smaller column-density , hence leading to the higher stripped fraction. It confirms that the critical condition to suspend the MBH fueling by central collisions of galaxies is the gas column-density ratio. These results show that the condition for gas stripping is as follows:
| (1) |
Here, and are the mass and the radius of the gaseous components in the infalling satellite galaxy. An equivalent formulation using the column-density ratio is: the column-density of the infalling gas, , must exceed that of the torus. The larger torus and the smaller satellite galaxy lead to easier gas stripping and effective suppression of MBH fueling.
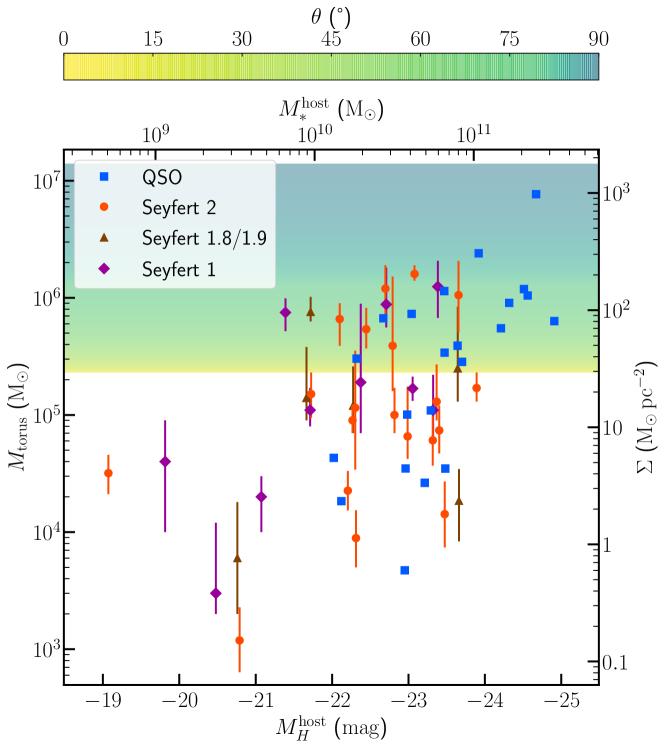
So far, we have focused on a specific parameter setting for the central collision that occurred in M31. We expect, however, that central collisions commonly occur in many galaxies, including host galaxies of AGN. We now translate the critical condition for AGN shut-off (eq. 1) to a condition involving AGN parameters. In Figure 3, we superimpose in colour the condition onto a plot of the absolute magnitude of a sample of host galaxies in the band v.s. the torus mass (see Methods). Below the critical zone (yellow to cyan coloured patch), where we find a significant fraction of AGN are located, the AGN activity can cease by a central collision of a satellite galaxy.
Namely, we here propose that galaxy collisions are potentially the essential process to control the fate of AGN activity. Galaxy collisions can trigger a starburst and gas flows towards central MBHs, via angular momentum transfer, and trigger an AGN[1]. On the other hand, luminous merging galaxies, such as ultra-luminous infrared galaxies, do not always harbour AGN[19]. Signatures of major mergers in host galaxies of AGN as seen by the Hubble space telescope images show no clear systematic differences from those in inactive galaxies[3]. Although evidence of multiple episodes in AGN activity has hitherto been accumulated[20], what controls the AGN activity (e.g., ignition and duration) is still unclear. Especially, the shutdown process of AGN activity has not yet concluded, while various mechanisms (e.g., accretion towards the central MBH, AGN feedback, and galactic bar resonance, see Methods) were proposed.
In Figure 3, the width of the critical zone reflects the uncertainty of the density distribution of the gas disc in the infalling satellite and the orientation angle between torus and satellite axis of rotation. Edge-on infall increases the column-density of the infalling gas and hence enhances the torus stripping compared to the face-on infall. Fainter galaxies appear to have torii that are more susceptible to the interaction of the infalling satellite, and therefore the AGN activity would be easily shut-off; reminiscent of AGN preferentially observed in massive galaxies[21]. Edge-on views of these torii would correspond to heavily obscured (so-called Compton-thick) AGN. Tidal compression of the infalling satellite, not considered here, would enlarge the critical zone by increasing the column-density of the infalling gas.
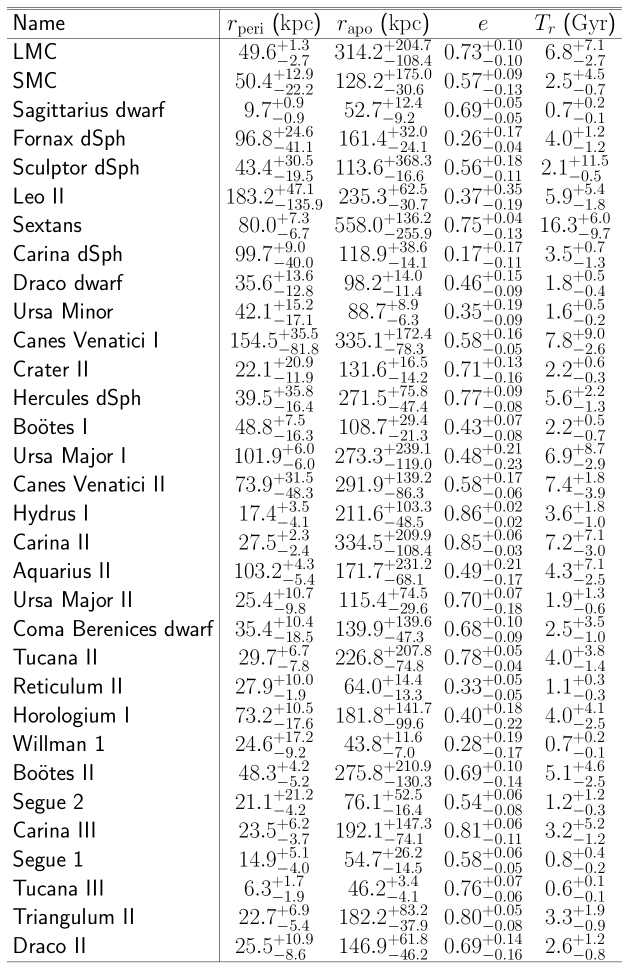
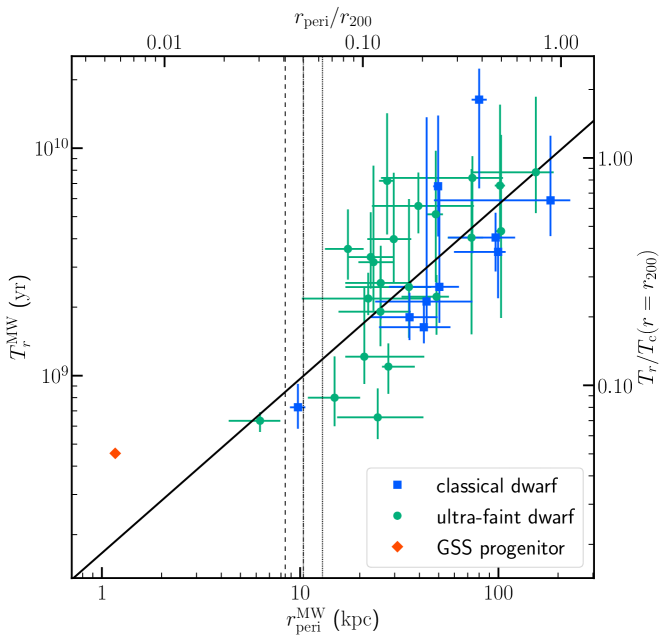
The hierarchical clustering model based on the standard cold dark matter cosmology predicts that the orbital eccentricity distribution of sub-galactic dark matter haloes in a Milky Way-sized dark matter halo is radially biased relative to that of all subhaloes associated with the host halo[22, 23, 24]. The radial orbit of the sub-galactic haloes can not only inhibit the mass fueling in the galactic centre but also lead to subhalo depletion, as a consequence of tidal destruction in the proximity of the galaxy centre () \citeprepenalty[ref.\@nociteGarrison-Kimmel2017\@make@cite@list\@restore@auxhandle]\@restore@auxhandle. Using the most recent proper motion measurements provided by the second data release of the Gaia mission (Gaia DR2), we integrated orbits of the satellite galaxies surrounding the Milky Way (see Methods and Extended Data Figure 7). The distributions of orbital periods, , and periapsises, , in Figure 4 show a linear (in logarithmic space) trend from the upper-right towards lower-left. Cosmological simulations indicate that about subhaloes in a Milky Way-sized halo have been stretched and disrupted by the tidal force of the central galaxy, and the debris has fallen into the galactic centre. For instance, subhaloes with gas, at and orbital period , would reduce nuclear MBH fueling in the central galaxy every on average, at the expense of the infalling subhalo itself. A recent high-resolution cosmological -body simulation implies that thousands of subhaloes penetrated the central region () in the nine Milky Way-sized haloes[26]. The inferred average merger rate over the cosmic age (1 per per a single host halo) is consistent with our estimation. In addition, Gaia DR2 recently provided evidence for a central collision event in the Milky Way. The Gaia–Enceladus–Sausage is identified as the remnant of a central collision that the Milky Way experienced about ago with a massive satellite galaxy[27, 28]. As previously stated, the GSS is the remnant of a recent central collision in M31. The GSS progenitor had a smaller pericentre and shorter orbital period compared to the Milky Way satellites known in Gaia DR2. Besides the GSS, the ring, a ring structure observed in M31, may be another signature of a recent central collision that occurred in M31[29].
An important point to be emphasised is that only central collisions of galaxies open up this new channel for suppressing central MBH fueling. Far-off-centre collisions/encounters are thought to occasionally enhance AGN activity triggering the gas flows to the central MBH via angular momentum transfer[2, 30]. Once gas fueling is triggered, however, the nuclear activity could be suppressed by the central collisions, which happen every , being consistent with the current estimate of the AGN durations. If orbital properties of satellite galaxies make a critical impact on the turning on/off of MBH fueling, merging events of galaxies may play an essential role in the AGN duty cycle.
In this Letter, we assume a smooth torus, although the torus may in fact be clumpy (see Methods and Extended Data Figures 8, 9 and 10). Uncertainties and dependencies on various collision parameters (such as infalling direction, velocity and pericentric distance) are not considered in this work. It is also worth investigating how long this suppression mechanism of the AGN activity lasts. Future studies utilising detailed simulations with a larger computational box for a longer duration, including gas inflow towards the torus from the galactic disc, self-gravity of the torus gas and radiative cooling processes, will reduce such uncertainties.
References
- [1] Sanders, D. B. et al. Ultraluminous infrared galaxies and the origin of quasars. ApJ 325, 74–91 (1988).
- [2] Hernquist, L. & Mihos, J. C. Excitation of Activity in Galaxies by Minor Mergers. ApJ 448, 41 (1995).
- [3] Cisternas, M. et al. The Bulk of the Black Hole Growth Since z ~1 Occurs in a Secular Universe: No Major Merger-AGN Connection. ApJ 726, 57 (2011).
- [4] Miki, Y., Mori, M., Kawaguchi, T. & Saito, Y. Hunting a Wandering Supermassive Black Hole in the M31 Halo Hermitage. ApJ 783, 87 (2014).
- [5] Miki, Y., Mori, M. & Rich, R. M. Collision Tomography: Physical Properties of Possible Progenitors of the Andromeda Stellar Stream. ApJ 827, 82 (2016).
- [6] Lintott, C. J. et al. Galaxy Zoo: ‘Hanny’s Voorwerp’, a quasar light echo? MNRAS 399, 129–140 (2009).
- [7] Keel, W. C. et al. The Galaxy Zoo survey for giant AGN-ionized clouds: past and present black hole accretion events. MNRAS 420, 878–900 (2012).
- [8] Keel, W. C. et al. Fading AGN Candidates: AGN Histories and Outflow Signatures. ApJ 835, 256 (2017).
- [9] Villar-Martín, M. et al. A 100 kpc nebula associated with the ‘Teacup’ fading quasar. MNRAS 474, 2302–2312 (2018).
- [10] Yoshida, M. et al. Discovery of a Very Extended Emission-Line Region around the Seyfert 2 Galaxy NGC 4388. ApJ 567, 118–129 (2002).
- [11] Kawaguchi, T., Saito, Y., Miki, Y. & Mori, M. Relics of Galaxy Merging: Observational Predictions for a Wandering Massive Black Hole and Accompanying Star Cluster in the Halo of M31. ApJ 789, L13 (2014).
- [12] Ibata, R., Irwin, M., Lewis, G., Ferguson, A. M. N. & Tanvir, N. A giant stream of metal-rich stars in the halo of the galaxy M31. Nature 412, 49–52 (2001).
- [13] Fardal, M. A., Guhathakurta, P., Babul, A. & McConnachie, A. W. Investigating the Andromeda stream - III. A young shell system in M31. MNRAS 380, 15–32 (2007).
- [14] Mori, M. & Rich, R. M. The Once and Future Andromeda Stream. ApJ 674, L77–L80 (2008).
- [15] Kirihara, T., Miki, Y., Mori, M., Kawaguchi, T. & Rich, R. M. Formation of the Andromeda giant stream: asymmetric structure and disc progenitor. MNRAS 464, 3509–3525 (2017).
- [16] Bender, R. et al. HST STIS Spectroscopy of the Triple Nucleus of M31: Two Nested Disks in Keplerian Rotation around a Supermassive Black Hole. ApJ 631, 280–300 (2005).
- [17] Li, Z., Wang, Q. D. & Wakker, B. P. M31* and its circumnuclear environment. MNRAS 397, 148–163 (2009).
- [18] Ho, L. C. Radiatively Inefficient Accretion in Nearby Galaxies. ApJ 699, 626–637 (2009).
- [19] Imanishi, M., Maiolino, R. & Nakagawa, T. Spitzer Infrared Low-Resolution Spectroscopic Study of Buried Active Galactic Nuclei in a Complete Sample of Nearby Ultraluminous Infrared Galaxies. ApJ 709, 801–815 (2010).
- [20] Saripalli, L., Subrahmanyan, R. & Udaya Shankar, N. Renewed Activity in the Radio Galaxy PKS B1545-321: Twin Edge-brightened Beams within Diffuse Radio Lobes. ApJ 590, 181–191 (2003).
- [21] Yamada, T. et al. Moircs Deep Survey. III. Active Galactic Nuclei in Massive Galaxies at z = 2-4. ApJ 699, 1354–1364 (2009).
- [22] Benson, A. J. Orbital parameters of infalling dark matter substructures. MNRAS 358, 551–562 (2005).
- [23] Khochfar, S. & Burkert, A. Orbital parameters of merging dark matter halos. A&A 445, 403–412 (2006).
- [24] Barber, C., Starkenburg, E., Navarro, J. F., McConnachie, A. W. & Fattahi, A. The orbital ellipticity of satellite galaxies and the mass of the Milky Way. MNRAS 437, 959–967 (2014).
- [25] Garrison-Kimmel, S. et al. Not so lumpy after all: modelling the depletion of dark matter subhaloes by Milky Way-like galaxies. MNRAS 471, 1709–1727 (2017).
- [26] Morinaga, Y., Ishiyama, T., Kirihara, T. & Kinjo, K. Statistical properties of substructures around Milky Way-sized haloes and their implications for the formation of stellar streams. MNRAS 487, 2718–2729 (2019).
- [27] Helmi, A. et al. The merger that led to the formation of the Milky Way’s inner stellar halo and thick disk. Nature 563, 85–88 (2018).
- [28] Belokurov, V., Erkal, D., Evans, N. W., Koposov, S. E. & Deason, A. J. Co-formation of the disc and the stellar halo. MNRAS 478, 611–619 (2018).
- [29] Gordon, K. D. et al. Spitzer MIPS Infrared Imaging of M31: Further Evidence for a Spiral-Ring Composite Structure. ApJ 638, L87–L92 (2006).
- [30] Ramón-Fox, F. G. & Aceves, H. Accretion of small satellites and gas inflows in a disc galaxy. MNRAS 491, 3908–3922 (2020).
We are grateful to Alex Wagner, Masayuki Umemura and Ken Ohsuga for careful reading of the manuscript and for their comments that improved the manuscript. Numerical computations were performed with computational resources provided by Multidisciplinary Cooperative Research Program in Center for Computational Sciences, University of Tsukuba, Oakforest-PACS operated by the Joint Center for Advanced High-Performance Computing (JCAHPC) and resources in the Information Technology Center, The University of Tokyo. This work was supported in part by Grants-in-Aid for Specially Promoted Research by MEXT (16002003) and Grant-in-Aid for Scientific Research (S) by JSPS (20224002), (A) by JSPS (21244013), (C) by JSPS (JP17K05389) and JSPS KAKENHI Grant Numbers JP20K14517, JP20K04022.
YM contributed to modeling, code development, numerical simulations, analysis, discussion and manuscript preparation; MM contributed to modeling, connection to recent Galactic observations, discussion and manuscript preparation; TK contributed to modeling, generalization to actual AGN environments, discussion and manuscript preparation.
The authors declare that they have no competing financial interests.
Correspondence and requests for materials should be addressed to YM (email: ymiki@cc.u-tokyo.ac.jp).
0.1 Earlier studies focusing on AGN activity.
Many studies have continuously investigated the shutdown mechanism of AGN activity. Accretion towards the central black hole reduces the torus gas, and it leads the depletion of the fueling source. However, the lifetime of clumpy torii is estimated to be a few to \citeprepenalty[ref.\@nociteBeckertDuschl2004\@make@cite@list\@restore@auxhandle]\@restore@auxhandle, which is much longer than the duration of the simulations in this work. It means that the accretion in the torus does not influence the torus destruction process during the central collision of galaxies, focused in this work. AGN feedback (via jet or radiative processes) may destroy the dusty torus. Numerical simulations, including strong AGN feedback, demonstrated the regulation of the gas fueling to the central region under the assumption of isotropic feedback[3]. High-resolution, radiation hydrodynamic simulations showed that the AGN feedback leads bipolar outflows having little influence in the gas fueling[4]. Other possible channels for the AGN shutdown are the termination of the gas fueling process from the galactic disc via the galactic bar and/or the Lindblad resonance. These processes will need dynamical timescale at a galactic scale (i.e., kpc scale) to vary their efficiency; therefore, they seem to be longer than the lifetime of AGN events (e.g., the bar destruction takes a few Gyr \citeprepenalty[ref.\@nociteAthanassoula2005\@make@cite@list\@restore@auxhandle]\@restore@auxhandle).
Merger-triggered enhancement of the AGN activity has been investigated. Numerical simulations showed that the galaxy collisions triggered mass fueling to the central region and suggested AGN activity enhancement[3, 6]. Recent high-resolution simulations modelling multi-phase interstellar medium with incorporating realistic physical processes resolve the mass fueling down to sub-parsec scales[7].
0.2 Setup for M31 collision simulations.
We describe the model assumptions and parameters for the gas around M31’s centre and the infalling satellite. We focus on the central region of the galaxy, which is dominated by the MBH and the bulge: the gravitational potential of the MBH and a bulge (with a mass and the scale length \citeprepenalty[ref.\@nociteGeehan2006\@make@cite@list\@restore@auxhandle]\@restore@auxhandle) are modelled as a fixed point mass and Hernquist potential:
| (2) |
where is calculated as to remove the divergence due to division by zero. This treatment is sufficiently accurate for the central of M31.
Before the collision, the torus is modelled as an equilibrium, axisymmetric polytrope gas with a heat capacity ratio under the spherical gravitational field as a function of the three-dimensional distance from the centre. The gas density , the effective potential and the specific angular momentum in cylindrical coordinates are as follows[9, 10, 11, 12]:
| (3) | ||||
| (4) |
We further assume that is constant over radii[10, 12],
| (5) |
The constant in equation (3) is determined by requiring at the outermost radius of the torus gas. Here, we assume \citeprepenalty[ref.\@nociteHoenig2006\@make@cite@list\@restore@auxhandle]\@restore@auxhandle as a fiducial value. The maximum value of the aspect ratio, the scale height of the torus over , should be about unity[14]. Setting the scale radius to be and meets this requirement. The mass of the torus gas is in the range of \citeprepenalty[ref.\@nociteMor2009,Schartmann2005\@make@cite@list\@restore@auxhandle]\@restore@auxhandle.
The total mass, the scale radius, the velocity and the periapsis of the infalling satellite are , , and \citeprepenalty[ref.\@nociteMiki2014, Miki2016\@make@cite@list\@restore@auxhandle]\@restore@auxhandle, respectively. Since the progenitor of the GSS interacts with the central region of M31 over a crossing time of , the gas of the infalling satellite is modelled as gas inflow lasting for . The central mass-density of the infalling satellite is estimated to be \citeprepenalty[ref.\@nociteMiki2016\@make@cite@list\@restore@auxhandle]\@restore@auxhandle. We assume the gas density of the infalling satellite is , where is the gas fraction in the range of \citeprepenalty[ref.\@nociteMateo1998, Conselice2003, Thuan2016\@make@cite@list\@restore@auxhandle]\@restore@auxhandle. The gas temperature of the infalling satellite is assumed to be .
0.3 One-dimensional analytic estimations.
We estimate the stripped fraction of the torus gas due to the hydrodynamic interaction with the infalling gas in the satellite galaxy analytically. For simplicity, we consider the case in which the satellite moves along the rotation axis of the torus gas (-axis) and solve the one-dimensional problem along the -axis. The initial volume-density of the torus gas is set to be . The initial vertical velocity of the torus is assumed to be zero.
Solving the one-dimensional Riemann problem yields the velocity , pressure and density of the torus gas just after shock passage. Based on previous studies of the GSS, we determine whether the gas is stripped or still bound at () from the centre, at which the free-fall time is about .
We set three independent and necessary conditions for gas stripping to estimate the stripped fraction of the torus gas. The first condition is that the velocity of the torus gas after the collision exceeds the escape velocity:
| (6) |
The second condition is that the sum of the kinetic and thermal energy of the torus gas exceeds the potential difference:
| (7) |
In this case, the stripped torus gas will re-accrete within the cooling timescale. The third condition is the momentum transfer:
| (8) |
where
| (9) |
The stripped fraction of the torus gas, , for each condition is defined as a fraction of the swept gas mass over the initial entire torus mass.
We solved the Riemann problem above for a range of cylindrical radii , cells from to , and then integrate the gas mass over the radii where at least one of the conditions eq.(6)–(8) is satisfied.
Figure 2a shows the results of the analytic estimation for . The stripping due to momentum transfer (the black solid curve) always predicts the highest stripped fraction. Models with predict that a significant fraction of the torus gas will be stripped away.
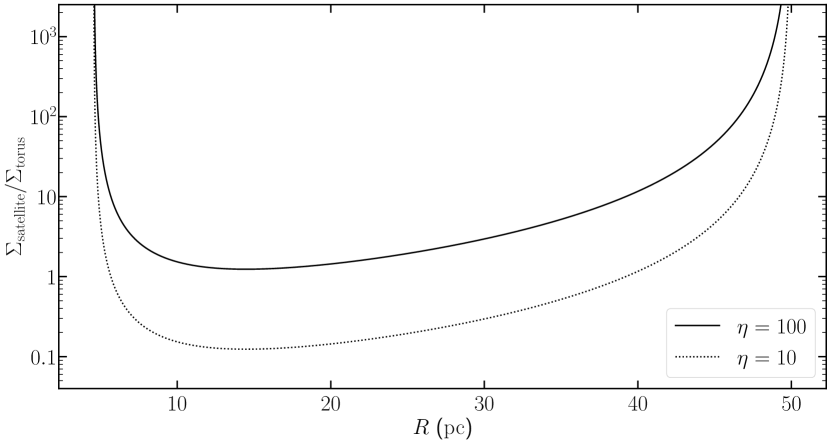
Extended Data Figure 6 compares the ratio of the column-density of the infalling satellite gas to that of the torus gas for (solid curve) and (dotted curve). In models with , the column-density of the infalling gas is higher than that of the torus gas for all radii. On the other hand, for models with , the column-density of the infalling gas is lower compared to that of the torus gas in most regions. The ratio of the column-densities determines the critical value of , underlining the importance of momentum transfer for gas stripping.
0.4 Three-dimensional hydrodynamic simulations.
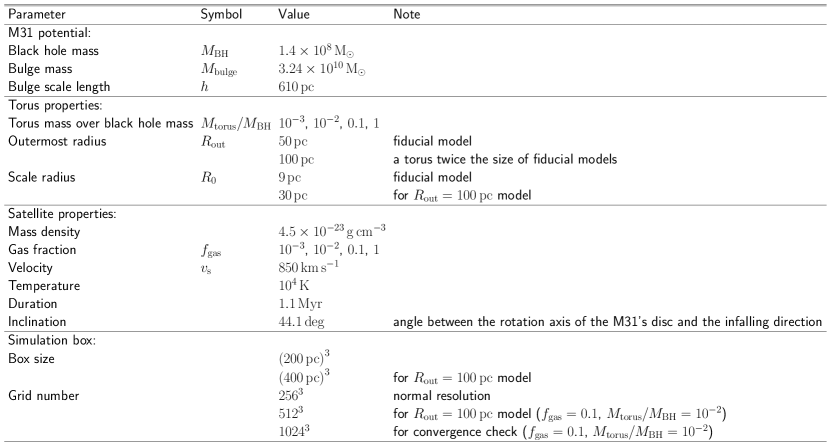
We have developed a flat MPI parallelized code adopting the HLLC scheme[20, 21] for the approximate Riemann solver with the second-order MUSCL interpolation. We performed runs with a grid of cells for box as a parameter study, a run with a grid of cells for box as convergence checks and a run with a torus twice the size of the fiducial model using a grid with cells for box. Extended Data Figure 5 summarises the parameters in the simulations.
The computational box is aligned with the infall direction of the satellite. The infalling gas is modelled by a steady and uniform inflow boundary condition (the gas density is , the velocity is and the temperature is ) for from , which is switched to a force-free boundary condition at . The remaining five boundaries are force-free boundaries at all times. Although there is no observational correlation between the rotation axis of the torus and that of the galactic disc[22], we here assume that the galactic disc (with the rotation axis inclined by to the direction of the satellite infall) and the torus share a rotation axis. We estimate the stripped fraction of the torus based on the bound gas mass at . Since the bound fraction is defined as the gas mass bound by the gravitational potential of the MBH and bulge as a fraction of the initial gas mass, is simply .
0.5 Dynamical evolution of the infalling satellite in the vicinity of the galactic centre.
Here we discuss possible processes changing the column-density of the infalling gas such as ram-pressure stripping and tidal stripping/compression. First of all, systematic studies concluded that the efficiency of the ram-pressure stripping within a certain period of time depends upon a total mass of the satellite galaxies, and that is, less-massive dwarfs lose their gasses quickly rather than massive dwarfs. A critical mass , which is the minimum mass for bearing the gas removal and keeping the most of the gas in infalling galaxies for a few giga-years, is estimated between to for an ambient gas density of and a velocity of \citeprepenalty[ref.\@nociteMoriBurkert2000, Fillingham2016\@make@cite@list\@restore@auxhandle]\@restore@auxhandle. The mass of the GSS’s progenitor lies in this marginal range. However, previous studies of the GSS formation indicate that this combination of the density and the high-velocity is only realised at the central high-density region in the M31, and the progenitor of the GSS takes only to pass through the central region[4]. It is clear that this transit-time is too short to strip the gas from the infalling galaxies even at the environment of the galactic centre. Therefore, the effect of the ram-pressure stripping is negligible, and most of its gas will certainly reach the galactic centre. Secondly, satellite galaxies having smaller pericentres will be more heavily influenced by tidal-stretching in the direction of the galactic centre and tidal-compressing along the other two axes when passing their pericentres. Then such satellite galaxies could form narrower stellar streams. To show the effect of these processes, we newly estimated the tidal-stretching radius of infalling satellite galaxies in the Milky Way, and we got about for total satellite masses of , and (see the vertical lines in Fig. 4). However, the tidal stripping will not significantly change the column-density of the infalling gas while it extends the duration of the gas inflow. On the other hand, the tidal compression reduces the cross-section of the infalling satellite, it will increase the column-density of the infalling gas and weaken the effects of the ram-pressure stripping.
0.6 Availability of torus modelling.
The half-light radius or Full-Width-at-Half-Maximum of the Mid-infrared continuum emission from the AGN torus is a measure of the size of the inner part under direct illumination from the central nucleus, and is around one to several \citeprepenalty[ref.\@nociteBurtscher2013, Kishimoto2011, Packham2005\@make@cite@list\@restore@auxhandle]\@restore@auxhandle. Emission from cooler material or fluorescence lines powered by X-rays are more extended with radii of order \citeprepenalty[ref.\@nociteHagiwara2013, Marinucci2013\@make@cite@list\@restore@auxhandle]\@restore@auxhandle. For instance, the radius of the central molecular torus in the Circinus galaxy is estimated using ALMA to be about \citeprepenalty[ref.\@nociteIzumi2018\@make@cite@list\@restore@auxhandle]\@restore@auxhandle. In radiative transfer calculations for torii, the outer radii are assumed to be \citeprepenalty[ref.\@nociteHoenig2006, Nenkova2008\@make@cite@list\@restore@auxhandle]\@restore@auxhandle. In our calculations, we generally adopt an outer radius of , and for the simulation with the larger torus, an outer radius of .
Although the torus is likely composed of numerous clumps[14], we assume a smooth distribution of gas in the torus in this study, for simplicity. We expect that clumps are destroyed almost instantaneously during the passage of the infalling gas and that the approximation of a smooth density distribution is appropriate.
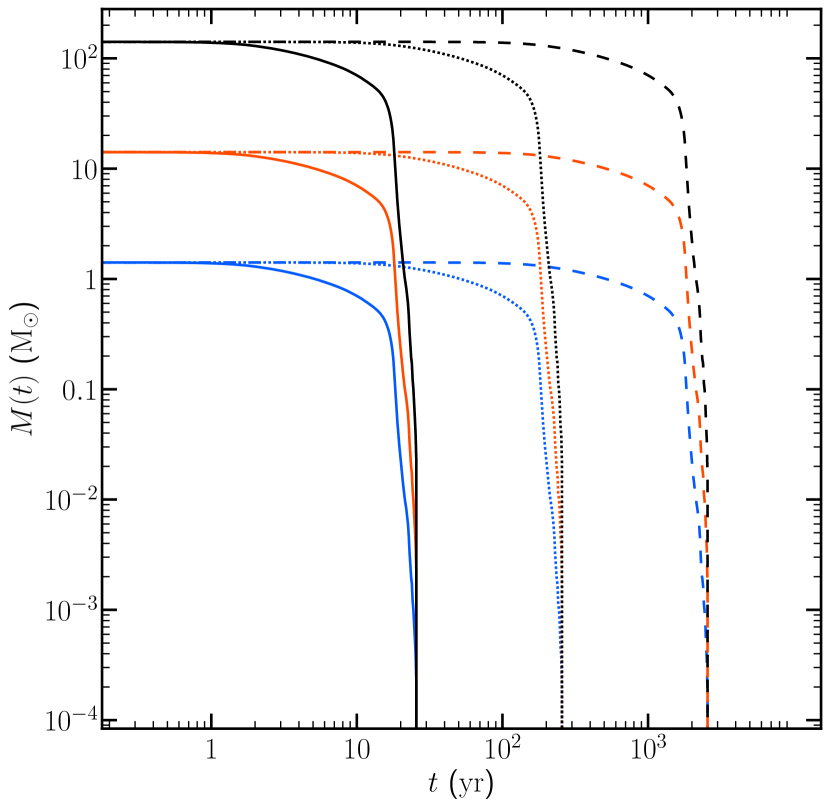
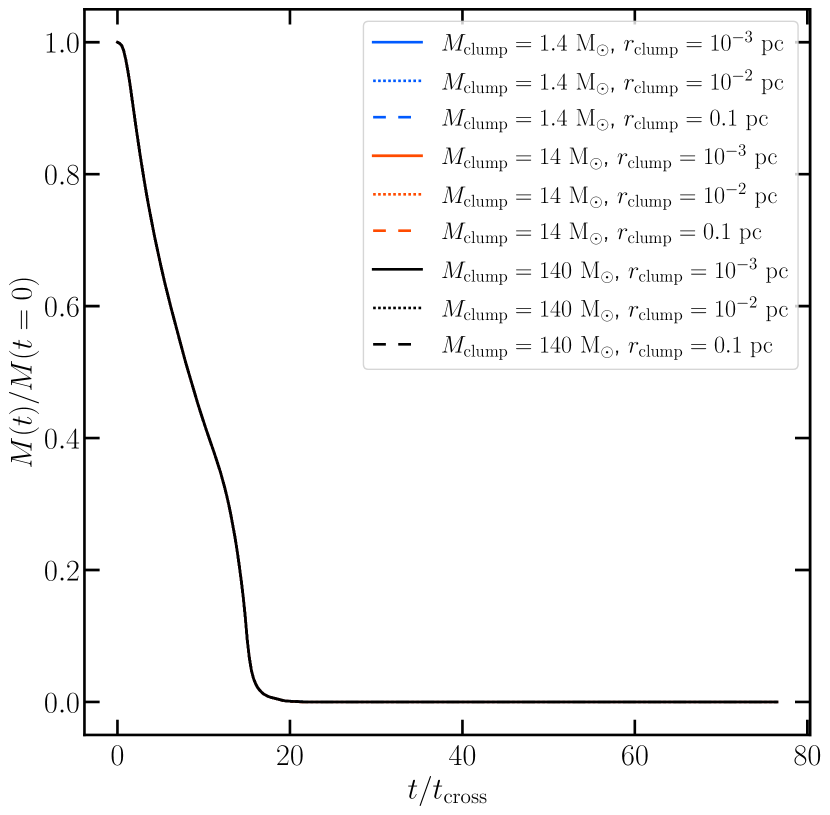
In order to show that each clump is destroyed immediately by the infalling satellite gas, we performed the following three-dimensional hydrodynamic simulations. At the outer edge of a torus, clumps have low temperatures () \citeprepenalty[ref.\@nociteRadovich1999\@make@cite@list\@restore@auxhandle]\@restore@auxhandle. At from the central black hole, such a clump would have a density of – and a mass of several to tens \citeprepenalty[ref.\@nociteKawaguchiMori2011\@make@cite@list\@restore@auxhandle]\@restore@auxhandle. The simulations were carried out using the HLLC scheme with MUSCL interpolation and periodic boundary conditions. The time evolution of a clump exposed to a fast gas flow ( grid points for box) is shown in Extended Data Figure 8. The clump initially has a uniform density of with a temperature of , and the ambient flow has a density, a temperature and a velocity of , and , respectively. Within a timescale much shorter than that of the torus destruction (Fig. 1), a clump is deformed and expands to much lower densities. For a variety of clump parameters in grid points simulations, we find that the time evolution of gas stripping from a clump is extensively similar (Extended Data Figure 9). In about 10 times the flow crossing timescale, a clump loses about half of its initial mass (Extended Data Figure 10).
0.7 Estimation of the torus mass.
We estimate the torus mass following Nenkova et al.[31] under the assumption of a sharp-edge angular distribution of clumps; the torus mass is expressed as
| (10) | ||||
| (11) |
where is the hydrogen mass, is the average number of clumps along a radial equatorial ray, is the angular width parameter, is the inner radius, is the power-law index of the radial distribution of clumps () and . The column-density of a single clump is expressed as , where and , where is the optical depth of individual clumps[34, 35].
0.8 Estimation of the stellar mass of AGN host galaxies.
0.9 Estimation of the gas column-density of the infalling satellite.
Observations show that the radial profiles of the neutral gas (atomic hydrogen, molecular hydrogen and helium) in nearby disc galaxies are universal[42, 43]:
| (12) |
where is the gas surface-density at the transition radius[44] (where HI and H2 column-densities are equal), and is the radius of the -band isophote. Under the assumption of a constant density profile in the vertical direction with thickness ,
| (13) |
the column-density along a line passing and , inclined from the rotation axis of the disc by , is
| (14) |
The key parameter to determine the column-density is the aspect ratio and we assume for simplicity.
0.10 Orbital parameters of the satellite galaxies in the Milky Way.
We performed a series of test-particle simulations in a fixed potential-field of the Milky Way to estimate the pericentric distance and the orbital period of Milky Way satellites. The location and velocity of the satellites which include classical dwarfs and ultra-faint dwarfs are taken from recent observations[45, 46, 47, 48, 49, 50, 51] and the NASA/IPAC Extragalactic Database (NED). The number of test-particles per satellite was . We assumed that Sgr A* was the fixed Galactic centre by neglecting the gravitational Brownian motion of Sgr A*. The location of Sgr A* is \citeprepenalty[ref.\@nociteBland-HawthornGerhard2016\@make@cite@list\@restore@auxhandle]\@restore@auxhandle and the distance to Sgr A*, , is \citeprepenalty[ref.\@nociteGravity2020\@make@cite@list\@restore@auxhandle]\@restore@auxhandle. The proper motion of Sgr A* is \citeprepenalty[ref.\@nociteReidBrunthaler2004\@make@cite@list\@restore@auxhandle]\@restore@auxhandle and the line-of-sight velocity of Sgr A* is \citeprepenalty[ref.\@nociteReid2009\@make@cite@list\@restore@auxhandle]\@restore@auxhandle. The potential-field of the Milky Way model[56] (composed of an NFW halo[57, 58], a McMillan bulge[59], two exponential discs representing the thin and thick stellar discs, two exponential discs with a central hole[60] representing the HI and H2 discs and the circumgalactic medium described in a single-power-law model) is generated by an updated version of the MAGI[61] code.
Orbit integration backwards in time over the cosmic age was performed using the fourth-order Hermite scheme with adaptive time steps to resolve highly-eccentric orbits. Figure 4 and Extended Data Figure 7 summarise the results of the test-particle simulations (median values with and percentile for the confidence level). Since the estimation of the orbital parameters of test-particles unbound or having longer orbital-period than the integration time () is impossible, a subset of satellites suffers from poor statistics: Leo I, Phoenix dwarf, Eridanus II, Leo IV, Leo V, Hydra II, Pisces II and Grus I. We exclude these satellites with an unreliable estimation of the orbital parameters from the figure and table.
0.11 Estimation of the tidal-stripping radius of satellite galaxies.
We estimate the tidal-stripping radius of satellite galaxies due to tidal stripping by solving the force balance between the self-gravity of the satellite and the tearing force by the central galaxy (half of the tidal force). The mass model of the central galaxy is the spherical-averaged Milky Way model exploited in the previous section. We assume an NFW sphere as a satellite galaxy and set the concentration parameter using the relation[62] as a function of the satellite mass . Assuming 95% of the initial mass of the satellite is tidally stripped, the tidal-stripping radius must satisfy the following equation,
| (15) |
where is the radius within which 5% of the satellite mass is contained. Solving this equation numerically, the resultant radius is for satellite mass of , respectively. Vertical lines in Figure 4 indicate the tidal-stripping radius, and they locate near the lower bound for the pericentres of the current orbiting satellites.
Data availability
The data that support the findings of this study are available from the corresponding author upon reasonable request, although the requester will be responsible for providing the very considerable resources needed for transferring and storing these data.
Code availability
The parent code MAGI has been publicly available at https://bitbucket.org/ymiki/magi. It is expected that most of the extensions and modifications made to meet the specific requirements for this project will be made available in the future release; those interested can contact the corresponding author for further information.
References
- [1]
- [2] Beckert, T. & Duschl, W. J. The dynamical state of a thick cloudy torus around an AGN. A&A 426, 445–454 (2004).
- [3] Di Matteo, T., Springel, V. & Hernquist, L. Energy input from quasars regulates the growth and activity of black holes and their host galaxies. Nature 433, 604–607 (2005).
- [4] Gabor, J. M. & Bournaud, F. Active galactic nuclei-driven outflows without immediate quenching in simulations of high-redshift disc galaxies. MNRAS 441, 1615–1627 (2014).
- [5] Athanassoula, E., Lambert, J. C. & Dehnen, W. Can bars be destroyed by a central mass concentration?— I. Simulations. Monthly Notices of the Royal Astronomical Society 363, 496–508 (2005).
- [6] Hopkins, P. F. & Quataert, E. How do massive black holes get their gas? MNRAS 407, 1529–1564 (2010).
- [7] Angles-Alcazar, D. et al. Cosmological simulations of quasar fueling to sub-parsec scales using Lagrangian hyper-refinement. arXiv e-prints arXiv:2008.12303 (2020).
- [8] Geehan, J. J., Fardal, M. A., Babul, A. & Guhathakurta, P. Investigating the Andromeda stream - I. Simple analytic bulge-disc-halo model for M31. MNRAS 366, 996–1011 (2006).
- [9] Tomisaka, K. & Ikeuchi, S. Starburst nucleus - Galactic-scale bipolar flow. ApJ 330, 695–717 (1988).
- [10] Okada, R., Fukue, J. & Matsumoto, R. A model of astrophysical tori with magnetic fields. PASJ 41, 133–140 (1989).
- [11] Fukue, J. & Sanbuichi, K. Model of obscuring molecular tori in Seyfert nuclei. PASJ 45, 135–138 (1993).
- [12] Bulbul, G. E., Hasler, N., Bonamente, M. & Joy, M. An Analytic Model of the Physical Properties of Galaxy Clusters. ApJ 720, 1038–1044 (2010).
- [13] Hönig, S. F., Beckert, T., Ohnaka, K. & Weigelt, G. Radiative transfer modeling of three-dimensional clumpy AGN tori and its application to NGC 1068. A&A 452, 459–471 (2006).
- [14] Krolik, J. H. & Begelman, M. C. Molecular tori in Seyfert galaxies - Feeding the monster and hiding it. ApJ 329, 702–711 (1988).
- [15] Mor, R., Netzer, H. & Elitzur, M. Dusty Structure Around Type-I Active Galactic Nuclei: Clumpy Torus Narrow-line Region and Near-nucleus Hot Dust. ApJ 705, 298–313 (2009).
- [16] Schartmann, M., Meisenheimer, K., Camenzind, M., Wolf, S. & Henning, T. Towards a physical model of dust tori in Active Galactic Nuclei. Radiative transfer calculations for a hydrostatic torus model. A&A 437, 861–881 (2005).
- [17] Mateo, M. L. Dwarf Galaxies of the Local Group. ARA&A 36, 435–506 (1998).
- [18] Conselice, C. J., O’Neil, K., Gallagher, J. S. & Wyse, R. F. G. Galaxy Populations and Evolution in Clusters. IV. Deep H I Observations of Dwarf Elliptical Galaxies in the Virgo Cluster. ApJ 591, 167–184 (2003).
- [19] Thuan, T. X., Goehring, K. M., Hibbard, J. E., Izotov, Y. I. & Hunt, L. K. The H I content of extremely metal-deficient blue compact dwarf galaxies. MNRAS 463, 4268–4286 (2016).
- [20] Toro, E. F., Spruce, M. & Speares, W. Restoration of the contact surface in the HLL-Riemann solver. Shock Waves 4, 25–34 (1994).
- [21] Batten, P., Clarke, N., Lambert, C. & Causon, D. On the choice of wavespeeds for the hllc riemann solver. SIAM Journal on Scientific Computing 18, 1553–1570 (1997).
- [22] Schmitt, H. R. et al. Testing the Unified Model with an Infrared-selected Sample of Seyfert Galaxies. ApJ 555, 663–672 (2001).
- [23] Mori, M. & Burkert, A. Gas Stripping of Dwarf Galaxies in Clusters of Galaxies. ApJ 538, 559–568 (2000).
- [24] Fillingham, S. P. et al. Under pressure: quenching star formation in low-mass satellite galaxies via stripping. MNRAS 463, 1916–1928 (2016).
- [25] Burtscher, L. et al. A diversity of dusty AGN tori. Data release for the VLTI/MIDI AGN Large Program and first results for 23 galaxies. A&A 558, A149 (2013).
- [26] Kishimoto, M. et al. Mapping the radial structure of AGN tori. A&A 536, A78 (2011).
- [27] Packham, C. et al. The Extended Mid-Infrared Structure of the Circinus Galaxy. ApJ 618, L17–L20 (2005).
- [28] Hagiwara, Y., Miyoshi, M., Doi, A. & Horiuchi, S. Submillimeter H2O Maser in Circinus Galaxy—a New Probe for the Circumnuclear Region of Active Galactic Nuclei. ApJ 768, L38 (2013).
- [29] Marinucci, A., Miniutti, G., Bianchi, S., Matt, G. & Risaliti, G. A Chandra view of the clumpy reflector at the heart of the Circinus galaxy. MNRAS 436, 2500–2504 (2013).
- [30] Izumi, T., Wada, K., Fukushige, R., Hamamura, S. & Kohno, K. Circumnuclear Multiphase Gas in the Circinus Galaxy. II. The Molecular and Atomic Obscuring Structures Revealed with ALMA. ApJ 867, 48 (2018).
- [31] Nenkova, M., Sirocky, M. M., Nikutta, R., Ivezić, Ž. & Elitzur, M. AGN Dusty Tori. II. Observational Implications of Clumpiness. ApJ 685, 160–180 (2008).
- [32] Radovich, M., Klaas, U., Acosta-Pulido, J. & Lemke, D. The 10-200 MU M spectral energy distribution of the prototype narrow-line X-ray galaxy NGC 7582. A&A 348, 705–710 (1999).
- [33] Kawaguchi, T. & Mori, M. Near-infrared Reverberation by Dusty Clumpy Tori in Active Galactic Nuclei. ApJ 737, 105 (2011).
- [34] Bohlin, R. C., Savage, B. D. & Drake, J. F. A survey of interstellar H I from Lalpha absorption measurements. II. ApJ 224, 132–142 (1978).
- [35] Rieke, G. H. & Lebofsky, M. J. The interstellar extinction law from 1 to 13 microns. ApJ 288, 618–621 (1985).
- [36] Ichikawa, K. et al. The Differences in the Torus Geometry between Hidden and Non-hidden Broad Line Active Galactic Nuclei. ApJ 803, 57 (2015).
- [37] Fuller, L. et al. Investigating the dusty torus of Seyfert galaxies using SOFIA/FORCAST photometry. MNRAS 462, 2618–2630 (2016).
- [38] García-Bernete, I. et al. Torus model properties of an ultra-hard X-ray selected sample of Seyfert galaxies. MNRAS 486, 4917–4935 (2019).
- [39] Veilleux, S. et al. A Deep Hubble Space Telescope H-Band Imaging Survey of Massive Gas-Rich Mergers. II. The QUEST QSOs. ApJ 701, 587–606 (2009).
- [40] Skrutskie, M. F. et al. The Two Micron All Sky Survey (2MASS). AJ 131, 1163–1183 (2006).
- [41] Rettura, A. et al. Comparing dynamical and photometric-stellar masses of early-type galaxies at z ~1. A&A 458, 717–726 (2006).
- [42] Bigiel, F. & Blitz, L. A Universal Neutral Gas Profile for nearby Disk Galaxies. ApJ 756, 183 (2012).
- [43] Wang, J. et al. An observational and theoretical view of the radial distribution of H I gas in galaxies. MNRAS 441, 2159–2172 (2014).
- [44] Leroy, A. K. et al. The Star Formation Efficiency in Nearby Galaxies: Measuring Where Gas Forms Stars Effectively. AJ 136, 2782–2845 (2008).
- [45] Gaia Collaboration et al. Gaia Data Release 2. Kinematics of globular clusters and dwarf galaxies around the Milky Way. A&A 616, A12 (2018).
- [46] Fritz, T. K. et al. Gaia DR2 proper motions of dwarf galaxies within 420 kpc. Orbits, Milky Way mass, tidal influences, planar alignments, and group infall. A&A 619, A103 (2018).
- [47] McConnachie, A. W. The Observed Properties of Dwarf Galaxies in and around the Local Group. AJ 144, 4 (2012).
- [48] Torrealba, G. et al. Discovery of two neighbouring satellites in the Carina constellation with MagLiteS. MNRAS 475, 5085–5097 (2018).
- [49] Torrealba, G., Koposov, S. E., Belokurov, V. & Irwin, M. The feeble giant. Discovery of a large and diffuse Milky Way dwarf galaxy in the constellation of Crater. MNRAS 459, 2370–2378 (2016).
- [50] Longeard, N. et al. Pristine dwarf galaxy survey - I. A detailed photometric and spectroscopic study of the very metal-poor Draco II satellite. MNRAS 480, 2609–2627 (2018).
- [51] Koposov, S. E. et al. Snake in the Clouds: a new nearby dwarf galaxy in the Magellanic bridge*. MNRAS 479, 5343–5361 (2018).
- [52] Bland-Hawthorn, J. & Gerhard, O. The Galaxy in Context: Structural, Kinematic, and Integrated Properties. ARA&A 54, 529–596 (2016).
- [53] Gravity Collaboration et al. Detection of the Schwarzschild precession in the orbit of the star S2 near the Galactic centre massive black hole. A&A 636, L5 (2020).
- [54] Reid, M. J. & Brunthaler, A. The Proper Motion of Sagittarius A*. II. The Mass of Sagittarius A*. ApJ 616, 872–884 (2004).
- [55] Reid, M. J. et al. Trigonometric Parallaxes of Massive Star-Forming Regions. VI. Galactic Structure, Fundamental Parameters, and Noncircular Motions. ApJ 700, 137–148 (2009).
- [56] Cautun, M. et al. The milky way total mass profile as inferred from Gaia DR2. MNRAS 494, 4291–4313 (2020).
- [57] Navarro, J. F., Frenk, C. S. & White, S. D. M. Simulations of X-ray clusters. MNRAS 275, 720–740 (1995).
- [58] Navarro, J. F., Frenk, C. S. & White, S. D. M. The Structure of Cold Dark Matter Halos. ApJ 462, 563 (1996).
- [59] McMillan, P. J. The mass distribution and gravitational potential of the Milky Way. MNRAS 465, 76–94 (2017).
- [60] Kalberla, P. M. W. & Dedes, L. Global properties of the H I distribution in the outer Milky Way. Planar and extra-planar gas. A&A 487, 951–963 (2008).
- [61] Miki, Y. & Umemura, M. MAGI: many-component galaxy initializer. MNRAS 475, 2269–2281 (2018).
- [62] Ishiyama, T. & Ando, S. The abundance and structure of subhaloes near the free streaming scale and their impact on indirect dark matter searches. MNRAS 492, 3662–3671 (2020).