Disk–jet coupling changes as a possible indicator for outbursts from GX 3394 remaining within the X-ray hard state
Abstract
We present quasi-simultaneous radio, (sub-)millimetre, and X-ray observations of the Galactic black hole X-ray binary GX 3394, taken during its 2017–2018 outburst, where the source remained in the hard X-ray spectral state. During this outburst, GX 3394 showed no atypical X-ray behaviour that may act as a indicator for an outburst remaining within the hard state. However, quasi-simultaneous radio and X-ray observations showed a flatter than expected coupling between the radio and X-ray luminosities (with a best fit relation of ), when compared to successful outbursts from this system (). While our 2017–2018 outburst data only span a limited radio and X-ray luminosity range (1 order of magnitude in both, where more than 2-orders of magnitude in is desired), including data from other hard-only outbursts from GX 3394 extends the luminosity range to 1.2 and 2.8 orders of magnitude, respectively, and also results in a flatter correlation (where ). This result is suggestive that for GX 3394 a flatter radio – X-ray correlation, implying a more inefficient coupling between the jet and accretion flow, could act as an indicator for a hard-only outburst. However, further monitoring of both successful and hard-only outbursts over larger luminosity ranges with strictly simultaneous radio and X-ray observations is required from different, single sources, to explore if this applies generally to the population of black hole X-ray binaries, or even GX 3394 at higher hard-state luminosities.
keywords:
accretion, accretion disks – black hole physics – stars: individual: GX 3394, outflows – X-rays: binaries.1 Introduction
Black hole (BH) low-mass X-ray binaries (LMXBs) are systems where material from a low-mass () donor star is transferred to a stellar-mass black hole via Roche lobe overflow. The infalling matter forms a differentially rotating accretion disk (e.g., Pringle et al., 1973) and material is partially accreted onto the BH, while the remaining fraction may be ejected from the system via outflows in the form of relativistic jets (e.g., Mirabel et al., 1992; Fender, 2001) or disk winds (e.g., Ponti et al., 2012; Díaz Trigo & Boirin, 2016). LMXBs are ideal objects for studying accretion and jet physics as they evolve on observable (month-year) time scales, providing a time-resolved view of their evolution through their outburst duty cycles (which, are phases of increased accretion onto the BH) and the connection between the inflow and outflow as they evolve (e.g., Fender, 2010). These objects also allow us to observe their interaction with their surroundings (e.g., Corbel & Fender 2002; Corbel et al. 2004; Gallo et al. 2005; Mirabel et al. 2011; Justham & Schawinski 2012; Rushton et al. 2017; Tetarenko et al. 2018; Russell et al. 2019b; Bright et al. 2020; Tetarenko et al. 2020).
BH LMXBs emit across the electromagnetic spectrum, where the near-Infrared (IR) and optical to X-ray radiation typically originates from the in-flowing material (often with some contribution from the companion star or disk winds), while the radio, millimetre (mm) and far-infrared emission is generally radiated by the jet (e.g., Fender, 2001; Russell et al., 2013, 2014; Tetarenko et al., 2015). These objects spend the majority of their lifetimes in a low-luminosity quiescent state (with X-ray luminosities of ; Plotkin et al. 2013). However, they may go through episodic phases of outburst that typically last months to a year, during which their luminosities can increase by orders of magnitude due to an increase in the mass-accretion rate onto the BH (see, e.g., McClintock & Remillard, 2006; Tetarenko et al., 2016; Corral-Santana et al., 2016).
During quiescence and the early rise phase of an outburst, the system is typically in the hard accretion state. In this state, the observed X-ray spectrum is dominated by a power-law component, thought to arise from inverse Compton emission originating in a geometrically-thick, optically-thin, radiatively inefficient accretion flow (RIAF; e.g., Narayan & Yi, 1995; Esin et al., 1997), or possibly the base of the jet (e.g., Markoff et al., 2005; Maitra et al., 2009; Connors et al., 2019; Lucchini et al., 2019). The quiescent and hard state are associated with a steady, partially self-absorbed compact jet (e.g., Fender et al., 2004) exhibiting a flat-to-inverted radio to (sub-)mm spectrum (e.g., Dhawan et al. 2000; Corbel et al. 2000; Fender 2001; Russell et al. 2014, Russell et al. 2015; Tetarenko et al. 2015, Plotkin et al. 2017; Dinçer et al. 2018), which can extend up to and beyond the IR band (e.g., Russell et al., 2013). For such a spectrum, the radio flux density is proportional to the frequency such that , where the spectral index (e.g., Fender, 2006).
As a typical outburst progresses, it is generally thought that material that has built in the outer disk up over time reaches a critical point, following which, material can then flow in towards the BH, causing the source to source brighten (e.g., Lasota, 2001). During this phase, the X-ray spectrum progressively softens as the X-ray emission becomes increasingly dominated by a multi-temperature blackbody component from the hot inner regions of an optically-thick, geometrically-thin accretion disk. As a consequence, the system may enter and transit through the hard intermediate and soft intermediate X-ray states (HIMS and SIMS, respectively; e.g., Remillard & McClintock 2006; Belloni 2010), entering the full soft state as the disk completely dominates the observed X-ray emission. At some point during this progression, the compact jet emission is strongly quenched (by 3.5 orders of magnitude; Russell et al. 2019b) and discrete ejecta may be launched in a transient jet (e.g., Mirabel & Rodríguez, 1994; Hjellming & Rupen, 1995; Fender, 2006). These transient jet ejecta are thought to be composed of steep spectrum () discrete, synchrotron emitting plasma that are propagating away from the BH at relativistic speeds (e.g., Tingay et al., 1995; Fender et al., 2009; Tetarenko et al., 2017) and typically manifest as rapid flaring activity in time-resolved light curves.
Following the spectral transition, the luminosity drops as the mass accretion rate onto the compact object reduces and the outburst fades. As the source decays it transits back through the intermediate states to the hard state in a reverse transition (e.g., Narayan et al., 1996; Hameury et al., 1997). During this progression, the compact jet switches back on progressively (over a period of a few weeks; e.g., Miller-Jones et al. 2012; Kalemci et al. 2013; Corbel et al. 2013b; Russell et al. 2014).
However, not all outbursts follow this typical “successful” progression. Instead, outbursts can exhibit multiple peaks, re-brightenings, or glitches (e.g., Chen et al., 1997), during which the connection to the jet is not well understood (e.g., Parikh et al., 2019). Some outbursts fail to enter the soft state, such that the source remains in the hard X-ray spectral state (e.g., Harmon et al., 1994; Hynes et al., 2000; Brocksopp et al., 2001, 2004; Brocksopp et al., 2010; Belloni et al., 2002; Aref’ev et al., 2004; Sturner & Shrader, 2005; Sidoli et al., 2011; Curran & Chaty, 2013) or only progresses as far as the intermediate states during the outburst (e.g., in’t Zand et al., 2002; Wijnands & Miller, 2002; Capitanio et al., 2009; Ferrigno et al., 2012; Reis et al., 2012; Soleri et al., 2013; Zhou et al., 2013; Curran et al., 2014). These outbursts are generally referred to as “hard-only” outbursts and it is not well understood why some outbursts do not progress to a soft state. One possible explanation is that hard-only outbursts are a result of less disk material being able to flow into the inner regions of the accretion disk, such that a full outburst cannot be sustained. As would be implied by such a scenario, hard-only outbursts are typically fainter on-average than successful outbursts (Tetarenko et al., 2016), indicating lower peak accretion rates. Additionally, hard-only outbursts are shorter in duration, lasting on average 247 days compared to 391 days for successful outbursts (Tetarenko et al., 2016).
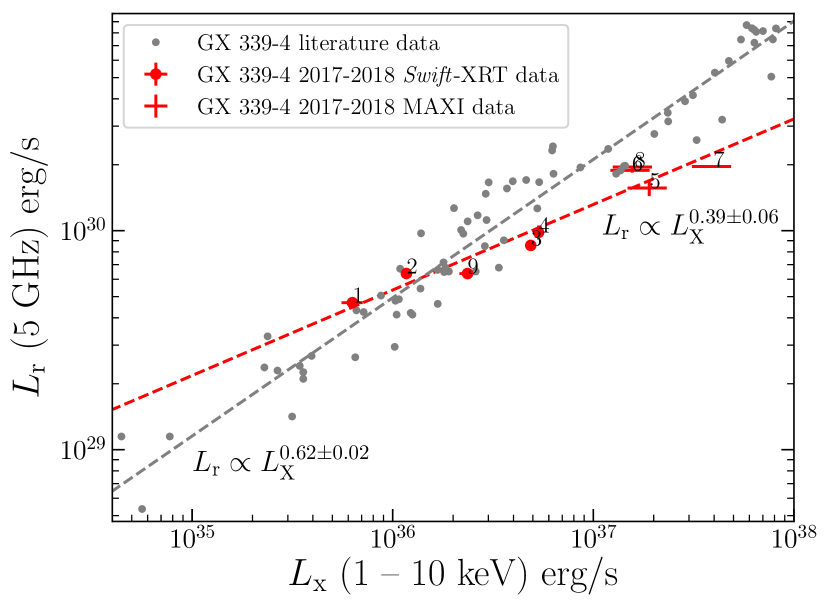
In the hard states of BH LMXB outbursts, there is an observed correlation between the radio luminosity () and X-ray luminosity (). This correlation holds over a few orders of magnitude in luminosity, and can be used to investigate the disk–jet coupling (e.g., Hannikainen et al., 1998; Corbel et al., 2000; Corbel et al., 2003, 2013a; Gallo et al., 2003, 2012; Gallo et al., 2018). The observed correlation is non-linear and typically divided by two separate tracks, the upper ‘standard’ track and a lower, shallower one, although the statistical significance of the need for two different tracks is debated (Gallo et al., 2014; Gallo et al., 2018). It has also been suggested that the difference between the two slopes may be related to the observed jet emission (e.g., Casella & Pe’er, 2009; Coriat et al., 2011; Meyer-Hofmeister & Meyer, 2014; Espinasse & Fender, 2018). According to Gallo et al. (2012), for the full sample of standard track BH LMXBs, the radio luminosity correlates with X-ray luminosity as . Using only data from GX 3394 over multiple outbursts (including both successful and hard-only outbursts), Corbel et al. (2013a) reported a relation of . However, Corbel et al. (2013a) show that over limited X-ray luminosity ranges (2 orders of magnitude) individual outbursts can show significant deviation from the source’s typical correlation.
In this paper we present X-ray, radio and (sub-)mm monitoring of the Galactic BH LMXB GX 3394 during its 2017–2018 hard-only outburst. In Section 2 we describe the observational setup and data used. Section 3 presents the results from the radio, (sub-)mm, and X-ray monitoring. In Section 4, we discuss and compare the results: exploring the X-ray spectral evolution, in particular the source hardness and X-ray photon index (), as well as the behaviour of the radio jet. We also attempt to physically explain the observed evolution of this outburst. Finally, we compare our results to other outbursts of GX 3394, both hard-only and successful, searching for any X-ray or radio signatures that may act as indicators for an outburst only remaining in the hard or intermediate states and not progressing into the soft state. Conclusions are provided in Section 5. All radio, (sub-)mm and X-ray results are presented throughout the paper, and in the Appendices.
1.1 GX 3394
GX 3394 is a LMXB with a BH primary (e.g., Hynes et al., 2003), that has a mass of (Heida et al., 2017). This system exhibits a 1.76 day orbital period and has a K-type companion star. The distance to the source is still a matter of debate, with estimates ranging from 5–12 kpc (e.g., Zdziarski et al., 2004, 2019; Heida et al., 2017). GX 3394 was first discovered by the Massachusetts Institute of Technology (MIT) X-ray detector on the Orbiting Solar Observatory 7 satellite in 1972, and was first detected in the radio band in 1994 by the Molonglo Observatory Synthesis Telescope at 843 MHz (Sood & Campbell-Wilson, 1994). Undergoing numerous successful and hard-only outbursts over the past few decades (so far 41% from a total of 22 detected outbursts have been identified as hard-only; Tetarenko et al., 2016), GX 3394 is one of the best studied BH LMXBs (e.g., Zdziarski et al., 2004; Buxton et al., 2012), particularly at both radio and X-ray wavelengths (e.g., Corbel et al., 2013a). Therefore, it is an ideal candidate to probe the disk–jet connection and identify accretion or jet signatures that may indicate whether an outburst will complete a full, successful outburst or not.
| Date | MJD | ObsID | Count rate | Normalisation | Unabsorbed flux | Hardness | |
|---|---|---|---|---|---|---|---|
| (0.5 – 10 keV) | (1.5 – 10 keV / | ||||||
| erg s-1 cm-2 | 0.5 – 1.5 keV) | ||||||
| 2017–09–29 | 58025 | 00032898146 | 1.20 0.09 | 1.73 0.15 | 0.012 0.002 | 0.73 0.06 | 2.61 |
| 2017–10–01 | 58027 | 00032898148 | 1.45 0.09 | 1.20 0.09 | 0.010 0.001 | 1.1 0.1 | 6.12 |
| 2017–10–03 | 58029 | 00032898149 | 1.15 0.11 | 1.52 0.14 | 0.018 0.002 | 1.4 0.1 | 3.64 |
| 2017–10–05 | 58031 | 00032898150 | 2.53 0.10 | 1.18 0.08 | 0.014 0.001 | 1.64 0.08 | 6.30 |
| 2017–10–07 | 58033 | 00032898151 | 4.24 0.22 | 1.24 0.09 | 0.026 0.003 | 2.85 0.19 | 5.74 |
| 2017–10–09 | 58035 | 00032898152 | 5.97 0.25 | 1.23 0.06 | 0.039 0.003 | 4.3 0.2 | 5.82 |
| 2017–10–17 | 58043 | 00032898153 | 10.71 0.54 | 1.26 0.08 | 0.062 0.005 | 6.6 0.4 | 5.54 |
| 2017–10–20 | 58046 | 00032898154 | 11.28 0.48 | 1.30 0.06 | 0.084 0.006 | 8.45 0.35 | 5.18 |
| 2017–10–23 | 58049 | 00032898155 | 14.88 0.15 | 1.58 0.02 | 0.130 0.003 | 9.4 0.1 | 3.31 |
| 2017–10–25 | 58051 | 00032898158 | 15.76 0.17 | 1.54 0.03 | 0.097 0.003 | 7.3 0.1 | 3.50 |
| 2017–11–01 | 58058 | 00032898160 | 12.00 0.14 | 1.45 0.03 | 0.094 0.003 | 7.8 0.1 | 4.05 |
| 2018–01–20 | 58138 | 00032898161 | 5.93 0.21 | 1.38 0.06 | 0.041 0.003 | 3.8 0.2 | 4.53 |
| 2018–01–25 | 58143 | 00032898162 | 3.84 0.14 | 1.33 0.09 | 0.029 0.003 | 1.33 0.09 | 4.94 |
| 2018–01–30 | 58148 | 00032898163 | 2.23 0.10 | 1.23 0.07 | 0.015 0.001 | 1.60 0.08 | 5.75 |
| 2018–02–04 | 58153 | 00032898164 | 1.32 0.10 | 1.14 0.12 | 0.007 0.001 | 0.90 0.08 | 6.73 |
| 2018–02–07 | 58156 | 00032898165 | 1.47 0.08 | 1.27 0.09 | 0.007 0.001 | 0.69 0.05 | 5.40 |
| 2018–02–09 | 58158 | 00032898166 | 1.11 0.08 | 1.34 0.1 | 0.008 0.001 | 0.72 0.05 | 4.87 |
| 2018–02–14 | 58163 | 00032898167 | 0.61 0.04 | 1.52 0.1 | 0.0047 0.0004 | 0.36 0.02 | 3.62 |
| 2018–02–27 | 58176 | 00032898170 | 0.28 0.02 | 1.60 0.15 | 0.0024 0.0003 | 0.17 0.01 | 3.21 |
2 Observations and analysis methods
2.1 X-ray analysis
2.1.1 Swift-XRT
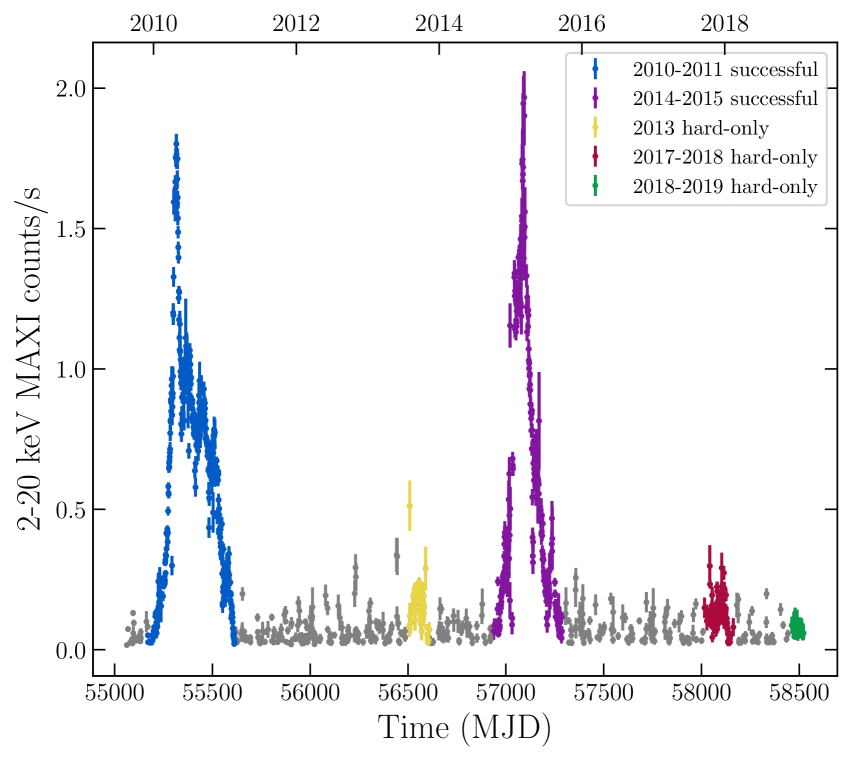
X-ray observations of GX 3394 were taken by the Neil Gehrels Swift Observatory X-ray telescope (XRT) throughout its 2017–2018 hard-only outburst. We used the Swift-XRT online pipeline111https://www.swift.ac.uk/user_objects/ (Evans et al., 2009) to retrieve pile-up corrected spectral data. To compare behaviours between hard-only events of GX 3394, we also downloaded observations taken during its 2013 hard-only outburst and 2018–2019 hard-only flare. We note that following this flaring event, while the source faded to almost quiescence, it did not completely return to quiescence before re-brightening in late-2019, going into a full outburst in 2019–2020 (Rao et al., 2019; Paice et al., 2020). Hence, we refer to the 2018–2019 hard-only event as a flare as opposed to a full outburst. For the 2017–2018 outburst, all Swift-XRT data were obtained in photon counting (PC) mode. While data from the 2013 hard-only outburst and 2018–2019 hard-only flare were mostly obtained in the PC mode, some observations were taken in Swift-XRT’s windowed timing (WT) mode.
Since the focus of this work is the 2017–2018 outburst, only the epochs of this outburst will be discussed in detail, but we show all X-ray data and fitting parameters in the Appendix. The 2017–2018 Swift-XRT data of this outburst consisted of 19 observations taken between 2017–09–29 (MJD 58025) and 2018–02–27 (MJD 58176), see Table 1. However, from the beginning of November 2017 until mid-January 2018, constraints due to the proximity of the Sun prevented Swift-XRT from obtaining data of GX 3394.
The data were analysed using xspec (version 12.8; Arnaud 1996) from heasoft software package (version 6.21). The 0.5–10 keV X-ray spectra were modelled with an absorbed power-law (tbabspowerlaw) within xspec. The tbabs model component, making use of abundances from Wilms et al. 2000, and photoionization cross-sections from Verner et al. 1996, was used to account for interstellar absorption. Tying the line of sight equivalent hydrogen absorption, , across all epochs provided = cm-2. We also compared all results with either fixed to literature values ( cm-2; Fürst et al. 2015), or left free (untied) for all epochs, finding our conclusions were not altered by the method that was used.
X-ray fluxes were determined using the convolution model cflux within xspec. The X-ray fluxes were measured for four different energy bands, namely 1–10 keV, 0.5–10 keV, 0.5–1.5 keV and 1.5–10 keV.
2.1.2 MAXI
The Monitor of All-sky X-ray Image (MAXI) X-ray telescope (Matsuoka et al., 2009) count rates (Figure 1) were obtained from the MAXI website222http://maxi.riken.jp/top/index.html. During times when Swift-XRT was sun constrained but radio observations were taken (MJDs 58080, 58090, 58103 and 58123), we used the MAXI count rates to estimate the X-ray flux and luminosity (using WebPIMMS333https://heasarc.gsfc.nasa.gov/cgi-bin/Tools/w3pimms/w3pimms.pl). To do this, we used the found from our Swift-XRT analysis ( cm-2), and assumed to be 1.5 – 2.5, conservatively estimating the 1–10 keV X-ray flux from the 2 – 20 keV MAXI count rate (Table 2). We do note that the unknown values of may make these fluxes unreliable, however, the range taken for provides a conservative estimate when taking into account the lack of dramatic changes to the X-ray count rate over this time (Figure 2) and the minimal variation of during other hard-only outbursts from this source (during the brighter phase of the outburst, see Section 4.2.1).
| Date | MJD | Count rate | Flux | Luminosity |
|---|---|---|---|---|
| (2–20 keV) | (1–10 keV) | (1–10 keV) | ||
| counts s-1 | ||||
| erg s-1 cm-2 | erg s-1 | |||
| 2017–11–23 | 58080 | 0.169 0.031 | 24.8 5.5 | 1.90 0.42 |
| 2017–12–03 | 58090 | 0.139 0.048 | 20.4 4.5 | 1.56 0.35 |
| 2017–12–16 | 58103 | 0.353 0.052 | 52.0 11.5 | 3.98 0.88 |
| 2019–01–05 | 58123 | 0.142 0.016 | 21.0 4.6 | 1.61 0.35 |
2.2 ATCA radio data
During the 2017–2018 outburst, GX 3394 was observed 9 times with the Australia Telescope Compact Array (ATCA; PI: Russell, project code: C3057). Observations were carried out at central frequencies of 5.5 and 9 GHz on all dates and additionally at 17 and 19 GHz on 5 dates, see Table 3. Each frequency pair (5.5 / 9 GHz or 17 / 19 GHz) was recorded simultaneously, with a bandwidth of 2 GHz at each frequency band, which was comprised of 2048 channels of width 1 MHz. Observations had 10 second integration times. PKS 1934–638 was used for primary flux and bandpass calibration, while the nearby source PKS 1646–50 was used for phase calibration. Data calibration was carried out following standard procedures from the Common Astronomy Software Application (casa, version 4.7.1; McMullin et al. 2007444https://casaguides.nrao.edu/index.php?title=Main_Page). Each frequency band was imaged with natural weighting to maximize sensitivity. The signal to noise ratio was not high enough for reliable self-calibration. To determine the radio flux density, , of the source for each epoch, we fit for a point source in the image plane, where we use a Gaussian with a full width half maximum (FWHM) equal to the synthesised beam of the observation. Errors on the absolute flux density scale include systematic uncertainties of 2% for the 5.5/9 GHz data555https://www.narrabri.atnf.csiro.au/observing/users_guide/html_old_20090512/Flux_Scale_AT_Compact_Array.html (e.g.,
Massardi et al. 2011; McConnell et al. 2012) and 4% for the 17/19 GHz data (see, e.g., Murphy et al., 2010; Partridge et al., 2016). All radio flux densities are reported in Table 3.
The radio luminosity () was calculated using = . Radio spectral indices (, where ; Fender 2001) have been determined by Monte Carlo fitting using all the radio bands that were available for each date.
We also used uvmultifit (Martí-Vidal et al., 2014) to search for source intra-observational variability in the 5.5 and 9 GHz observations. Unfortunately, the setup of the radio observations - where the 10 – 15 min scans of GX 3394 were taken sparsely during the full radio observation666Which was generally focused on a different source of interest. - meant that the source was not densely sampled during the observation. Additionally, ATCA is a 6-element linear array meaning that the limited instantaneous uv-coverage did not allow variability shorter than 5-min intervals to be tested. For each time interval, we used uvmultifit to fit for a point source (which is a delta function in the uv-plane) at the target position (as well as all other sources in the field when detectable). Results for each variable epoch are provided in the Appendix, in Table LABEL:tab:radio_intra_obs_data and Figure 10.
| Date | MJD | Frequency | Flux density | |
|---|---|---|---|---|
| (GHz) | (mJy) | |||
| 2017–09–30 | 58026 | 5.5 | 1.14 0.06 | 0.25 0.05 |
| 9.0 | 1.24 0.04 | |||
| 17.0 | 1.53 0.06 | |||
| 19.0 | 1.51 0.06 | |||
| 2017–10–05 | 58031 | 5.5 | 1.53 0.05 | 0.11 0.03 |
| 9.0 | 1.61 0.05 | |||
| 17.0 | 1.58 0.06 | |||
| 19.0 | 1.58 0.06 | |||
| 97.5 | 2.0 0.1 | |||
| 145.0 | 2.28 0.11 | |||
| 233.0 | 2.20 0.11 | |||
| 2017–10–25 | 58051 | 5.5 | 2.1 0.1 | 0.34 0.04 |
| 9.0 | 2.98 0.04 | |||
| 17.0 | 3.28 0.13 | |||
| 19.0 | 3.27 0.06 | |||
| 2017–11–02 | 58059 | 5.5 | 2.54 0.15 | 0.50 0.17 |
| 9.0 | 3.23 0.08 | |||
| 2017–11–23 | 58080 | 5.5 | 3.7 0.1 | -0.44 0.13 |
| 9.0 | 3.00 0.1 | |||
| 2017–12–03 | 58090 | 5.5 | 4.5 0.1 | -0.05 0.11 |
| 9.0 | 4.4 0.2 | |||
| 2017–12–16 | 58103 | 5.5 | 4.78 0.06 | 0.06 0.02 |
| 9.0 | 5.15 0.07 | |||
| 17.0 | 5.10 0.15 | |||
| 19.0 | 5.28 0.15 | |||
| 2018–01–05 | 58123 | 5.5 | 4.57 0.05 | 0.26 0.06 |
| 9.0 | 5.17 0.07 | |||
| 2018–01–27 | 58146 | 5.5 | 1.45 0.08 | -0.15 0.18 |
| 9.0 | 1.35 0.08 |
2.3 ALMA (sub)-millimetre data
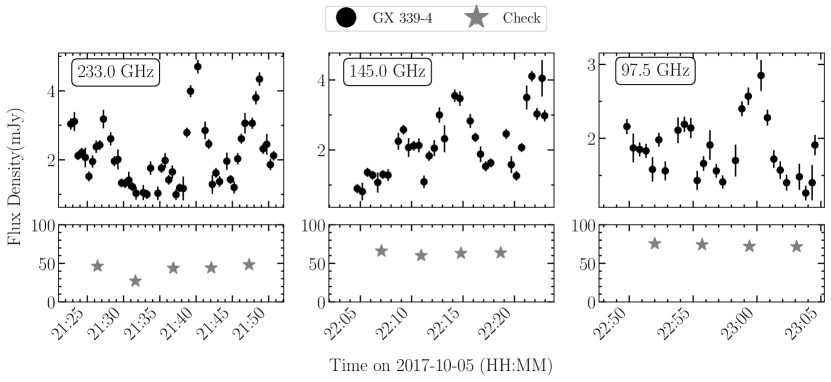
The Atacama Large Millimetre/Sub-Millimetre Array (ALMA) observed GX 339–4 (PI: Tetarenko, project code: 2017.1.00864.T) on 2017 Oct 05 (21:23:05.0 – 23:04:36.3 UTC; MJD 58031.8910 – 58031.9615). Data were taken sequentially in Bands 3, 4, and 6, at central frequencies of 97.5, 145, and 233 GHz, respectively. The ALMA correlator was set up to yield GHz wide base-bands at each frequency band. During our observations, the 12m array was in its Cycle 5 C41-9 configuration, with 41 antennas, spending 8.1/9.8/15.7 min total on the target source in Bands 3, 4, and 6, respectively. The median precipitable water vapour (PWV) during the observations was 0.78, 0.71, and 0.67 mm for the Bands 3, 4, and 6 observations, respectively. All of the data were reduced and imaged within casa (version 5.1.1; McMullin et al. 2007), using standard procedures outlined in the casaGuides for ALMA data reduction777https://casaguides.nrao.edu/index.php/ALMAguides. We used J1617–5848/J1427–4206 as bandpass & flux calibrators, J1650–5044 as a phase calibrator, and J1631–5256 as a check source, for all the observations. To image the continuum emission, we performed multi-frequency synthesis imaging on the data using the tclean task within casa, with natural weighting to maximize sensitivity. Flux densities of the source were then measured by fitting a point source in the image plane (using the imfit task). All ALMA sub-mm flux densities are recorded in Table 3. Systematic errors were applied to the absolute flux density calibration of the ALMA data, where an uncertainty of 5% is expected for ALMA bands 350 GHz888https://almascience.eso.org/documents-and-tools/latest/documents-and-tools/cycle8/alma-technical-handbook. We also explored the ALMA sub-mm observations for intra-observational variability. Results are discussed in Section 3.2.1, with light curves and the data points provided in Appendix B.
3 Results
3.1 X-ray lightcurves and spectral evolution
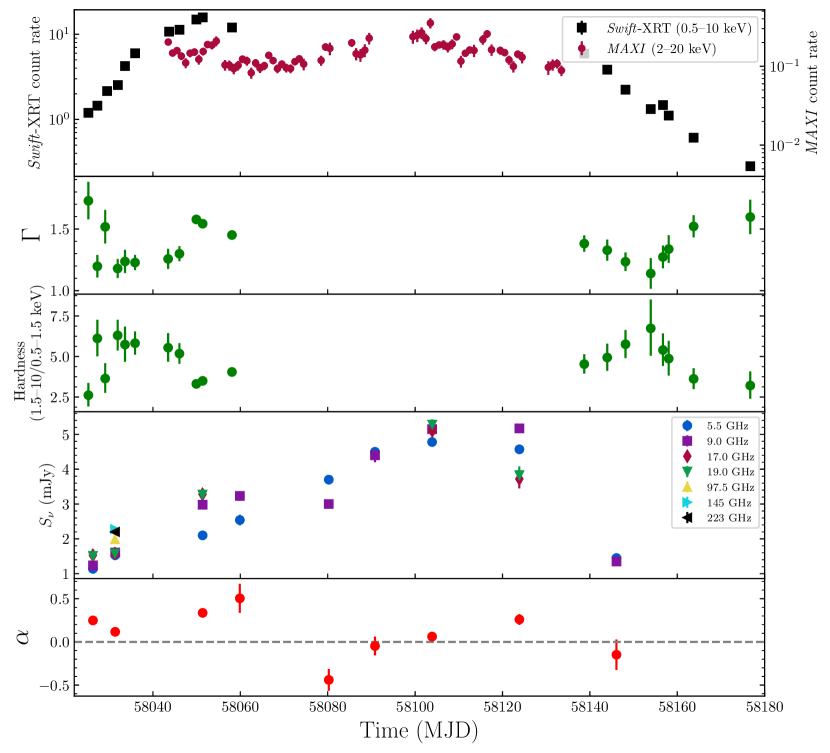
During the 2017–2018 outburst of GX 3394, the X-ray lightcurve shows a roughly single rise and decay evolution with an exponential decay (Figure 2, top panel). Swift-XRT monitoring showed a peak 0.5–10 keV X-ray flux of erg s-1 cm-2 at MJD 58049. During the Sun constraints to Swift, the source brightened, reaching a peak 2–20 keV flux of erg s-1 cm-2 at MJD 58103, which corresponds to a 0.5–10 keV flux of erg s-1 cm-2 (assuming ).
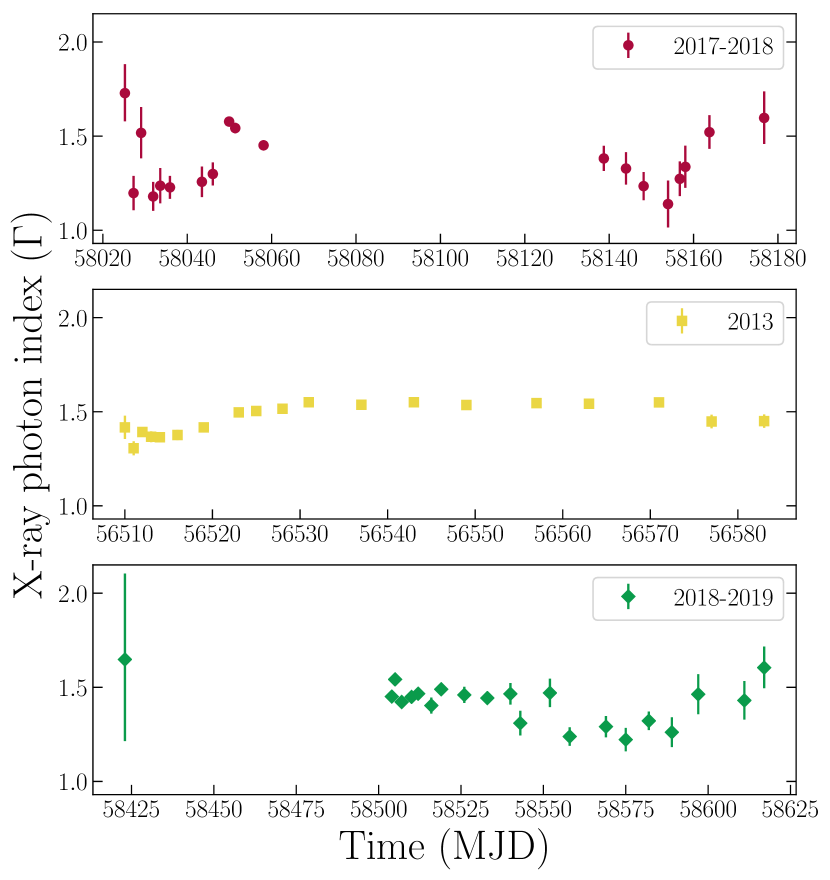
During the early stages of our X-ray monitoring, the X-ray photon index () was variable, where we initially detected a softer X-ray photon index (), which then hardened (to ), before softening again (to ) and then re-hardening (to ) once again over the space of about a week (Figure 2, panel 2). After this variable behaviour, then followed a generally standard pattern of evolution for a hard-only outburst, where it only marginally steepened as the outburst brightened, reaching a of 1.58 at the peak X-ray flux observed by Swift-XRT. However, instead of brightening and softening further, the outburst began to fade and the X-ray spectrum hardened.
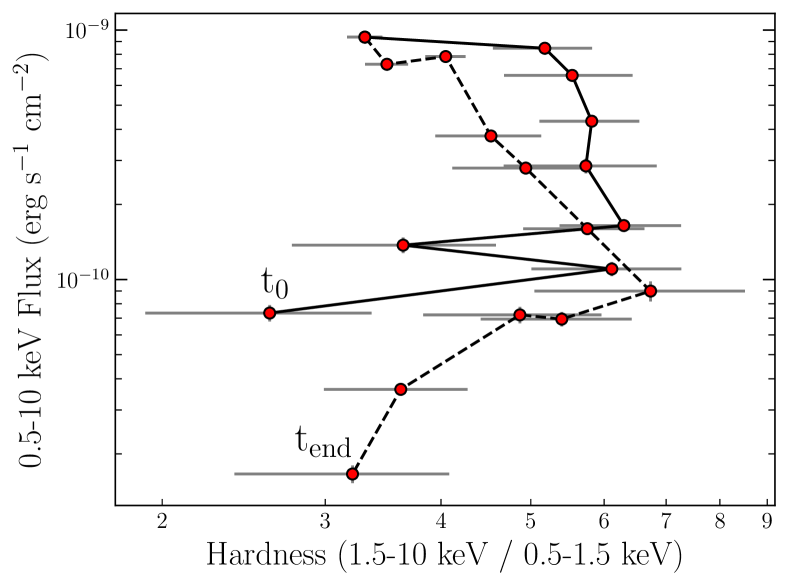
Once the X-ray flux began to decrease, also started decreasing in a reverse pattern to its behaviour during the rise phase of the outburst, such that hardened to (Figure 2). Then, similar to the rise phase, at our lowest observed X-ray fluxes (below erg s-1 cm-2) the X-ray photon index then softened progressively as the source faded, evolving to by the end of our monitoring. An analysis of the X-ray hardness, where we use the ratio between the 1.5–10 keV and 0.5–1.5 keV X-ray flux, showed a similar pattern of behaviour for the 2017–2018 outburst (Figure 2, panel 3).
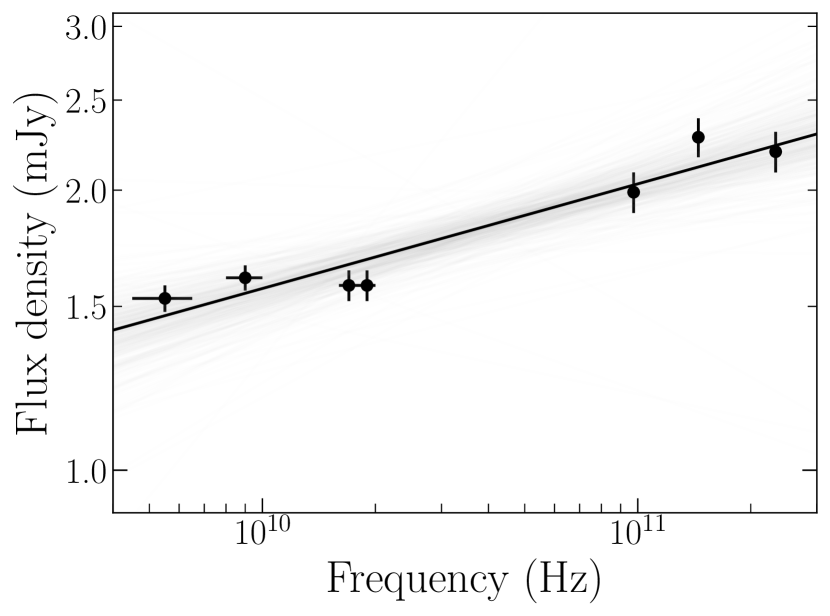
3.2 Radio/sub-mm lightcurves
In our 5-month long radio/sub-mm monitoring of GX 339–4, we observed the integrated radio/sub-mm flux densities vary between mJy. Long-term light curves revealed a single rise and decay phase (Figure 2, panel 4), where the spectral index () remained flat to inverted (and well represented by a single power law; Figure 3), except for our radio observation taken on MJD 58080 (Figure 2, panel 5), which displayed a relatively steep radio spectral index (). However, as shown below (Section 3.2.1 and Figure 10), we see a declining trend in the flux density of the radio bands throughout this observation. This is suggestive that the steep spectral index from this epoch could be the result of compact jet variability (where we might expect a delay between variability features of up to tens of minutes between these radio bands, towards the lower frequency band; Tetarenko et al. 2019b). In addition, we do not expect transient ejecta (which tend to show a steep spectrum) to be launched at such a low X-ray luminosity and hard X-ray spectrum, where there does not appear to be any sudden X-ray changes. Therefore, the radio and sub-mm results are consistent with emission from a compact, partially self-absorbed synchrotron jet. This emission remained on for the entire outburst, with no indication of the jet emission being quenched in our observations.
3.2.1 Intra-observational variability
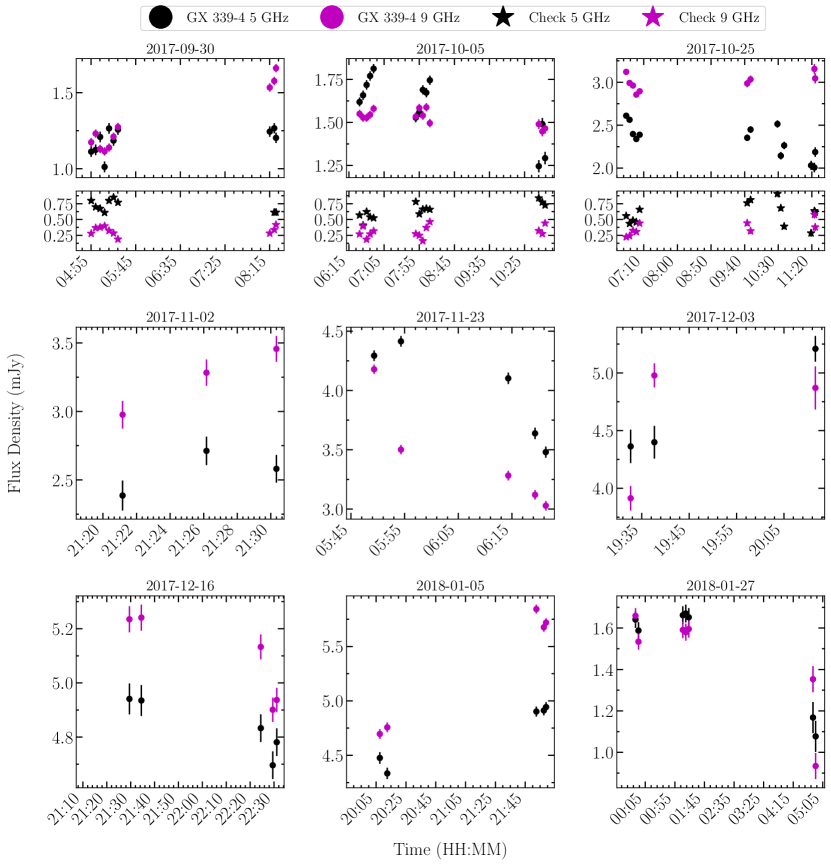
Compact jets have been found to be highly variable on short ( day) timescales (e.g., Tetarenko et al. 2019b). As such, we opted to search for intra-observational variability in our radio through sub-mm data of GX 339–4. Figure 10 displays intra-observation light curves from the ATCA radio data sampled on 5-min timescales, while Figure 11 displays intra-observation light curves from the ALMA sub-mm data sampled on 30-sec timescales.
To characterize the amplitude of any variability and compare between frequency bands, we use the fractional root mean square (RMS) statistic,
| (1) |
where represents the weighted mean of the flux measurements, the sample variance , and the mean square measurement error (Akritas & Bershady, 1996; Vaughan et al., 2003; Sadler et al., 2006). We consider % as not significantly variable, % as mildly variable, and % as highly variable (as in Tetarenko et al., 2019a).
In the ALMA sub-mm data, we detect clear short-timescale variability, in the form of structured, small-scale flaring episodes across all three bands sampled. For example, the largest flare detected at 230 GHz ( 21:40 UT) is symmetric in shape, and rises to an amplitude of times the base flux density level of 1 mJy, over a timescale of min (corresponding to a brightness temperature of K, consistent with other synchrotron events from LMXBs; Pietka et al. 2015). We measure fractional RMS values of %, %, and % for the 97, 145, and 230 GHz bands, respectively, indicating a mildly variable to highly variable source at these frequencies. To ensure that the sub-mm variations we observe from GX 3394 are intrinsic to the source, and not due to atmospheric or instrumental effects, we also extracted intra-observation light curves for our check source. We find that the check source shows relatively constant flux densities throughout our observations in all the bands (with any variations present being % of the average flux density), thus we are confident that the variations we observed from GX 3394 are an accurate representation of the rapidly changing intrinsic flux density of the source.
In the ATCA radio data, we also detected short-timescale variability. Due to the low-instantaneous uv-coverage of the ATCA interferometric array, we were only able to explore variability down to 5-minute timescales. Additionally, the observing setup meant that only a few 10-minute scans of GX 3394 were taken spread out within a much longer observation. Therefore, our observations do not, and are not as sensitive to, detecting structured flares similar to those we observed within the ALMA sub-mm data. However, we do observe increasing/decreasing trends both within (e.g., 2017-10-05) and throughout some observations (e.g., 2017-09-30, 2017-11-23). This behaviour suggests that small-scale flaring activity, similar to that seen in the sub-mm bands, may have also been occurring in the radio bands, but we were not able to sample the source on short enough time-scales to resolve the flares. We measure fractional RMS values ranging from % at 5 GHz and % at 9 GHz. While this may indicate a mildly variable source at times, the source was too faint for self-calibration and, therefore, the results may suffer from phase decorrelation or gain drifts. For example, when comparing this variability to a check source present in the ATCA field of view999Note that we are only able to detect the check source for the three earliest ATCA observations due to the array configuration changing from a very compact to much more extended configuration on 2017-11-01., we find the check source can at times be just as variable as GX 339–4. This, plus the low level of variability, suggests that the radio variations we observe from GX 339–4 may not be completely intrinsic to the source, with possible contributions from atmospheric or instrumental effects.
Comparing the variability properties between the radio and sub-mm bands, we see a pattern of higher variability amplitudes at higher electromagnetic frequencies. This trend is consistent with what we might expect from compact jet emission, as the (sub-)mm emission originates from a region close to the base of the jet (with a smaller cross-section), while the radio emission originates from a region further out in the jet flow (with a large cross-section). Imaging the ALMA data on finer frequency scales (in 2 GHz sub-bands for all bands) shows that the in-band ALMA spectral indices were flat/inverted throughout the observation (Table 4). While these results were time-averaged, they strongly support the suggestion that the observed flux density variations arose from a variable compact jet.
| Frequency | Flux Density |
|---|---|
| (2) GHz | mJy |
| 90.5 | 2.00.1 |
| 92.5 | 1.90.1 |
| 102.5 | 2.10.1 |
| 104.5 | 2.10.1 |
| 138 | 2.10.1 |
| 140 | 2.30.1 |
| 150 | 2.50.1 |
| 152 | 2.50.1 |
| 224 | 2.20.1 |
| 226 | 2.20.1 |
| 240 | 2.30.1 |
| 242 | 2.30.1 |
4 Discussion
4.1 Source brightness
The 2017–2018 hard-only outburst of GX 3394 was well monitored in the radio and X-ray bands at low X-ray luminosities during the rise phase due to the early discovery of the outburst from regular optical monitoring (Russell et al., 2017)101010See Russell et al. 2019a for full details on the X-ray Binary New Early Warning System (XB-NEWS).. As such, our X-ray and radio monitoring began at an X-ray luminosity of 5.6 1035 erg s-1, corresponding to an Eddington luminosity, , of 5.8 10-4 (assuming a distance of 8 kpc and , which is the peak of the best-fit mass distribution of the BH LMXB population; Özel et al. 2010, where erg s-1), and our first radio detection occurred at erg s-1. At the X-ray peak of the outburst, GX 3394 reached an X-ray luminosity of 4 1037 erg s-1, corresponding to . See also Wang et al. (2020) for a discussion on the X-ray luminosity determined with NICER (while our results generally agree, their results are taken from observations averaged over multiple days, making a direct comparison difficult). In the radio band, we measured a maximum luminosity of 2 1030 erg s-1.
As expected, at its X-ray and radio peak, this outburst was significantly fainter than luminosities reached from successful outbursts of GX 3394 (Corbel et al., 2013a), as well as those from other systems, where successful outburst luminosities usually exceed erg s-1 (Tetarenko et al., 2016). In comparison to other hard-only outbursts from GX 3394, the 2017–2018 outburst reached similar X-ray luminosities to other hard-only outbursts, within a factor of a few. The observed GX 3394 luminosities were also in broad agreement with typical peak luminosities from the full sample of hard-only outbursts from other systems (– erg s-1; Tetarenko et al. 2016), albeit on the higher end of that range. Additionally, the 2017–2018 peak X-ray luminosity occurred at a similar luminosity to the expected hard state to HIMS transition luminosity for a large sample of BH LMXBs (; Maccarone 2003; Dunn et al. 2010; Kalemci et al. 2013; Vahdat Motlagh et al. 2019), but below the typical transition luminosities observed from GX 3394 (; Vahdat Motlagh et al. 2019).
4.2 X-ray spectral evolution
During the early stages of our monitoring, at the lowest observed (1–10 keV) X-ray luminosities of the rise phase ( 10-3 ), GX 3394 exhibited a relatively soft X-ray spectrum. As the source brightened, the X-ray spectrum hardened (Figure 2). This evolution was demonstrated by the variable changes in the source hardness (Figure 4) and the X-ray photon index, where evolved back and forth between and over a few days; see Table 1. Following this erratic evolution, at X-ray luminosities of , increased progressively to at the peak flux of the outburst. As the outburst faded, hardened. Similar to the early stages of the outburst, at the lowest observed X-ray luminosities at the end of the outburst ( 7 10-4 ), the X-ray spectrum again softened, although this decay phase evolution was much more gradual than during the rise phase. While the gradual softening and hardening of the X-ray spectrum during the bright phase of an outburst is standard, spectral hardening at low X-ray luminosities in the rise phase is generally not observed, although, as we discuss below, this is likely due to a lack of monitoring at such low X-ray luminosities early in the outburst.
In their quiescent state, BH LMXBs show softer X-ray spectra, such that (e.g., Plotkin et al., 2013; Reynolds et al., 2014). GX 3394 was not in quiescence during our monitoring (our observations begin at an X-ray luminosity of , well above the expected quiescence level of for GX 3394 (Plotkin et al., 2013). It has been suggested that at low X-ray luminosities, the X-ray spectrum could be dominated by emission from the base of the jet (e.g., Markoff et al., 2005; Maitra et al., 2009; Connors et al., 2019; Lucchini et al., 2019), where changes to the observed spectrum could arise from a change in the location of the synchrotron cooling break, , which represents the frequency at which the radiation timescales of the synchrotron emission are shorter than the dynamical time scales of the emitting electrons111111The position and evolution of the cooling break are very poorly understood; its location has been inferred in the X-ray band at , in the UV-band at when the source enters quiescence (Pe’er & Markoff, 2012; Russell et al., 2013; Shahbaz et al., 2013), and possibly in the optical band at the highest X-ray luminosities (around the transition from the hard state to the soft state; Russell et al. 2014).. While the shape of the X-ray spectrum alone may suggest that the low-luminosity X-ray emission could have been dominated by the un-cooled optically-thin emission from the jet121212Although we would expect to be close to typical optically-thin synchrotron spectral indices (such that , where ). Then, when would be below the X-ray band, the X-ray spectrum should appear even steeper (steepening by a half, such that ), which we did not observe., using broadband NuSTAR X-ray observations, García et al. (2019) detected strong signatures of X-ray reprocessing on 2017-10-02 (see also (Wang et al., 2020)), which are not expected if the X-ray emission is synchrotron in origin (Markoff & Nowak, 2004). Instead, García et al. (2019) proposed that the reprocessing originated in an optically-thick medium, presumably the accretion disk. In such a case, changes to the optical depth of the disk would have produced observable changes in the X-ray spectrum (such that an increasing optical depth would enhance the high-energy ‘hard’ X-ray photons) at luminosities similar to our observations (e.g., Yan et al., 2020). As such, rapid changes to the optical depth and geometry (Wang et al., 2020) of the accretion disk could result in the erratic spectral evolution we observed during the low-luminosity stage of the outburst rise. In addition, a further argument against synchrotron cooled X-rays is that they are expected to yield a steeper correlation between the radio and X-ray luminosities (Yuan & Cui, 2005), which we did not observe, instead detecting a shallower correlation (see Section 4.3 for results and further discussion).
Alternatively, similar changes to the X-ray spectral shape could also be observed from an optically-thin flow in a RIAF (e.g., Narayan & Yi, 1995; Esin et al., 1997; Yuan & Narayan, 2014). In such a case, if the X-ray emission arises via inverse Compton in the outer disk or synchrotron self-Compton in the inner flow, then both gradual and erratic changes in the X-ray spectrum can be produced simply by changes to the optical depth of the inverse Compton scatterings (e.g., Esin et al., 1997). As such, the X-ray observations imply that the X-ray spectral changes were a result of an evolving optical depth of the accretion flow, whether it is optically-thick or thin.
We do note that during the low-luminosity decay phase (from 2018-02-04 and on-wards) our monitoring does not allow us to identify the origin of the hard X-ray emission. García et al. (2019) find signatures of X-ray reprocessing on 2018-01-30, but there were no high spectral resolution X-ray observations after those times. Therefore, it might be possible that the hard X-rays were dominated by emission from the base of the jet at later times.
4.2.1 Comparison with other outbursts
A simple comparison of the X-ray spectral evolution against the 2013 hard-only outburst and 2018-2019 hard-only flare from GX 3394 (Figure 5) does not show a softer X-ray spectral evolution compared to the 2017–2018 outburst. However, the spectral softening and variability during the earliest stages of our monitoring do not appear to have been observed in these other hard-only outbursts, although, as shown below, this is due to missing data early on in these outbursts.
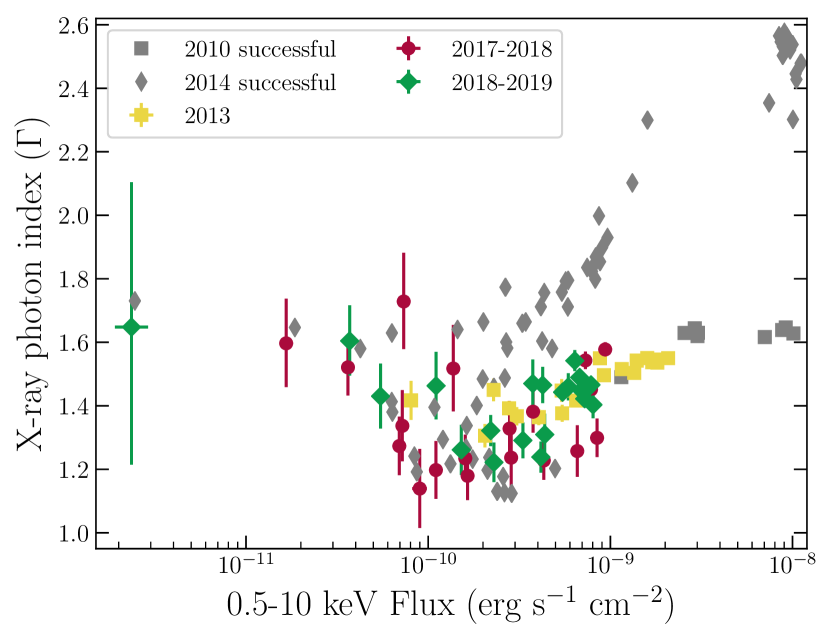
To best compare the evolution of the X-ray photon index between outbursts (both hard-only and successful), we explored how evolved with X-ray flux for the 2013 and 2017–2018 hard-only outbursts and 2018–2019 hard-only flare, and a sample of two successful outbursts (Figure 6). Such a comparison shows clear similarities despite the differences in cadence and luminosity of the observations. At lower X-ray luminosities as the flux increases, first decreases before increasing at higher X-ray fluxes, displaying a regular “V”-shaped pattern. The only clear difference between the two outburst types is the hysteresis of with X-ray flux: hard-only outbursts appear to traverse the same path during both the rise and decay phases of the outburst, showing little to no hysteresis in (Figure 6), while successful outbursts appear to follow two different tracks - a harder (lower) track during the rise, and a softer (higher) track during the decay, before re-joining as the source moves to X-ray fluxes erg s-1 cm-2. The V-shaped pattern between the X-ray flux and (Figure 6) at similar luminosities is commonly observed in BH LMXBs (see, e.g., Wu & Gu, 2008, figure 1). The inflection point, where the source switches from X-ray spectral hardening to softening with increased X-ray luminosity, has been attributed to a transition from a RIAF (at bolometric luminosities of 0.01 ) to a standard accretion disk ( 0.01 ; Wu & Gu 2008).
However, other possibilities for the inflection point have also been suggested, such as the point where emission becomes dominated by the jet, or where reprocessed photons begin to dominate in an out-flowing coronal model (e.g., Sobolewska et al. 2011).
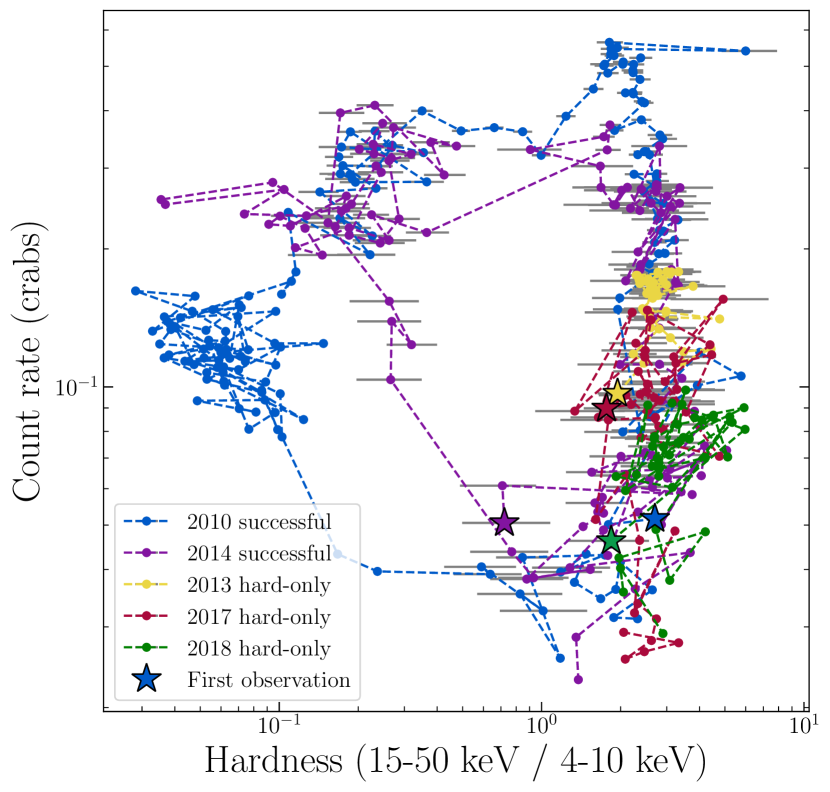
To identify any deviation in source behaviour during the Sun constraint, we also compared the X-ray hardness evolution with X-ray intensity for both hard-only and successful outbursts of this source using MAXI and Swift-BAT observations (Figure 7). Our results show that despite showing some minor hysteresis in the Swift-XRT data, the 2017–2018 outburst hardness evolution did not appear to significantly deviate from other outbursts of this source. This applies to the rise phase of successful outbursts and complete hard-only outbursts.
Therefore, the 2017–2018 X-ray outburst of GX 3394 seems to follow a relatively typical evolution when compared to the X-ray behaviour of both hard-only and successful outbursts, with no preliminary indicators that may identify whether an outburst is successful or not. A similar result was also found during detailed near-infrared (NIR) and optical studies of outbursts from BH LMXBs (Kosenkov et al., 2020), where no indicators in the NIR/optical colours or magnitude were identified that might allow for an identification of a hard-only or successful outburst.
4.3 The radio – X-ray correlation
With our quasi-simultaneous radio and X-ray data (taken within 1 day of each other)131313The radio/X-ray luminosity data point from MJD 58058 was taken 1 day apart (the mid-point of the X-ray observation was MJD 58058.1, while the ATCA radio observation was MJD 58059.9). Therefore, to best estimate the simultaneous radio luminosity, we fit the radio light curve assuming an exponential rise to estimate the 5.5 GHz flux density at the time of the X-ray observation., we explored the correlation between the radio and X-ray emission. We used the python implementation of the linear regression algorithm linmix_err141414https://github.com/jmeyers314/linmix (Kelly, 2007) to perform a (10,000 iteration) linear fit to the radio and X-ray luminosities in logarithmic space, finding a flatter than usual radio – X-ray coupling for GX 3394, where for this hard-only outburst (Figure 8). This result included the MAXI data which had an assumed value of (where = 1.5 – 2.5). However, we note that due to the close proximity of the Sun, the MAXI images were poor. As such, excluding the MAXI points did not change our results, providing a best-fit relation of .
A flatter radio – X-ray correlation may suggest a more inefficient coupling between the two emission mechanisms (where the dominant X-ray emission could now arise from synchrotron self-Compton emission from the base of the jet; e.g., Markoff et al. 2005; Corbel et al. 2008; Shaw et al. 2020 submitted). An inefficient coupling may arise from a lower mass accretion rate, resulting in a lower magnetic flux and, therefore, possibly weaker jets (e.g., Shibata & Uchida, 1987). However, even though the observed relation does deviate significantly from that reported by Corbel et al. (2013a) and Gallo et al. (2012), such a deviation is not necessarily atypical. Corbel et al. (2013a) suggested that over luminosity ranges less than two orders of magnitude, the correlation index may deviate substantially (where indices of between 0 and 2 have been observed). Here, our radio and X-ray data only span a range of 1 order of magnitude in and 1.5 orders of magnitude in (Figure 8).
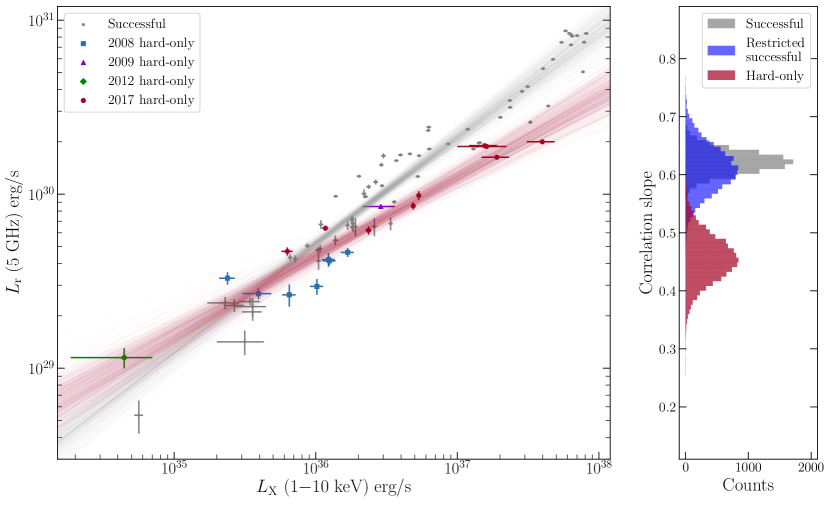
To extend the X-ray luminosity range, we combined our 2017–2018 data with radio and X-ray luminosities taken from other hard-only outbursts from GX 3394 (Figure 9, left panel), where we include data presented by Corbel et al. 2013a on the 2008, 2009 and 2012 hard-only outbursts. We find a best-fit relation of ( without the MAXI data), again much flatter than the relation for the successful outbursts from GX 3394 (similar to results from Corbel et al. 2013a, who analysed data from five successful and two hard-only outbursts). Performing a Monte-Carlo 2-dimensional 2-sample Kolmogorov-Smirnov (K-S) test151515https://github.com/syrte/ndtest (Peacock, 1983; Fasano & Franceschini, 1987) on the successful and hard-only data sets yields a -value of 0.031, providing statistical evidence that is suggestive that the hard-only and successful radio and X-ray luminosities do not arise from the same parent distribution. Confining the successful outburst data from Corbel et al. (2013a) so that the data are within our observed 2017–2018 radio and X-ray luminosities, we find a best fit of (Figure 9, right panel), showing that there isn’t a consistent deviation at these X-ray luminosities.
Our findings indicate that correlations for hard-only outbursts may be flatter than the correlations exhibited by successful outbursts from GX 3394, possibly acting as a indicator for outbursts remaining within the hard state. However, our radio and sub-mm monitoring indicate that the compact jet was variable within single observations (Section 3.2.1). Therefore, without strictly simultaneous radio and X-ray observations, such variability may impact our findings. Additionally, Koljonen & Russell (2019) find steeper correlation slopes when the X-ray band is extended from 3–9 keV to 3–200 keV, but as our comparisons were all made within the same band, our results should not be significantly affected. We note that because the X-ray observations need to span 2-orders of magnitude in luminosity, using this method as a precursor indicator may be impractical (as hard-only outbursts often do not extend to this full range). However, this method may allow some early notification (after 1-order of magnitude) that it could be a hard-only outburst, and could also be used to classify unknown historical outbursts, or outbursts with no X-ray spectral or timing observations.
When comparing our result to those from hard-only outbursts of other systems, unfortunately the picture is not very clear. To date, there is a dearth of radio – X-ray monitoring campaigns of both successful and hard-only outbursts from a single source meaning that clear comparisons are difficult to make. One of the only other sources that has been well monitored during both types of outburst is the BH-LMXB H1743322. However, this system displayed a much more complex radio – X-ray connection, where it lies on the outlier track of the correlation. Sources on the outlier track exhibit a steeper correlation at higher X-ray luminosities, a flatter correlation index at lower X-ray luminosities, and seem to follow the standard correlation track below some critical X-ray luminosity (e.g., Coriat et al., 2011; Koljonen & Russell, 2019). As such, for hard-only outbursts (which remain at a relatively low X-ray luminosity) it showed a very shallow correlation (of ; Jonker et al. 2010), but for successful outbursts, the lower luminosity data follow a similarly shallow path () before transitioning to a much steeper correlation (; Coriat et al. 2011). The transition has been attributed to switching between a radiatively efficient and inefficient accretion regime. Williams et al. (2020) presented radio and X-ray observations of H1743322 during its 2018 hard-only outburst. These observations show that hard-only outbursts can transition between the two paths, following a very similar behaviour. These studies highlight that H1743322 has appeared to follow the same radio – X-ray correlation path regardless of the outburst being successful or not. Therefore, while GX 3394 may exhibit a deviance from its standard correlation during hard-only outbursts, such behaviour may not be as clear for the population of BH-LMXB systems, or even for GX 3394 at higher hard state X-ray luminosities. Therefore, additional monitoring of both types of outburst from the same source with strictly simultaneous radio and X-ray observations is required to identify if a flatter correlation index is indeed a feature of hard-only outbursts from all sources, or if it is something related only to GX 3394 (or only a subset of BH-LMXBs). In particular, dedicated and more complete monitoring during both the rise and decay are needed, and are now more achievable due to regular optical monitoring (XB-NEWS; Russell et al. 2019a) providing an early trigger for radio and X-ray monitoring.
5 Conclusion
Our detailed analysis of X-ray and radio observations taken during the 2017–2018 hard-only outburst of GX 3394, implied that despite the outburst not entering a soft state, GX 3394 appeared to show a relatively standard X-ray spectral evolution. While we detected a softer X-ray spectrum at low X-ray luminosities early on in the outburst, using comparisons between both successful and hard-only outbursts from this source we find that this behaviour is normal for both types of outburst (successful and hard-only). We suggest that the changes to the X-ray spectrum during that time were possibly caused by X-ray reprocessing in an optically thick medium, likely the accretion flow, or were due to optical depth changes in an optically-thin accretion flow.
Our radio and X-ray monitoring showed a flatter than typical radio – X-ray correlation for this outburst, where . Combining our 2017–2018 outburst data with those from other hard-only outbursts from this system also yielded a flatter than typical correlation, where , which may arise from a more inefficient coupling between the accretion flow and the jets, possibly due to a lower mass accretion rate. A flatter radio – X-ray correlation at these lower X-ray luminosities may indicate whether a source completes a full outburst cycle or remains only in the hard state, although extending the luminosity range beyond 2-orders of magnitude in the X-rays to ensure reliability means that this method may not be a useful precursor indicator, but it could be used to suggest a hard-only outburst as a high possibility early in the outburst (after 1 order of magnitude in X-ray luminosity), or for historical and new outbursts with limited X-ray monitoring such that the spectral state changes are not known. However, our radio and X-ray observations were not strictly simultaneous and we detected considerable intra-observational compact jet variability in the sub-mm band (and possibly some in the radio band). Additionally, our results explore a limited luminosity range, focusing on the low-luminosity hard state, which must be extended through better sampling. Also, this behaviour doesn’t necessarily appear to be universal among other systems. Therefore, while a flatter correlation index may act as an indicator for a hard-only outburst from GX 3394, this may not be the case for other systems. Hence, further monitoring is required to test its universality.
6 Acknowledgements
We thank the anonymous referee for their helpful comments that improved this manuscript. We also thank the UvA Jetset group for useful discussions. TDR acknowledges support from the Netherlands Organisation for Scientific Research (NWO) Veni Fellowship, grant number 639.041.646, and financial contribution from the agreement ASI-INAF n.2017-14-H.0. SM is supported by an NWO Vici grant, grant number 639.043.513. ND, JvdE, and ASP are supported by a Vidi grant from NWO, awarded to ND. JvdE is supported by a Lee Hysan Junior Research Fellowship from St Hilda’s College, Oxford. GRS acknowledges support from Natural Sciences and Engineering Research Council of Canada (NSERC) Discovery Grants (RGPIN-06569-2016). The Australia Telescope Compact Array (ATCA) is part of the Australia Telescope National Facility which is funded by the Australian Government for operation as a National Facility managed by CSIRO. We acknowledge the Gomeroi people as the traditional owners of the ATCA Observatory site. This paper makes use of the following ALMA data: ADS/JAO.ALMA#2017.1.00864.T. ALMA is a partnership of ESO (representing its member states), NSF (USA) and NINS (Japan), together with NRC (Canada), MOST and ASIAA (Taiwan), and KASI (Republic of Korea), in cooperation with the Republic of Chile. The Joint ALMA Observatory is operated by ESO, AUI/NRAO and NAOJ. The National Radio Astronomy Observatory is a facility of the National Science Foundation operated under cooperative agreement by Associated Universities, Inc. This research has made use of (i) NASA’s Astrophysics Data System, (ii) data, software, and/or web tools obtained from the High Energy Astrophysics Science Archive Research Center (HEASARC), a service of the Astrophysics Science Division at NASA Goddard Space Flight Center (GSFC) and of the Smithsonian Astrophysical Observatory’s High Energy Astrophysics Division, (iii) data supplied by the UK Swift Science Data Centre at the University of Leicester, and (iiii) MAXI data provided by RIKEN, JAXA and the MAXI team.
Data Availability
Data from Swift and MAXI are publicly available from HEASARC (https://heasarc.gsfc.nasa.gov/), obsIDs are provided in the data tables. Results and best-fit parameters are all provided in this paper. Raw radio data can be accessed online (https://atoa.atnf.csiro.au/query.jsp), under project code C3057. Raw ALMA data are available online (https://almascience.eso.org/asax/) under project code 2017.1.00864.T. All radio and sub-mm results are provided in this paper.
References
- Akritas & Bershady (1996) Akritas M. G., Bershady M. A., 1996, ApJ, 470, 706
- Aref’ev et al. (2004) Aref’ev V. A., Revnivtsev M. G., Lutovinov A. A., Sunyaev R. A., 2004, Astronomy Letters, 30, 669
- Arnaud (1996) Arnaud K. A., 1996, XSPEC: The First Ten Years. Astronomical Society of the Pacific Conference Series, p. 17
- Belloni (2010) Belloni T. M., 2010, States and Transitions in Black Hole Binaries. Springer-Verlag Berlin Heidelberg, p. 53, doi:10.1007/978-3-540-76937-8_3
- Belloni et al. (2002) Belloni T., Colombo A. P., Homan J., Campana S., van der Klis M., 2002, A&A, 390, 199
- Bright et al. (2020) Bright J. S., et al., 2020, Nature Astronomy, 4, 697
- Brocksopp et al. (2001) Brocksopp C., Jonker P. G., Fender R. P., Groot P. J., van der Klis M., Tingay S. J., 2001, MNRAS, 323, 517
- Brocksopp et al. (2004) Brocksopp C., Bandyopadhyay R. M., Fender R. P., 2004, New Astron., 9, 249
- Brocksopp et al. (2010) Brocksopp C., Jonker P. G., Maitra D., Krimm H. A., Pooley G. G., Ramsay G., Zurita C., 2010, MNRAS, 404, 908
- Buxton et al. (2012) Buxton M. M., Bailyn C. D., Capelo H. L., Chatterjee R., Dinçer T., Kalemci E., Tomsick J. A., 2012, AJ, 143, 130
- Capitanio et al. (2009) Capitanio F., Belloni T., Del Santo M., Ubertini P., 2009, MNRAS, 398, 1194
- Casella & Pe’er (2009) Casella P., Pe’er A., 2009, ApJ, 703, L63
- Chen et al. (1997) Chen W., Shrader C. R., Livio M., 1997, ApJ, 491, 312
- Connors et al. (2019) Connors R. M. T., et al., 2019, MNRAS, 485, 3696
- Corbel & Fender (2002) Corbel S., Fender R. P., 2002, ApJ, 573, L35
- Corbel et al. (2000) Corbel S., Fender R. P., Tzioumis A. K., Nowak M., McIntyre V., Durouchoux P., Sood R., 2000, A&A, 359, 251
- Corbel et al. (2003) Corbel S., Nowak M. A., Fender R. P., Tzioumis A. K., Markoff S., 2003, A&A, 400, 1007
- Corbel et al. (2004) Corbel S., Fender R. P., Tomsick J. A., Tzioumis A. K., Tingay S., 2004, ApJ, 617, 1272
- Corbel et al. (2008) Corbel S., Koerding E., Kaaret P., 2008, MNRAS, 389, 1697
- Corbel et al. (2013a) Corbel S., Coriat M., Brocksopp C., Tzioumis A. K., Fender R. P., Tomsick J. A., Buxton M. M., Bailyn C. D., 2013a, MNRAS, 428, 2500
- Corbel et al. (2013b) Corbel S., et al., 2013b, MNRAS, 431, L107
- Coriat et al. (2011) Coriat M., et al., 2011, MNRAS, 414, 677
- Corral-Santana et al. (2016) Corral-Santana J. M., Casares J., Muñoz-Darias T., Bauer F. E., Martínez-Pais I. G., Russell D. M., 2016, A&A, 587, A61
- Curran & Chaty (2013) Curran P. A., Chaty S., 2013, A&A, 557, A45
- Curran et al. (2014) Curran P. A., et al., 2014, MNRAS, 437, 3265
- Dhawan et al. (2000) Dhawan V., Mirabel I. F., Rodríguez L. F., 2000, ApJ, 543, 373
- Díaz Trigo & Boirin (2016) Díaz Trigo M., Boirin L., 2016, Astronomische Nachrichten, 337, 368
- Dinçer et al. (2018) Dinçer T., Bailyn C. D., Miller-Jones J. C. A., Buxton M., MacDonald R. K. D., 2018, ApJ, 852, 4
- Dunn et al. (2010) Dunn R. J. H., Fender R. P., Körding E. G., Belloni T., Cabanac C., 2010, MNRAS, 403, 61
- Esin et al. (1997) Esin A. A., McClintock J. E., Narayan R., 1997, ApJ, 489, 865
- Espinasse & Fender (2018) Espinasse M., Fender R., 2018, MNRAS, 473, 4122
- Evans et al. (2009) Evans P. A., et al., 2009, MNRAS, 397, 1177
- Fasano & Franceschini (1987) Fasano G., Franceschini A., 1987, MNRAS, 225, 155
- Fender (2001) Fender R. P., 2001, MNRAS, 322, 31
- Fender (2006) Fender R., 2006, Jets from X-ray binaries. Cambridge University Press, Cambridge, UK, pp 381–419
- Fender (2010) Fender R., 2010, ‘Disc-Jet’ Coupling in Black Hole X-Ray Binaries and Active Galactic Nuclei. Springer-Verlag Berlin Heidelberg, p. 115, doi:10.1007/978-3-540-76937-8_5
- Fender et al. (2004) Fender R. P., Belloni T. M., Gallo E., 2004, MNRAS, 355, 1105
- Fender et al. (2009) Fender R. P., Homan J., Belloni T. M., 2009, MNRAS, 396, 1370
- Ferrigno et al. (2012) Ferrigno C., Bozzo E., Del Santo M., Capitanio F., 2012, A&A, 537, L7
- Fürst et al. (2015) Fürst F., et al., 2015, ApJ, 808, 122
- Gallo et al. (2003) Gallo E., Fender R. P., Pooley G. G., 2003, MNRAS, 344, 60
- Gallo et al. (2005) Gallo E., Fender R., Kaiser C., Russell D., Morganti R., Oosterloo T., Heinz S., 2005, Nature, 436, 819
- Gallo et al. (2012) Gallo E., Miller B. P., Fender R., 2012, MNRAS, 423, 590
- Gallo et al. (2014) Gallo E., et al., 2014, MNRAS, 445, 290
- Gallo et al. (2018) Gallo E., Degenaar N., van den Eijnden J., 2018, MNRAS, 478, L132
- García et al. (2019) García J. A., et al., 2019, ApJ, 885, 48
- Hameury et al. (1997) Hameury J. M., Lasota J. P., McClintock J. E., Narayan R., 1997, ApJ, 489, 234
- Hannikainen et al. (1998) Hannikainen D., Hunstead R., Campbell-Wilson D., 1998, New Astron. Rev., 42, 601
- Harmon et al. (1994) Harmon B. A., et al., 1994, ApJ, 425, L17
- Heida et al. (2017) Heida M., Jonker P. G., Torres M. A. P., Chiavassa A., 2017, ApJ, 846, 132
- Hjellming & Rupen (1995) Hjellming R. M., Rupen M. P., 1995, Nature, 375, 464
- Hynes et al. (2000) Hynes R. I., Mauche C. W., Haswell C. A., Shrader C. R., Cui W., Chaty S., 2000, ApJ, 539, L37
- Hynes et al. (2003) Hynes R. I., Steeghs D., Casares J., Charles P. A., O’Brien K., 2003, ApJ, 583, L95
- Jonker et al. (2010) Jonker P. G., et al., 2010, MNRAS, 401, 1255
- Justham & Schawinski (2012) Justham S., Schawinski K., 2012, MNRAS, 423, 1641
- Kalemci et al. (2013) Kalemci E., Dinçer T., Tomsick J. A., Buxton M. M., Bailyn C. D., Chun Y. Y., 2013, ApJ, 779, 95
- Kelly (2007) Kelly B. C., 2007, ApJ, 665, 1489
- Koljonen & Russell (2019) Koljonen K. I. I., Russell D. M., 2019, ApJ, 871, 26
- Kosenkov et al. (2020) Kosenkov I. A., Veledina A., Suleimanov V. F., Poutanen J., 2020, A&A, 638, A127
- Lasota (2001) Lasota J.-P., 2001, New Astron. Rev., 45, 449
- Lucchini et al. (2019) Lucchini M., Markoff S., Crumley P., Krauß F., Connors R. M. T., 2019, MNRAS, 482, 4798
- Maccarone (2003) Maccarone T. J., 2003, A&A, 409, 697
- Maitra et al. (2009) Maitra D., Markoff S., Brocksopp C., Noble M., Nowak M., Wilms J., 2009, MNRAS, 398, 1638
- Markoff & Nowak (2004) Markoff S., Nowak M. A., 2004, ApJ, 609, 972
- Markoff et al. (2005) Markoff S., Nowak M. A., Wilms J., 2005, ApJ, 635, 1203
- Martí-Vidal et al. (2014) Martí-Vidal I., Vlemmings W. H. T., Muller S., Casey S., 2014, A&A, 563, A136
- Massardi et al. (2011) Massardi M., Bonaldi A., Bonavera L., López-Caniego M., de Zotti G., Ekers R. D., 2011, MNRAS, 415, 1597
- Matsuoka et al. (2009) Matsuoka M., et al., 2009, PASJ, 61, 999
- McClintock & Remillard (2006) McClintock J. E., Remillard R. A., 2006, Black hole binaries. Cambridge University Press, Cambridge, UK, pp 157–213
- McConnell et al. (2012) McConnell D., Sadler E. M., Murphy T., Ekers R. D., 2012, MNRAS, 422, 1527
- McMullin et al. (2007) McMullin J. P., Waters B., Schiebel D., Young W., Golap K., 2007, CASA Architecture and Applications. p. 127
- Meyer-Hofmeister & Meyer (2014) Meyer-Hofmeister E., Meyer F., 2014, A&A, 562, A142
- Miller-Jones et al. (2012) Miller-Jones J. C. A., et al., 2012, MNRAS, 421, 468
- Mirabel & Rodríguez (1994) Mirabel I. F., Rodríguez L. F., 1994, Nature, 371, 46
- Mirabel et al. (1992) Mirabel I. F., Rodriguez L. F., Cordier B., Paul J., Lebrun F., 1992, Nature, 358, 215
- Mirabel et al. (2011) Mirabel I. F., Dijkstra M., Laurent P., Loeb A., Pritchard J. R., 2011, A&A, 528, A149
- Murphy et al. (2010) Murphy T., et al., 2010, MNRAS, 402, 2403
- Narayan & Yi (1995) Narayan R., Yi I., 1995, ApJ, 452, 710
- Narayan et al. (1996) Narayan R., McClintock J. E., Yi I., 1996, ApJ, 457, 821
- Özel et al. (2010) Özel F., Psaltis D., Narayan R., McClintock J. E., 2010, ApJ, 725, 1918
- Paice et al. (2020) Paice J. A., Belloni T., Motta S., Gandhi P., Rao A., Misra R., Russell D. M., Charles P., 2020, The Astronomer’s Telegram, 13447, 1
- Parikh et al. (2019) Parikh A. S., Russell T. D., Wijnands R., Miller-Jones J. C. A., Sivakoff G. R., Tetarenko A. J., 2019, ApJ, 878, L28
- Partridge et al. (2016) Partridge B., López-Caniego M., Perley R. A., Stevens J., Butler B. J., Rocha G., Walter B., Zacchei A., 2016, ApJ, 821, 61
- Peacock (1983) Peacock J. A., 1983, MNRAS, 202, 615
- Pe’er & Markoff (2012) Pe’er A., Markoff S., 2012, ApJ, 753, 177
- Pietka et al. (2015) Pietka M., Fender R. P., Keane E. F., 2015, MNRAS, 446, 3687
- Plotkin et al. (2013) Plotkin R. M., Gallo E., Jonker P. G., 2013, ApJ, 773, 59
- Plotkin et al. (2017) Plotkin R. M., et al., 2017, ApJ, 848, 92
- Ponti et al. (2012) Ponti G., Fender R. P., Begelman M. C., Dunn R. J. H., Neilsen J., Coriat M., 2012, MNRAS, 422, L11
- Pringle et al. (1973) Pringle J. E., Rees M. J., Pacholczyk A. G., 1973, A&A, 29, 179
- Rao et al. (2019) Rao A., Paice J. A., Russell D. M., Gand hi P., Motta S., Lewis F., Misra R., Buckley D. A., 2019, The Astronomer’s Telegram, 13113, 1
- Reis et al. (2012) Reis R. C., Miller J. M., Reynolds M. T., Fabian A. C., Walton D. J., 2012, ApJ, 751, 34
- Remillard & McClintock (2006) Remillard R. A., McClintock J. E., 2006, ARA&A, 44, 49
- Reynolds et al. (2014) Reynolds M. T., Reis R. C., Miller J. M., Cackett E. M., Degenaar N., 2014, MNRAS, 441, 3656
- Rushton et al. (2017) Rushton A. P., et al., 2017, MNRAS, 468, 2788
- Russell et al. (2013) Russell D. M., et al., 2013, MNRAS, 429, 815
- Russell et al. (2014) Russell T. D., Soria R., Miller-Jones J. C. A., Curran P. A., Markoff S., Russell D. M., Sivakoff G. R., 2014, MNRAS, 439, 1390
- Russell et al. (2015) Russell T. D., et al., 2015, MNRAS, 450, 1745
- Russell et al. (2017) Russell D. M., Lewis F., Gandhi P., 2017, The Astronomer’s Telegram, 10797, 1
- Russell et al. (2019a) Russell D. M., et al., 2019a, Astronomische Nachrichten, 340, 278
- Russell et al. (2019b) Russell T. D., et al., 2019b, ApJ, 883, 198
- Sadler et al. (2006) Sadler E. M., et al., 2006, MNRAS, 371, 898
- Shahbaz et al. (2013) Shahbaz T., Russell D. M., Zurita C., Casares J., Corral-Santana J. M., Dhillon V. S., Marsh T. R., 2013, MNRAS, 434, 2696
- Shibata & Uchida (1987) Shibata K., Uchida Y., 1987, PASJ, 39, 559
- Sidoli et al. (2011) Sidoli L., Paizis A., Mereghetti S., Götz D., Del Santo M., 2011, MNRAS, 415, 2373
- Sobolewska et al. (2011) Sobolewska M. A., Papadakis I. E., Done C., Malzac J., 2011, MNRAS, 417, 280
- Soleri et al. (2013) Soleri P., et al., 2013, MNRAS, 429, 1244
- Sood & Campbell-Wilson (1994) Sood R., Campbell-Wilson D., 1994, IAU Circ., 6006, 1
- Sturner & Shrader (2005) Sturner S. J., Shrader C. R., 2005, ApJ, 625, 923
- Tetarenko et al. (2015) Tetarenko A. J., et al., 2015, ApJ, 805, 30
- Tetarenko et al. (2016) Tetarenko B. E., Sivakoff G. R., Heinke C. O., Gladstone J. C., 2016, VizieR Online Data Catalog, p. J/ApJS/222/15
- Tetarenko et al. (2017) Tetarenko A. J., et al., 2017, MNRAS, 469, 3141
- Tetarenko et al. (2018) Tetarenko A. J., Freeman P., Rosolowsky E. W., Miller-Jones J. C. A., Sivakoff G. R., 2018, MNRAS, 475, 448
- Tetarenko et al. (2019a) Tetarenko A. J., et al., 2019a, MNRAS, 482, 2950
- Tetarenko et al. (2019b) Tetarenko A. J., Casella P., Miller-Jones J. C. A., Sivakoff G. R., Tetarenko B. E., Maccarone T. J., Gand hi P., Eikenberry S., 2019b, MNRAS, 484, 2987
- Tetarenko et al. (2020) Tetarenko A. J., Rosolowsky E. W., Miller-Jones J. C. A., Sivakoff G. R., 2020, MNRAS, 497, 3504
- Tingay et al. (1995) Tingay S. J., et al., 1995, Nature, 374, 141
- Vahdat Motlagh et al. (2019) Vahdat Motlagh A., Kalemci E., Maccarone T. J., 2019, MNRAS, 485, 2744
- Vaughan et al. (2003) Vaughan S., Edelson R., Warwick R. S., Uttley P., 2003, MNRAS, 345, 1271
- Verner et al. (1996) Verner D. A., Ferland G. J., Korista K. T., Yakovlev D. G., 1996, ApJ, 465, 487
- Wang et al. (2020) Wang J., et al., 2020, ApJ, 899, 44
- Wijnands & Miller (2002) Wijnands R., Miller J. M., 2002, ApJ, 564, 974
- Williams et al. (2020) Williams D. R. A., et al., 2020, MNRAS, 491, L29
- Wilms et al. (2000) Wilms J., Allen A., McCray R., 2000, ApJ, 542, 914
- Wu & Gu (2008) Wu Q., Gu M., 2008, ApJ, 682, 212
- Yan et al. (2020) Yan Z., Xie F.-G., Zhang W., 2020, ApJ, 889, L18
- Yuan & Cui (2005) Yuan F., Cui W., 2005, ApJ, 629, 408
- Yuan & Narayan (2014) Yuan F., Narayan R., 2014, ARA&A, 52, 529
- Zdziarski et al. (2004) Zdziarski A. A., Gierliński M., Mikołajewska J., Wardziński G., Smith D. M., Harmon B. A., Kitamoto S., 2004, MNRAS, 351, 791
- Zdziarski et al. (2019) Zdziarski A. A., Ziółkowski J., Mikołajewska J., 2019, MNRAS, 488, 1026
- Zhou et al. (2013) Zhou J. N., Liu Q. Z., Chen Y. P., Li J., Qu J. L., Zhang S., Gao H. Q., Zhang Z., 2013, MNRAS, 431, 2285
- in’t Zand et al. (2002) in’t Zand J. J. M., Miller J. M., Oosterbroek T., Parmar A. N., 2002, A&A, 394, 553
Appendix A X-ray observation IDs and fitted parameters
Fitted X-ray parameters and observation identification numbers (obsID) for all Swift-XRT data from the 2013 hard-only outburst (Table 5) and 2018–2019 hard-only flare (Table 6).
| Date | MJD | ObsID | Count rate | Normalisation | Unabsorbed flux | |
|---|---|---|---|---|---|---|
| (0.5 – 10 keV) | (0.5 – 10 keV) | |||||
| erg s-1 cm-2 | ||||||
| 2013–08–06 | 56510 | 00032490012 | 1.21 0.04 | 1.42 0.06 | 0.009 0.001 | 0.81 0.03 |
| 2013–08–07 | 56511 | 00032898001 | 2.84 0.06 | 1.31 0.03 | 0.021 0.001 | 2.05 0.05 |
| 2013–08–08 | 56512 | 00032490013 | 4.07 0.05 | 1.39 0.02 | 0.031 0.001 | 2.78 0.04 |
| 2013–08–09 | 56513 | 00032898002 | 4.53 0.07 | 1.37 0.03 | 0.033 0.001 | 3.06 0.06 |
| 2013–08–10 | 56514 | 00032490014 | 5.77 0.08 | 1.36 0.03 | 0.044 0.001 | 4.05 0.07 |
| 2013–08–12 | 56516 | 00032490015 | 4.63 0.07 | 1.38 0.03 | 0.060 0.002 | 5.44 0.10 |
| 2013–08–15 | 56519 | 00032898005 | 9.60 0.09 | 1.42 0.02 | 0.075 0.001 | 6.49 0.08 |
| 2013–08–19 | 56523 | 00032898006 | 13.90 0.12 | 1.50 0.02 | 0.117 0.002 | 9.22 0.10 |
| 2013–08–21 | 56525 | 00032898007 | 10.54 0.11 | 1.50 0.02 | 0.172 0.003 | 13.51 0.17 |
| 2013–08–24 | 56528 | 00080180002 | 17.39 0.16 | 1.52 0.02 | 0.149 0.003 | 11.55 0.13 |
| 2013–08–27 | 56531 | 00032898010 | 23.55 0.15 | 1.55 0.01 | 0.215 0.003 | 15.95 0.12 |
| 2013–09–02 | 56537 | 00032898013 | 24.49 0.15 | 1.54 0.01 | 0.226 0.003 | 17.00 0.12 |
| 2013–09–08 | 56543 | 00032898016 | 31.42 0.20 | 1.55 0.01 | 0.279 0.004 | 20.75 0.15 |
| 2013–09–14 | 56549 | 00032898019 | 27.09 0.18 | 1.54 0.01 | 0.240 0.003 | 18.12 0.14 |
| 2013–09–22 | 56557 | 00032898023 | 26.27 0.15 | 1.55 0.01 | 0.238 0.003 | 17.75 0.12 |
| 2013–09–28 | 56563 | 00032898026 | 20.61 0.14 | 1.54 0.01 | 0.186 0.003 | 13.95 0.12 |
| 2013–10–06 | 56571 | 00032898030 | 12.74 0.11 | 1.55 0.02 | 0.118 0.002 | 8.77 0.09 |
| 2013–10–12 | 56577 | 00032898033 | 7.56 0.15 | 1.45 0.04 | 0.065 0.002 | 5.41 0.13 |
| 2013–10–18 | 56583 | 00032898036 | 3.34 0.06 | 1.45 0.04 | 0.027 0.001 | 2.29 0.05 |
| Date | MJD | ObsID | Count rate | Normalisation | Unabsorbed flux | |
|---|---|---|---|---|---|---|
| (0.5 – 10 keV) | (0.5 – 10 keV) | |||||
| erg s-1 cm-2 | ||||||
| 2018–11–01 | 58423 | 00032898181 | 0.028 0.004 | 1.65 0.44 | 0.0004 0.0001 | 0.024 0.005 |
| 2019–01–21 | 58504 | 00032898182 | 11.19 0.11 | 1.45 0.02 | 0.089 0.002 | 7.39 0.09 |
| 2019–01–22 | 58505 | 00032898183 | 10.21 0.17 | 1.54 0.03 | 0.085 0.003 | 6.38 0.13 |
| 2019–01–24 | 58507 | 00032898184 | 10.88 0.14 | 1.42 0.02 | 0.084 0.002 | 7.23 0.11 |
| 2019–01–27 | 58510 | 00032898185 | 10.39 0.11 | 1.45 0.02 | 0.083 0.002 | 6.93 0.09 |
| 2019–01–29 | 58512 | 00032898186 | 10.27 0.10 | 1.47 0.02 | 0.096 0.002 | 7.83 0.09 |
| 2019–02-02 | 58516 | 00032898188 | 4.67 0.11 | 1.40 0.04 | 0.091 0.004 | 8.03 0.22 |
| 2019–02–05 | 58519 | 00032898189 | 10.60 0.10 | 1.49 0.02 | 0.085 0.002 | 6.79 0.08 |
| 2019–02–12 | 58526 | 00032898190 | 7.47 0.16 | 1.46 0.04 | 0.071 0.003 | 5.88 0.16 |
| 2019–02–19 | 58533 | 00032898191 | 8.37 0.12 | 1.44 0.03 | 0.065 0.002 | 5.47 0.09 |
| 2019–02–26 | 58540 | 00032898194 | 6.65 0.20 | 1.46 0.06 | 0.052 0.003 | 4.25 0.15 |
| 2019–03–01 | 58543 | 00032898195 | 6.34 0.23 | 1.31 0.07 | 0.044 0.003 | 4.36 0.20 |
| 2019–03–10 | 58552 | 00032898199 | 5.98 0.23 | 1.47 0.08 | 0.046 0.003 | 3.75 0.18 |
| 2019–03–16 | 58558 | 00032898202 | 0.83 0.02 | 1.24 0.05 | 0.038 0.002 | 4.16 0.15 |
| 2019–03–27 | 58569 | 00032898205 | 0.52 0.02 | 1.29 0.06 | 0.033 0.002 | 3.31 0.13 |
| 2019–04–02 | 58575 | 00032898206 | 0.61 0.02 | 1.22 0.06 | 0.021 0.001 | 2.30 0.10 |
| 2019–04–09 | 58582 | 00032898207 | 0.68 0.02 | 1.32 0.05 | 0.023 0.001 | 2.20 0.08 |
| 2019–04–16 | 58589 | 00032898208 | 0.51 0.02 | 1.26 0.08 | 0.014 0.001 | 1.52 0.08 |
| 2019–04–24 | 58597 | 00032898209 | 0.39 0.02 | 1.46 0.11 | 0.013 0.001 | 1.10 0.07 |
| 2019–05–08 | 58611 | 00032898211 | 0.52 0.03 | 1.43 0.10 | 0.006 0.001 | 0.55 0.04 |
| 2019–05–14 | 58617 | 00032898212 | 0.40 0.02 | 1.60 0.11 | 0.005 0.001 | 0.37 0.02 |
Appendix B Radio and sub-mm variability
Intra-observation lightcurves for the ATCA radio (Table LABEL:tab:radio_intra_obs_data and Figure 10) and ALMA sub-mm observations (Table LABEL:tab:submm_intra_obs_data and Figure 11).
| Epoch | MJD | Central frequency | Error | |
|---|---|---|---|---|
| (GHz) | (mJy) | (mJy) | ||
| 2017-09-30 | 58026.20496527777 | 5.5 | 1.112 | 0.034 |
| 58026.20843750001 | 5.5 | 1.124 | 0.035 | |
| 58026.211909722224 | 5.5 | 1.209 | 0.035 | |
| 58026.21538194444 | 5.5 | 1.012 | 0.035 | |
| 58026.21885416666 | 5.5 | 1.265 | 0.035 | |
| 58026.222326388895 | 5.5 | 1.185 | 0.034 | |
| 58026.22579861112 | 5.5 | 1.257 | 0.034 | |
| 58026.34385416666 | 5.5 | 1.244 | 0.034 | |
| 58026.347326388895 | 5.5 | 1.266 | 0.034 | |
| 58026.348715277774 | 5.5 | 1.203 | 0.034 | |
| 58026.20496527777 | 9.0 | 1.174 | 0.028 | |
| 58026.20843750001 | 9.0 | 1.231 | 0.027 | |
| 58026.211909722224 | 9.0 | 1.130 | 0.027 | |
| 58026.21538194444 | 9.0 | 1.114 | 0.027 | |
| 58026.21885416666 | 9.0 | 1.139 | 0.027 | |
| 58026.222326388895 | 9.0 | 1.21 | 0.027 | |
| 58026.22579861112 | 9.0 | 1.274 | 0.027 | |
| 58026.34385416666 | 9.0 | 1.534 | 0.027 | |
| 58026.347326388895 | 9.0 | 1.577 | 0.027 | |
| 58026.348715277774 | 9.0 | 1.661 | 0.027 | |
| 2017-10-05 | 58031.27093750001 | 5.5 | 1.619 | 0.026 |
| 58031.274409722224 | 5.5 | 1.66 | 0.027 | |
| 58031.27788194444 | 5.5 | 1.720 | 0.027 | |
| 58031.28135416666 | 5.5 | 1.770 | 0.027 | |
| 58031.28482638889 | 5.5 | 1.812 | 0.027 | |
| 58031.32649305556 | 5.5 | 1.528 | 0.027 | |
| 58031.32996527777 | 5.5 | 1.560 | 0.027 | |
| 58031.33343750001 | 5.5 | 1.689 | 0.027 | |
| 58031.336909722224 | 5.5 | 1.673 | 0.027 | |
| 58031.34038194444 | 5.5 | 1.745 | 0.027 | |
| 58031.44802083333 | 5.5 | 1.246 | 0.035 | |
| 58031.45149305556 | 5.5 | 1.491 | 0.035 | |
| 58031.45427083333 | 5.5 | 1.293 | 0.036 | |
| 58031.27093750001 | 9.0 | 1.550 | 0.023 | |
| 58031.274409722224 | 9.0 | 1.528 | 0.023 | |
| 58031.27788194444 | 9.0 | 1.527 | 0.023 | |
| 58031.28135416666 | 9.0 | 1.545 | 0.023 | |
| 58031.28482638889 | 9.0 | 1.580 | 0.023 | |
| 58031.32649305556 | 9.0 | 1.534 | 0.024 | |
| 58031.32996527777 | 9.0 | 1.584 | 0.024 | |
| 58031.33343750001 | 9.0 | 1.540 | 0.024 | |
| 58031.336909722224 | 9.0 | 1.588 | 0.024 | |
| 58031.34038194444 | 9.0 | 1.496 | 0.024 | |
| 58031.44802083333 | 9.0 | 1.490 | 0.028 | |
| 58031.45149305556 | 9.0 | 1.450 | 0.028 | |
| 58031.45427083333 | 9.0 | 1.465 | 0.029 | |
| 2017-10-25 | 58051.280428240745 | 5.5 | 2.61 | 0.028 |
| 58051.28390046296 | 5.5 | 2.563 | 0.028 | |
| 58051.2873726852 | 5.5 | 2.397 | 0.028 | |
| 58051.29084490741 | 5.5 | 2.339 | 0.028 | |
| 58051.29431712962 | 5.5 | 2.390 | 0.028 | |
| 58051.405428240745 | 5.5 | 2.353 | 0.038 | |
| 58051.40890046296 | 5.5 | 2.449 | 0.039 | |
| 58051.43667824073 | 5.5 | 2.514 | 0.042 | |
| 58051.44015046296 | 5.5 | 2.144 | 0.043 | |
| 58051.44362268518 | 5.5 | 2.264 | 0.043 | |
| 58051.47140046296 | 5.5 | 2.031 | 0.053 | |
| 58051.4748726852 | 5.5 | 2.007 | 0.055 | |
| 58051.47568287038 | 5.5 | 2.187 | 0.055 | |
| 58051.280428240745 | 9.0 | 3.121 | 0.032 | |
| 58051.28390046296 | 9.0 | 2.992 | 0.032 | |
| 58051.2873726852 | 9.0 | 2.962 | 0.031 | |
| 58051.29084490741 | 9.0 | 2.856 | 0.032 | |
| 58051.29431712962 | 9.0 | 2.895 | 0.031 | |
| 58051.405428240745 | 9.0 | 2.986 | 0.044 | |
| 58051.40890046296 | 9.0 | 3.034 | 0.044 | |
| 58051.4748726852 | 9.0 | 3.155 | 0.057 | |
| 58051.47568287038 | 9.0 | 3.045 | 0.058 | |
| 2017-11-02 | 58059.889918981484 | 5.5 | 2.386 | 0.109 |
| 58059.89339120369 | 5.5 | 2.712 | 0.104 | |
| 58059.89628472223 | 5.5 | 2.581 | 0.101 | |
| 58059.889918981484 | 9.0 | 2.976 | 0.101 | |
| 58059.89339120369 | 9.0 | 3.283 | 0.096 | |
| 58059.89628472223 | 9.0 | 3.457 | 0.094 | |
| 2017-11-23 | 58080.242581018516 | 5.5 | 4.293 | 0.045 |
| 58080.246053240735 | 5.5 | 4.414 | 0.045 | |
| 58080.259942129625 | 5.5 | 4.102 | 0.048 | |
| 58080.263414351844 | 5.5 | 3.638 | 0.048 | |
| 58080.26480324073 | 5.5 | 3.48 | 0.047 | |
| 58080.242581018516 | 9.0 | 4.178 | 0.039 | |
| 58080.246053240735 | 9.0 | 3.501 | 0.039 | |
| 58080.259942129625 | 9.0 | 3.282 | 0.041 | |
| 58080.263414351844 | 9.0 | 3.120 | 0.040 | |
| 58080.26480324073 | 9.0 | 3.028 | 0.040 | |
| 2017-12-03 | 58090.814340277764 | 5.5 | 4.363 | 0.145 |
| 58090.81781249999 | 5.5 | 4.399 | 0.141 | |
| 58090.84142361111 | 5.5 | 5.209 | 0.111 | |
| 58090.814340277764 | 9.0 | 3.914 | 0.106 | |
| 58090.81781249999 | 9.0 | 4.978 | 0.104 | |
| 58090.84142361111 | 9.0 | 4.870 | 0.186 | |
| 2017-12-16 | 58103.89547453704 | 5.5 | 4.941 | 0.057 |
| 58103.898946759255 | 5.5 | 4.935 | 0.057 | |
| 58103.93366898148 | 5.5 | 4.833 | 0.051 | |
| 58103.93714120369 | 5.5 | 4.696 | 0.051 | |
| 58103.938298611116 | 5.5 | 4.781 | 0.051 | |
| 58103.89547453704 | 9.0 | 5.235 | 0.048 | |
| 58103.898946759255 | 9.0 | 5.241 | 0.048 | |
| 58103.93366898148 | 9.0 | 5.133 | 0.046 | |
| 58103.93714120369 | 9.0 | 4.901 | 0.045 | |
| 58103.938298611116 | 9.0 | 4.937 | 0.045 | |
| 2018-01-05 | 58123.838530092595 | 5.5 | 4.476 | 0.053 |
| 58123.842002314814 | 5.5 | 4.334 | 0.052 | |
| 58123.91144675926 | 5.5 | 4.902 | 0.046 | |
| 58123.914918981485 | 5.5 | 4.912 | 0.045 | |
| 58123.915960648155 | 5.5 | 4.943 | 0.045 | |
| 58123.838530092595 | 9.0 | 4.696 | 0.045 | |
| 58123.842002314814 | 9.0 | 4.757 | 0.045 | |
| 58123.91144675926 | 9.0 | 5.843 | 0.041 | |
| 58123.914918981485 | 9.0 | 5.676 | 0.040 | |
| 58123.915960648155 | 9.0 | 5.719 | 0.040 | |
| 2018-01-27 | 58145.992002314815 | 5.5 | 1.641 | 0.04 |
| 58145.99547453704 | 5.5 | 1.588 | 0.04 | |
| 58146.04755787037 | 5.5 | 1.662 | 0.043 | |
| 58146.05103009259 | 5.5 | 1.670 | 0.043 | |
| 58146.05450231481 | 5.5 | 1.652 | 0.044 | |
| 58146.200335648144 | 5.5 | 1.168 | 0.075 | |
| 58146.203460648154 | 5.5 | 1.077 | 0.075 | |
| 58145.992002314815 | 9.0 | 1.659 | 0.037 | |
| 58145.99547453704 | 9.0 | 1.534 | 0.038 | |
| 58146.04755787037 | 9.0 | 1.591 | 0.040 | |
| 58146.05103009259 | 9.0 | 1.580 | 0.041 | |
| 58146.05450231481 | 9.0 | 1.595 | 0.041 | |
| 58146.200335648144 | 9.0 | 1.353 | 0.063 | |
| 58146.203460648154 | 9.0 | 0.934 | 0.063 |
| MJD | Central frequency | Error | |
|---|---|---|---|
| (GHz) | (mJy) | (mJy) | |
| 58031.891377314816 | 233.0 | 3.04 | 0.16 |
| 58031.89172453704 | 233.0 | 3.11 | 0.27 |
| 58031.89207175926 | 233.0 | 2.12 | 0.12 |
| 58031.89241898148 | 233.0 | 2.21 | 0.14 |
| 58031.8927662037 | 233.0 | 2.07 | 0.29 |
| 58031.893113425926 | 233.0 | 1.52 | 0.14 |
| 58031.89346064815 | 233.0 | 1.95 | 0.17 |
| 58031.89380787037 | 233.0 | 2.38 | 0.18 |
| 58031.894155092596 | 233.0 | 2.43 | 0.14 |
| 58031.89450231481 | 233.0 | 3.18 | 0.26 |
| 58031.89519675926 | 233.0 | 2.61 | 0.19 |
| 58031.89554398148 | 233.0 | 1.96 | 0.14 |
| 58031.895891203705 | 233.0 | 2.01 | 0.29 |
| 58031.89623842593 | 233.0 | 1.33 | 0.12 |
| 58031.896585648145 | 233.0 | 1.32 | 0.14 |
| 58031.89693287037 | 233.0 | 1.41 | 0.24 |
| 58031.89728009259 | 233.0 | 1.22 | 0.12 |
| 58031.897627314815 | 233.0 | 1.03 | 0.18 |
| 58031.89832175926 | 233.0 | 1.05 | 0.22 |
| 58031.89866898148 | 233.0 | 1.00 | 0.13 |
| 58031.8990162037 | 233.0 | 1.76 | 0.19 |
| 58031.89971064815 | 233.0 | 1.03 | 0.19 |
| 58031.90005787037 | 233.0 | 1.76 | 0.14 |
| 58031.900405092594 | 233.0 | 1.98 | 0.22 |
| 58031.90075231481 | 233.0 | 1.42 | 0.14 |
| 58031.90109953703 | 233.0 | 1.65 | 0.19 |
| 58031.90144675926 | 233.0 | 0.99 | 0.15 |
| 58031.90179398148 | 233.0 | 1.19 | 0.12 |
| 58031.902141203704 | 233.0 | 1.17 | 0.35 |
| 58031.90248842593 | 233.0 | 2.79 | 0.14 |
| 58031.90283564815 | 233.0 | 3.99 | 0.17 |
| 58031.90353009259 | 233.0 | 4.70 | 0.19 |
| 58031.90422453704 | 233.0 | 2.85 | 0.25 |
| 58031.90457175926 | 233.0 | 2.46 | 0.14 |
| 58031.90491898148 | 233.0 | 1.29 | 0.27 |
| 58031.90526620371 | 233.0 | 1.62 | 0.14 |
| 58031.90561342592 | 233.0 | 1.37 | 0.15 |
| 58031.90630787037 | 233.0 | 1.96 | 0.25 |
| 58031.90665509259 | 233.0 | 1.43 | 0.13 |
| 58031.907002314816 | 233.0 | 1.20 | 0.18 |
| 58031.90734953704 | 233.0 | 2.03 | 0.16 |
| 58031.907696759255 | 233.0 | 2.61 | 0.14 |
| 58031.90804398148 | 233.0 | 3.06 | 0.30 |
| 58031.908738425926 | 233.0 | 3.06 | 0.16 |
| 58031.90908564815 | 233.0 | 3.80 | 0.19 |
| 58031.90943287037 | 233.0 | 4.34 | 0.19 |
| 58031.90978009259 | 233.0 | 2.32 | 0.15 |
| 58031.91012731481 | 233.0 | 2.45 | 0.30 |
| 58031.910474537035 | 233.0 | 1.86 | 0.16 |
| 58031.910787037035 | 233.0 | 2.12 | 0.14 |
| 58031.9200462963 | 145.0 | 0.90 | 0.13 |
| 58031.920393518514 | 145.0 | 0.81 | 0.25 |
| 58031.92074074074 | 145.0 | 1.36 | 0.13 |
| 58031.92108796296 | 145.0 | 1.28 | 0.12 |
| 58031.921435185184 | 145.0 | 1.07 | 0.29 |
| 58031.92178240741 | 145.0 | 1.30 | 0.12 |
| 58031.92212962963 | 145.0 | 1.28 | 0.17 |
| 58031.92282407408 | 145.0 | 2.25 | 0.24 |
| 58031.923171296294 | 145.0 | 2.58 | 0.13 |
| 58031.92351851852 | 145.0 | 2.07 | 0.27 |
| 58031.92386574074 | 145.0 | 2.12 | 0.14 |
| 58031.924212962964 | 145.0 | 2.13 | 0.20 |
| 58031.92456018519 | 145.0 | 1.09 | 0.18 |
| 58031.92490740741 | 145.0 | 1.83 | 0.14 |
| 58031.92525462963 | 145.0 | 2.05 | 0.22 |
| 58031.92560185185 | 145.0 | 3.00 | 0.22 |
| 58031.92594907407 | 145.0 | 2.32 | 0.39 |
| 58031.92664351852 | 145.0 | 3.55 | 0.17 |
| 58031.92699074074 | 145.0 | 3.47 | 0.21 |
| 58031.92768518518 | 145.0 | 2.83 | 0.20 |
| 58031.928032407406 | 145.0 | 2.36 | 0.13 |
| 58031.92837962963 | 145.0 | 1.88 | 0.22 |
| 58031.92872685185 | 145.0 | 1.53 | 0.14 |
| 58031.929074074076 | 145.0 | 1.63 | 0.13 |
| 58031.93011574074 | 145.0 | 2.46 | 0.14 |
| 58031.93046296296 | 145.0 | 1.58 | 0.24 |
| 58031.930810185186 | 145.0 | 1.26 | 0.14 |
| 58031.93115740741 | 145.0 | 2.07 | 0.12 |
| 58031.931504629625 | 145.0 | 3.50 | 0.34 |
| 58031.93185185185 | 145.0 | 4.11 | 0.15 |
| 58031.93219907407 | 145.0 | 3.03 | 0.17 |
| 58031.932546296295 | 145.0 | 4.05 | 0.52 |
| 58031.9327199074 | 145.0 | 2.98 | 0.17 |
| 58031.95130787037 | 97.5 | 2.16 | 0.10 |
| 58031.951655092584 | 97.5 | 1.87 | 0.19 |
| 58031.95200231481 | 97.5 | 1.85 | 0.10 |
| 58031.95234953703 | 97.5 | 1.83 | 0.10 |
| 58031.952696759254 | 97.5 | 1.58 | 0.17 |
| 58031.95304398148 | 97.5 | 1.98 | 0.09 |
| 58031.9533912037 | 97.5 | 1.56 | 0.13 |
| 58031.95408564815 | 97.5 | 2.11 | 0.18 |
| 58031.95443287036 | 97.5 | 2.19 | 0.10 |
| 58031.95478009259 | 97.5 | 2.14 | 0.14 |
| 58031.95512731481 | 97.5 | 1.43 | 0.13 |
| 58031.95547453703 | 97.5 | 1.66 | 0.10 |
| 58031.95582175926 | 97.5 | 1.91 | 0.20 |
| 58031.95616898148 | 97.5 | 1.56 | 0.09 |
| 58031.956516203696 | 97.5 | 1.41 | 0.09 |
| 58031.95721064814 | 97.5 | 1.70 | 0.22 |
| 58031.957557870366 | 97.5 | 2.40 | 0.10 |
| 58031.95790509259 | 97.5 | 2.57 | 0.12 |
| 58031.958599537036 | 97.5 | 2.85 | 0.21 |
| 58031.95894675926 | 97.5 | 2.28 | 0.11 |
| 58031.95929398148 | 97.5 | 1.72 | 0.12 |
| 58031.959641203706 | 97.5 | 1.57 | 0.12 |
| 58031.95998842592 | 97.5 | 1.40 | 0.11 |
| 58031.96068287037 | 97.5 | 1.48 | 0.18 |
| 58031.96103009259 | 97.5 | 1.26 | 0.10 |
| 58031.961377314816 | 97.5 | 1.40 | 0.24 |
| 58031.961527777785 | 97.5 | 1.91 | 0.14 |