Conformity: a Path-Aware Homophily measure for Node-Attributed Networks
Abstract
Unveil the homophilic/heterophilic behaviors that characterize the wiring patterns of complex networks is an important task in social network analysis, often approached studying the assortative mixing of node attributes. Recent works underlined that a global measure to quantify node homophily necessarily provides a partial, often deceiving, picture of the reality. Moving from such literature, in this work, we propose a novel measure, namely Conformity, designed to overcome such limitation by providing a node-centric quantification of assortative mixing patterns. Differently from the measures proposed so far, Conformity is designed to be path-aware, thus allowing for a more detailed evaluation of the impact that nodes at different degrees of separations have on the homophilic embeddedness of a target. Experimental analysis on synthetic and real data allowed us to observe that Conformity can unveil valuable insights from node-attributed graphs.
Keywords Homophily Attributed Networks Mixing Patterns
1 Introduction
During the last decades, network science has become one of the fastest growing multidisciplinary research fields. Every year, countless researchers, from heterogeneous backgrounds, leverage network theory to analyze complex data describing alternative facets of real world phenomena. From sociology to biology, more and more domains study entities composed of several components - each having its internal complexity and peculiar functionalities - all of them strictly tied in functional relationships. Such complex organizations can naturally be modeled as networks, and as such, analyzed. While reasoning on networks built on top of contextual data, topology is only one of the aspects to take into account: nodes and edges often carry additional semantic information that are of uttermost importance to properly understand the phenomena expressed by the underlying topological structure. Often, such augmented structures are referred to as Feature-rich networks [1]. That general term acts as an umbrella for several, more specific, class of network extensions including temporal as well as probabilistic and attributed (or labeled) networks. In this work, we are particularly interested in labeled or node-attributed networks, where reliable external information is added to the nodes as categorical or numerical attributes. Node-attributed graphs are a quite expressive model of social network environments since several salient dimensions (age, gender, nationality…) can be meaningfully studied by leveraging such a framework.
Indeed, one of the salient aspects that makes network science a widespread research methodology is its ability to unveil emergent behaviors of complex systems. Network topology is, perhaps, the clearest example of how the overall complexity of a whole system is more than the sum of the coupled interactions among its components. Several modeling works have shown how some universal network properties are the results of emergent behaviors: classic examples are the long-tail degree distribution [2] and the meso-scale modular organization [3] that describe complex systems as sparsely connected dense components. Another relevant emerging behavior is homophily. It has been observed that individuals are more likely to group in social circles if they share common features and stay apart when some specificity diverges. Social network analysis has deeply investigated such a phenomenon, trying to measure its impact and propose a mechanistic explanation to its existence. A proxy often used to estimate for homophilic behaviors fall under the name of Newman’s assortativity [4]. Such a measure aims to classify a whole network in a range that goes among two extremes: disassortative mixing, where nodes are likely to be connected if they are anti-correlated w.r.t. a given property, and assortative mixing, where, conversely, nodes are likely to be connected if they share a given property. Assortativity has been widely studied and applied to characterize several phenomena such as degree correlation and node-attribute correlations. One of the major drawbacks of such a measure, and similar ones, lies in its definition scale: a complex behavior is summarized in a single, average, score. Recently, a few works [5] tried to overcome such limitation by proposing a multiscale extension of Newman’s assortativity, thus allowing to analyze multimodal behaviors that the original score makes impossible to observe (e.g., identifying different, even conflicting, homophilic/heterophilic behaviors within the same complex system).
In this work, we move from such a line of research, proposing an alternative proxy for measuring multiscale node homophilic couplings: Conformity, a node-centric path-aware measure, able to unveil heterogeneous mixing patterns in node-attributed networks, designed to cope with categorical (single and multi)-attributes. Inspired by a higher-order assortativity definition, namely the clumpiness score [6], Conformity takes into consideration the evidence that nodes with similar characteristics are not divided by long chains. Experimental results carried out on real world node-attributed networks underline that Conformity allows to study homophilic patterns from a novel point of view and make valuable inference on the social contexts it is applied to.
The work is organized as follows. Section 2 introduces the relevant literature to frame the proposed contribution; Section 3 formally introduces Conformity; Section 4 discusses experimental results obtained applying Conformity to synthetic as well as real-world data. Finally, Section 5 concludes the paper.
2 Related
Literature defines social homophily as the tendency of people to interact with similar others in respect of dimensions such as age, gender, education, as well as values, attitudes, and political beliefs, sourced by geographical distances, households, workplaces, and universal human cognitive processes [7]. Hidden social dynamics can be unveiled studying homophily as well as heterophily among people: in the presence of segregation, interracial friendships are less probable when social class is correlated with race [8]; in the early school grades, boys tend to form larger and more heterogeneous cliques compared to the smaller and more homogeneous cliques of girls [9]; intergroup mixing is also a key factor in academic success when interdisciplinary research is involved [10]. Such a brief set of examples let us know how both homophily, and its counterpart, act as fundamental principles in the choice of people’s social circles.
In the language of network science, they act as a discriminant factor for node neighborhood selection. Network homophily can refer either to explicit topology (e.g., nodes with a similar degree preferably connect) or to the interactions between nodes sharing similar labels. Newman’s assortativity coefficient [4] is the most known and used measure for quantifying homophily in complex networks. Based on modularity, the coefficient is calculated as the sum of the differences between the observed and the expected fraction of edges between nodes sharing similar values of an attribute. Some recent extensions or alternative approaches, like ProNe [11] or the VA-Index [12], are also able to cope with pairs of attributes or vector of features, shedding light, more than Newman’s coefficient, on the phenomenon of similarity between two or more attributes based on network structure.
Such global and aggregated measures flatten and simplify a heterogeneous context in one only score, and avoid the presence of outliers or different mixing interactions characterizing different zones of networks and perhaps also single nodes. In such scenarios, local or node-centric approaches (able to assign a score to each graph node) should help for quantifying a more reliable and exploitable network description. Since the only direct neighborhood (or ego-network) of nodes can not be taken into consideration due to its limited expressive power (inherited in the scale-free-like degree distribution of complex networks), the issue is to define connectivity boundednesses able to circumscribe those nodes whose importance is fundamental in the assortative attitude measurement of a target one. While some lines of research focused on degree assortativity [13] (extended to cope with higher-order notions of node neighborhood such as a two-walks degree correlation [14] or transsortativity [15]), the node-attributed counterpart of the problem has not received much of attention.
Only a few studies address such a task in this latter scenario. Recent works aimed to study the existence of possible relations among network structure and label distribution among nodes (e.g., how structure and minority size generate perception biases [16]) as well as shed light on the individual differences in mixing (e.g., in the analysis of monophily, a concept aiming to identify those individuals with extreme preferences for different labels [17]). Accordingly, inferring and quantifying individual differences as well as different local mixing comes as a hard task in complex networks studies. A model able to characterize the within-group mean and variation of mixing patterns was recently proposed in the framework of Bayesian inference [18]: when variation is consistently present, the group mean only is not able to fully describe individual node preferences. In some work, locality is exploited through a definition of assortativity based on the correlation between two consecutive nodes visited by a random walker. For instance, this rationale is used in [19], and applied in the graph classification task; a multi-hop assortativity is defined, here, as the probability that a randomly selected node and a randomly selected -hop neighbor belong to the same category, where indicates the time of the visit of the random walker. Closer to the current work, a node-centric and Newman’s-normalized measure, namely Peel’s assortativity [5], was recently proposed in the context of local-aware homophily, modeling similarities between nodes as an autocorrelation of a time-series defined as a sequence of node labels visited by a random walker with restart.
3 Conformity
We aim to design a local proxy to measure the degree of homophilic embeddedness of network nodes w.r.t. the attributes they carry. Such a task has been recently approached by Peel et al. [5] to overcome the limitation of classical approaches that usually propose a single aggregate score to characterize the overall assortativity of network nodes. A multiscale strategy to estimate the presence of homophilic patterns within a complex system enables the discovery of emergent behaviors that classical indexes often are not capable of unveiling. The score proposed in [5] moves from the classical Newman’s assortativity [4] that, in turn, poses its ground on a reinterpretation of the modularity score - a measure often used to quantify the quality of network clustering partitions.
Modularity, , computes the difference between the observed and the expected fraction of edges between nodes sharing similar attribute values: in the assortativity coefficient, , such quantity is normalized in the range . Thus: implies that all edges only connect nodes labeled with the same value; that all edges are randomly connected, and; hypothetically, that all edges only connect nodes with a different value. Formally,
where is the proportion of edges connecting nodes of the same type , and is the sum of degrees () of nodes with type .
Indeed, the approach in [5] yields valuable results; however, it misses a fundamental high-order property of networks: the length of paths connecting nodes.
To address such an issue, we define a novel measure, namely Conformity111Python code available at
https://github.com/GiulioRossetti/conformity.
Given an undirected attributed network , where is the set of nodes, the set of edges among them, and the set of node attributes, Conformity computes the similarity between the attributes of the node with the ones of the other nodes of the network, weighing it with the distance among them. Here, we will focus only on networks with nodes carrying categorical attributes.
To facilitate the introduction of Conformity we need to define a few support functions.
Considering a node we define the set as the set of neighboring nodes at a distance :
| (1) |
Moreover, lets call the indicator function that compares the attribute values of two nodes
| (2) |
and the function that, if among the neighboring nodes of there is at least one node sharing the same attribute value , computes the ratio of ’s neighbors sharing it
| (3) |
where is the first order neighborhood of node , i.e., the set of nodes adjacent to it. Moreover, to assure a consistent interpretation of Conformity, we force to assume values in by setting its value to 1 when its numerator nullifies.
Finally, we define the Conformity score for a node and a given real number in as:
| (4) |
where is , and the parameter controls the level of interaction between nodes, which exponentially decreases while the distances among nodes increase; thus, imposing , we force a linear decrease w.r.t. the distance, while imposes a sublinear decrease which reduces the level of interaction between relatively distant nodes.
Conformity can be algorithmically interpreted as follows.
-
1.
For each node pair , with with the nodes attribute concordance – given by – is weighted by , namely the degree of homophily of the node toward its first order neighborhood;
-
2.
The average of such score aggregated over all the nodes in is then damped by a factor , to account for the distance that separates the nodes considered by the source . Note that we used an inverse power-law distance decay – that recalls well-known physical measures such as the Coulombic and gravitational ones – since such an approach has already proven its consistency in the definition of the clumpiness measure [6], a widely used degree dispersion index.
-
3.
Finally, the computed score is normalized to ensure that Conformity lies in the range .
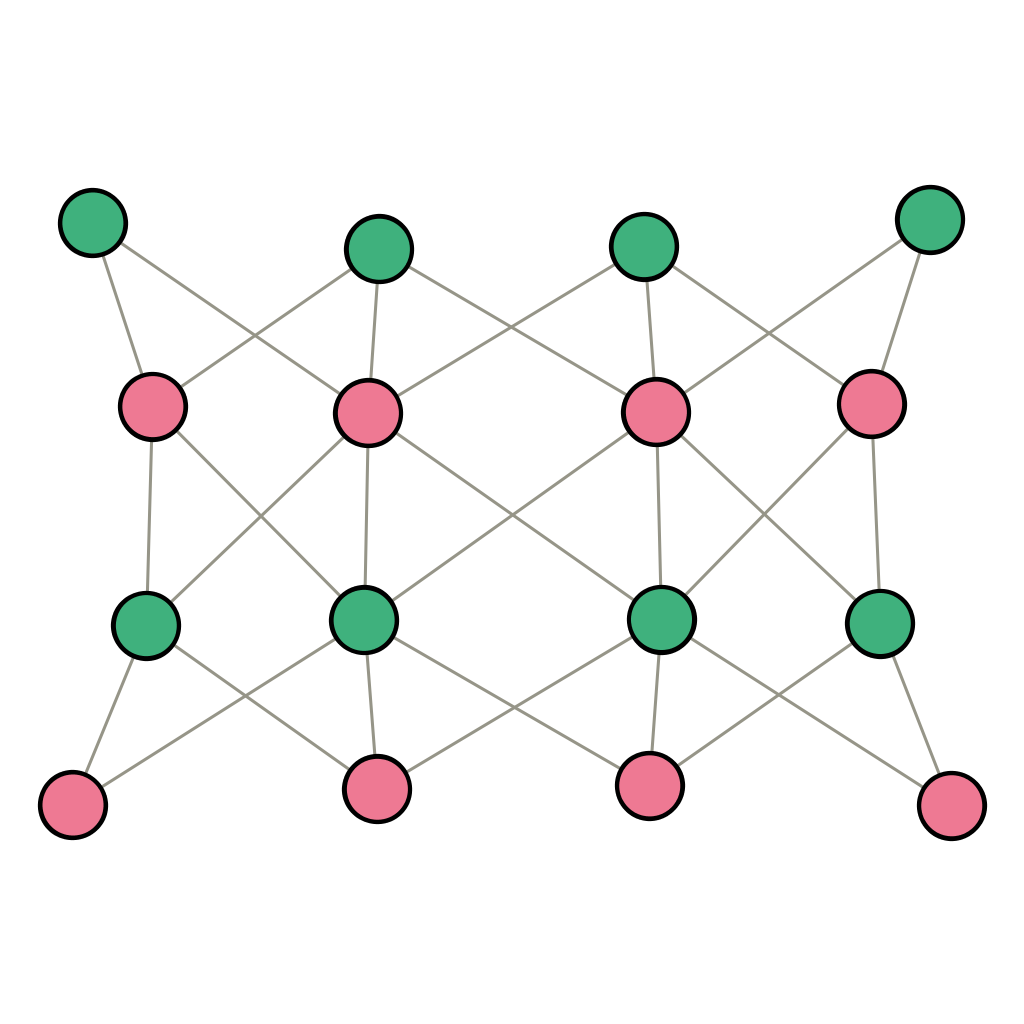
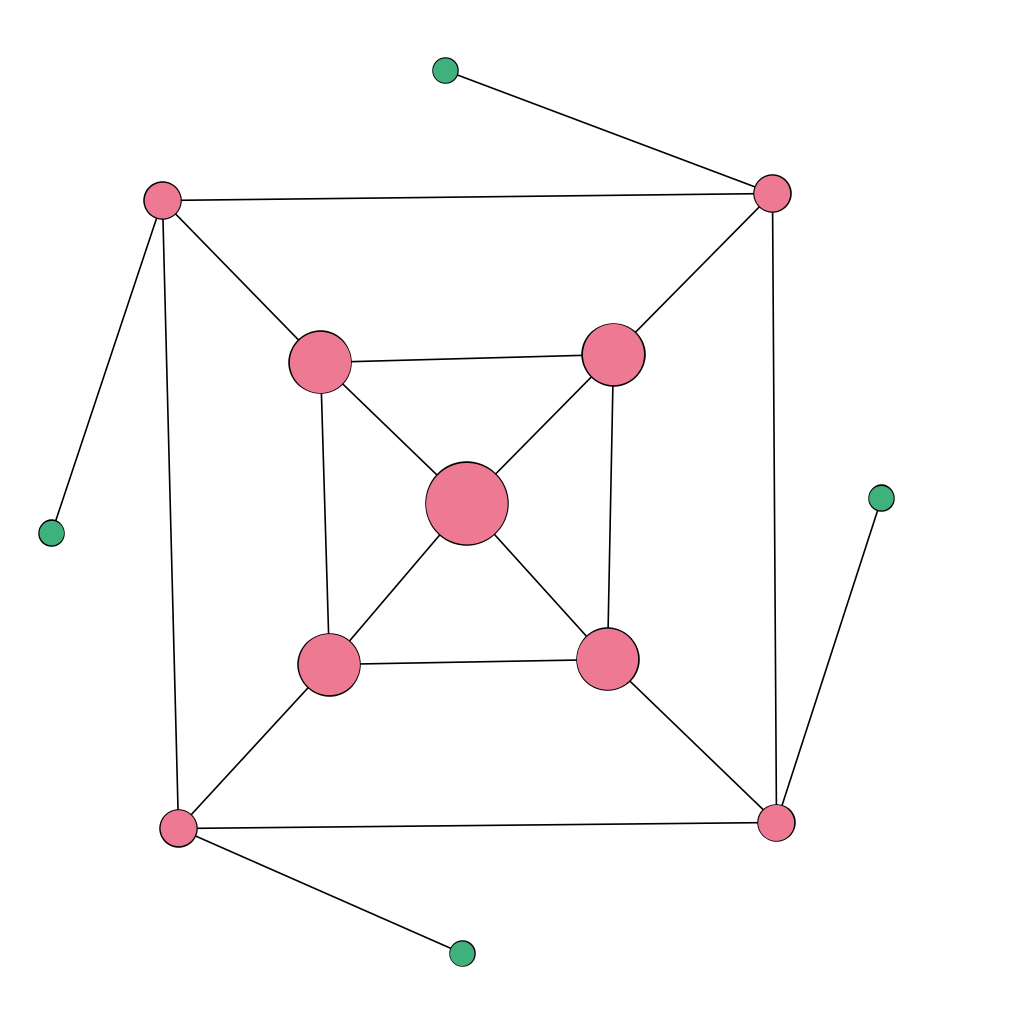
Intuitively, the value of is maximized when a node is surrounded by neighbors having the same attribute value, minimized in the opposite scenario. Fig. 1(a) shows a network whose nodes (colored by their attribute value) always minimize their Conformity value independently from the chosen decay exponent. Such a limit case example perfectly captures the essence of anti-conformity: edges always connect nodes with a different attribute value, resulting in the absence of homophilic islands. Conversely, Fig. 1(b) shows a simple scenario where the length of the paths among nodes sharing different labels plays a crucial role in the Conformity values. We can easily observe how Conformity (coded with the relative node size) tends to decrease moving from the inner layer to the outer ones – e.g., moving from the more homophilic embedded nodes to the more heterophilic ones.
As discussed, Conformity is a node-related measure: we can define the overall degree of Conformity of a network as:
| (5) |
Indeed, such average score is only able to capture a general trend, not to provide a clear picture of the emergent homophilic behaviors at a local level.
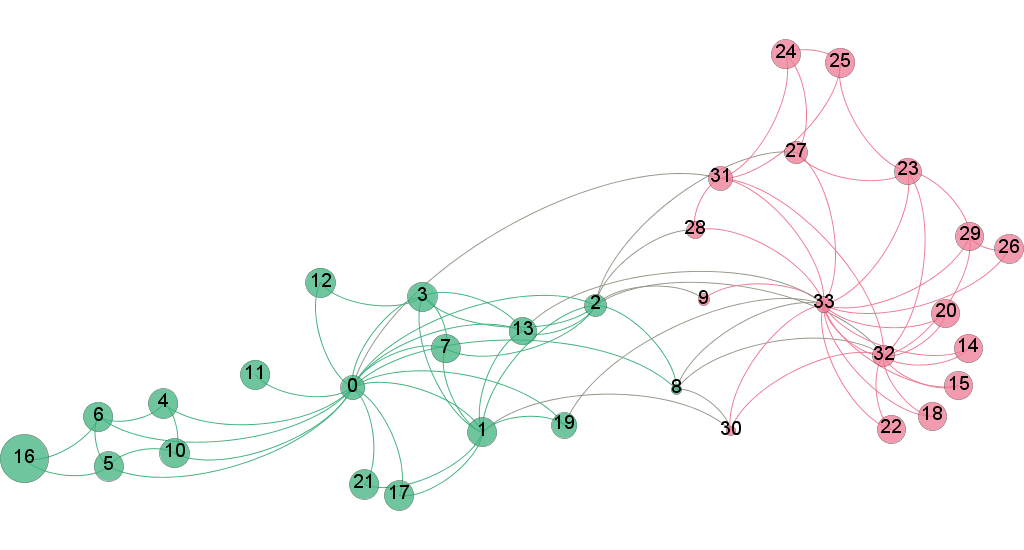
To better understand the information that the proposed measure can unveil, let us consider the classic example offered by Karate Club dataset [20], representing the small social network of a club after a conflict arose between the administrator, “John A.", and an instructor, ‘Mr. Hi". The graph is classically used as a toy example for characterizing community discovery algorithms since it is neatly divided into two factions and very suitable for explaining a clustering methodology. Moreover, since each node is labeled with the club it belongs (“John A." or “Mr. Hi"), this external information is commonly exploited as a ground truth to test the goodness of the algorithm outputs, even if it has been shown not to be a proper approach [21]. In Fig. 1 (c), different colors encode the two categorical node attribute values characterizing the network while, as in the previous example, the node sizes are proportional to the node Conformity score (). As we expected, the highest Conformity values are assigned to those nodes that prevalently connect to same attributed peers while, on the other hand, the lowest ones characterize bridge-nodes. Particular attention must be paid to node 8, which registers the lowest Conformity score (-0.18). Indeed, the data paper that discusses the origin of the Karate Club network dataset [20] help us in providing a neat justification for such Conformity value: node 8 identifies a weak supporter of “Mr. Hi", that joined with the “John A."’s faction, after the split, for personal advantage, so he represents a bridge between the two opposite sides of the Karate Club dispute indeed.
4 Experimental analysis
Studying the homophilic patterns of actors embedded in a network is a way to unveil emergent behaviors that are otherwise hard to identify. In this section, we propose a characterization of both synthetic and real-world networks using the proposed Conformity score.
4.1 Synthetic data
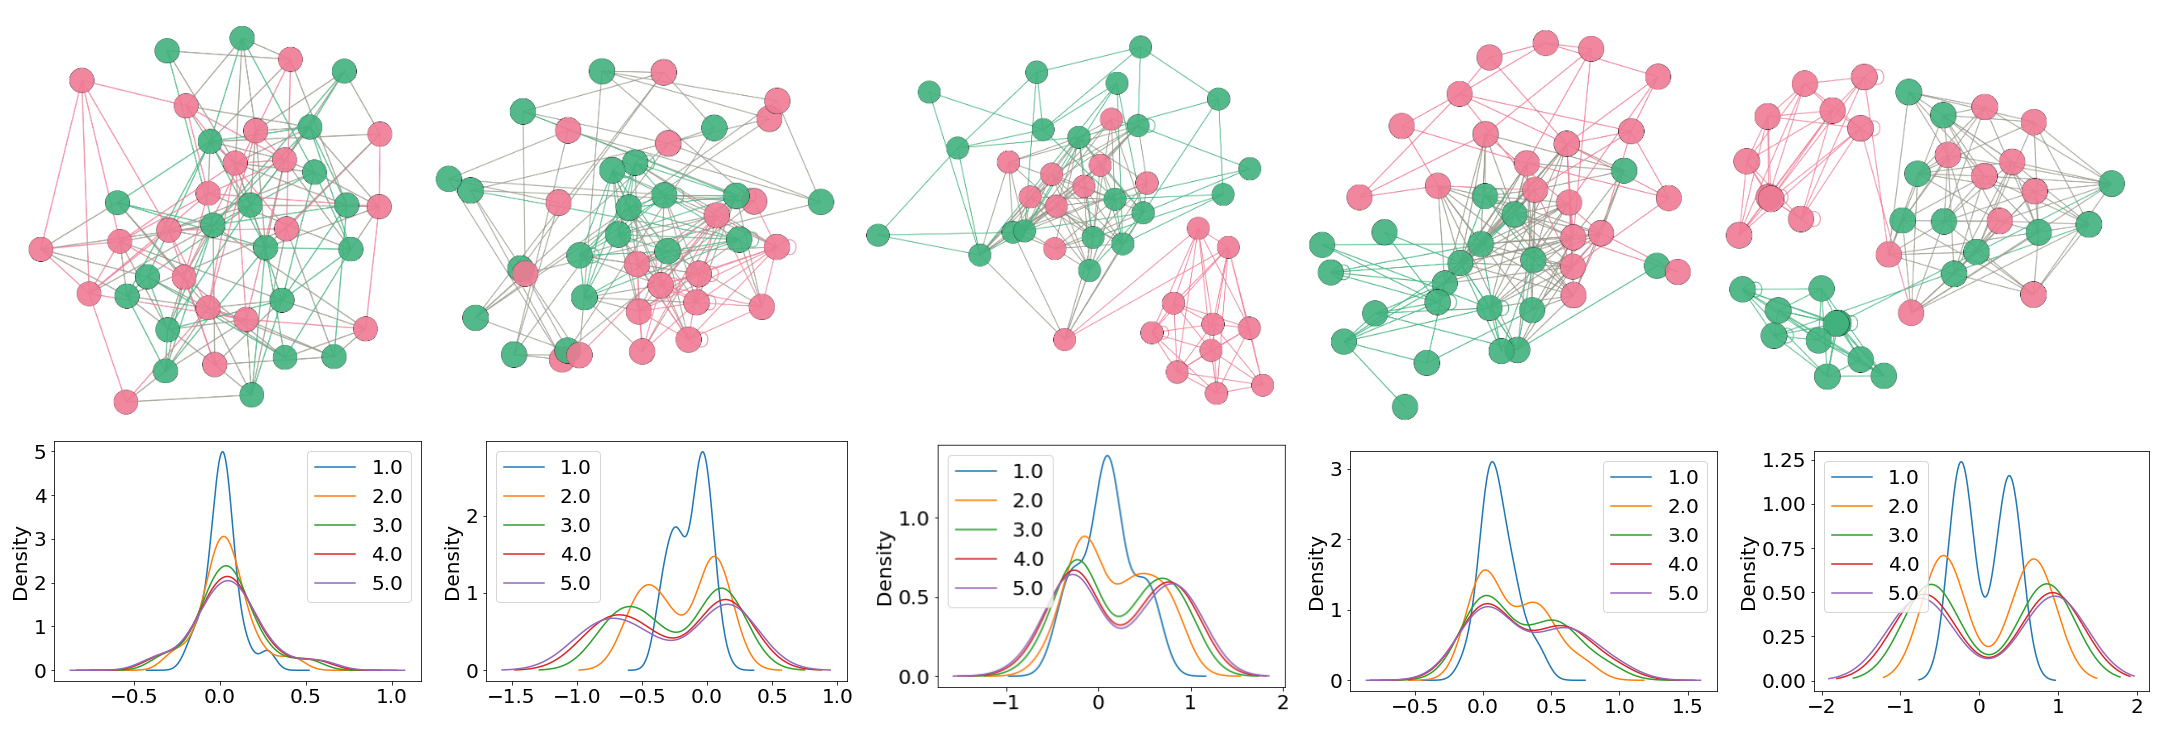
Inspired by the Peel’s quintet [5], in Fig. 2 we replicate the building of a set of five small synthetic graphs with the same number of nodes and edges (40 nodes – 20 red, 20 green – and 160 edges), but involving a rewiring of edges leading to the emergence of different local mixing patterns that Newman’s assortativity coefficient, , is not able to detect (i.e., ). Indeed, Newman’s score is a valid indicator only for the leftmost graph of the figure, the only one where all edges are randomly rewired across all nodes. This is showed by the unimodal distribution in the Conformity plot for (a). In contrast, other plots reflect and capture the heterogeneous patterns obtained by planting homophilic relations among nodes: in such scenarios, the unimodal distribution breaks down into bimodal ones – e.g., the twin peaks observed for the rightmost graph describe the most extreme case where exactly half the nodes is perfectly homogeneous; in contrast, the other half is entirely heterogeneous.
An aspect worth noticing is the effect played by the parameter on the values. As discussed, the exponent allows tuning Conformity sensitivity w.r.t. the distance among node pairs. For , all nodes are perceived at the same distance from the source node, thus contributing equally to its final score; for , the contribution of nodes is weighted w.r.t. their distance, and progressively dumped while increasing such value. The effect of increasing , as shown by the KDEs distributions in Fig. 2, is to concentrate the actual contribution to low-distance neighborhoods, thus favoring a polarization of the scores to the extreme values of the domain. Indeed, there is no one-fits-all value for such parameter: it needs to be fitted to the analytical needs and the underlying network topology.
4.2 Real data
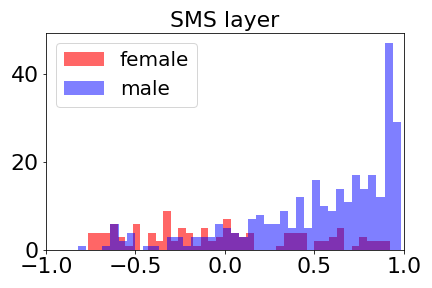
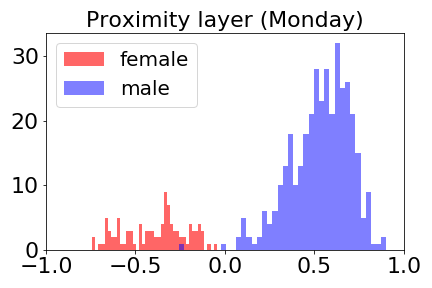
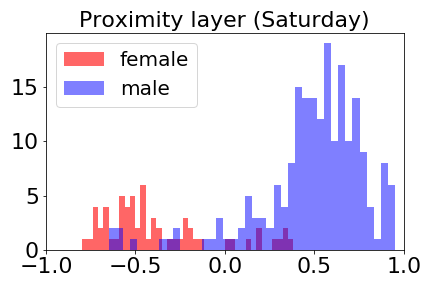
Copenhagen Network Study. We firstly consider a small real-world network, namely the interaction data from Copenhagen Network Study [22]. It is composed of different layers connecting a sample of 700 among male and female university students for four weeks: we consider, here, the SMS layer and the proximity estimated via Bluetooth signal strength. Since information about node gender is available, we mainly aim to relate a characterization of the network based on Conformity to some of the analysis already shown in the original data paper, e.g., more frequent male-male interaction than male-female and female-female ones [22]. Since the underlying network reflects these frequencies, we describe homophily by gender leveraging Conformity, trying to give more insights than the only number of exchanged messages. Fig. 3 shows that several male nodes are perfectly homophilic w.r.t. gender, but also that there exist a few highly heterophilic ones among them. The same (i.e., the same mixing pattern) is not true observing female node Conformity distribution, even taking into account the fact that the two populations are unbalanced. Considering the proximity layer, we show the graph analysis of two days, namely Monday and Saturday. Fig. 3(b-c) underlines how different mixing patterns arise considering different days of the week.
Facebook100. Facebook100 [23] is a collection of 100 Facebook friendships networks among 100 U.S. colleges, built during the early history of the social network. Nodes are labeled with several categorical attributes, profiling people by gender, college year, dormitory…In the following, we will focus on the first 50 networks ordered by size, considering two single-attributes analyses - namely gender and college year - and a multi-attribute overview. Be aware that the gender attribute yields three values, referring to male, female and missing information; quoting the original data paper, we use a “missing" label for situations in which individuals did not volunteer a particular characteristic [23], namely that the individual itself does not specify his gender.
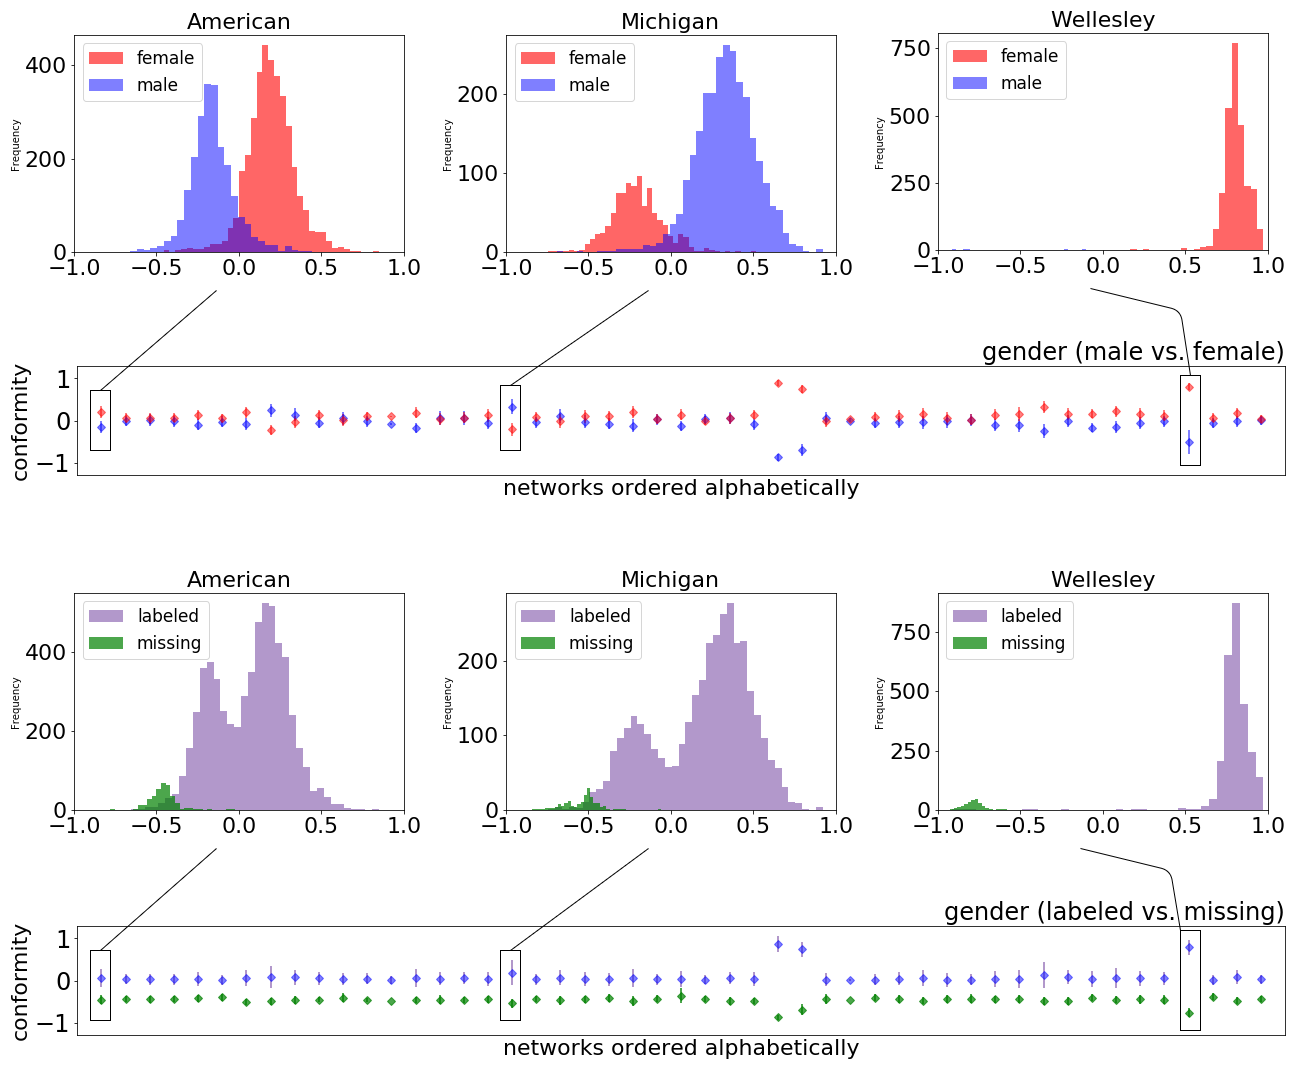
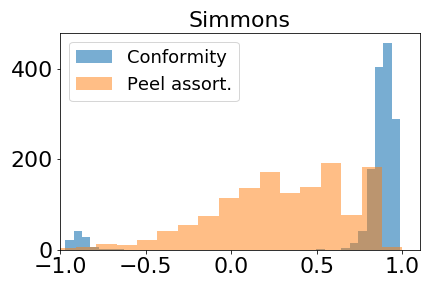
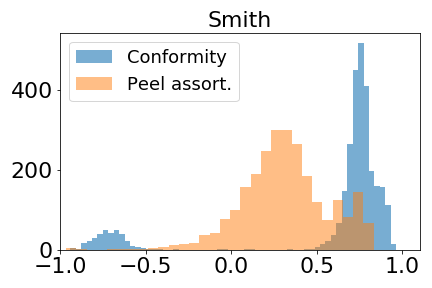
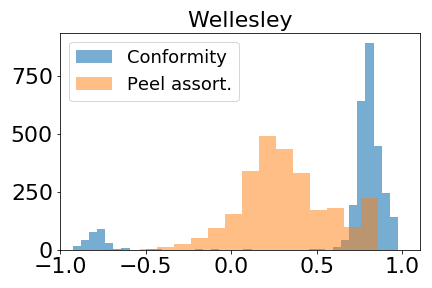
Gender. Fig. 4 shows gender assortativity of the 50 selected networks. In general, we can not state a male/female tendency to homophily/heterophily as a common behavior across all networks; even if it seems that females’ average behavior is more assortative than males, this should be examined on a case-by-case basis. Nevertheless, for the work, it is more interesting to focus on the scoring of three specific networks, whose male and female homophilic behaviors are different w.r.t. the other colleges.
They are Simmons, Smith and Wellesley, whose distributions are also highlighted in Fig. 5, in view of a comparison with Peel’s assortativity [5] 222This other measure has also a parameter , which is integrated over all its possible values in the paper where it is defined and presented [5]: we replicated the same approach for the comparison in the current study.. First of all, referring to the analysis present in the original data paper [23], they are three predominantly female colleges whose Newman’s assortativity coefficient tends to 0. Leveraging Conformity, we can observe (Fig. 4) how i) the few male nodes connect disassortatively by gender (i.e., form ties only with females), inducing the emergence of two extreme and distinct mixing, and meanwhile ii) we observe some differences with Peel’s assortativity, where the same overall strong assortative behavior of the networks is not maintained (Fig. 5). Apparently, the extreme disassortative behavior of few nodes should not so strongly affect the entire network mixing. Since a real comparison between the two measures is not possible i) due to the absence of ground truth, but mostly because ii) they capture different aspects of mixing, our interpretation is that the local assortativity variant we face suffers from the same limits about network constraints impacting on the reaching of the whole measure range, as already studied in [24].
Also, the presence of missing values has a non trivial effect on the resulting Conformity distribution. The ability to discriminate noisy information from sensible one is important while analyzing a complex system. Since nodes with missing information are homogeneously distributed within the network tissue, Conformity can correctly classify them as noise, as shown in the labeled vs. missing box-plot of Fig. 4. This observation simply implies that these nodes can not induce to homophilic behaviors since missing information is not a real social dimension implying assortative attitudes.
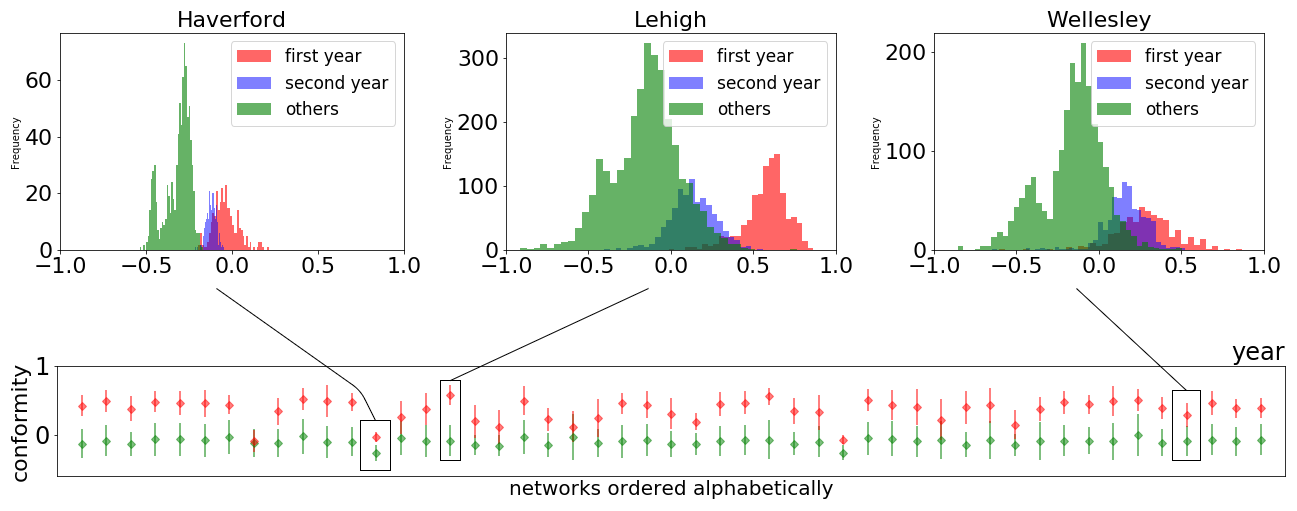
Year. Fig. 6 shows year assortativity of the 50 selected networks. As already shown in [5], first year students highly contribute to the homophilic behavior of the attribute, even when the network attitude does not tend to be globally assortative (see Haverford in Fig. 6). According to the original data paper [23], the year attribute is the most assortative in terms of Newman’s coefficient. Also, in this case, a node-centric measure tends to discover different mixing pattern and allows to differentiate the values that show high homogeneity from the ones that prefer a heterogeneous neighborhood; the three binned networks in Fig. 6 also suggest that homophilic behavior tends to decrease with the increase of enrolment years in a coherent way with the ordinal nature of the attribute.
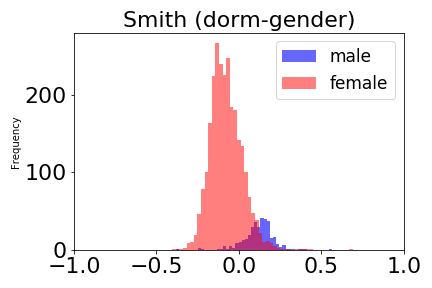
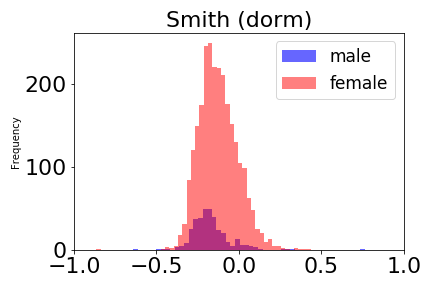
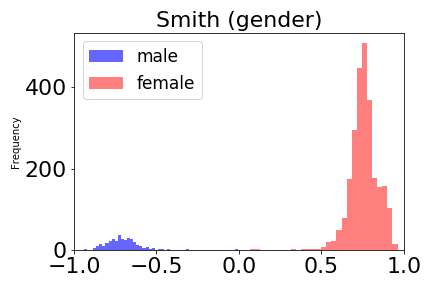
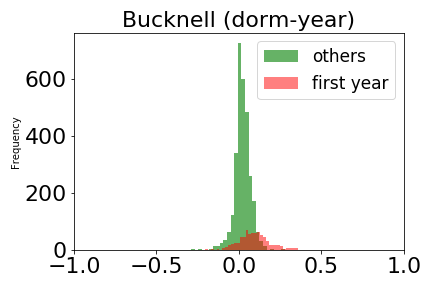
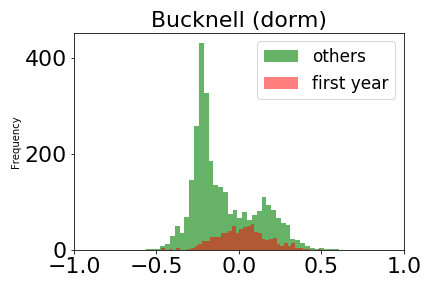
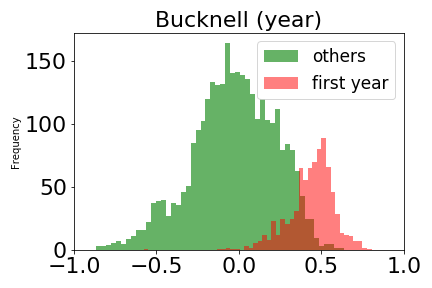
Multi-attribute. In a multi-attribute scenario, we want to measure homophily among complex node profile composed by multiple independent fields. Fig. 7 focuses on dorm-gender and dorm-year assortativity of two selected networks. Smith college, as Wellesley, shows a consistent difference between male-female distributions when the only gender attribute is considered, while no substantial differences are highlighted when the only dormitory attribute is analyzed. However, male nodes tend to be more assortative than female ones when the two attributes are measured together, allowing us to provide a more reliable description of the social media friendships mirroring college interactions. Like all other colleges, first year students are highly assortative w.r.t. the other years, while the same pattern does not emerge considering the dormitory attribute. However, such a pattern emerges anew when dormitory and years are analyzed in a multi-attribute scenario.
5 Discussion and future work
This work introduced Conformity, a novel strategy to measure the homophilic mixing of network nodes w.r.t. their categorical attributes. The proposed measure aims to address some limitations of the well-known assortativity coefficient, in its classic definition given by Newman’s work [4]. The main reason behind Conformity is the need to take into account (the often neglected) impact of node distance on the homophilic/heterophilic behaviors that, in social contexts, favor the creation of social ties. As shown, the proposed measure can unveil interesting nodes’ behaviors and can, in practice, be fruitfully adapted to support several tasks (e.g., the identification/measuring of echo-chambers or polarized islands among users living in a social media ecosystem).
In particular, the multi-attribute analysis it enables can support fine grained analysis of complex homophilic patterns to uncover, for instance, homogeneous nuclei among individuals w.r.t. their age and political views, thus supporting tasks such as attributed community discovery [25]. Moreover, Conformity ability to characterize different extreme behavior of even handfuls of nodes (as seen both in homophily by gender analysis of colleges as Smith and Wellesley and in noise isolation when in the presence of missing values) is a promising feature that can support a wide set of network related task as, for instance, graph-based anomaly detection.
As future works, since in the current study we focused only on networks encoding categorical attributes, we plan to extend Conformity to handle scalar attributes. We also plan to propose an approximate version of Conformity to lower its computational complexity and to study its effectiveness as support for network analysis tasks in heterogeneous applicative scenarios.
Acknowledgments
This work is supported by the scheme ’INFRAIA-01-2018-2019: Research and Innovation action’, Grant Agreement n. 871042 ’SoBigData++: European Integrated Infrastructure for Social Mining and Big Data Analytics’.
References
- [1] R. Interdonato, M. Atzmueller, S. Gaito, R. Kanawati, C. Largeron, and A. Sala, “Feature-rich networks: going beyond complex network topologies,” Applied Network Science, vol. 4, p. 4, Jan 2019.
- [2] A.-L. Barabási and R. Albert, “Emergence of scaling in random networks,” science, vol. 286, no. 5439, pp. 509–512, 1999.
- [3] S. Fortunato and D. Hric, “Community detection in networks: A user guide,” Physics reports, vol. 659, pp. 1–44, 2016.
- [4] M. E. Newman, “Mixing patterns in networks,” Physical Review E, 2003.
- [5] L. Peel, J.-C. Delvenne, and R. Lambiotte, “Multiscale mixing patterns in networks,” Proceedings of the National Academy of Sciences, 2018.
- [6] E. Estrada, N. Hatano, and A. Gutierrez, “‘clumpiness’ mixing in complex networks,” Journal of Statistical Mechanics: Theory and Experiment, 2008.
- [7] M. McPherson, L. Smith-Lovin, and J. M. Cook, “Birds of a feather: Homophily in social networks,” Annual review of sociology, 2001.
- [8] J. Moody, “Race, school integration, and friendship segregation in america,” American journal of Sociology, vol. 107, no. 3, pp. 679–716, 2001.
- [9] W. Shrum, N. H. Cheek Jr, and S. MacD, “Friendship in school: Gender and racial homophily,” Sociology of Education, pp. 227–239, 1988.
- [10] S. Feng and A. Kirkley, “Mixing patterns in interdisciplinary co-authorship networks at multiple scales,” Scientific Reports, vol. 10, no. 1, pp. 1–11, 2020.
- [11] R. Rabbany, D. Eswaran, A. W. Dubrawski, and C. Faloutsos, “Beyond assortativity: proclivity index for attributed networks (p ro n e),” in Pacific-Asia Conference on Knowledge Discovery and Data Mining, Springer, 2017.
- [12] K. Pelechrinis and D. Wei, “Va-index: Quantifying assortativity patterns in networks with multidimensional nodal attributes,” PloS one, vol. 11, no. 1, p. e0146188, 2016.
- [13] R. Noldus and P. Van Mieghem, “Assortativity in complex networks,” Journal of Complex Networks, vol. 3, no. 4, pp. 507–542, 2015.
- [14] A. Allen-Perkins, J. M. Pastor, and E. Estrada, “Two-walks degree assortativity in graphs and networks,” Applied Mathematics and Computation, vol. 311, pp. 262–271, 2017.
- [15] S.-C. Ngo, A. G. Percus, K. Burghardt, and K. Lerman, “The transsortative structure of networks,” Proceedings of the Royal Society A, vol. 476, no. 2237, p. 20190772, 2020.
- [16] E. Lee, F. Karimi, C. Wagner, H.-H. Jo, M. Strohmaier, and M. Galesic, “Homophily and minority size explain perception biases in social networks,” arXiv preprint arXiv:1710.08601, 2017.
- [17] K. M. Altenburger and J. Ugander, “Monophily in social networks introduces similarity among friends-of-friends,” Nature human behaviour, vol. 2, no. 4, pp. 284–290, 2018.
- [18] G. T. Cantwell and M. Newman, “Mixing patterns and individual differences in networks,” Physical Review E, vol. 99, no. 4, p. 042306, 2019.
- [19] L. Gutiérrez-Gómez and J.-C. Delvenne, “Multi-hop assortativities for network classification,” Journal of Complex Networks, vol. 7, no. 4, pp. 603–622, 2019.
- [20] W. W. Zachary, “An information flow model for conflict and fission in small groups,” Journal of anthropological research, 1977.
- [21] L. Peel, D. B. Larremore, and A. Clauset, “The ground truth about metadata and community detection in networks,” Science advances, vol. 3, no. 5, p. e1602548, 2017.
- [22] P. Sapiezynski, A. Stopczynski, D. D. Lassen, and S. Lehmann, “Interaction data from the copenhagen networks study,” Scientific Data, vol. 6, no. 1, pp. 1–10, 2019.
- [23] A. L. Traud, P. J. Mucha, and M. A. Porter, “Social structure of facebook networks,” CoRR, vol. abs/1102.2166, 2011.
- [24] M. Cinelli, L. Peel, A. Iovanella, and J.-C. Delvenne, “Network constraints on the mixing patterns of binary node metadata,” arXiv preprint arXiv:1908.04588, 2019.
- [25] S. Citraro and G. Rossetti, “Identifying and exploiting homogeneous communities in labeled networks,” Applied Network Science, vol. 5, no. 1, pp. 1–20, 2020.
Authors
Giulio Rossetti is a permanent researcher at the Information Science and Technology Institute of the Italian National Research Council (ISTI-CNR). Giulio holds a PhD in Computer Science from the University of Pisa (2015). Since 2011, he has been performing research in the fields of complex network analysis and data science as a member of the Knowledge Discovery and Data Mining laboratory. His recent work focuses on the modeling and study of dynamics of and on networks and on the definition of data-driven models for the forecast of rare events. He is the main contributor of several open-source software applications (https://github.com/GiulioRossetti), some of which have been developed to support big data analysis carried out in a series of EU projects.
Salvatore Citraro is a PhD student in Computer Science at the University of Pisa and a member of the Knowledge Discovery and Data Mining Laboratory (KDD-Lab), a joint research group with the Information Science and Technology Institute of the Italian National Research Council in Pisa. Currently, his main research interests focus on complex networks, including classic and feature-rich network data analysis, with a focus on attribute-aware community discovery tasks. His PhD line of research will also include the study of linguistic networks and how their hidden structures and properties can be meaningfully exploited and applied in cognitive contexts.
Letizia Milli received in 2018 the PhD in Computer Science from the University of Pisa with a thesis on the study of spreading phenomena over complex networks. She is a post doc researcher in Computer Science at the University of Pisa and a member of the Knowledge Discovery and Data Mining Laboratory (KDD-Lab), a joint research group with the Information Science and Technology Institute of the Italian National Research Council in Pisa. Her research interests include data mining, quantification, diffusion of phenomena, and innovation in complex networks and the Science of Success.