Compact intense extreme-ultraviolet source
Abstract
High-intensity laser pulses covering the ultraviolet to terahertz spectral regions are nowadays routinely generated in a large number of laboratories. In contrast, intense extreme-ultraviolet (XUV) pulses have only been demonstrated using a small number of sources including free-electron laser facilities Ackermann et al. (2007); Shintake et al. (2008); Allaria et al. (2012) and long high-harmonic generation (HHG) beamlines Takahashi et al. (2002); Ravasio et al. (2009); Tzallas et al. (2011); Schütte et al. (2014); Manschwetus et al. (2016); Bergues et al. (2018). Here we demonstrate a concept for a compact intense XUV source based on HHG that is focused to an intensity of W/cm2, with a potential increase up to W/cm2 in the future. Our approach uses tight focusing of the near-infrared (NIR) driving laser and minimizes the XUV virtual source size by generating harmonics several Rayleigh lengths away from the NIR focus. Accordingly, the XUV pulses can be refocused to a small beam waist radius of 600 nm, enabling the absorption of up to four XUV photons by a single Ar atom in a setup that fits on a modest (2 m) laser table. Our concept represents a straightforward approach for the generation of intense XUV pulses in many laboratories, providing novel opportunities for XUV strong-field and nonlinear optics experiments, for XUV-pump XUV-probe spectroscopy and for the coherent diffractive imaging of nanoscale structures.
Nonlinear optical techniques have widespread applications including frequency mixing Franken et al. (1961); Bass et al. (1962); Ferray et al. (1988), Raman amplification Claps et al. (2003), Kerr-lens modelocking Spence et al. (1991) and self-phase modulation Alfano and Shapiro (1970); Brabec and Krausz (2000). In the long-wavelength range, the development of compact and efficient secondary terahertz sources with microjoule energies Yeh et al. (2007) has boosted the field of nonlinear terahertz optics Hoffmann and Fülöp (2011). The situation is different in the XUV and X-ray wavelength range, where the generation of high pulse energies in combination with high intensities has only been demonstrated at a limited number of facilities including free-electron lasers Ackermann et al. (2007); Shintake et al. (2008); Allaria et al. (2012) and at long ( m) HHG beamlines Takahashi et al. (2002); Ravasio et al. (2009); Tzallas et al. (2011); Schütte et al. (2014); Manschwetus et al. (2016); Bergues et al. (2018). While first nonlinear XUV optics experiments including multiphoton absorption Sorokin et al. (2007); Nayak et al. (2018); Senfftleben et al. (2020), four-wave mixing Bencivenga et al. (2015) and XUV-XUV pump-probe spectroscopy Ding et al. (2019) have been performed, the large sizes and complexity of existing experimental setups using intense XUV pulses impede faster progress in this field, which would benefit from more compact and less complex setups. Such sources would furthermore pave the way to the application of powerful techniques like attosecond-pump attosecond-probe spectroscopy Tzallas et al. (2011); Takahashi et al. (2013) and coherent diffractive imaging of nanoscale structures and nanoparticles Bogan et al. (2008); Ravasio et al. (2009); Rupp et al. (2017) in a much larger number of laboratories than is currently the case.
Our concept for a compact intense XUV source is based on HHG, which has traditionally been performed at or close to the focal plane of the fundamental laser Ferray et al. (1988) because of the high driving light intensities ( W/cm2) that are required for efficient HHG. After more powerful driving lasers became available, loose-focusing geometries were adopted Takahashi et al. (2002); Ravasio et al. (2009); Tzallas et al. (2011); Schütte et al. (2014); Manschwetus et al. (2016); Bergues et al. (2018), in which the fundamental laser is focused by a lens or a spherical mirror with a long focal length on the order of 10 m. This increases the focus size of the fundamental laser, leading to a large volume from which high harmonics are emitted and resulting in XUV pulses with microjoule energies Takahashi et al. (2002); Hergott et al. (2002); Nayak et al. (2018). A crucial disadvantage of this approach is its complexity and its intrinsic requirement of a large laboratory. Moreover, this approach does not readily lead to higher XUV intensities, since the XUV source size grows proportionally to the focal length that is used Heyl et al. (2016), and source demagnification factors that can be achieved using focusing optics are finite.
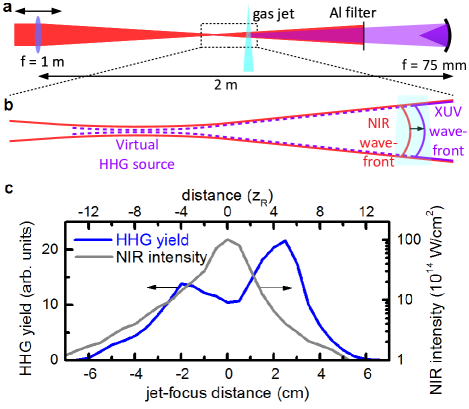
In order to increase the focused XUV intensity in a compact setup, we propose to generate high harmonics several Rayleigh lengths away from the focal plane of the driving laser, employing a focusing element with a relatively short focal length of 1 m (see Fig. 1a). As schematically shown in Fig. 1b, this leads to a situation where the driving laser wavefronts in the HHG medium are curved, resulting in curved wavefronts of the generated XUV pulses Wikmark et al. (2019). Due to the short wavelengths of the generated harmonics, this curved wavefront is accompanied by a virtual HHG source size that is much smaller than the focus size of the driving laser, as we will demonstrate later. Further demagnification of the HHG source size (here, using a spherical B4C-coated mirror with mm) results in a small XUV focus size and a high XUV intensity that can be used for experiments. In the experiments to be discussed in this paper, the entire XUV beamline has a length of 2 m, which is comparable to or even smaller than most standard HHG beamlines.
To demonstrate the applicability of this scheme, we performed an experiment at the Max-Born-Institut (MBI), where high harmonics were generated in a Kr gas jet (1.5 mm length) that was operated at a backing pressure of 4 bar, using 40 fs near-infrared (NIR) driving pulses with a central wavelength of 800 nm and a pulse energy of 16 mJ. Fig. 1c shows the HHG yield as a function of the distance between the NIR focal plane and the gas jet. As a general feature we observe two maxima of the HHG yield, one when the jet is behind the NIR focus and another one when the jet is in front of the NIR focus. For the specific parameters used in Fig. 1c, the curve has a maximum at cm, meaning that the jet is placed 2.5 cm — or about 5 Rayleigh lengths — behind the NIR focus. The NIR intensity at this position is W/cm2, which is much smaller than the NIR intensity at the focus (W/cm2). This corresponds to a regime where the NIR beam propagation and the propagation of the XUV beam resulting from HHG can be well approximated by geometrical optics. Using this scheme, an XUV pulse energy of 0.3 J was measured using an XUV photodiode (AXUV100G), which is comparable to the results obtained with two long HHG beamlines available at the MBI Schütte et al. (2014); Senfftleben et al. (2020).
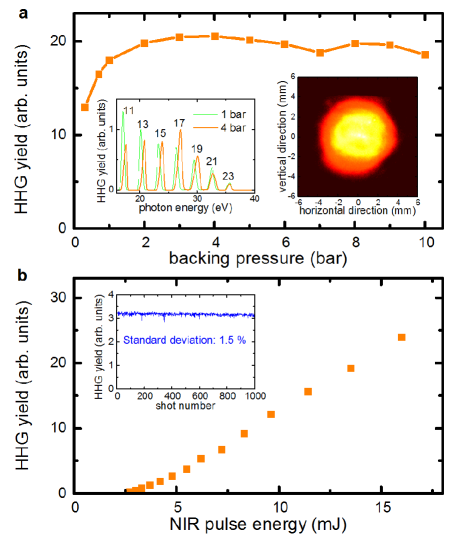
We will show in the following that HHG far away from the NIR focus exhibits a number of favorable properties which are beneficial for applications. As depicted in Fig. 2a, variation of the backing pressure results in an HHG yield that is almost constant for backing pressures bar, making the optimization of HHG straightforward. Corresponding HHG spectra at backing pressures of 1 bar and 4 bar are shown in the left inset and demonstrate that the individual harmonics are blueshifted when the pressure is increased, which provides a possibility to tune the HHG spectra. This blueshift is a consequence of propagation effects of the NIR driving laser in the gas jet Major et al. (2020). The XUV beam profile measured 50 cm from the gas jet is depicted in the inset on the right side of Fig. 2a. As a direct consequence of generating harmonics far away from the NIR focus, we find that the corresponding full-width half maximum divergence matches the NIR divergence of 10 mrad. Fig. 2b shows that the HHG yield increases monotonically with increasing NIR pulse energy, demonstrating that the presented HHG scheme is scalable. A further advantage is that the shot-to-shot fluctuations are low, making this a very robust source. As shown in the inset of Fig. 2b, a standard deviation of 1.5 was measured over 1000 single shots.
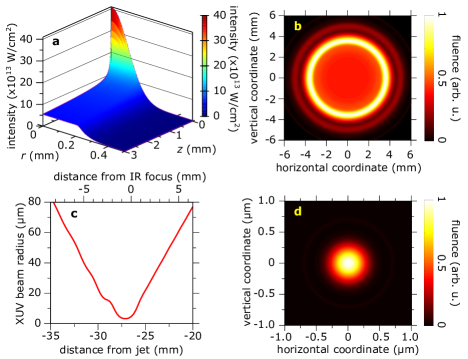
To better understand HHG far away from the driving laser focus, we performed simulations (see Methods for details). Fig. 3a shows how the NIR pulse is reshaped in the gas medium: The initial Gaussian spatial profile of the driving laser is modified to an almost flat-top NIR profile after propagating through the jet as a result of absorption (including losses due to ionization Geissler et al. (1999)). In this way, an NIR intensity of W/cm2 is achieved over a large volume. As a consequence, a relatively high XUV flux is observed in the simulations, which is comparable to the XUV flux that we have obtained in a simulation using an upscaled HHG source, where an NIR focal length of 9 m and an extended gas medium with a length of 20 mm were used. The corresponding XUV beam profile at a distance of 50 cm from the gas jet presented in Fig. 3b exhibits a divergence similar to the experiment. This beam profile has an annular structure, which can be less or more pronounced depending on the specific parameters used in the simulations. We note that an annular beam profile was also observed experimentally in certain conditions, but for the current experiments we chose to optimize the beam profile to be more homogeneous (see inset of Fig. 2a). Difference in the XUV beam profiles might also be explained by the fact that an ideal NIR Gaussian beam was used in the simulation, whereas the NIR beam used in the experiment was not an ideal Gaussian beam. As depicted in Fig. 3c, backpropagation of the simulated XUV pulses — centered at 55 nm wavelength — shows that the virtual HHG source is located close to the NIR focal plane and has a beam waist radius of only 3.5 m (Fig. 3c), which is significantly smaller than the simulated NIR beam waist radius of 30 m. Demagnification of the virtual XUV source using a spherical XUV focusing mirror with mm placed 70 cm behind the NIR focus results in an XUV beam waist radius of only nm, which is substantially smaller compared to the values achieved in loose-focusing HHG setups Ravasio et al. (2009); Schütte et al. (2014); Manschwetus et al. (2016); Rupp et al. (2017); Nayak et al. (2018). Using the calculated beam waist radius in combination with the calculated XUV pulse duration of fs and using a pulse energy of nJ as available in the experiment (taking into account an aluminium (Al) filter transmission of 40 and a focusing mirror reflectivity of 25 ), the theoretically achievable XUV peak intensity is estimated as W/cm2.
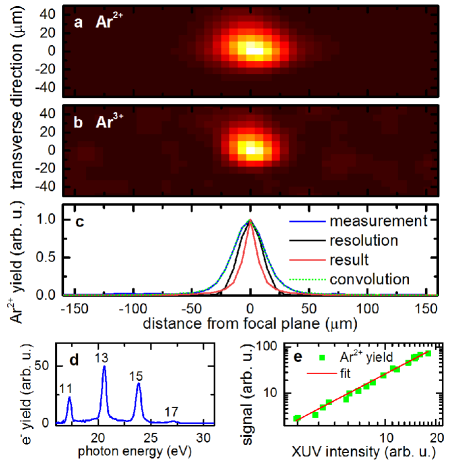
The ability to generate intense XUV pulses is experimentally demonstrated by studying multiphoton absorption in Ar atoms. To this end, we generated harmonics in Xe (using a backing pressure of 2 bar and an NIR pulse energy of 8 mJ) and focused the XUV pulses into an atomic jet using a B4C-coated spherical mirror with a focal length of 75 mm. Applying ion spatial imaging (see Methods for details), Ar2+ and Ar3+ ion yields were recorded along the XUV propagation direction, as shown in Fig. 4a,b. While the Ar+ ion yield is constant as a function of the distance from the XUV focal plane (not shown), the Ar2+ and Ar3+ ion yields are peaked at the XUV focal plane, demonstrating that these signals scale nonlinearly with the XUV intensity. The generation of Ar2+ from neutral Ar requires an energy of at least 43.4 eV, indicating that its generation is the result of a two-photon absorption process, considering that the maximum XUV photon energy is 27.8 eV (see Fig. 4d). Indeed, the Ar2+ ion yield was found to scale as (see Fig. 4e). Similarly, the generation of Ar3+ ions, which requires a minimum energy of 84.1 eV, is attributed to a four-photon absorption process. In combination with the measured XUV beam radius on the XUV focusing mirror ( mm), the Ar2+ ion distribution along the XUV propagation direction (blue curve in Fig. 4c) can be used to estimate the Rayleigh length of the XUV beam as m (see Methods) and its waist radius as nm, where mm is the distance between the XUV focusing mirror and the image plane. The larger value with respect to the calculated beam waist radius of 300 nm may be attributed to imperfect alignment as well as to wavefront distortions induced by the NIR pulse and by the XUV focusing mirror. Combining this waist radius with the afore-mentioned XUV pulse duration of 25 fs and the pulse energy of 30 nJ, the experimental XUV peak intensity is estimated as W/cm2. In the future, significantly higher XUV intensities could be achieved by further scaling of our approach. We expect the XUV intensity to scale as (where is the NIR pulse energy), if all relevant parameters including the NIR beam size before focusing and the XUV focusing mirror size are scaled appropriately. Using e.g. an NIR pulse energy of 40 mJ instead of 8 mJ for HHG in Xe as well as a 5 times larger NIR beam area before focusing (using the same focusing lens), the XUV pulse energy is expected to increase by a factor of 5 due to the 5 times larger generation area, whereas the NIR focal area and the XUV virtual source area are expected to decrease by a factor of 5, resulting in a 25 times higher XUV intensity. In this case, the XUV focusing mirror needs to be able to accommodate the larger XUV beam divergence. If accompanied by a reduction of the XUV pulse duration fs Tzallas et al. (2011); Takahashi et al. (2013), an intensity of W/cm2 would come within reach.
In summary, we have demonstrated a compact setup for the generation of high XUV intensities by generating high harmonics several Rayleigh lengths away from the driving laser focus. This concept benefits from two favorable properties: (i) A large number of XUV photons are emitted from the large generation volume without the need to apply a loose-focusing geometry. (ii) XUV pulses with curved wavefronts are generated, and are accompanied by a small virtual XUV source size, making refocusing of the XUV pulses to a small beam waist radius possible. The small size and robustness of our concept makes it straightforward to generate intense XUV pulses in a large number of laboratories in the future. Areas that we may expect to benefit from this development are XUV-pump XUV-probe spectroscopy in gases, liquids and solids as well as coherent diffractive imaging of nanoscale structures and nanoparticles. Furthermore, our concept is ideally suited for experiments that require either a high XUV flux or a small XUV focus.
References
References
- Ackermann et al. (2007) W. Ackermann, G. Asova, V. Ayvazyan, A. Azima, N. Baboi, J. Bähr, V. Balandin, B. Beutner, A. Brandt, A. Bolzmann, et al., Nat. Photon. 1, 336 (2007).
- Shintake et al. (2008) T. Shintake, H. Tanaka, T. Hara, T. Tanaka, K. Togawa, M. Yabashi, Y. Otake, Y. Asano, T. Bizen, T. Fukui, et al., Nat. Photon. 2, 555 (2008).
- Allaria et al. (2012) E. Allaria, R. Appio, L. Badano, W. Barletta, S. Bassanese, S. Biedron, A. Borga, E. Busetto, D. Castronovo, P. Cinquegrana, et al., Nat. Photon. 6, 699 (2012).
- Takahashi et al. (2002) E. Takahashi, Y. Nabekawa, and K. Midorikawa, Opt. Lett. 27, 1920 (2002).
- Ravasio et al. (2009) A. Ravasio, D. Gauthier, F. R. N. C. Maia, M. Billon, J.-P. Caumes, D. Garzella, M. Géléoc, O. Gobert, J.-F. Hergott, A.-M. Pena, H. Perez, B. Carré, E. Bourhis, J. Gierak, A. Madouri, D. Mailly, B. Schiedt, M. Fajardo, J. Gautier, P. Zeitoun, P. H. Bucksbaum, J. Hajdu, and H. Merdji, Phys. Rev. Lett. 103, 028104 (2009).
- Tzallas et al. (2011) P. Tzallas, E. Skantzakis, L. Nikolopoulos, G. D. Tsakiris, and D. Charalambidis, Nat. Phys. 7, 781 (2011).
- Schütte et al. (2014) B. Schütte, M. Arbeiter, T. Fennel, M. J. Vrakking, and A. Rouzée, Phys. Rev. Lett. 112, 073003 (2014).
- Manschwetus et al. (2016) B. Manschwetus, L. Rading, F. Campi, S. Maclot, H. Coudert-Alteirac, J. Lahl, H. Wikmark, P. Rudawski, C. M. Heyl, B. Farkas, T. Mohamed, A. L’Huillier, and P. Johnsson, Phys. Rev. A 93, 061402 (2016).
- Bergues et al. (2018) B. Bergues, D. E. Rivas, M. Weidman, A. A. Muschet, W. Helml, A. Guggenmos, V. Pervak, U. Kleineberg, G. Marcus, R. Kienberger, D. Charalambidis, P. Tzallas, H. Schröder, F. Krausz, and L. Veisz, Optica 5, 237 (2018).
- Franken et al. (1961) P. A. Franken, A. E. Hill, C. W. Peters, and G. Weinreich, Phys. Rev. Lett. 7, 118 (1961).
- Bass et al. (1962) M. Bass, P. A. Franken, J. F. Ward, and G. Weinreich, Phys. Rev. Lett. 9, 446 (1962).
- Ferray et al. (1988) M. Ferray, A. L’Huillier, X. F. Li, L. A. Lompre, G. Mainfray, and C. Manus, J. Phys. B 21, L31 (1988).
- Claps et al. (2003) R. Claps, D. Dimitropoulos, V. Raghunathan, Y. Han, and B. Jalali, Opt. Express 11, 1731 (2003).
- Spence et al. (1991) D. E. Spence, P. N. Kean, and W. Sibbett, Opt. Lett. 16, 42 (1991).
- Alfano and Shapiro (1970) R. R. Alfano and S. L. Shapiro, Phys. Rev. Lett. 24, 592 (1970).
- Brabec and Krausz (2000) T. Brabec and F. Krausz, Rev. Mod. Phys. 72, 545 (2000).
- Yeh et al. (2007) K.-L. Yeh, M. Hoffmann, J. Hebling, and K. A. Nelson, Appl. Phys. Lett. 90, 171121 (2007).
- Hoffmann and Fülöp (2011) M. C. Hoffmann and J. A. Fülöp, J. Phys. D 44, 083001 (2011).
- Sorokin et al. (2007) A. A. Sorokin, S. V. Bobashev, T. Feigl, K. Tiedtke, H. Wabnitz, and M. Richter, Phys. Rev. Lett. 99, 213002 (2007).
- Nayak et al. (2018) A. Nayak, I. Orfanos, I. Makos, M. Dumergue, S. Kühn, E. Skantzakis, B. Bodi, K. Varju, C. Kalpouzos, H. I. B. Banks, A. Emmanouilidou, D. Charalambidis, and P. Tzallas, Phys. Rev. A 98, 023426 (2018).
- Senfftleben et al. (2020) B. Senfftleben, M. Kretschmar, A. Hoffmann, M. Sauppe, J. Tümmler, I. Will, T. Nagy, M. J. J. Vrakking, D. Rupp, and B. Schütte, J. Phys. Photonics 2, 034001 (2020).
- Bencivenga et al. (2015) F. Bencivenga, R. Cucini, F. Capotondi, A. Battistoni, R. Mincigrucci, E. Giangrisostomi, A. Gessini, M. Manfredda, I. Nikolov, E. Pedersoli, et al., Nature 520, 205 (2015).
- Ding et al. (2019) T. Ding, M. Rebholz, L. Aufleger, M. Hartmann, K. Meyer, V. Stooß, A. Magunia, D. Wachs, P. Birk, Y. Mi, G. D. Borisova, C. d. C. Castanheira, P. Rupprecht, Z.-H. Loh, A. R. Attar, T. Gaumnitz, S. Roling, M. Butz, H. Zacharias, S. Düsterer, R. Treusch, S. M. Cavaletto, C. Ott, and T. Pfeifer, Phys. Rev. Lett. 123, 103001 (2019).
- Takahashi et al. (2013) E. J. Takahashi, P. Lan, O. D. Mücke, Y. Nabekawa, and K. Midorikawa, Nat. Commun. 4, 2691 (2013).
- Bogan et al. (2008) M. J. Bogan, W. H. Benner, S. Boutet, U. Rohner, M. Frank, A. Barty, M. M. Seibert, F. Maia, S. Marchesini, S. Bajt, et al., Nano Lett. 8, 310 (2008).
- Rupp et al. (2017) D. Rupp, N. Monserud, B. Langbehn, M. Sauppe, J. Zimmermann, Y. Ovcharenko, T. Möller, F. Frassetto, L. Poletto, A. Trabattoni, et al., Nat. Commun. 8, 493 (2017).
- Hergott et al. (2002) J.-F. Hergott, M. Kovacev, H. Merdji, C. Hubert, Y. Mairesse, E. Jean, P. Breger, P. Agostini, B. Carré, and P. Salières, Phys. Rev. A 66, 021801 (2002).
- Heyl et al. (2016) C. M. Heyl, H. Coudert-Alteirac, M. Miranda, M. Louisy, K. Kovacs, V. Tosa, E. Balogh, K. Varjú, A. L’Huillier, A. Couairon, and C. L. Arnold, Optica 3, 75 (2016).
- Wikmark et al. (2019) H. Wikmark, C. Guo, J. Vogelsang, P. W. Smorenburg, H. Coudert-Alteirac, J. Lahl, J. Peschel, P. Rudawski, H. Dacasa, S. Carlström, S. Maclot, M. B. Gaarde, P. Johnsson, C. L. Arnold, and A. L’Huillier, Proc. Natl. Acad. Sci. USA 116, 4779 (2019).
- Major et al. (2020) B. Major, M. Kretschmar, O. Ghafur, A. Hoffmann, K. Kovács, K. Varjú, B. Senfftleben, J. Tümmler, I. Will, T. Nagy, D. Rupp, M. J. J. Vrakking, V. Tosa, and B. Schütte, J. Phys. Photonics 2, 034002 (2020).
- Geissler et al. (1999) M. Geissler, G. Tempea, A. Scrinzi, M. Schnürer, F. Krausz, and T. Brabec, Phys. Rev. Lett. 83, 2930 (1999).
- Gademann et al. (2011) G. Gademann, F. Ple, P.-M. Paul, and M. J. J. Vrakking, Opt. Express 19, 24922 (2011).
- Irimia et al. (2009) D. Irimia, D. Dobrikov, R. Kortekaas, H. Voet, D. A. van den Ende, W. A. Groen, and M. H. M. Janssen, Rev. Sci. Instrum. 80, 113303 (2009).
- Eppink and Parker (1997) A. T. J. B. Eppink and D. H. Parker, Rev. Sci. Instrum. 68, 3477 (1997).
- Tosa et al. (2003) V. Tosa, E. Takahashi, Y. Nabekawa, and K. Midorikawa, Phys. Rev. A 67, 063817 (2003).
- Lewenstein et al. (1994) M. Lewenstein, P. Balcou, M. Y. Ivanov, A. L’Huillier, and P. B. Corkum, Phys. Rev. A 49, 2117 (1994).
- Rivas et al. (2018) D. E. Rivas, B. Major, M. Weidman, W. Helml, G. Marcus, R. Kienberger, D. Charalambidis, P. Tzallas, E. Balogh, K. Kovács, V. Tosa, B. Bergues, K. Varjú, and L. Veisz, Optica 5, 1283 (2018).
- Major et al. (2018) B. Major, Z. L. Horváth, and K. Varjú, Appl. Opt. 57, 738 (2018).
Methods
Experimental methods. The experiments were performed using a Ti:sapphire laser system Gademann et al. (2011) operating at a central wavelength of 790 nm and delivering pulses with an energy up to 35 mJ and a duration of 40 fs. A pulse energy of up to 16 mJ was used in the current experiments. These pulses were focused using a spherical lens with a focal length of 1 m and coupled into the vacuum using a 3 mm thick fused silica window. A pulsed gas jet was generated by a piezoelectric valve with a nozzle diameter of 0.5 mm that was mounted from above, applying a backing pressure of up to 10 bar. The relative position of the laser focus with respect to the gas jet was varied by mounting the lens on a long translation stage. A charge-coupled device (CCD) camera was used to record NIR beam profiles at the gas jet position.
The NIR pulses co-propagating with the HHG pulses were attenuated using a 100 nm thick Al filter. The XUV pulses were spectrally resolved using a diffraction grating, and the spectra were recorded using a microchannel plate (MCP) / phosphor screen assembly in combination with a CCD camera. The XUV beam profile was measured via the same detection method and using the grating in zeroth order. The XUV pulse energy was measured by an XUV photodiode (AXUV100G) that was temporarily placed at a distance of about 0.5 m behind the gas jet.
To generate high XUV intensities, the XUV pulses were refocused using a B4C-coated spherical mirror with a focal length of 75 mm that was placed at a distance of 103 cm behind the gas jet. The focused XUV beam was intersected by a pulsed gas jet that was generated by a piezoelectric valve Irimia et al. (2009). A molecular beam skimmer with an orifice diameter of 0.5 mm was used to select the central part of the atomic beam and to provide efficient differential pumping between the gas jet chamber and the interaction chamber. Photoions were generated in the interaction zone of a velocity-map imaging spectrometer Eppink and Parker (1997), which was operated in spatial imaging mode. The MCP / phosphor screen detector of the VMIS was gated to be able to separately record the ions in different charge states.
To determine the XUV Rayleigh length from the Ar2+ ion distribution, the measurement shown in Fig. 4a was repeated at a lower gas density to avoid any possible space charge effects. The Ar2+ ion yield scales with , assuming that two XUV photons are required for the generation of Ar2+. Here is the intensity as a function of the distance from the focal plane and is the beam radius as a function of the distance from the focal plane. It follows that the Ar2+ ion distribution is proportional to . This formula was used to fit the measured Ar2+ ion distribution. In addition, the transverse Ar2+ ion distribution was used to determine the spatial resolution after applying a Gaussian fit. Deconvolution of these two curves results in the extracted Ar2+ ion distribution shown as a red curve in Fig. 4c, from which a Rayleigh length of 6.5 m was obtained. For comparison, we also show the convolution of the red and black curves as green dotted curve, which agrees well with the measured Ar2+ distribution (blue curve).
Numerical methods. The HHG simulations were performed with an extended version of a three-dimensional nonadiabatic simulation code described in Tosa et al. (2003). The model solves the paraxial wave equation in combination with the Lewenstein integral Lewenstein et al. (1994) to obtain the macroscopic response of a gas medium to a strong laser field. As a first step, propagation of the laser pulse in the ionized medium is calculated assuming a cylindrical symmetry and taking into account the time- and space-dependent neutral and plasma dispersion, along with the optical Kerr effect. The dipole responses of single atoms in the interaction volume are obtained using the strong-field approximation. These dipole responses serve as source terms in each spatial grid point of the interaction medium when solving the wave equation of similar form as for the fundamental laser field. When calculating the propagation of the harmonic field, neutral dispersion and absorption are taken into account. Further details are available in the supplementary material of Ref. Rivas et al. (2018). Backpropagation of the generated high-harmonic radiation was carried out using the ABCD-Hankel transform Major et al. (2018).
Acknowledgements
We thank M. Krause, R. Schumann and C. Reiter for their support with the laser system. The ELI-ALPS project (GINOP-2.3.6-15-2015-00001) is supported by the European Union and co-financed by the European Regional Development Fund. We acknowledge KIFÜ for awarding us access to HPC resources based in Hungary. K. Kovács and V. Tosa acknowledge support from the grant ELI_03 Pulse-MeReAd.
Author contributions
B.M. and O.G. contributed equally to this work. B.S. and O.G. performed the experiments. B.M., K.K. and V.T. carried out the calculations. All authors discussed the results and contributed to writing the manuscript.
Competing financial interests
The authors declare no competing financial interests.
Additional information
Correspondence and requests for materials should be addressed to B.S. or B.M.