Ultramassive black holes in the most massive galaxies: versus
Abstract
We investigate the nature of the relations between black hole (BH) mass () and the central velocity dispersion () and, for core-Sérsic galaxies, the size of the depleted core (). Our sample of 144 galaxies with dynamically determined encompasses 24 core-Sérsic galaxies, thought to be products of gas-poor mergers, and reliably identified based on high-resolution HST imaging. For core-Sérsic galaxies—i.e., combining normal-core ( kpc) and large-core galaxies ( kpc), we find that correlates remarkably well with such that (rms scatter in log of dex), confirming previous works on the same galaxies except three new ones. Separating the sample into Sérsic, normal-core and large-core galaxies, we find that Sérsic and normal-core galaxies jointly define a single log-linear relation with dex, however, at the high-mass end large-core galaxies (four with measured ) are offset upward from this relation by (, explaining the previously reported steepening of the relation for massive galaxies. Large-core spheroids have magnitudes mag, half-light radii kpc and are extremely massive . Furthermore, these spheroids tend to host ultramassive BHs () tightly connected with their rather than . The less popular relation exhibits 62% less scatter in log than the relations. Our findings suggest that large-core spheroids form via multiple major ‘dry’ merger events involving super/ultramassive BHs, consistent with the flattening of the relation observed at mag.
Subject headings:
galaxies: elliptical and lenticular, cD — galaxies: fundamental parameter — galaxies: nuclei — galaxies: photometry— galaxies: structure1. Introduction
Observational works on nearby galaxies in the last 25 yrs have revealed that black holes (BHs) in a mass range reside at the centers of all massive elliptical galaxies and massive bulges of disk galaxies (Kormendy & Richstone, 1995; Magorrian et al., 1998; Ferrarese & Ford, 2005; McConnell et al., 2011; Thomas et al., 2016; Mehrgan et al., 2019). The BH can have a major impact on the central and large-scale properties of its host galaxy. Luminous ( mag) core-Sérsic galaxies contain partially depleted stellar cores, a flattening in the inner stellar light distributions, that are thought to be generated by the scouring action of inspiraling supermassive black hole (SMBH) binaries formed in major dry merger events. As the inspiraling SMBH binary sinks to the center of the merger remnant, it transfers orbital angular momentum to the surrounding stars. The gravitation slingshot ejection of the inner stars by this decaying SMBH binary creates the central light deficit, i.e., the flattened core (e.g., Begelman et al., 1980; Ebisuzaki et al., 1991; Milosavljević & Merritt, 2001; Merritt, 2006; Gualandris & Merritt, 2012; Khan et al., 2013; Vasiliev et al., 2015; Rantala et al., 2018; Nasim et al., 2020). The light profiles of core-Sérsic galaxies, which break from a steep outer Sérsic profile to a flattened core, are well described using the core-Sérsic model (Graham et al., 2003). This model enables the core sizes of core-Sérsic galaxies to be measured by its break radius (e.g., Graham et al., 2003; Ferrarese et al., 2006; Dullo & Graham, 2012, 2014, 2013; Dullo, 2019; Rusli et al., 2013a). Recently, Dullo (2019) revealed two types of core-Sérsic galaxies: “normal-core” (i.e., 0.5 kpc) and “large-core” (i.e., 0.5 kpc) galaxies.
The SMBH masses have been found to correlate with several host galaxy properties including central stellar velocity dispersion (, Ferrarese & Merritt 2000; Gebhardt et al. 2000; Graham et al. 2011; McConnell & Ma 2013), luminosity (, e.g., Kormendy & Richstone 1995; McLure & Dunlop 2002; Graham & Scott 2013) and mass (, e.g., Magorrian et al. 1998; Marconi & Hunt 2003; Häring & Rix 2004; Sahu et al. 2019a). Later studies found that a tight relation exists between SMBH masses and the sizes of the depleted cores for core-Sérsic galaxies (, e.g., Lauer et al. 2007; Rusli et al. 2013a; Dullo & Graham 2014; Thomas et al. 2016; Dullo 2019). Dullo et al. (2020) discover correlations between SMBH mass and the host galaxy total UV-[3.6] color. In this new (SMBH mass)-color diagram, early- and late-type galaxies define a red and blue sequence, respectively. These local SMBH scaling relations have generated great interest as they are believed to indicate a strong evolutionary coupling between the growth of a SMBH and the buildup of its host galaxy (see recent reviews by Kormendy & Ho 2013; Graham 2016) governed by perhaps active galactic nucleus (AGN) feedback (e.g., Silk & Rees, 1998; Fabian, 1999; Springel et al., 2005; Di Matteo et al., 2005; Croton et al., 2006; Hopkins et al., 2006) or hierarchical merging processes (e.g., Peng, 2007; Jahnke & Macciò, 2011). The expectation is that the slopes, strength, level of scatter and substructures of such relations can yield clues to the underlying mechanism that establishes supposed coupling between SMBHs and host galaxies.
It seems reasonable that the central BH is more intimately related to the size of the depleted core it created than the stellar velocity dispersion. However, the relation is regarded as the most fundamental of all the SMBH scaling relations due to its tightness and small scatter (e.g., Tremaine et al., 2002, dex in the log ), which are claimed to be comparable to those of the scaling relations involving and two spheroid parameters (e.g., and half-light radii ), defining a “BH fundamental plane” (e.g., Beifiori et al., 2012; Saglia et al., 2016; Shankar et al., 2016; van den Bosch, 2016; Krajnović et al., 2018a; Shankar et al., 2019; de Nicola et al., 2019). Therefore, the relation is commonly used for estimating the SMBH masses of nearby galaxies when direct SMBH mass measurements are not available. This is particularly true for the brightest and most massive galaxies with very faint central surface brightness (e.g., Dullo 2019) that render the modeling stellar or ionized gas kinematics for the dynamical SMBH mass measurements challenging. In contrast, the relation has been largely overlooked, despite displaying a similar level of scatter as the relation (e.g., Rusli et al., 2013a; Dullo & Graham, 2014; Thomas et al., 2016; Dullo, 2019). This is mainly because the offset nature of the most massive galaxies (at the high-mass end) from the mean relation is still not well established and also the relation can only be applied to massive core-Sérsic spheroids believed to be end-products of gas-poor major mergers (e.g., Faber et al., 1997; Hopkins et al., 2009b). At low and intermediate luminosities ( mag), gas-rich processes are commonly thought to produce Sérsic spheroids with no depleted cores and with km s-1, Sérsic index , and (e.g., Ferrarese et al., 2006; Hopkins et al., 2009a; Dullo & Graham, 2012; Graham & Scott, 2013; Dullo et al., 2016, 2019, 2020).
The majority of dynamical BH masses measured to date are SMBHs residing in massive (but not the most mass) galaxies. However, recent studies obtained ultramassive black holes (UMBHs, ) in the most massive galaxies, which offset upward and toward large in the diagrams (e.g., McConnell et al., 2011; McConnell & Ma, 2013; Thomas et al., 2016; Mezcua et al., 2018; Dullo, 2019; Sahu et al., 2019b). This is consistent with Lauer et al. (2007) who using a galaxy sample with speculated that SMBH masses for the brightest cluster galaxies (BCGs) would be overmassive relative to the expectation from the high mass end of the relation, but they would be in better agreement with those from relation (see also Volonteri & Ciotti 2013; Dullo 2019). The relation predicts SMBH masses for the most massive galaxies (i.e., km s-1, Lauer et al. 2007; Bernardi et al. 2007) of , and these values underestimate the actual black hole mass by up to a factor of 40 (Dullo, 2019), whereas predicted from the relation can exceed (Lauer et al. 2007; Dullo 2019). Indeed, Wu et al. (2015) found a quasar at a redshift of z 6.3 powered by an UMBH with , and such BHs have been identified at the centers of extremely massive () present-day galaxies (e.g., McConnell et al., 2011; Thomas et al., 2016; Mehrgan et al., 2019).
Separating core-Sérsic galaxies into normal-core and large-core galaxies, our findings (Dullo, 2019) suggested that the offset evident at the high-mass end of the relation is due to large-core spheroids with mag, and kpc. It worth noting such spheroids are not simple high-mass extensions of the relatively less massive normal-core spheroids (). A key observation in Dullo (2019) was that a single relation holds across the full mass range of core-Sérsic spheroids confirming Lauer et al. (2007); Rusli et al. (2013a); Dullo & Graham (2014), but this conclusion was based on a small sample of 11 core-Sérsic galaxies with direct SMBH mass measurements; 3/11 galaxies are large-core galaxies. Establishing this tight relation, as well as the offset at the high-mass end of the relation being due to large-core galaxies, requires a reasonably large sample of galaxies with dynamical SMBH mass measurements.
In this work, we build upon Dullo (2019) and investigate the nature of the and relations using 24 core-Sérsic galaxies with published direct SMBH mass determinations. We additionally include 27 core-Sérsic with predicted SMBH masses and robust break radii to further investigate the the BH scaling relations. Our full sample of 144 galaxies with dynamically measured SMBH masses, together with the 27 core-Sérsic galaxies with predicted , used to directly explore substructures in the diagram is described in Section 2. We then discuss the linear regression methods employed in Section 3.1. In Section 3.2, we show that the relation for core-Sérsic galaxies is stronger and has less scatter than the core-Sérsic relation. We reveal the steepening at the high-mass end of the relation in Section 3.3 and go on to discuss how underestimated BH masses of large-core galaxies give rise to offsets in the diagrams in Section 3.4. In Section 3.5, we discuss pathways for the growth of black holes in large-core, normal-core and Sérsic galaxies. Section 4 summarizes our main conclusions.
2. SAMPLE AND DATA
We use the sample of 41 core-Sérsic galaxies and their robust break radii from Dullo (2019, see also ). Of these 41 galaxies, 14 have dynamically determined (henceforth “direct”) SMBH masses. We exclude the measured black hole masses for two Dullo & Graham (2014) core-Sérsic galaxies (NGC 3706, Gültekin et al. 2014 and NGC 5419, Mazzalay et al. 2016) with an inner stellar ring and two compact nuclear point sources, respectively (Dullo & Graham, 2012). These two black hole masses are potentially less secure due to the galaxies’ complex nuclear structures. We add here 10 other core-Sérsic galaxies with direct SMBH masses and robust core-Sérsic break radii111We convert the geometric-mean break radii from Rusli et al. (2013a) into semi-major axis radii using the galaxies’ ellipticity values at the break radii. from Rusli et al. (2013a). This results in a final compilation sample of 51 (13 large-core and 38 normal-core) core-Sérsic galaxies having measured break radii.
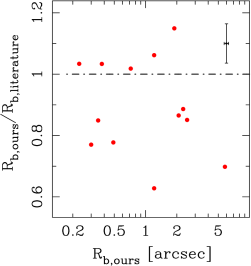
Of the 24 core-Sérsic galaxies with direct SMBH mass measurements in our final sample (Table 1), 21 are in common with Thomas et al. (2016), see also Rusli et al. (2013a). Thomas et al. (2016) used their break radius for NGC 1600 and the break radii from Rusli et al. (2013a) for the remaining 20 core-Sérsic galaxies in their sample. The break radii in this paper, in contrast, are from our own analyses (Dullo & Graham, 2014; Dullo et al., 2017; Dullo, 2019) except for the 10 galaxies taken from Rusli et al. (2013a), see Table 1. Fig. 1 shows a comparison of our core-Sérsic break radii with the core-Sérsic break radii values from Rusli et al. (2013a); Thomas et al. (2016) for 13 overlapping galaxies. For four galaxies, our break radii agree with theirs within 10 %, whereas for the remaining 9 galaxies there is a discrepancy of %. The typical uncertainty associated with is % (e.g., Rusli et al., 2013a; Dullo, 2019). The two galaxies where our break radii disagree most ( 43-59 %) with those of Rusli et al. (2013a) are the two brightest galaxies in the Virgo cluster NGC 4472 and NGC 4486.
The identification of the partially depleted cores for the large-core and normal-core galaxies is based on detailed structural decomposition of the galaxies’ HST surface brightness profiles, fitting the core-Sérsic model to the spheroidal components (Dullo 2019; Rusli et al. 2013a).
In order to construct the relations shown in this paper, we used van den Bosch (2016, see their Table 2) as main reference. He tabulated a large compilation of 245 measured SMBH masses. Excluding his galaxies in common with Rusli et al. (2013a); Dullo (2019), we consider secure SMBH masses measured based on stellar and gas dynamics (van den Bosch, 2016). To avoid issues of potential inconsistency arising from using upper limits and BH masses obtained via different methods, we excluded SMBH mass upper limits, and SMBH masses from megamasers and reverberation mapping measurements. This leaves us with a sample of 121 dynamically determined SMBH masses and the majority of these galaxies are Sérsic galaxies, while a small fraction of them with and km s-1 are likely core-Sérsic galaxies. Homogenized mean central velocity dispersions () for the sample galaxies were obtained from HyperLeda222http://leda.univ-lyon1.fr (Makarov et al., 2014). We adopt a conservative upper limit uncertainty of 10% on after comparing the HyperLeda individual velocity dispersion measurements and mean homogenized values for about 100 sample galaxies.
| Galaxy | (kpc) | log () | |
| (1) | (2) | (3) | |
| \topruleIC 1459 | 0.108 [1] | 9.45 [1] | |
| NGC 0584 | 0.021 [2] | 8.15 [3] | |
| NGC 1399 | 0.202 [2] | 9.07 [2] | |
| NGC 1407 | 0.276 [1] | 9.65 [1] | |
| NGC 1550 | 0.300 [1] | 9.57 [1] | |
| NGC 1600 | 0.650 [4] | 10.23 [4] | |
| NGC 3091 | 0.169 [1] | 9.56 [1] | |
| NGC 3379 | 0.102 [2] | 8.60 [2] | |
| NGC 3608 | 0.024 [2] | 8.30 [2] | |
| NGC 3842 | 0.315 [2] | 9.98 [2] | |
| NGC 4261 | 0.198 [1] | 8.72 [1] | |
| NGC 4291 | 0.036 [2] | 8.52 [2] | |
| NGC 4374 | 0.139 [1] | 8.96 [1] | |
| NGC 4472 | 0.108 [2] | 9.36 [1] | |
| NGC 4486 | 0.640 [4] | [4] | |
| NGC 4552 | 0.017 [2] | 8.67 [2] | |
| NGC 4649 | 0.241 [2] | 9.67 [2] | |
| NGC 4889 | 0.860 [4] | 10.30 [4] | |
| NGC 5328 | 0.271 [1] | 9.67 [1] | |
| NGC 5516 | 0.178 [1] | 9.52 [1] | |
| NGC 6086 | 0.357 [1] | 9.56 [1] | |
| NGC 7768 | 0.164 [1] | 9.11 [1] | |
| NGC 5813 | 0.051 [2] | 8.83 [2] | |
| NGC 7619 | 0.109 [2] | 9.36 [5] | |
| Holm 15A? | 2.800 [6] | 10.60 [6] |
Note. Col. (1) galaxy name. Col. (2) break radius. Col. (3) SMBH mass. Sources. [1]=Rusli et al. (2013a, and references therein); [2]=Dullo & Graham (2014, and references therein); [3]=Thater et al. (2019), [4]=Dullo (2019, and references therein); [5]=Rusli et al. (2013b); [6]=Mehrgan et al. (2019). A ‘?’ is used to indicate that the identification of a depleted core in Holm 15A is uncertain.
| Galaxy | log () | |||||||
| (-based) | (L-based) | (-based) | (//) | |||||
| (1) | (2) | (3) | (4) | (5) | ||||
| \topruleNGC 4874 | 8.91 | 8.98 | 10.54 | 79.8/67.6/1.9 | ||||
| NGC 6166 | 9.14 | 10.47 | 10.68 | 117.3/5.5/3.4 | ||||
| 4C+74.13 | 8.61 | 10.20 | 10.71 | 157.0/4.1/1.3 | ||||
| A0119 | 9.04 | 10.41 | 10.08 | 13.5/0.6/1.2 | ||||
| A2029 | 9.68 | 9.99 | 10.99 | 77.6/50.4/4.8 | ||||
| A2147 | 8.95 | 9.93 | 10.42 | 61.2/6.4/2.1 | ||||
| A2261 | 9.73 | 10.43 | 10.81 | 8.2/1.7/0.7 | ||||
| A3558 | 8.70 | 10.89 | 10.43 | 85.7/0.6/1.7 | ||||
| A3562 | 8.59 | 9.83 | 10.05 | 34.6/2.0/1.2 | ||||
| A3571 | 9.31 | 9.79 | 10.44 | 28.0/9.3/2.1 | ||||
| Galaxy | log () | |||||||
| (dynamically determined SMBH masses) | ||||||||
| NGC 1600 | 10.23 | 2.8/2.8/2.8 | ||||||
| NGC 4486 | 5.1/5.1/5.1 | |||||||
| NGC 4889 | 10.3 | 4.7/4.7/4.7 | ||||||
Note. Col. (1) galaxy name. Cols. (2-4) SMBH masses either dynamically determined or predicted using the velocity dispersion , spheroid luminosity and break radius for 13 large-core ellipticals from Dullo (2019, and references therein). Col. (5) (central stellar mass deficit)-to-(SMBH mass) ratio (Dullo, 2019).
| Relation | BCES bisector fit | [dex] | [dex] | - | - | Sample | |
| Core-Sérsic galaxies | |||||||
| + () | 0.29 | 0.33 0.07 | 0.90/ | 0.88/ | 24 [a] | ||
| + () | 0.47 | 0.30 0.13 | 0.78/ | 0.76/ | 24 [a] | ||
| + () | 0.81 | 0.52 0.14 | 0.36/ | 0.46/ | 34 [b] | ||
| Sérsic plus Core-Sérsic galaxies | |||||||
| + () | 0.47 | 0.390.04 | 0.85/ | 0.85/ | 141 [c] | ||
| + () | 0.48 | 0.400.04 | 0.86/ | 0.85/ | 145 [d] | ||
| + () | 0.60 | 0.450.04 | 0.85/ | 0.82/ | 155 [e] | ||
Note. The different columns represent: the BH scaling relations, rms scatter in the vertical log direction (), intrinsic scatter from the Bayesian linmixerr fits (), and the Spearman and Pearson correlation coefficients ( and , respectively) and the associated probabilities. Sample: [a] 24 core-Sérsic galaxies with dynamically determined (i.e., 11 normal-core galaxies from Dullo & Graham 2014, 10 normal-core elliptical galaxies from Rusli et al. 2013a plus 3 large-core elliptical galaxies from Dullo (2019); [b] 34 core-Sérsic galaxies (i.e., 24 galaxies [a] plus 10 large-core galaxies with SMBH masses predicted using the relation, Table 2; [c] 142 non-(large-core) galaxies (i.e., 21 normal-core galaxies from [a] plus 121 galaxies with dynamically determined SMBH mass measurements from van den Bosch (2016) that are not in common with Rusli et al. (2013a); Dullo & Graham (2014); Dullo (2019); [d] 145 galaxies (i.e., 142 galaxies [c] plus 3 large-core ellipticals from Dullo (2019); [e] 155 galaxies (i.e., 145 galaxies [d] plus 10 large-core galaxies with -based, predicted SMBH masses, Table 2).
2.1. Predicted black hole masses for core-Sérsic galaxies
Dullo (2019, and references therein) presented predicted SMBH masses for the sample of 27 core-Sérsic galaxies with no direct SMBH masses. We made use of the Graham & Scott (2013, their Table 3) non-barred relation to predict the –based SMBH masses. The predicted –based SMBH masses were based on the near-linear Graham & Scott (2013, their Table 3) -band core-Sérsic relation transformed here into the -band using (Fukugita et al. 1995).
In an effort to better investigate the galaxy-black hole co-evolution in the most massive galaxies, we present SMBH masses predicted using the velocity dispersion , spheroid luminosity and break radius for the 10 large-core galaxies in our sample with no direct SMBH masses (Table 2). All the large-core galaxies in our sample (Table 2) are classified as BCGs except for three galaxies (NGC 1600, NGC 4486 and NGC 4874). The elliptical galaxy NGC 1600 is the brightest member of the poor NGC 1600 group. The giant ellipticals NGC 4486 and NGC 4874 are second brightest galaxies residing at the heart of the Virgo cluster and Coma cluster, respectively.
3. Results and discussion
3.1. Linear regressions
We performed linear regression fits to the () and () data sets (Figs. 2 and 3) using two regression techniques: the Bivariate Correlated Errors and intrinsic Scatter (bces) code (Akritas & Bershady 1996) and the Bayesian linear regression routine (linmix_err, Kelly 2007). The bces routine (Akritas & Bershady, 1996) was implemented in our work using the python module by Nemmen et al. (2012). Both the bces and linmix_err methods take into account the intrinsic scatter and uncertainties in , and . The best-fitting linear relations from the bces and linmix_err methods are consistent with each other within their 1 uncertainties. In this work we only focus on the bces bisector and relations to allow a direct comparison with published works in literature (e.g., Graham & Scott 2013; Sahu et al. 2019b),Table 3. We also give in Table 3 the intrinsic scatter from the linmix_err regression fits, and the Spearman and Pearson correlation coefficients333We note that the Spearman and Pearson correlation coefficients do not take into account the errors on the data points. ( and , respectively) together with the associated probabilities ().
3.2. versus relations for core-Sérsic galaxies
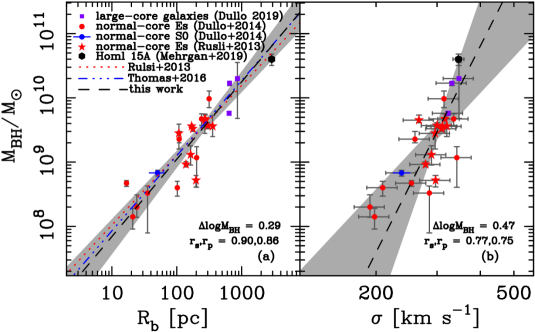
In Fig. 2, we show the and diagrams for the 24 core-Sérsic galaxies with dynamically determined SMBH masses and with carefully measured core-Sérsic break radii. The masses of SMBHs correlate very strongly with the core-Sérsic break radii ( and ). The updated relation (Fig. 2 and Table 3) is in excellent agreement with that from Dullo (2019, his Table 5) defined by the subsample of 11 core-Sérsic galaxies with measured . Despite the discrepancy between the break radii obtained by us and Rusli et al. (2013a), Section 2, our relation is fully consistent with the relations reported by Rusli et al. (2013a) and Thomas et al. (2016, their Fig. 4). However, the correlation for our () data set () is stronger than that found by Rusli et al. (2013a, ) for their data set. Using the “cusp radius”, i.e., the radius where the negative logarithmic slope of the fitted Nuker model equals 1/2 () as a measure of the core size (Carollo et al., 1997), Lauer et al. (2007, their eq. 24) reported relation for their 11 core galaxies with directly measured SMBH masses. Not only is the level of scatter in our relation (Fig. 2) substantially lower than that in the relation444Lauer et al. (2007) did not quote the scatter for their relation, thus our assessment is based on visual inspection of their Fig. 7. (Lauer et al., 2007, their Fig. 7), but the intercepts from the two relations also differ by .
In Fig. 2, it is immediately apparent that the large-core spheroids (filled purple boxes) obey the log-linear relation established by the relatively less massive, normal-core spheroids (filled red circles, blue disk symbol and filled red stars), see Table 3. The relation has an intrinsic scatter of 0.33 dex and an rms vertical scatter in the log direction of dex. This can be compared to the relatively weaker core-Sérsic relation with , and 62% more scatter in log ( dex, Table 3), despite the two relations exhibiting a similar level of intrinsic scatter (). Mehrgan et al. (2019) measured a SMBH mass of ( at the center of the BCG Holm 15A, the most massive dynamically determined black hole in the local universe to date. Plotting this galaxy in Fig. 2 using data555We convert the circular break radii from Mehrgan et al. (2019) into semi-major axis radii using the galaxy’s ellipticity value at the break radius. from Mehrgan et al. (2019, kpc, km s-1, see their Fig. 11), extends the narrow sequence traced by other core-Sérsic galaxies to higher and , by a factor of than previously possible. When we include Holm 15A and rerun the bces bisector regression analysis on the 25 core-Sérsic galaxies, the resulting relation (slope and intercept at pc ) is nearly identical to that for the 24 core-Sérsic galaxies (see Table 3), enforcing the conclusion noted above. However, the nature of the depleted core in Holm 15A is controversial. Mehrgan et al. (2019) fit the 2D core-Sérsic+Sérsic+GaussianRing3D model to the Wendelstein image of the BCG Holm 15A, finding a core size kpc. This structural analysis was supplemented with their orbit analysis for the galaxy based on MUSE spectroscopic data. However, Bonfini et al. (2015); Madrid & Donzelli (2016) did not identify a depleted core in their analyses of the galaxy’s stellar light distributions.
3.3. Steepening at the high-mass end of the relation
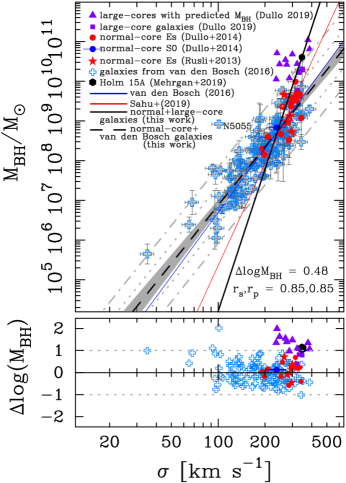
In Fig. 3, we show our symmetric bces bisector fit (dashed line) to the () data for the composite sample of 141 galaxies—121 galaxies from van den Bosch (2016) and 20 normal-core galaxies (Rusli et al. 2013a; Dullo 2019, and references therein), see Table 3. The shaded region marks the 1 uncertainty for the fit. We find that Sérsic and normal-core core-Sérsic galaxies define a single log-linear relation with a slope of , 0.39 dex and dex in the log . Excluding the 18 normal-core galaxies from our regression analysis, we find that the best-fitting bces bisector relation for the 121 galaxies (van den Bosch, 2016) remains roughly unchanged (slope and intercept ), albeit a slightly shallower slope. As noted above, a small fraction of the 121 galaxies from van den Bosch (2016) with and km s-1 are probably normal-core galaxies. If true, this further reinforces our conclusions. Our relation for Sérsic and normal-core galaxies is in fair agreement with that from van den Bosch (2016) with a slope of 5.35 0.23 reported for the sample of 230 galaxies used in their regression analysis (solid blue line).
A trend emerges when we plot 13 large-core galaxies with -band absolute magnitudes mag and stellar masses : 3 with directly measured SMBH masses (purple boxes) and 10 with SMBH masses predicted using the tight relation (purple triangles), Fig. 2 and Table 2. Large-core galaxies are offset upward by from the sequence traced by Sérsic and normal-core galaxies (Fig. 3). This is indeed the case for Holm 15A (filled hexagon), which lies dex above the non-(large-core) relation if we consider it as a large-core galaxy candidate (Mehrgan et al., 2019). We adopt that 1 equals the intrinsic scatter dex. The relation defined by the Sérsic and normal-core galaxies substantially underpredicts the SMBH masses for large-core galaxies. The inclusion of large-core galaxies in the regression analyses steepens the slopes of the relations (Fig. 3, solid black line), regardless of the choice of linear regression method (see Table 3). Aside from the large-core galaxies, the only dramatic outlier in the diagram is the flocculent spiral galaxy NGC 5055 (Fig. 3). For reference, earlier studies have also reported brightest group and cluster galaxies would depart upward from the mean relations (e.g., Boylan-Kolchin et al. 2006; Lauer et al. 2007; McConnell et al. 2011, 2012; Hlavacek-Larrondo et al. 2012; Volonteri & Ciotti 2013; Thomas et al. 2016; Mezcua et al. 2018). This work (see also Dullo 2019) has provided detailed characterisation of the relations and the brightest galaxies causing the offset at the high-mass end (e.g., , , , and of large-core galaxies).
Fitting the core-Sérsic galaxies separately results in relations with steeper slopes than those for the combined Sérsic plus core-Sérsic types (Table 3 and Figs. 2 and 3). McConnell & Ma (2013) reported two different relations for ‘core’ and ‘power-law’ galaxies have similar slopes but significantly different intercepts. Of their 28 core galaxies, three galaxies with low values km s-1 (NGG 1374, NGG 4473 and NGG 5576) were reclassified as a Sérsic type by Dullo & Graham (2014). They also consider the potentially Sérsic galaxy NGC 5128, with a low ( km s-1) and a strong nuclear dust, as core type. It appears that these four low- galaxies and the large-core galaxies in McConnell & Ma (2013) sample collectively lead to higher intercept for the core galaxies. Dividing their sample galaxies into Sérsic and core-Sérsic galaxies, Sahu et al. (2019b) also advocated two relations with distinct slopes. We find that the slopes for our core-Sérsic relations are poorly constrained due to the fitted narrow baselines in . This has caused the slopes of the relations for normal-core galaxies and Sérsic+normal-core galaxies to agree with overlapping error bars. The marked division between Sérsic and normal-core galaxies reported by Sahu et al. (2019b) is less evident in our work. Importantly and as noted above, there is a full consistency between the relation defined by Sérsic galaxies and that established by the Sérsic plus normal-core galaxy sample (e.g., Graham & Scott 2013; Savorgnan & Graham 2015; Saglia et al. 2016; van den Bosch 2016; Krajnović et al. 2018a, b).
3.4. Offset in the and diagrams
As noted in the introduction, the relation predicts that SMBH masses for the most massive galaxies (i.e., km s-1, Lauer et al. 2007; Bernardi et al. 2007) cannot exceed . However, Fig. 3 reveals four galaxies with . Also, while the large break radii of all the three (four, if we include Holm 15A) large-core galaxies with measured (Fig. 2), which constitute % of all the core-Sérsic galaxies with measured to date, are fully consistent with the galaxies’ large black hole masses, these are not predicted by the relation (Fig. 3).
Furthermore, the relation for normal-core galaxies (Dullo & Graham, 2014, their Fig. 5 and Table 3) predicts that break radii for the most massive galaxies are kpc, thus large-core galaxies ( kpc) are not high-mass extensions of the less massive normal-core galaxies. In other words, the relation for a sample of core-Sérsic galaxies containing large- and normal-core galaxies has a break occurring at kpc.
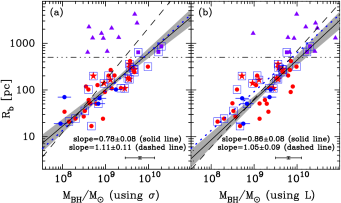
Fig. 4 shows the core-Sérsic break radius versus SMBH mass for our full sample of 51 core-Sérsic galaxies; 24 have direct SMBH masses (enclosed in boxes) and for the remaining 27 the SMBH masses are based on (Fig. 4a) and (Fig. 4b). The ols bisector fit to the 41 core-Sérsic galaxies in Fig. 4(a)—i.e., excluding the 10 large-core galaxies with -based SMBH masses (see Table 2)—yields log (pc) = (0.780.08) log () + (2.24 0.04). This relation is entirely consistent with that shown in Fig. 2(a) based on the galaxy sample with measured (dotted lines), but significantly different from the -based relation for the full sample of 51 core-Sérsic galaxies with a slope of and an intercept . As noted in Section 3.3, the discrepancy arises because the relation for Sérsic and normal-core core-Sérsic galaxies tends to underestimate the true SMBH masses in extremely massive galaxies.
A similar tendency is exhibited in Fig. 4(b) for -based ; the relation, which has a slope of and an intercept for the 41 core-Sérsic galaxies steepens for the full sample (slope and intercept ). Nonetheless, the relation is a better predictor of than the relation for large-core galaxies, confirming past findings (Bernardi et al. 2007; Lauer et al. 2007; McConnell et al. 2011, 2012; Volonteri & Ciotti 2013; Mezcua et al. 2018).
The offset nature of large-core galaxies in the and diagrams (Figs. 3, 4a and 4b) is also revealed when we compare the central stellar mass deficits () of the large-core galaxies with their -, - and -based SMBH masses. Table 2 lists the (central stellar mass deficit)-to-(SMBH mass) ratios for our large-core galaxies, where 10 160, 2 70 and 1 5. The prediction from high-accuracy -body simulations of “core scouring” by inspiraling binary SMBH (Merritt 2006) is that, after successive dry major mergers, the accumulated stellar mass deficit , where is the final mass of the SMBH. Therefore, the ratio is used as a proxy for the merger history of core-Sérsic galaxies. We computed for the large-core galaxies by measuring the central stellar luminosity deficit as the difference in luminosity between inwardly-extrapolated outer Sérsic profile of the complete core-Sérsic model and the core-Sérsic model (Dullo, 2019). These luminosity deficits are then converted into using the galaxy stellar mass-to-light ratios. The inferred merger rates from and translate to excessive number of major dry mergers () for 70% of the large-core spheroids. Conversely, and (Table 2) correspond to large-core galaxy formation via a reasonable number of (310) ‘dry’ major mergers, in agreement with observations measuring the close pair fraction (e.g., Bell et al. 2004, 2006; Man et al. 2012; Lidman et al. 2013; Casteels et al. 2014; Rodriguez-Gomez et al. 2015) and expectations from hierarchical structure formation models (Haehnelt & Kauffmann 2002, their Fig. 2; Khochfar & Silk 2009; Rodriguez-Gomez et al. 2015).
The excess merger rates derived above for large-core galaxies are too large to be explained by additional core scouring mechanisms (e.g., repeated core-passage by a gravitational radiation kicked SMBH, Dullo & Graham 2014, their Sections 5.3 and 5.4) which have been suggested to generate large by amplifying a pre-existing depleted core carved out by a binary SMBH (e.g., Redmount & Rees 1989; Merritt et al. 2004; Gualandris & Merritt 2012), albeit see Nasim et al. (2020). Numerical simulations of a Virgo-like galaxy cluster incorporating the effect of AGN feedback (Martizzi et al., 2012) produce a BCG with a core that is extremely large in size (10 kpc). While such extreme core depletion by the AGN implies a marked reduction of the inferred merger rate for the large-core galaxies, the simulated cores (Martizzi et al., 2012) are more than an order of magnitude larger than the real cores observed in the Virgo cluster galaxies (Dullo & Graham, 2014; Dullo, 2019): kpc for the BCG in the Virgo B subcluster (NGC 4472, Ferrarese et al. 2012) and kpc for the Virgo A subcluster BCG (M87). For reference, the largest core size measured in any real galaxy to date is kpc (Dullo et al., 2017). Furthermore, there are observed evidences for core scouring by SMBH binaries. The excess of tangential orbits observed in the galaxy cores (e.g., Gebhardt et al. 2003; Thomas et al. 2014, 2016) can naturally form when a SMBH binary decays orbitally, preferentially ejecting stars that are on radial orbits (Quinlan & Hernquist 1997; Milosavljević & Merritt 2001). Also, Thomas et al. (2016); Rantala et al. (2018); Mehrgan et al. (2019) revealed a strong correlation between the size of the depleted core in a galaxy and the radius of the black hole’ s sphere of influence.
3.5. Pathways for the growth of spheroids and black holes in large-core, normal-core and Sérsic galaxies
As noted in the Introduction, depleted cores are thought to be generated by inspiraling binary SMBHs created in major dry mergers (Begelman et al. 1980). Supporting this scenario, we find that the core size () for large-core galaxies ( kpc) and normal-core galaxies ( kpc) is strongly correlated with the SMBH mass (Lauer et al. 2007; Dullo & Graham 2012; Rusli et al. 2013a; Dullo & Graham 2014; Thomas et al. 2016; Mehrgan et al. 2019; Dullo 2019).
We emphasized above that Sérsic and normal-core galaxies appear to follow a single log-linear relation, while large-core galaxies, the bulk (77%) of which are BCGs, are offset (to higher ), Table 3 and Figs. 2 and 3. When core-Sérsic galaxies are fitted separately, the resulting core-Sérsic relation, with a steeper slope than that for the combined Sérsic plus core-Sérsic types, is poorly constrained. King & Nealon (2019) argue that present-day galaxies, with overmassive black holes that offset upward from the relation, may be descendants of the compact blue nuggets formed at , possibly connecting high-redshift blue nuggets to large-core galaxies. Taken together our findings are consistent with the two breaks recently detected in relation occurring at mag and mag (Dullo, 2019, his Fig. 7), which coincide with the Sérsic versus normal-core and normal-core versus large-core divides, respectively. Akin ot this, we find that the relation (Dullo & Graham, 2014, their Fig. 5 and Table 3) has a break occurring at kpc. Our findings carry important implications for the formation origins of large- and normal-core spheroids.
The offset tendency of large-core spheroids ( mag) in the and diagrams suggests that these galaxies are built via major ‘dry’ mergers, that create their large cores and grow their black hole masses and spheroid stellar masses, while keeping their velocity dispersion relatively unaffected (e.g., Nipoti et al. 2003; Ciotti et al. 2007; Oser et al. 2012; Hilz et al. 2013). In Dullo (2019) we find that large-core spheroids are more likely to experience a higher proportion of major mergers than normal-core spheroids, consistent with the expectation that BCGs experience a more intense merging and accretion events than galaxies with relatively low luminosities (e.g., Boylan-Kolchin et al. 2006; De Lucia & Blaizot 2007; Bernardi et al. 2007; Laporte et al. 2013). We (Dullo, 2019) revealed a flattening of the slope of the relation at the most luminous end, where the velocity dispersion of the large-core spheroids appears to saturate, contrary the velocity dispersion for normal-core galaxies, which increases with galaxy luminosity as . This observed trend of the relation for the most massive galaxies was recovered in the theoretical models of Tonini et al. (2016, see their Fig. 5).
The relation for normal-core galaxies ( mag) may suggest that these galaxies evolve through a few (18) successive gas-poor (but not purely ‘dry’) major666Kormendy & Bender (2013) argue that a few dissipationless mergers between two nearly equal-mass galaxies involving SMBHs are a viable formation mechanism for core-Sérsic galaxies rather than a series of several minor mergers. mergers since (e.g., Bell et al., 2004, 2006; Man et al., 2012; Dullo & Graham, 2012, 2013, 2014, 2015; Dullo et al., 2018), accompanied by low level star formation detected by GALEX (e.g., Gil de Paz et al., 2007; Bouquin et al., 2018). That is, normal-core galaxies are ‘red but not strictly dead’, see de La Rosa et al. (2011); Habouzit et al. (2019); Davis et al. (2019). We cannot currently draw a firm conclusion, but this issue will be further investigated in a forthcoming paper (Dullo 2020, in prep.). On the other hand, Sérsic galaxies ( mag) are said to be products gas-rich major mergers and (major merger)-free processes (e.g., secular processes and minor mergers), (e.g., Faber et al., 1997; Hopkins et al., 2009a; Dullo et al., 2019). Gas-rich processes increase a galaxy’s velocity dispersion, black hole mass and spheroid stellar mass, explaining the steepened relation for Sérsic galaxies (see Kormendy & Bender 2013; Krajnović et al. 2018a, b; Sahu et al. 2019b ; Dullo 2019, his Fig. 7).
4. Conclusions
Bright early-type (core-Sérsic) galaxies have a partially depleted
core, a flattening in their inner stellar light distributions relative
to the inward extrapolation of the spheroid’s outer Sérsic profile,
thought to be created by coalescing binary SMBHs. The core-Sérsic
model, which describes the light profiles of the spheroidal components
of core-Sérsic galaxies, enables the flattened core sizes to be
measured by its break radius (). We probed how well the
mass of SMBHs () correlates with the central velocity
dispersion () and core size () of their host
galaxies, placing a strong emphasis on the high-mass end. We do so
using a large sample of 144 galaxies with dynamically determined SMBH
masses, of which 24 are core-Sérsic galaxies robustly identified
based on the analysis of the galaxy high-resolution HST
imaging. Rusli et al. (2013a) have investigated the
relation using their dataset for 23
core-Sérsic galaxies, 21 of which are in common with our sample. We
acknowledge that there may be more core-Sérsic galaxies with
measured SMBH mass in our sample, but even if this is true our
conclusions remain unchanged. Our principal conclusions are:
1) SMBH mass and core size correlate remarkably well. This tight relation, which is stronger than the relation. In line with previous works (e.g., Thomas et al. 2016), we established the relation out to the high-mass end. The relation is defined by core-Sérsic (i.e., combination of normal-core plus large-core) galaxies with mag and it has , a vertical rms scatter in the log of dex and an intrinsic scatter of dex. We also checked and found that the BCG Holm 15A, which hosts the most massive dynamically measured the black hole in the local universe to date (, Mehrgan et al. 2019) extends the tight sequence traced by other core-Sérsic galaxies to high and , by a factor of than previously possible. However, this is if the galaxy has a depleted core ( kpc, Mehrgan et al. 2019), although Bonfini et al. (2015); Madrid & Donzelli (2016) did not identify one.
2) Separating our sample into Sérsic, normal-core and large-core galaxies, we find that Sérsic and normal-core galaxies unite to define a single log-linear relation with a slope of , 0.39 dex and dex in the log . A key result is that large-core galaxies (four of which, including Holm 15A, have measured , while for the remaining 10 is predicted using the relation) are offset upward systematically by from the sequence traced by Sérsic and normal-core galaxies. While core-Sérsic galaxies alone seem to follow steeper relations than the combined Sérsic plus core-Sérsic types, the former are poorly constrained due to the narrow baseline in probed by the core-Sérsic galaxies. Previous studies also argued that the relation gets steeper for the brightest group and cluster galaxies (e.g., Boylan-Kolchin et al. 2006; Lauer et al. 2007; McConnell et al. 2011; Volonteri & Ciotti 2013). Using four measured and 10 predicted for large-core galaxies, we (see also Dullo 2019) have offered insights into the possible nature of the galaxies deriving the offset at the high-mass end (e.g., , , , and of large-core galaxies). When Sérsic, normal-core and large-core galaxies are fitted together, the resulting relation steepens to give a slope of . We also find that the relation (Dullo & Graham, 2014, their Fig. 5 and Table 3) has a break occurring at kpc, which is internally consistent with the normal-core versus large-core divide.
3) For core-Sérsic galaxies, the relation exhibits 62% more scatter in log than the relation, favouring to estimate the ultramassive black hole masses () in the most massive (large-core) spheroids with mag and , instead of e.g., (Figs. 2, 3 and 4).
4) Taken together our findings reveal that the relation for the Sérsic and normal-core galaxies substantially underpredicts the SMBH masses of large-core galaxies, i.e., the measured ones and those estimated by the relation. The assumption in galaxy formation models involving SMBHs that all classical bulges and elliptical galaxies obey a single relation may be invalid. Extremely massive galaxies need to be treated separately in such models.
5) We argue that large-core spheroids are consequences of multiple major ‘dry’ merging events involving super/ultramassive BHs, that create their large cores and simply add the black hole masses, stellar masses and luminosities of their progenitors, while keeping the velocity dispersion relatively unaffected. This conclusion is consistent with the offset tendency of large-core galaxies in the diagrams and the flattening in the relation observed at mag (Dullo, 2019).
We highlight that the high SMBH masses of large-core galaxies means they are targets of great interest for the detection and study of gravitational waves (GWs) using pulsar timing array (PTA) and Laser Interferometer Space Antenna (LISA). Current PTAs are sensitive to gravitational waves emitted by merging binary SMBHs with total mass at a distance 200 Mpc (see Burke-Spolaor et al. 2019), while LISA is sensitive to binary SMBHs with mass (Amaro-Seoane et al., 2017; Katz et al., 2020).
5. ACKNOWLEDGMENTS
We thank the referee for their suggestions that improved the paper. B.T.D acknowledges supports from a Spanish postdoctoral fellowship ‘Ayudas 1265 para la atracción del talento investigador. Modalidad 2: jóvenes investigadores.’ funded by Comunidad de Madrid under grant number 2016-T2/TIC-2039 and from the award of ‘Estancias movilidad en el extranjero ’José Castillejo’ para jóvenes doctores 2019’, grant number CAS19/00344, offered by the Spanish ministry of science and innovation for a research stay at Swinburne University of Technology (01/01/2020-31/03/2020). B.T.D acknowledges financial support from grant ‘Ayudas para la realización de proyectos de I+D para jóvenes doctores 2019.’ funded by Comunidad de Madrid and Universidad Complutense de Madrid under grant number PR65/19-22417. B.T.D and A.G.d.P acknowledge financial support from the Spanish Ministry of Science, Innovation and Universities (MCIUN) under grant numbers AYA2016-75808-R and RTI2018-096188-B-I00. J.H.K. acknowledges financial support from the European Union’s Horizon 2020 research and innovation programme under Marie Skłodowska-Curie grant agreement No 721463 to the SUNDIAL ITN network, from the State Research Agency (AEI-MCINN) of the Spanish Ministry of Science and Innovation under the grant “The structure and evolution of galaxies and their central regions” with reference PID2019-105602GB-I00/10.13039/501100011033, and from IAC project P/300724, financed by the Ministry of Science and Innovation, through the State Budget and by the Canary Islands Department of Economy, Knowledge and Employment, through the Regional Budget of the Autonomous Community.
References
- Akritas & Bershady (1996) Akritas, M. G., & Bershady, M. A. 1996, ApJ, 470, 706
- Amaro-Seoane et al. (2017) Amaro-Seoane, P., Audley, H., Babak, S., et al. 2017, arXiv e-prints, arXiv:1702.00786
- Begelman et al. (1980) Begelman, M. C., Blandford, R. D., & Rees, M. J. 1980, Nature, 287, 307
- Beifiori et al. (2012) Beifiori, A., Courteau, S., Corsini, E. M., & Zhu, Y. 2012, MNRAS, 419, 2497
- Bell et al. (2004) Bell, E. F., Wolf, C., Meisenheimer, K., et al. 2004, ApJ, 608, 752
- Bell et al. (2006) Bell, E. F., Naab, T., McIntosh, D. H., et al. 2006, ApJ, 640, 241
- Bernardi et al. (2007) Bernardi, M., Hyde, J. B., Sheth, R. K., Miller, C. J., & Nichol, R. C. 2007, AJ, 133, 1741
- Bonfini et al. (2015) Bonfini, P., Dullo, B. T., & Graham, A. W. 2015, ApJ, 807, 136
- Bouquin et al. (2018) Bouquin, A. Y. K., Gil de Paz, A., Muñoz-Mateos, J. C., et al. 2018, ApJS, 234, 18
- Boylan-Kolchin et al. (2006) Boylan-Kolchin, M., Ma, C.-P., & Quataert, E. 2006, MNRAS, 369, 1081
- Burke-Spolaor et al. (2019) Burke-Spolaor, S., Taylor, S. R., Charisi, M., et al. 2019, A&A Rev., 27, 5
- Carollo et al. (1997) Carollo, C. M., Franx, M., Illingworth, G. D., & Forbes, D. A. 1997, ApJ, 481, 710
- Casteels et al. (2014) Casteels, K. R. V., Conselice, C. J., Bamford, S. P., et al. 2014, MNRAS, 445, 1157
- Ciotti et al. (2007) Ciotti, L., Lanzoni, B., & Volonteri, M. 2007, ApJ, 658, 65
- Croton et al. (2006) Croton, D. J., Springel, V., White, S. D. M., et al. 2006, MNRAS, 365, 11
- Davis et al. (2019) Davis, T. A., Greene, J. E., Ma, C.-P., et al. 2019, MNRAS, 486, 1404
- de La Rosa et al. (2011) de La Rosa, I. G., La Barbera, F., Ferreras, I., & de Carvalho, R. R. 2011, MNRAS, 418, L74
- De Lucia & Blaizot (2007) De Lucia, G., & Blaizot, J. 2007, MNRAS, 375, 2
- de Nicola et al. (2019) de Nicola, S., Marconi, A., & Longo, G. 2019, MNRAS, 490, 600
- Di Matteo et al. (2005) Di Matteo, T., Springel, V., & Hernquist, L. 2005, Nature, 433, 604
- Dullo (2019) Dullo, B. T. 2019, ApJ, 886, 80
- Dullo et al. (2020) Dullo, B. T., Bouquin, A. Y. K., Gil de Paz, A., Knapen, J. H., & Gorgas, J. 2020, ApJ, 898, 83
- Dullo & Graham (2012) Dullo, B. T., & Graham, A. W. 2012, ApJ, 755, 163
- Dullo & Graham (2013) —. 2013, ApJ, 768, 36
- Dullo & Graham (2014) —. 2014, MNRAS, 444, 2700
- Dullo & Graham (2015) —. 2015, ApJ, 798, 55
- Dullo et al. (2017) Dullo, B. T., Graham, A. W., & Knapen, J. H. 2017, MNRAS, 471, 2321
- Dullo et al. (2016) Dullo, B. T., Martínez-Lombilla, C., & Knapen, J. H. 2016, MNRAS, 462, 3800
- Dullo et al. (2018) Dullo, B. T., Knapen, J. H., Williams, D. R. A., et al. 2018, MNRAS, 475, 4670
- Dullo et al. (2019) Dullo, B. T., Chamorro-Cazorla, M., Gil de Paz, A., et al. 2019, ApJ, 871, 9
- Ebisuzaki et al. (1991) Ebisuzaki, T., Makino, J., & Okumura, S. K. 1991, Nature, 354, 212
- Faber et al. (1997) Faber, S. M., Tremaine, S., Ajhar, E. A., et al. 1997, AJ, 114, 1771
- Fabian (1999) Fabian, A. C. 1999, MNRAS, 308, L39
- Feigelson & Babu (1992) Feigelson, E. D., & Babu, G. J. 1992, ApJ, 397, 55
- Ferrarese & Ford (2005) Ferrarese, L., & Ford, H. 2005, Space Sci. Rev., 116, 523
- Ferrarese & Merritt (2000) Ferrarese, L., & Merritt, D. 2000, ApJ, 539, L9
- Ferrarese et al. (2006) Ferrarese, L., Côté, P., Jordán, A., et al. 2006, ApJS, 164, 334
- Ferrarese et al. (2012) Ferrarese, L., Côté, P., Cuilland re, J.-C., et al. 2012, ApJS, 200, 4
- Fukugita et al. (1995) Fukugita, M., Shimasaku, K., & Ichikawa, T. 1995, PASP, 107, 945
- Gebhardt et al. (2000) Gebhardt, K., Bender, R., Bower, G., et al. 2000, ApJ, 539, L13
- Gebhardt et al. (2003) Gebhardt, K., Richstone, D., Tremaine, S., et al. 2003, ApJ, 583, 92
- Gil de Paz et al. (2007) Gil de Paz, A., Boissier, S., Madore, B. F., et al. 2007, ApJS, 173, 185
- Graham (2016) Graham, A. W. 2016, in Astrophysics and Space Science Library, Vol. 418, Galactic Bulges, ed. E. Laurikainen, R. Peletier, & D. Gadotti, 263
- Graham et al. (2003) Graham, A. W., Erwin, P., Trujillo, I., & Asensio Ramos, A. 2003, AJ, 125, 2951
- Graham et al. (2011) Graham, A. W., Onken, C. A., Athanassoula, E., & Combes, F. 2011, MNRAS, 412, 2211
- Graham & Scott (2013) Graham, A. W., & Scott, N. 2013, ApJ, 764, 151
- Gualandris & Merritt (2012) Gualandris, A., & Merritt, D. 2012, ApJ, 744, 74
- Gültekin et al. (2014) Gültekin, K., Gebhardt, K., Kormendy, J., et al. 2014, ApJ, 781, 112
- Habouzit et al. (2019) Habouzit, M., Genel, S., Somerville, R. S., et al. 2019, MNRAS, 484, 4413
- Haehnelt & Kauffmann (2002) Haehnelt, M. G., & Kauffmann, G. 2002, MNRAS, 336, L61
- Häring & Rix (2004) Häring, N., & Rix, H.-W. 2004, ApJ, 604, L89
- Hilz et al. (2013) Hilz, M., Naab, T., & Ostriker, J. P. 2013, MNRAS, 429, 2924
- Hlavacek-Larrondo et al. (2012) Hlavacek-Larrondo, J., Fabian, A. C., Edge, A. C., & Hogan, M. T. 2012, MNRAS, 424, 224
- Hopkins et al. (2009a) Hopkins, P. F., Cox, T. J., Dutta, S. N., et al. 2009a, ApJS, 181, 135
- Hopkins et al. (2006) Hopkins, P. F., Hernquist, L., Cox, T. J., et al. 2006, ApJS, 163, 1
- Hopkins et al. (2009b) Hopkins, P. F., Lauer, T. R., Cox, T. J., Hernquist, L., & Kormendy, J. 2009b, ApJS, 181, 486
- Jahnke & Macciò (2011) Jahnke, K., & Macciò, A. V. 2011, ApJ, 734, 92
- Katz et al. (2020) Katz, M. L., Kelley, L. Z., Dosopoulou, F., et al. 2020, MNRAS, 491, 2301
- Kelly (2007) Kelly, B. C. 2007, ApJ, 665, 1489
- Khan et al. (2013) Khan, F. M., Holley-Bockelmann, K., Berczik, P., & Just, A. 2013, ApJ, 773, 100
- Khochfar & Silk (2009) Khochfar, S., & Silk, J. 2009, MNRAS, 397, 506
- King & Nealon (2019) King, A., & Nealon, R. 2019, MNRAS, 487, 4827
- Kormendy & Bender (2013) Kormendy, J., & Bender, R. 2013, ApJ, 769, L5
- Kormendy & Ho (2013) Kormendy, J., & Ho, L. C. 2013, ARA&A, 51, 511
- Kormendy & Richstone (1995) Kormendy, J., & Richstone, D. 1995, ARA&A, 33, 581
- Krajnović et al. (2018a) Krajnović, D., Cappellari, M., & McDermid, R. M. 2018a, MNRAS, 473, 5237
- Krajnović et al. (2018b) Krajnović, D., Cappellari, M., McDermid, R. M., et al. 2018b, MNRAS, 477, 3030
- Laporte et al. (2013) Laporte, C. F. P., White, S. D. M., Naab, T., & Gao, L. 2013, MNRAS, 435, 901
- Lauer et al. (2007) Lauer, T. R., Faber, S. M., Richstone, D., et al. 2007, ApJ, 662, 808
- Lidman et al. (2013) Lidman, C., Iacobuta, G., Bauer, A. E., et al. 2013, MNRAS, 433, 825
- Madrid & Donzelli (2016) Madrid, J. P., & Donzelli, C. J. 2016, ApJ, 819, 50
- Magorrian et al. (1998) Magorrian, J., Tremaine, S., Richstone, D., et al. 1998, AJ, 115, 2285
- Makarov et al. (2014) Makarov, D., Prugniel, P., Terekhova, N., Courtois, H., & Vauglin, I. 2014, A&A, 570, A13
- Man et al. (2012) Man, A. W. S., Toft, S., Zirm, A. W., Wuyts, S., & van der Wel, A. 2012, ApJ, 744, 85
- Marconi & Hunt (2003) Marconi, A., & Hunt, L. K. 2003, ApJ, 589, L21
- Martizzi et al. (2012) Martizzi, D., Teyssier, R., & Moore, B. 2012, MNRAS, 420, 2859
- Mazzalay et al. (2016) Mazzalay, X., Thomas, J., Saglia, R. P., et al. 2016, MNRAS, 462, 2847
- McConnell & Ma (2013) McConnell, N. J., & Ma, C.-P. 2013, ApJ, 764, 184
- McConnell et al. (2011) McConnell, N. J., Ma, C.-P., Gebhardt, K., et al. 2011, Nature, 480, 215
- McConnell et al. (2012) McConnell, N. J., Ma, C.-P., Murphy, J. D., et al. 2012, ApJ, 756, 179
- McLure & Dunlop (2002) McLure, R. J., & Dunlop, J. S. 2002, MNRAS, 331, 795
- Mehrgan et al. (2019) Mehrgan, K., Thomas, J., Saglia, R., et al. 2019, ApJ, 887, 195
- Merritt (2006) Merritt, D. 2006, ApJ, 648, 976
- Merritt et al. (2004) Merritt, D., Milosavljević, M., Favata, M., Hughes, S. A., & Holz, D. E. 2004, ApJ, 607, L9
- Mezcua et al. (2018) Mezcua, M., Hlavacek-Larrondo, J., Lucey, J. R., et al. 2018, MNRAS, 474, 1342
- Milosavljević & Merritt (2001) Milosavljević, M., & Merritt, D. 2001, ApJ, 563, 34
- Nasim et al. (2020) Nasim, I., Gualandris, A., Read, J. I., et al. 2020, arXiv e-prints, arXiv:2011.04663
- Nemmen et al. (2012) Nemmen, R. S., Georganopoulos, M., Guiriec, S., et al. 2012, Science, 338, 1445
- Nipoti et al. (2003) Nipoti, C., Londrillo, P., & Ciotti, L. 2003, MNRAS, 342, 501
- Oser et al. (2012) Oser, L., Naab, T., Ostriker, J. P., & Johansson, P. H. 2012, ApJ, 744, 63
- Peng (2007) Peng, C. Y. 2007, ApJ, 671, 1098
- Quinlan & Hernquist (1997) Quinlan, G. D., & Hernquist, L. 1997, MNRAS, 2, 533
- Rantala et al. (2018) Rantala, A., Johansson, P. H., Naab, T., Thomas, J., & Frigo, M. 2018, ApJ, 864, 113
- Redmount & Rees (1989) Redmount, I. H., & Rees, M. J. 1989, Comments on Astrophysics, 14, 165
- Rodriguez-Gomez et al. (2015) Rodriguez-Gomez, V., Genel, S., Vogelsberger, M., et al. 2015, MNRAS, 449, 49
- Rusli et al. (2013a) Rusli, S. P., Erwin, P., Saglia, R. P., et al. 2013a, AJ, 146, 160
- Rusli et al. (2013b) Rusli, S. P., Thomas, J., Saglia, R. P., et al. 2013b, AJ, 146, 45
- Saglia et al. (2016) Saglia, R. P., Opitsch, M., Erwin, P., et al. 2016, ApJ, 818, 47
- Sahu et al. (2019a) Sahu, N., Graham, A. W., & Davis, B. L. 2019a, ApJ, 876, 155
- Sahu et al. (2019b) —. 2019b, ApJ, 887, 10
- Savorgnan & Graham (2015) Savorgnan, G. A. D., & Graham, A. W. 2015, MNRAS, 446, 2330
- Shankar et al. (2016) Shankar, F., Bernardi, M., Sheth, R. K., et al. 2016, MNRAS, 460, 3119
- Shankar et al. (2019) Shankar, F., Bernardi, M., Richardson, K., et al. 2019, MNRAS, 485, 1278
- Silk & Rees (1998) Silk, J., & Rees, M. J. 1998, A&A, 331, L1
- Springel et al. (2005) Springel, V., White, S. D. M., Jenkins, A., et al. 2005, Nature, 435, 629
- Thater et al. (2019) Thater, S., Krajnović, D., Cappellari, M., et al. 2019, A&A, 625, A62
- Thomas et al. (2016) Thomas, J., Ma, C.-P., McConnell, N. J., et al. 2016, Nature, 532, 340
- Thomas et al. (2014) Thomas, J., Saglia, R. P., Bender, R., Erwin, P., & Fabricius, M. 2014, ApJ, 782, 39
- Tonini et al. (2016) Tonini, C., Mutch, S. J., Croton, D. J., & Wyithe, J. S. B. 2016, MNRAS, 459, 4109
- Tremaine et al. (2002) Tremaine, S., Gebhardt, K., Bender, R., et al. 2002, ApJ, 574, 740
- van den Bosch (2016) van den Bosch, R. C. E. 2016, ApJ, 831, 134
- Vasiliev et al. (2015) Vasiliev, E., Antonini, F., & Merritt, D. 2015, ApJ, 810, 49
- Volonteri & Ciotti (2013) Volonteri, M., & Ciotti, L. 2013, ApJ, 768, 29
- Wu et al. (2015) Wu, X.-B., Wang, F., Fan, X., et al. 2015, Nature, 518, 512