Graphene plasmon-phonon coupled modes at the exceptional point
Abstract
Properties of graphene plasmons are greatly affected by their coupling to phonons. While such coupling has been routinely observed in both near-field and far-field graphene spectroscopy, the interplay between coupling strength and mode losses, and its exceptional point physics has not been discussed. By applying a non-Hermitian framework, we identify the transition point between strong and weak coupling as the exceptional point. Enhanced sensitivity to perturbations near the exceptional point is observed by varying the coupling strength and through gate modulation of the graphene Fermi level. Finally, we also show that the transition from strong to weak coupling is observable by changing the incident angle of radiation.
I Introduction
The response of coupled systems have been shown to strongly depend on the relative strength of their coupling and losses. Here we will be focusing on light-matter coupling. When the coupling is strong relative to the losses, the mode degeneracy is lifted, giving rise to hybridized modes at split frequenciesLiu2014 . The resulting absorption spectrum has two peaks that are separated by , where is the linewidth. When the coupling is weak, the peak’s degeneracy is no longer lifted but these degenerate modes can still interfere. In the limit of contrasting linewidths (), destructive interference between the modes results in a sharp optical transparency region within a broad absorption peakFleischhauer2005 . Such ‘strong’ and ‘weak’ coupling response has been observed in many physical systems including three-level atomsAnisimov2011 , whispering-gallery-mode microresonatorsPeng2014a , mechanical systemsTassin2013 , and plasmonicsZhang2008a ; Tormo2015a .
The role of coupling() and loss() is also an important factor in non-Hermitian sytemsEl-Ganainy2018 , which are open systems that exchange energy with their environment. The importance of coupling and loss is highlighted in a subset of non-Hermitian systems that obey parity-time (PT) symmetryGuo . When , the eigenstates of the system are PT symmetric and the eigenvalues are real. When the eigenstates are no longer PT symmetric and the eigenvalues become complex. At , there is a non-Hermitian singularity, also known as the exceptional point (EP), where both the eigenvalues and eigenvectors coalesce (see Fig. 1). This transition has been utilized to demonstrate non-reciprocal propagation in waveguidesRuter2010 , asymmetric transmission of polarized lightLawrence2014 , and PT-symmetric lasersHodaei2014 . Also, exceptional points have been reported to exhibit enhanced sensitivity to perturbationsWiersig2020a ; Hodaei2017 ; Chen2017 .
Plasmons in graphene couple with phonons and have been experimentally observed in various contexts. When patterned graphene is placed on a silicon dioxide substrate, coupling with the surface optical phonon modes are directly observable in the extinction spectraYan2013 . Coupling with surface modes in atomically thin polar materials such as hBN was also observedBrar2014 . For bilayer graphene, plasmons couple with its intrinsic point optical phonon, resulting in a sharp phonon-induced transparencyYan2014 ; Bezares2017 . Finally, the high confinement of graphene plasmons also allows them to couple with vibrational modes of adsorbed molecular layers or gases, allowing their fingerprinting through its extinction spectrumRodrigo2015 ; Farmer2016 ; Hu2019 ; Khaliji2020 ; Lee2019 .
In this paper, we discuss graphene plasmon-phonon coupling from the perspective of a non-Hermitian system, highlighting the interplay between coupling and loss. Harmonic inversion analysisFuchs2014 of the absorption spectra allows us to precisely identify the non-Hermitian singularity called the exceptional point positioned within the parameter space. By quantifying the changes in the spectral features upon perturbation of coupling strength, incidence angle of light, dielectric environment, and the position of the Fermi level, we demonstrate that the spectral splitting due to plasmon-phonon coupling in graphene is indeed most sensitive to perturbation when the system is at the exceptional point. Non-Hermitian and exceptional point physics provides a unique perspective in the understanding of plasmon-phonon coupled systems, and the approach we outline here sets the stage for the future design of sensing plasmon-phonon coupling characteristics via the EP.
II Exceptional point physics in plasmon-phonon coupling
Exceptional point physics in plasmon-phonon coupled system can be elucidated from both a classical and quantum point-of-view. As an example, we consider graphene on a polar substrate with surface optical phonon mode Hwang2010
We begin with a simple coupled mode model describing the response of the plasmon-phonon coupled systemHaus1985 . The equations of motion for the plasmon() and phonon() amplitudes are
| (1) | ||||
| (2) |
where accounts for plasmon loss including intrinsic() and extrinsic () contributions, is the phonon loss, and are the resonant frequencies of the plasmon and phonon, is the near-field coupling strength, and quantifies the input field that couples into the plasmon. Here, the surface optical(SO) phonon modes are not directly excited by light since they are not infrared active. Assuming that the amplitudes have a time dependence, the response of the plasmon is given by
| (3) |
where we have defined . From Eq. 3 a resonant response occurs when . When , the poles are at , where we have defined and . Written in this form, we see that there is a transition at the poles for . The poles found from Eq. 3 can be identified with the eigenvalues of a PT-symmetric matrixBender1998 of the form
| (4) |
By making this connection, we see that the transition point at could be identified as the exceptional point. If we consider a system in which the loss is fixed and coupling is tunable, writing gives the eigenvalues
| (5) |
This shows the well known characteristic square-root dependence of the mode splitting due to perturbations near an EPWiersig2020a .
Next, we explore the relationship between plasmon-phonon coupling and the EP via a quantum approach. In the limit , the total dielectric function for graphene within the random phase approximation including electron coupling to the SO phonons can be described byHwang2010
| (6) |
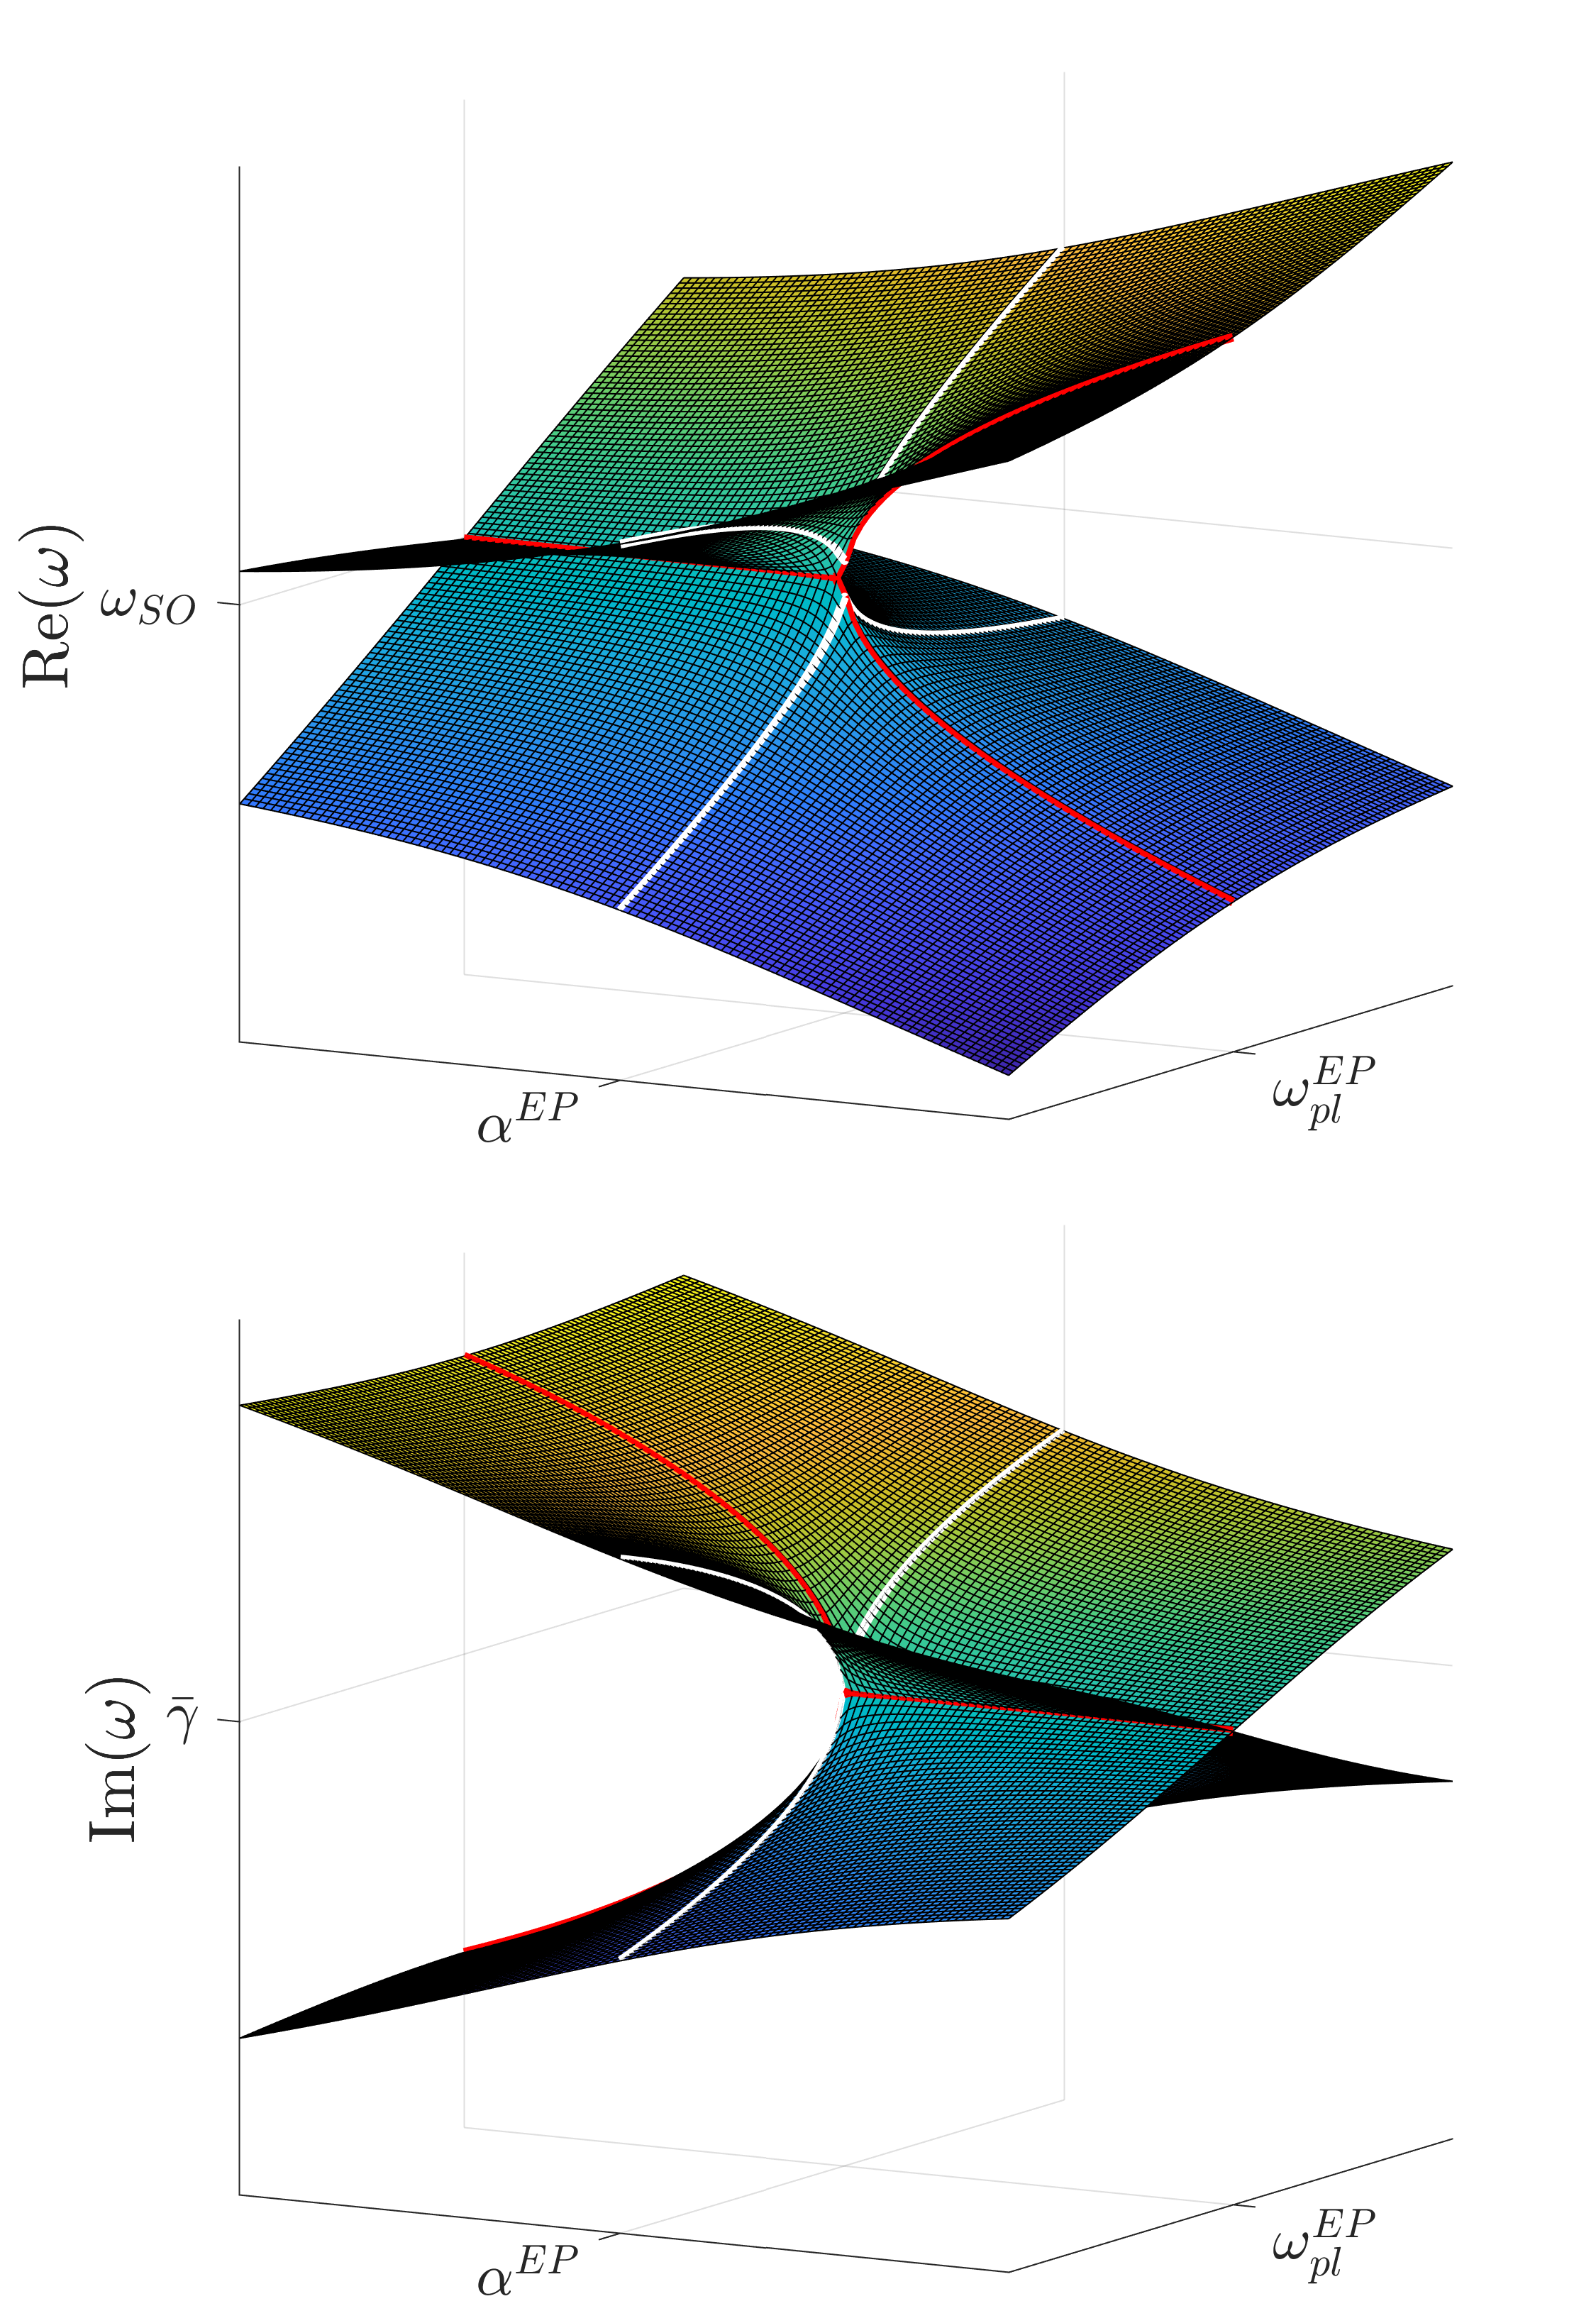
where is the plasmon frequency, is the electron scattering rate of graphene, and quantifies the strength of the electron-phonon interaction (analogous to defined in the coupled mode model). The dispersion of the coupled modes can be found by solving . Solutions of Eq. 6 as a function of and are shown in Fig. 1. The topology of the solutions reveal a point in the parameter space in which the real and imaginary parts of the solution become simultaneously degenerate, thus demonstrating the existence of an EP. Moreover, perturbations to the system at the EP induce splitting of the eigenvalues proportional to the square-root of the perturbation strengthWiersig2020a .
III Mode splitting at exceptional point
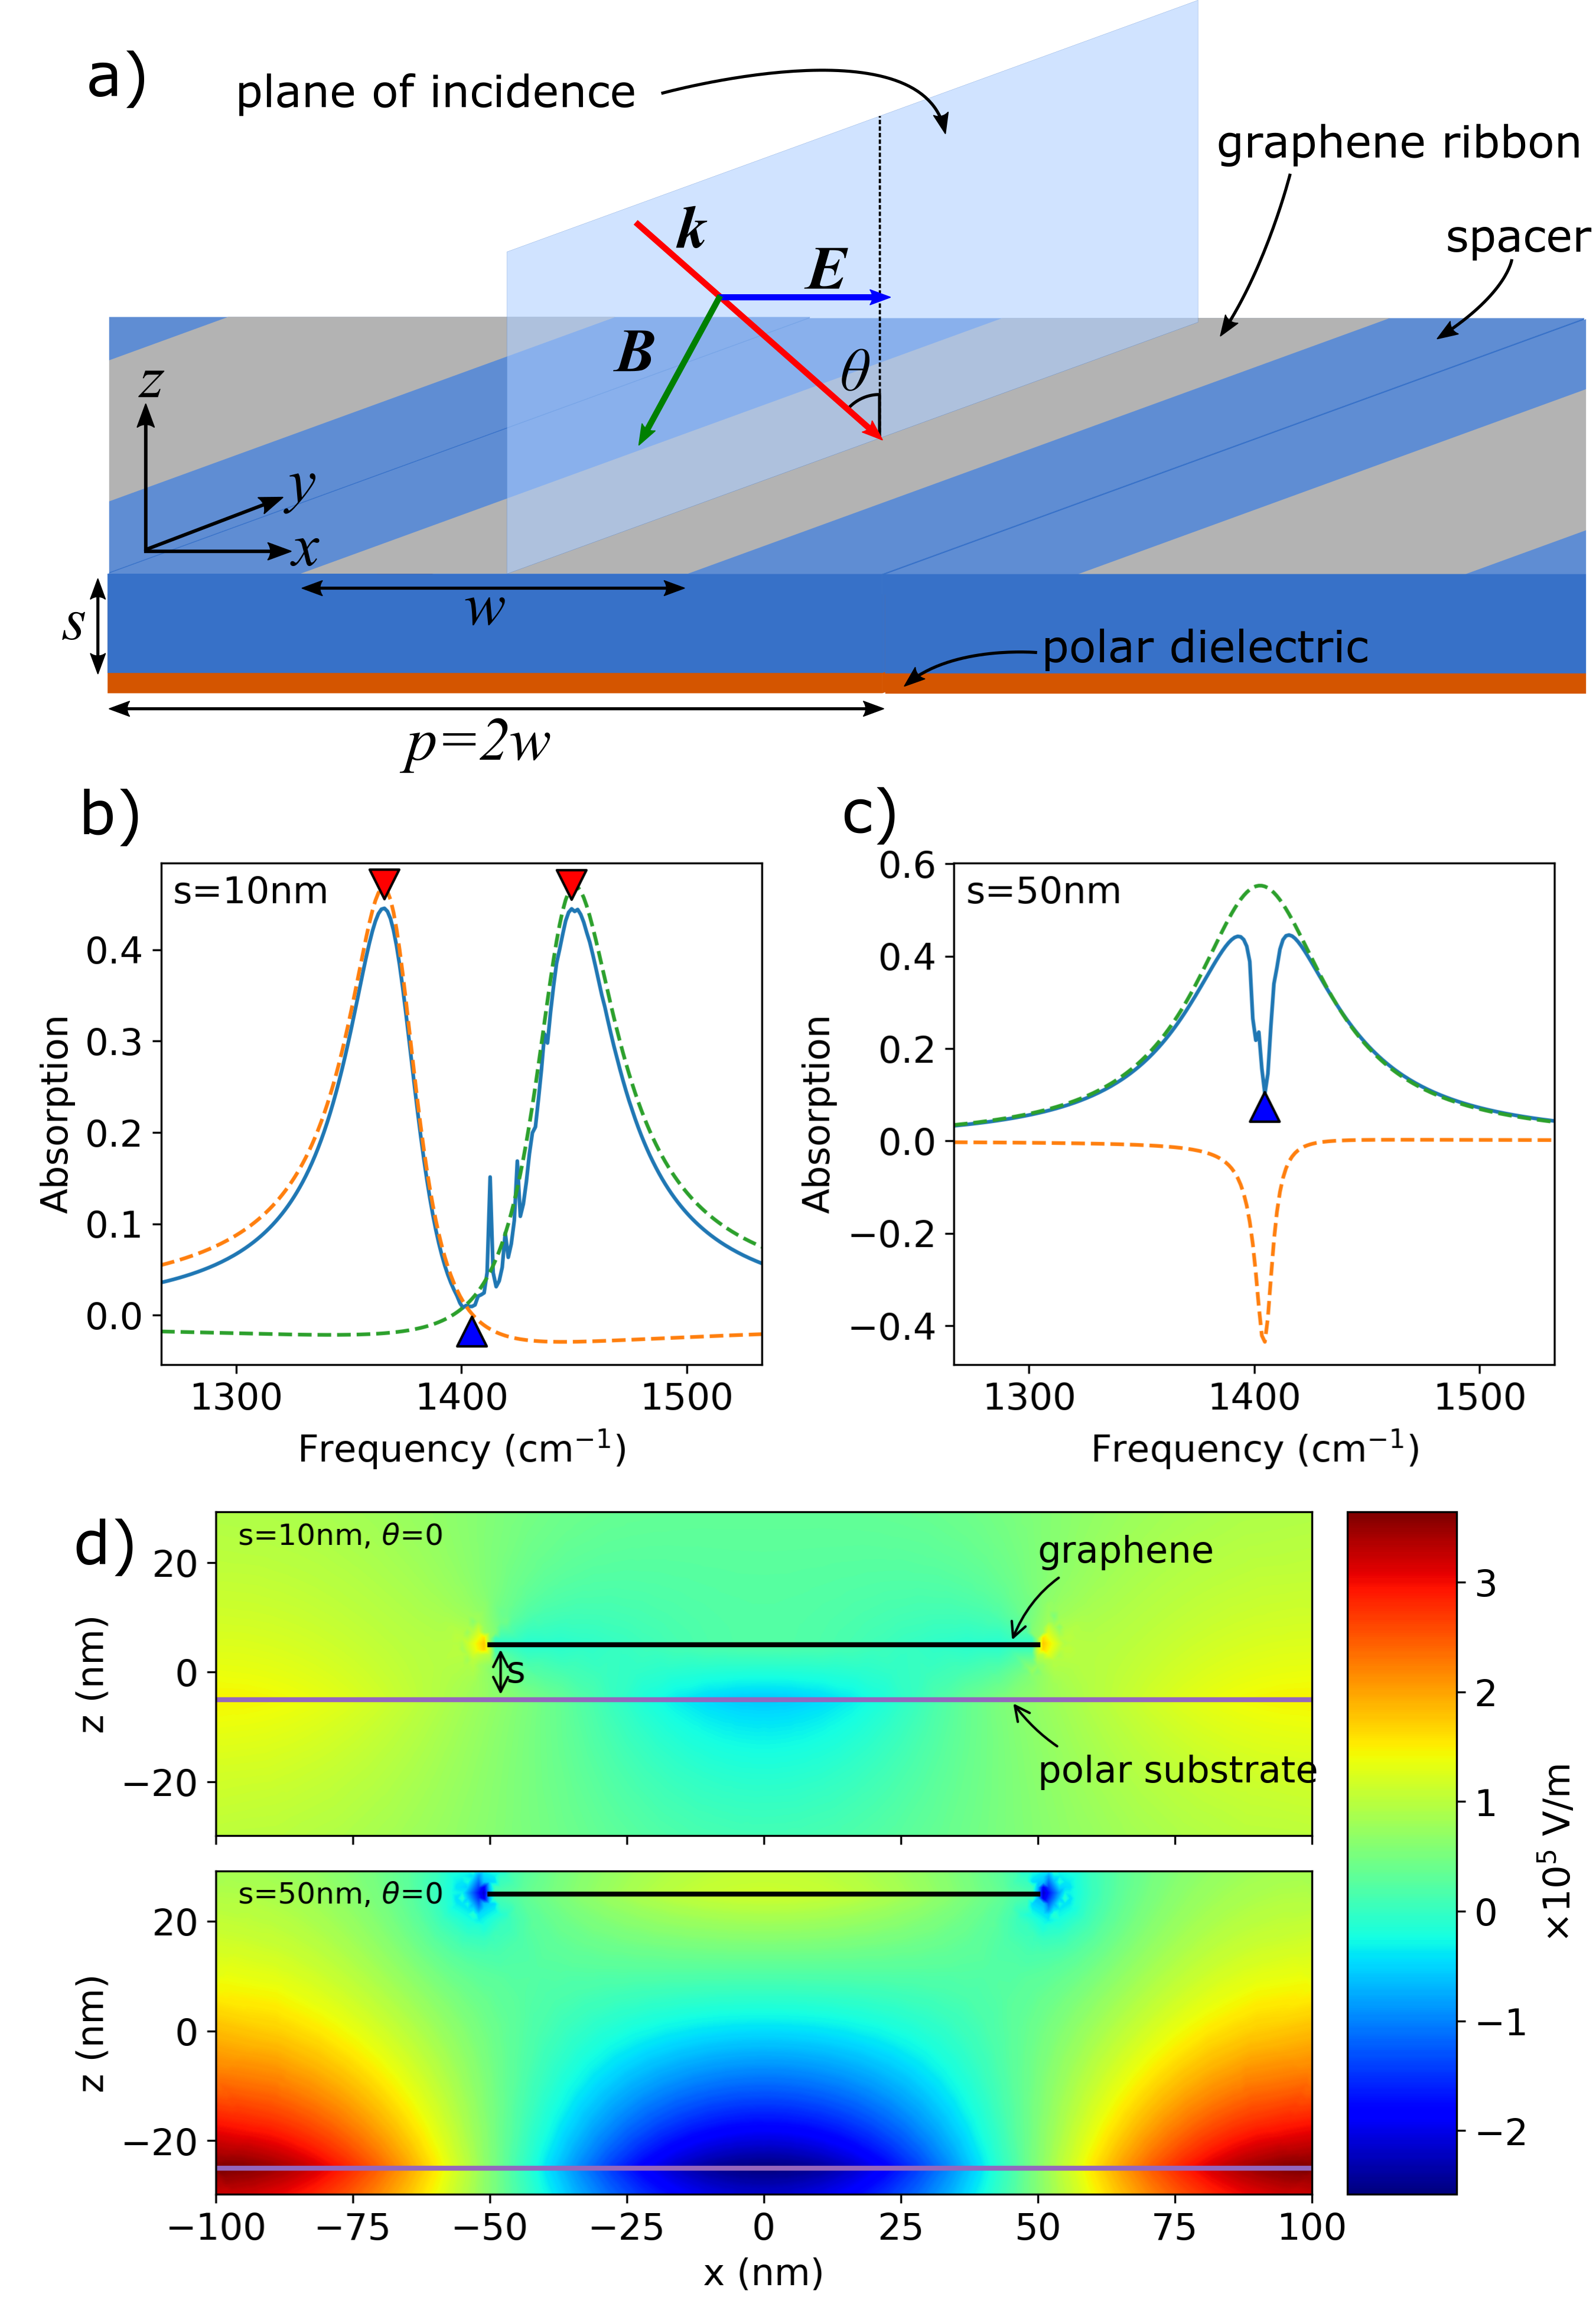
Plasmon-phonon coupling in graphene can be studied through a far-field scattering experiment via its absorption spectrum. A typical device consisting of an array of graphene nanoribbons as illustrated in Fig. 2(a). Graphene was modeled as a surface current density with conductivity given by
| (7) |
where . The lifetime of carriers in graphene is set to fsYan2013 . The polar dielectric material is modeled using the dipole oscillator model
| (8) |
where is the transverse optical phonon frequency, is the phonon scattering rate, and are the low(high) frequency limits of the dielectric function. A polar dielectric of thickness can be shown to support surface optical phonon modes with the thickness dependent dispersionGoncalves2016
| (9) |
where , is the dielectric constant of the surrounding medium, and . In the calculations and simulations to follow, we set cm-1, ps, , and . For a thin polar dielectric, the SO phonon mode that the plasmon couples to will be very close to the TO phonon frequency. A more detailed discussion of the surface optical phonon mode dispersion is given in the Supplemental Information (SI). Here, we assume that the polar dielectric has a thickness of 0.3nm. The thickness of the phonon layer controls the effective oscillator strength of the phonon mode. A thin layer is also analogous to having an adsorbed layer of molecules on the graphene nanoribbons, a setup commonly used in molecular sensing.
To determine the weak and strong coupling behavior of the graphene plasmon-polar dielectric phonon, we vary the distance, , between the plasmon and phonon layers. The graphene plasmon frequency is tuned to match the SO phonon frequency via doping or electrostatic gating. The absorption spectra for strong and weak coupling in Fig. 2(b) and (c) show lineshapes that are qualitatively different. In the strong coupling case, the absorption spectrum shows two distinct peaks (red arrows) that are well separated in frequency. The splitting in frequency is due to hybridization between the plasmon and phonon modes. The region of near-zero absorption between the modes naturally arises since there are no excitations in this spectral region. On the other hand, in the weak coupling case, we see a sharp transparency window in a broader absorption peak. This behavior is analogous to the electromagnetically induced transparency (EIT)Fleischhauer2005 , but in this case is produced by a destructive interference between the plasmon and phonon modesYan2014 ; Low2014a . While the absorption spectrum for both strong and weak coupling has a transparency region at , the corresponding field patterns shown in Fig. 2(d) are clearly dissimilar. The strong coupling case shows negligible field excitation when compared to the weak coupling case in which the phonon and plasmon are both strongly excited. This observation is consistent since the transparency in the weak coupling case arises not from an absence of modes but rather from an interaction between the modes resulting in destructive interference.
Indeed, there has been considerable discussion on distinguishing between strong and weak light-matter coupling through its extinction/absorption spectrumAnisimov2011 ; Peng2014a ; Hao2018 ; He2015 . A precise classification can be facilitated by using the harmonic inversion analysis methodFuchs2014 , which spectrally decompose the absorption spectrum into a superposition of complex Lorentzian resonances, with the form
| (10) |
where determines the lineshape of the decomposed resonance while and are the resonance frequency and scattering rates respectivey. Results of the harmonic inversion analysis applied to absorption spectra are shown as dashed lines in Fig. 2 (b),(c). In the weak coupling limit the decomposed mode frequencies are degenerate with contrasting linewidths, as in EIT. For the strong coupling limit, mode frequencies are well separated, indicating hybridized modes. Discussion on the efficacy of the harmonic inversion method to decompose the absorption spectrum is given in the Supplemental Information (SI).
As shown in Fig. 1, the exceptional point can be observed under the variation of (or ) and . Since the EP is observed when and , it is equally possible to encounter the EP under some parametric cut of and . In the following, we show through analysis of the absorption spectrum that an EP may be observed under variation of the spacer thickness (), incident angle of light (), and the graphene Fermi level ().
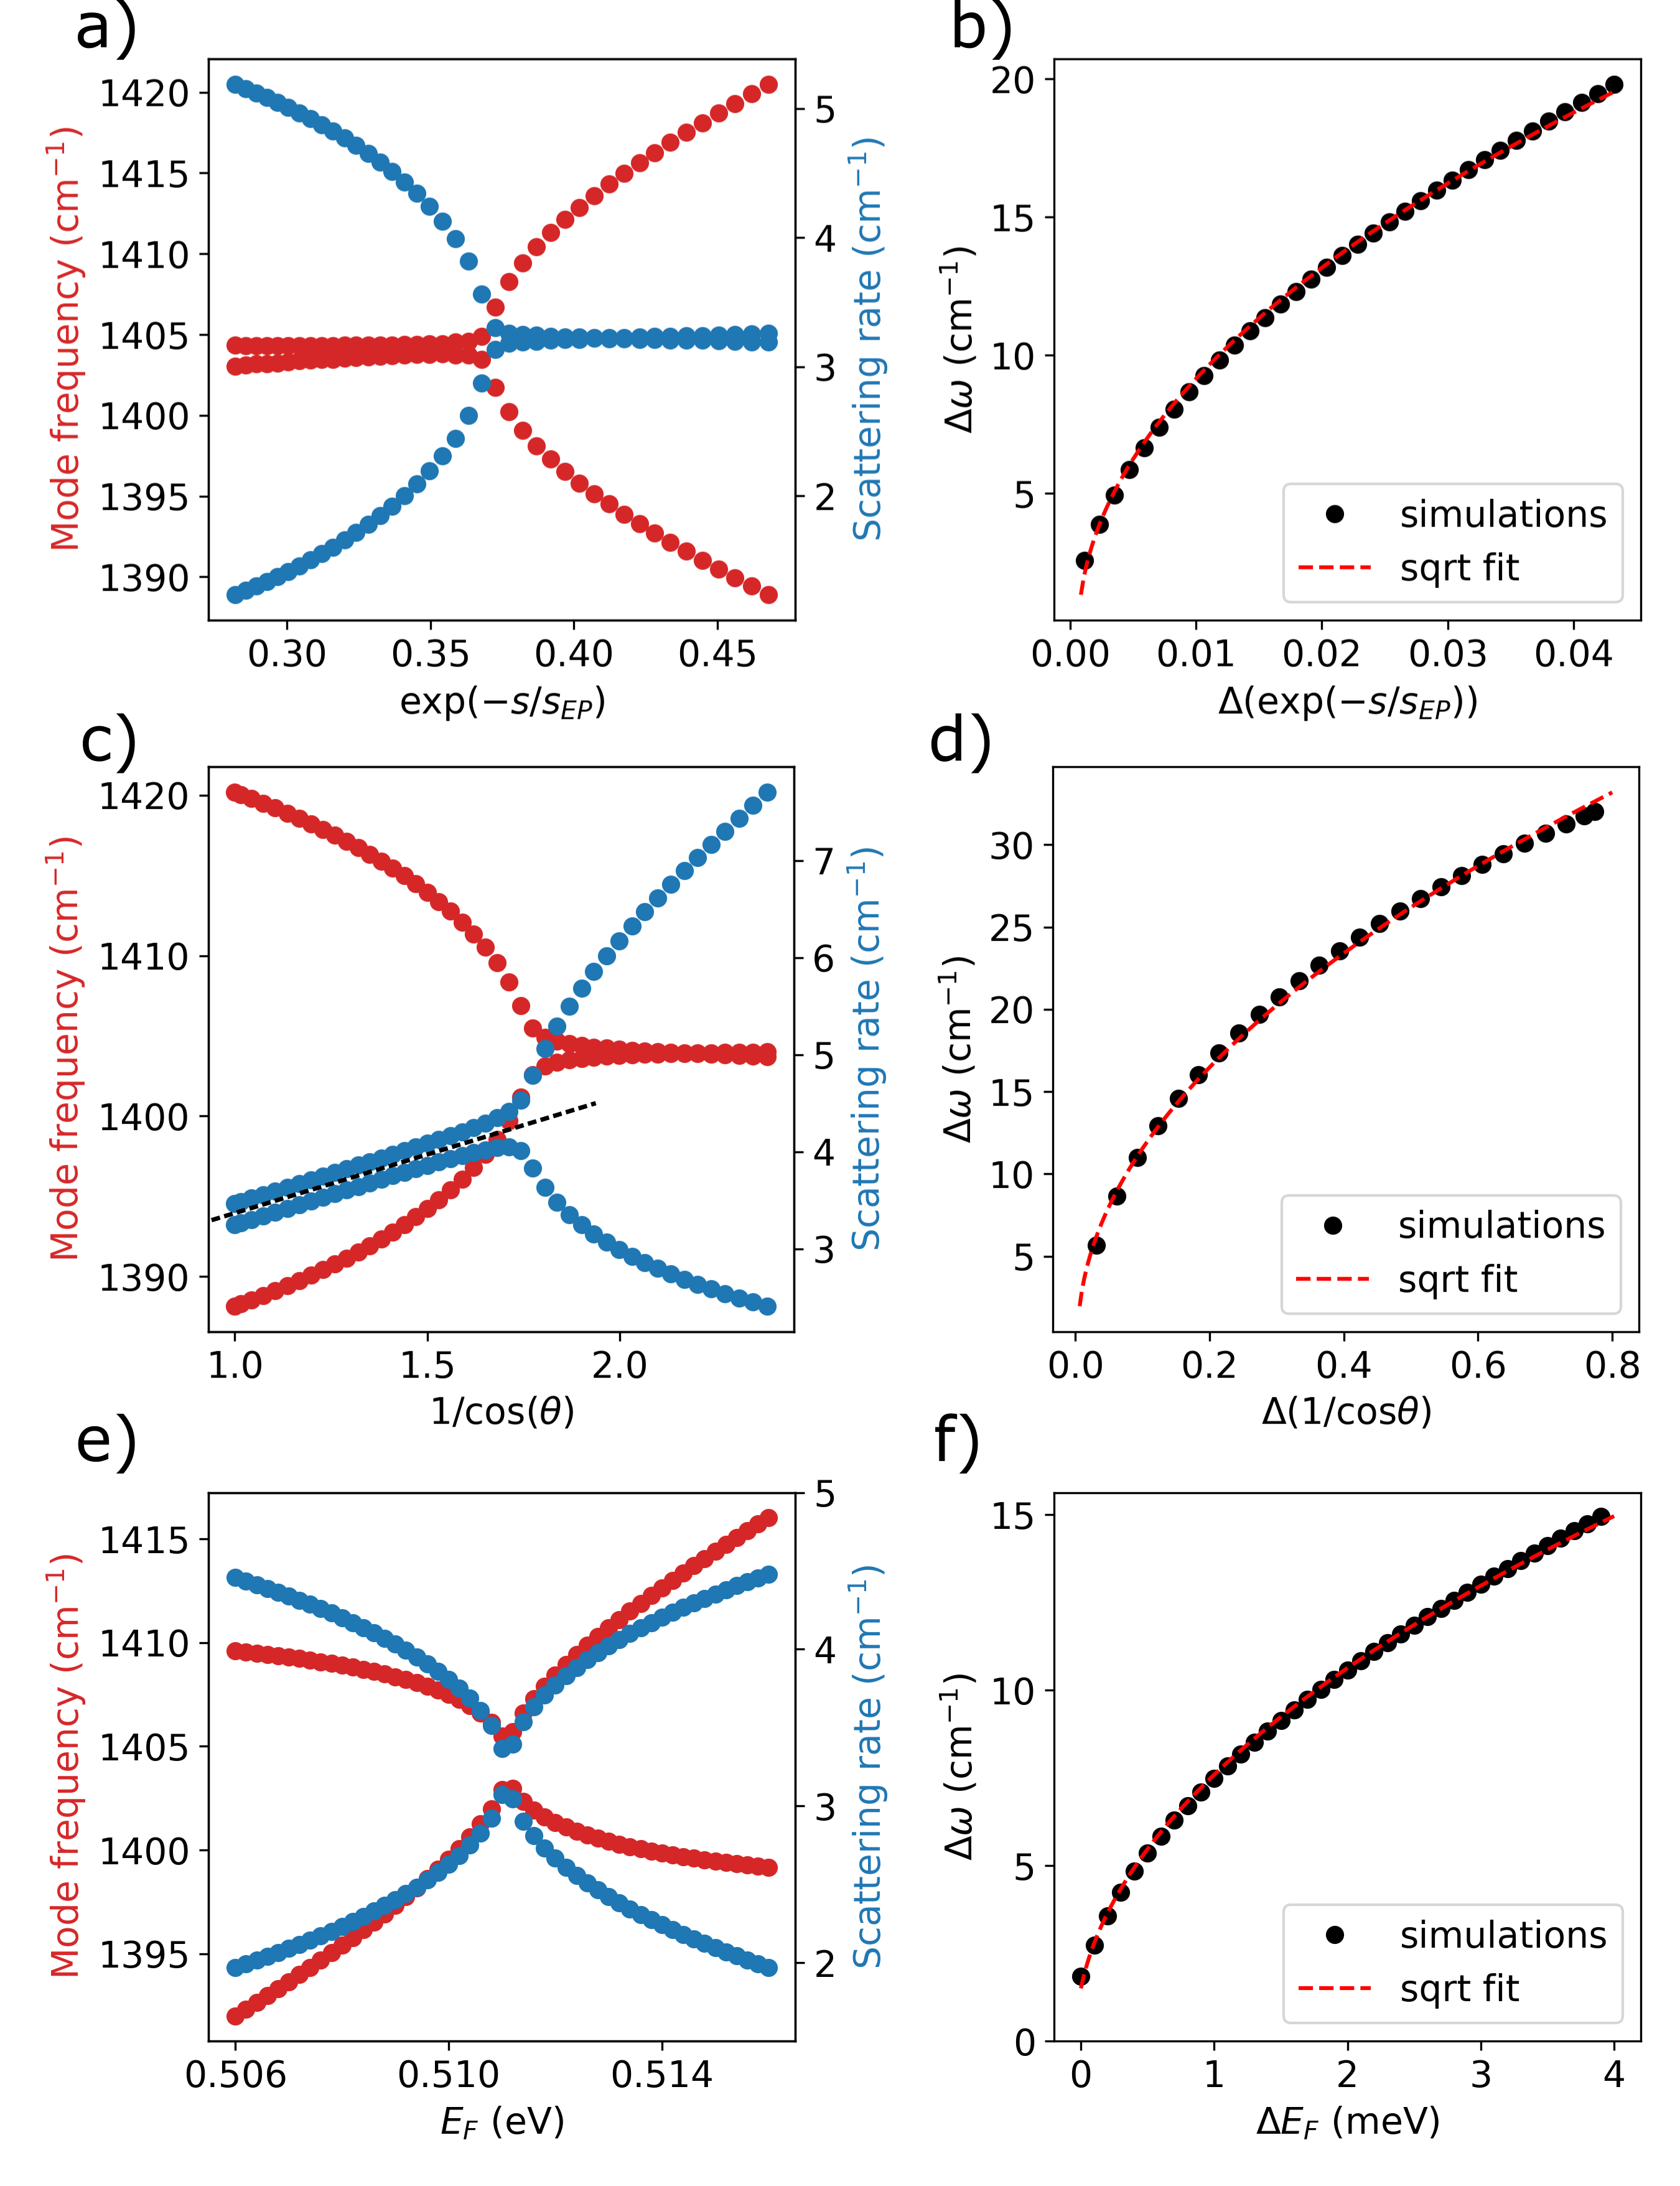
To observe the transition from strong to weak coupling, we fix such that and vary the thickness, , between graphene nanoribbons and the polar dielectric, effectively tuning the coupling strength. Since the coupling strength is determined by the overlap of the plasmon and phonon modes we expect the coupling strength to exponentially decay with (i.e. ). Other factors, such as , which determine the confinement of the plasmon or phonon modes will also affect the coupling strength. By applying the harmonic inversion analysis to the absorption spectra calculated for a range of spacer thickness, , we obtained Fig. 3(a). This dispersion closely matches the red path on the eigenvalue surface in Fig. 1 and may be identified as a PT-symmetry breaking transition. The EP can be identified as the boundary between strong and weak coupling regimes. Fig. 3(b) shows the square-root dependence of the mode frequencies splitting () on the strength of the perturbation , which is a clear defining characteristic of the exceptional point.
Next, we show that tuning the angle of incidence (, see Fig. 3(b)) provides an additional route to observing the exceptional point. By comparing expressions derived from the coupled mode equations in Eq. 1 and from conventional electromagnetic scattering calculations (see SI), we find that the loss of the plasmon is given by
| (11) |
where defines the intrinsic loss of the plasmon resonance, describes the radiative loss of the plasmon through coupling into free space, and is the plasmon scattering rate of graphene. Physically, the dependence on angle of accounts for the fact that the out coupling to free space depends on the angle that the plane wave momentum makes with the graphene ribbon surfaceVerslegers2010 . Having is required for isotropic out-coupling of the plasmon resonance to free space. The mode dispersion from simulations sweeping over a range of angles while fixing and are shown in Fig. 3(c). A PT-symmetry breaking transition is shown as a function of . The positive linear slope (dashed line in Fig. 3(c)) that we see in the scattering rate comes from the fact that as the angle is tuned, the average loss of the system, increases linearly. This behavior is expected from Eq. 5 and reassures us that we are indeed tuning the radiative loss of the plasmon.
We may also probe the EP by tuning the graphene Fermi level. If the plasmon frequency is continuously tuned such that it passes through , the coupled mode dispersion will exhibit level repulsion(level crossing) for (). In Fig. 3(e), we show that by fixing and varying the Fermi level, the EP is observed. Note that the shape of the dispersion is different from what is obtained in Fig. 3(a),(c). This is because by changing we are breaking the PT-symmetry condition (except for when ). Also, tuning at fixed does not guarantee that the coupling strength is constant since also affects the plasmon confinement. Nevertheless, we are still able to find a path similar to the white line in Fig. 1 that passes through the EP. Fig. 3(f) verifies the square-root splitting for perturbations near the exceptional point. From these results we expect that electrostatic tuning of the graphene nanoribbons combined with exceptional point physics will provide a convenient route to realizing exceptional point sensors or modulatorsWiersig2020a ; Park2020 .
IV Detection of the EP and use for optical sensing
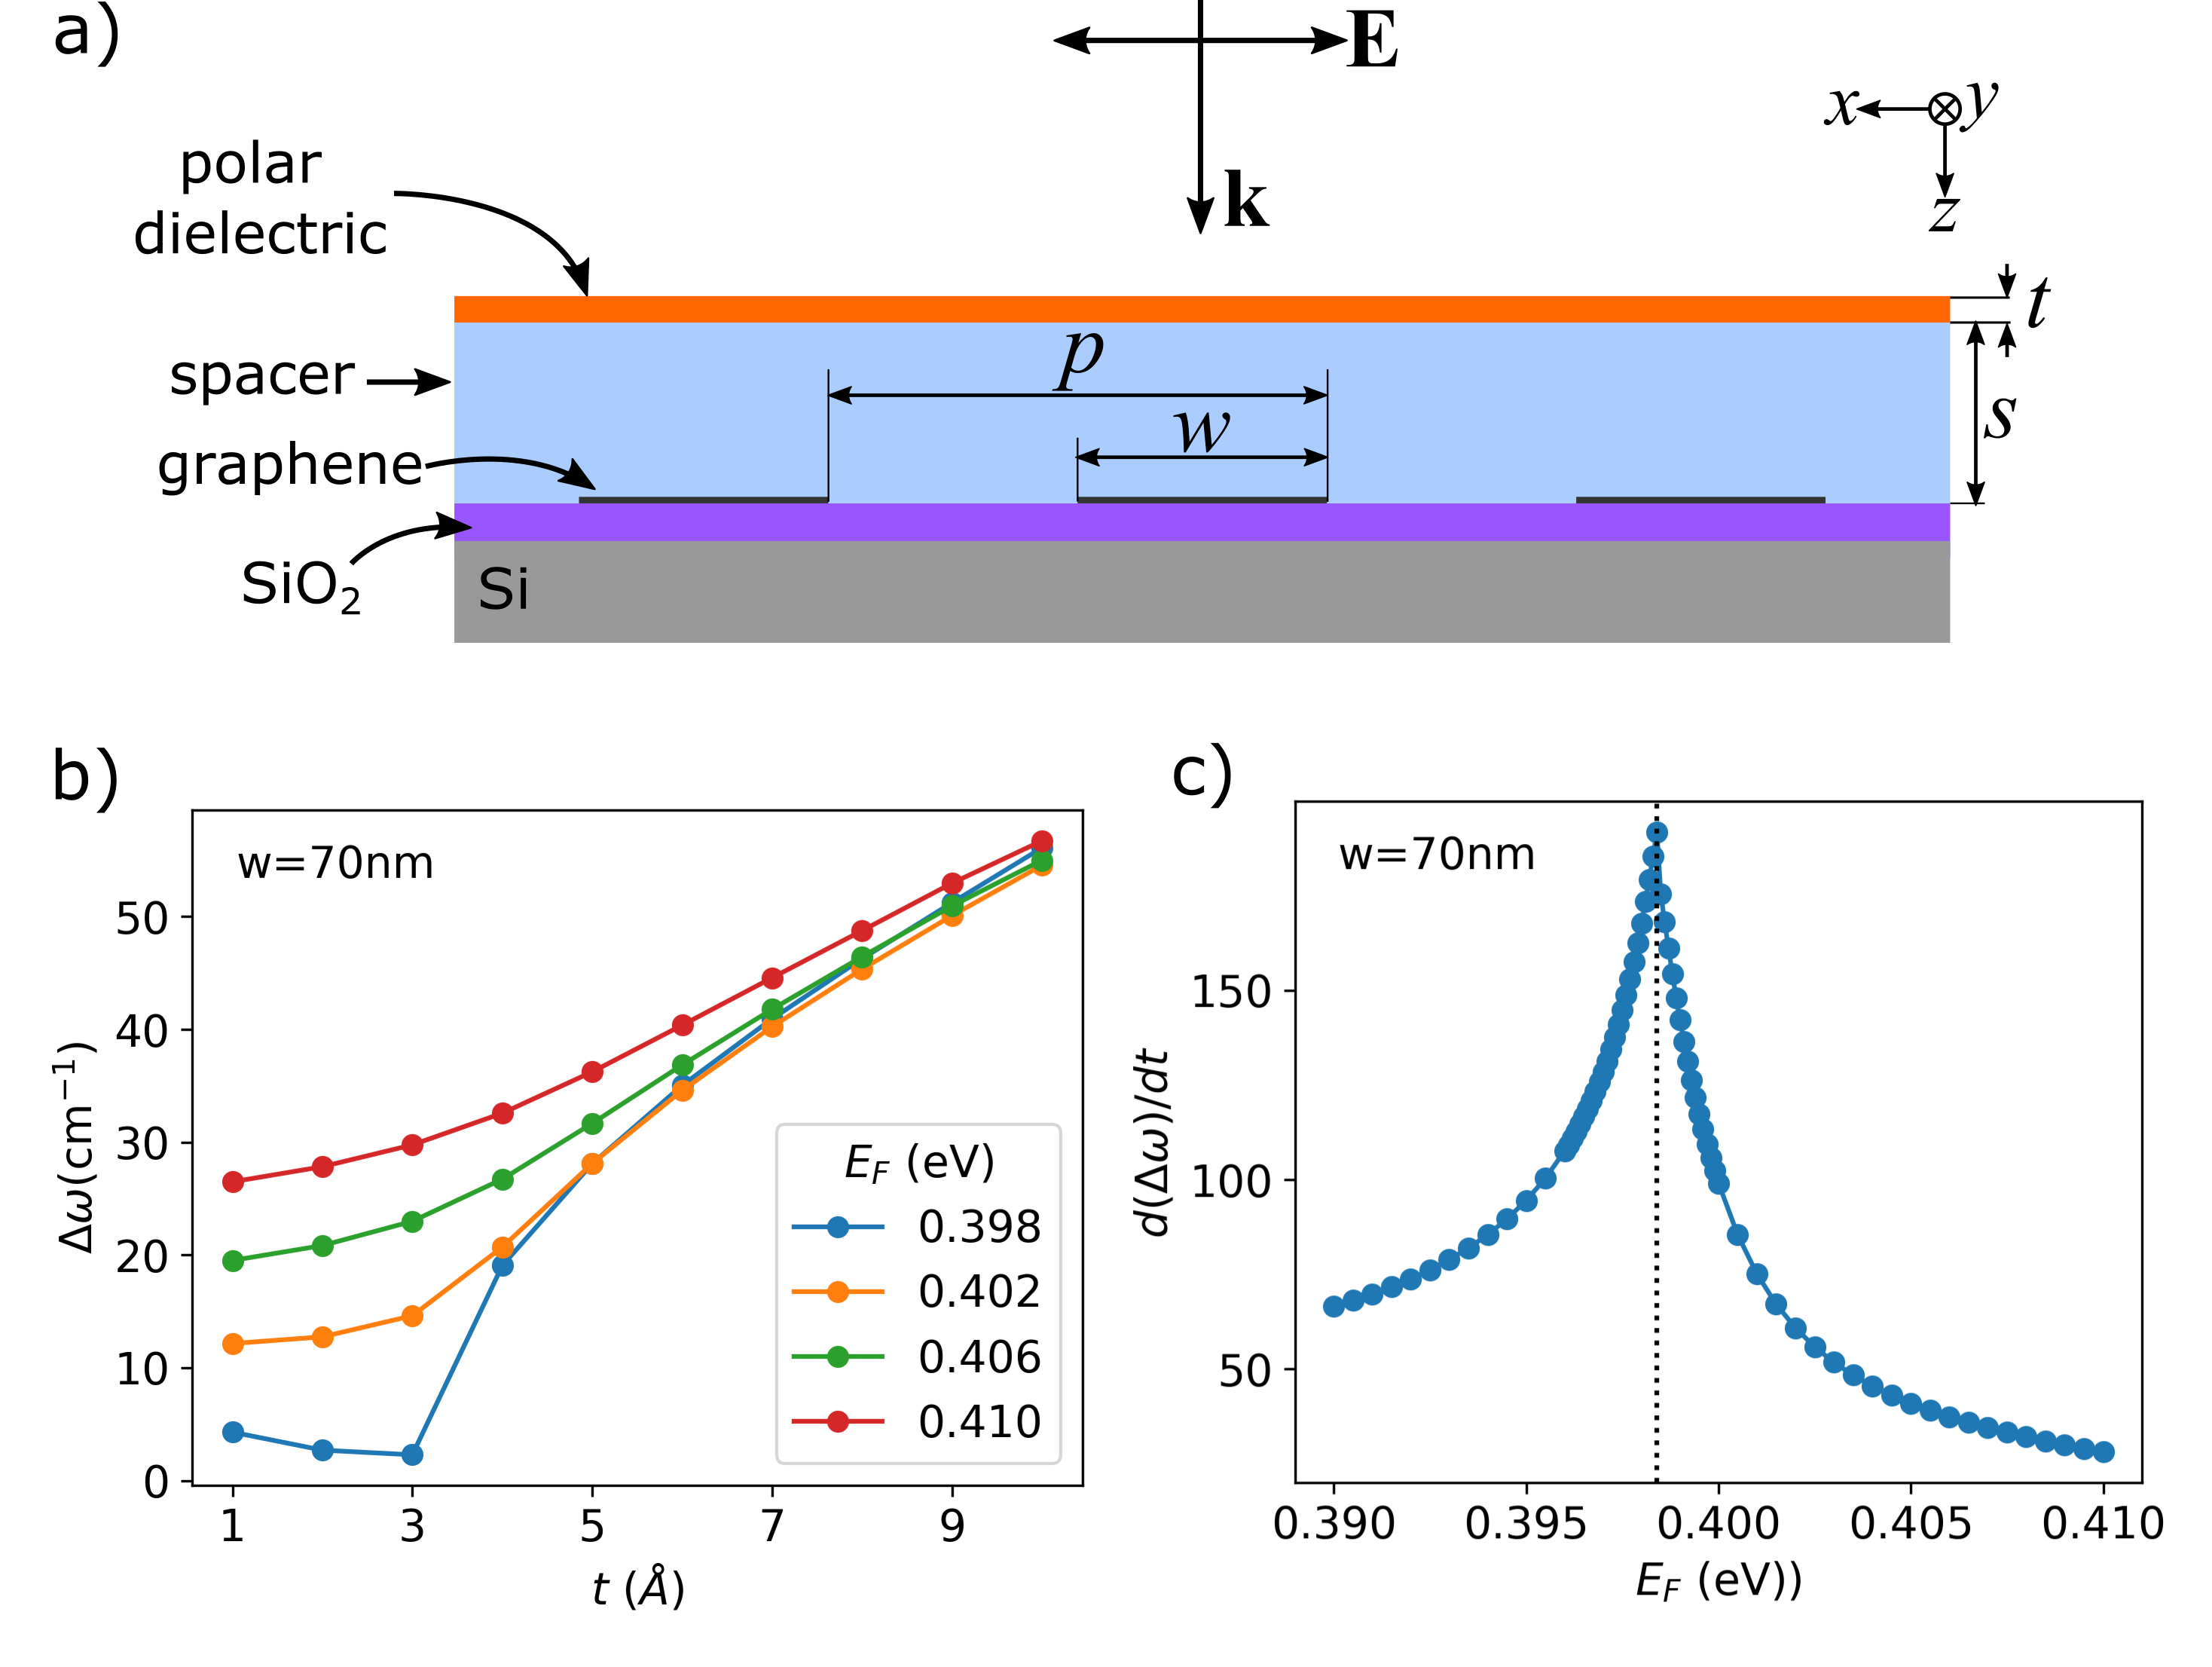
We propose a setup where the EP could be observed experimentally. At the EP, spectral splitting varies as the square root of perturbationsWiersig2020a . Hence, we expect the rate of change of the splitting to diverge at the EP. We consider varying thickness in the phonon active layer. Coupling strength of the vibrational mode of the deposited layer with the graphene plasmon will depend on the thickness . Thus when the system is tuned to the EP, the mode splitting will respond sensitively to small changes in the thickness. The proposed setup is shown in Fig. 4(a). As a spacer we use an insulator with (e.g. CaF2Malitson1963 ) and a thin film layer with a phonon mode at cm-1 is deposited on top. The spacer layer thickness is fixed to 27nm. We have also changed the ribbon width to 70nm such that the plasmon resonance is cm-1 for eVRodrigo2015 . The structure is placed on a SiO2/Si substrate to allow electrostatic gating via a back gate.
The mode splitting (, see Fig. 4(b)) shows a sharp change as a function of when eV, while for higher the change is more gradual. The square-root splitting implies that for this system we have eV. To quantitatively gauge the sensitivity of our system, we define a figure-of-merit as that measures the change in splitting with respect to a change in cover layer thickness at a fixed . Indeed, we find that is maximized when , as shown in Fig. 4(c). Hence our setup utilizes the exceptional point to yield an enhanced sensitivity to the deposited dielectric layer. Similar setups can be used to sense changes produced by e.g. adsorption of molecules on the bare graphene nanoribbons or graphene modified with appropriate receptors.
V Conclusion
We have demonstrated that tuning of the coupling or scattering rate of a plasmon-phonon system can lead to a PT-symmetry breaking transition with an EP observed at the boundary between weak and strong coupling. The coupling was controlled by the physical separation between the plasmon and polar dielectric layer while the scattering rate (i.e. its coupling to electromagnetic radiation) of the plasmon was shown to effectively be controlled by the incident angle of radiation. Importantly, when the coupling is set to a critical value, the characteristics of the exceptional point are also observable through electrostatic modulation of the graphene nanoribbons. Showing that the PT-symmetric transition and the EP are observable through experimentally accessible parameters might offer opportunities for sensitive optical sensors.
Acknowledgements.
S.H.P. and T.L. acknowledge funding support from NSF/DMREF under Grant Agreement No. 1921629. S.-H.O. and T.L. acknowledge funding support from NSF ECCS No. 1809723.References
- (1) Xiaoze Liu, Tal Galfsky, Zheng Sun, Fengnian Xia, Erh Chen Lin, Yi Hsien Lee, Stéphane Kéna-Cohen, and Vinod M. Menon. Strong light-matter coupling in two-dimensional atomic crystals. Nature Photonics, 9(1):30–34, 2014.
- (2) Michael Fleischhauer, Atac Imamoglu, and Jonathan P. Marangos. Electromagnetically induced transparency: Optics in coherent media. Reviews of Modern Physics, 77(2):633–673, 2005.
- (3) Petr M. Anisimov, Jonathan P. Dowling, and Barry C. Sanders. Objectively discerning Autler-Townes splitting from electromagnetically induced transparency. Physical Review Letters, 107(16):21–24, 2011.
- (4) Bo Peng, Sahin Kaya Özdemir, Weijian Chen, Franco Nori, and Lan Yang. What is and what is not electromagnetically induced transparency in whispering-gallery microcavities. Nature Communications, 5:5082, 2014.
- (5) C. L. Garrido Alzar, M. A. G. Martinez, and P. Nussenzveig. Classical analog of electromagnetically induced transparency. American Journal of Physics, 70(1):37–41, 2002.
- (6) Shuang Zhang, Dentcho A. Genov, Yuan Wang, Ming Liu, and Xiang Zhang. Plasmon-induced transparency in metamaterials. Physical Review Letters, 101(4):047401, 2008.
- (7) P Törmä and W. L. Barnes. Strong coupling between surface plasmon polaritons and emitters: a review. Reports on Progress in Physics, 78(1):013901, 2015.
- (8) Ramy El-Ganainy, Konstantinos G. Makris, Mercedeh Khajavikhan, Ziad H. Musslimani, Stefan Rotter, and Demetrios N. Christodoulides. Non-Hermitian physics and PT symmetry. Nature Physics, 14(1):11–19, 2018.
- (9) A Guo, G J Salamo, D Duchesne, R Morandotti, M Volatier-Ravat, V Aimez, G A Siviloglou, and D N Christodoulides. Observation of P T -Symmetry Breaking in Complex Optical Potentials. Physical Review Letters, 103(093902), 2009.
- (10) Christian E Rüter, Konstantinos G Makris, Ramy El-Ganainy, Demetrios N Christodoulides, Mordechai Segev, and Detlef Kip. Observation of parity–time symmetry in optics. Nature Physics, 6:192–195, 2010.
- (11) Mark Lawrence, Ningning Xu, Xueqian Zhang, Longqing Cong, Jiaguang Han, Weili Zhang, and Shuang Zhang. Manifestation of PT symmetry breaking in polarization space with terahertz metasurfaces. Physical Review Letters, 113(9):093901, 2014.
- (12) Hossein Hodaei, Mohammad-ali Miri, Matthias Heinrich, Demetrios N. Christodoulides, and Mercedeh Khajavikhan. Parity-time-symmetric microring lasers. Science, 346(6212):975–978, 2014.
- (13) Jan Wiersig. Review of exceptional point-based sensors. Photonics Research, 8(9):1457, 2020.
- (14) Hossein Hodaei, Absar U. Hassan, Steffen Wittek, Hipolito Garcia-Gracia, Ramy El-Ganainy, Demetrios N. Christodoulides, and Mercedeh Khajavikhan. Enhanced sensitivity at higher-order exceptional points. Nature, 548(7666):187–191, 2017.
- (15) Weijian Chen, Sahin Kaya Ozdemir, Guangming Zhao, Jan Wiersig, and Lan Yang. Exceptional points enhance sensing in an optical microcavity. Nature, 548(7666):192–195, 2017.
- (16) Hugen Yan, Tony Low, Wenjuan Zhu, Yanqing Wu, Marcus Freitag, Xuesong Li, Francisco Guinea, Phaedon Avouris, and Fengnian Xia. Damping pathways of mid-infrared plasmons in graphene nanostructures. Nature Photonics, 7(5):394–399, 2013.
- (17) Victor W. Brar, Min Seok Jang, Michelle Sherrott, Seyoon Kim, Josue J. Lopez, Laura B. Kim, Mansoo Choi, and Harry Atwater. Hybrid surface-phonon-plasmon polariton modes in graphene/monolayer h-BN heterostructures. Nano Letters, 14(7):3876–3880, 2014.
- (18) Hugen Yan, Tony Low, Francisco Guinea, Fengnian Xia, and Phaedon Avouris. Tunable phonon-induced transparency in bilayer graphene nanoribbons. Nano Letters, 14(8):4581–4586, 2014.
- (19) Francisco J. Bezares, Adolfo De Sanctis, J. R.M. Saavedra, Achim Woessner, Pablo Alonso-González, Iban Amenabar, Jianing Chen, Thomas H. Bointon, Siyuan Dai, Michael M. Fogler, D. N. Basov, Rainer Hillenbrand, Monica F. Craciun, F. Javier García De Abajo, Saverio Russo, and Frank H.L. Koppens. Intrinsic Plasmon-Phonon Interactions in Highly Doped Graphene: A Near-Field Imaging Study. Nano Letters, 17(10):5908–5913, 2017.
- (20) Daniel Rodrigo, Odeta Limaj, Davide Janner, Dordaneh Etezadi, F. Javier García De Abajo, Valerio Pruneri, and Hatice Altug. Mid-infrared plasmonic biosensing with graphene. Science, 349(6244):165–168, 2015.
- (21) Damon B. Farmer, Phaedon Avouris, Yilei Li, Tony F. Heinz, and Shu Jen Han. Ultrasensitive Plasmonic Detection of Molecules with Graphene. ACS Photonics, 3(4):553–557, 2016.
- (22) Hai Hu, Xiaoxia Yang, Xiangdong Guo, Kaveh Khaliji, Sudipta Romen Biswas, F. Javier García de Abajo, Tony Low, Zhipei Sun, and Qing Dai. Gas identification with graphene plasmons. Nature Communications, 10(1):1131, 2019.
- (23) Kaveh Khaliji, Sudipta Romen Biswas, Hai Hu, Xiaoxia Yang, Qing Dai, Sang-Hyun Oh, Phaedon Avouris, and Tony Low. Plasmonic Gas Sensing with Graphene Nanoribbons. Physical Review Applied, 13(1):011002, 2020.
- (24) In-Ho Lee, Daehan Yoo, Phaedon Avouris, Tony Low, and Sang-Hyun Oh. Graphene acoustic plasmon resonator for ultrasensitive infrared spectroscopy. Nature Nanotechnology, 14(4):313–319, 2019.
- (25) Jacob Fuchs, Jörg Main, Holger Cartarius, and Günter Wunner. Harmonic inversion analysis of exceptional points in resonance spectra. Journal of Physics A: Mathematical and Theoretical, 47(12), 2014.
- (26) E. H. Hwang, Rajdeep Sensarma, and S. Das Sarma. Plasmon-phonon coupling in graphene. Physical Review B, 82(19):195406, 2010.
- (27) Hermann Haus. Waves and Fields in Optoelectronics. Prentice-Hall, 1985.
- (28) Carl M. Bender and Stefan Boettcher. Real spectra in non-hermitian hamiltonians having PT symmetry. Physical Review Letters, 80(24):5243–5246, 1998.
- (29) Alexey Y. Nikitin, Tony Low, and Luis Martin-Moreno. Anomalous reflection phase of graphene plasmons and its influence on resonators. Physical Review B, 90(4):041407, 2014.
- (30) P.A.D. Goncalves and N. M.R. Peres. An Introduction to Graphene Plasmonics. World Scientific, 2016.
- (31) Tony Low, Francisco Guinea, Hugen Yan, Fengnian Xia, and Phaedon Avouris. Novel midinfrared plasmonic properties of bilayer graphene. Physical Review Letters, 112(11):116801, 2014.
- (32) Liping Hao, Yuechun Jiao, Yongmei Xue, Xiaoxuan Han, Suying Bai, Jianming Zhao, and Georg Raithel. Transition from electromagnetically induced transparency to Autler-Townes splitting in cold cesium atoms. New Journal of Physics, 20(7), 2018.
- (33) Ling-Yan He, Tie-Jun Wang, Yong-Pan Gao, Cong Cao, and Chuan Wang. Discerning electromagnetically induced transparency from Autler-Townes splitting in plasmonic waveguide and coupled resonators system. Optics Express, 23(18):23817, 2015.
- (34) Lieven Verslegers, Zongfu Yu, Peter B Catrysse, and Shanhui Fan. Temporal coupled-mode theory for resonant apertures. Journal of the Optical Society of America B, 27(10):1947, 2010.
- (35) Jun-Hee Park, Abdoulaye Ndao, Wei Cai, Liyi Hsu, Ashok Kodigala, Thomas Lepetit, Yu-Hwa Lo, and Boubacar Kanté. Symmetry-breaking-induced plasmonic exceptional points and nanoscale sensing. Nature Physics, 16(4):462–468, 2020.
- (36) Irving H. Malitson. A Redetermination of Some Optical Properties of Calcium Fluoride. Applied Optics, 2(11):1103, 1963.