PSGCNet: A Pyramidal Scale and Global Context Guided Network for Dense Object Counting in Remote Sensing Images
Abstract
Object counting, which aims to count the accurate number of object instances in images, has been attracting more and more attention. However, challenges such as large scale variation, complex background interference, and non-uniform density distribution greatly limit the counting accuracy, particularly striking in remote sensing imagery. To mitigate the above issues, this paper proposes a novel framework for dense object counting in remote sensing images, which incorporates a pyramidal scale module (PSM) and a global context module (GCM), dubbed PSGCNet, where PSM is used to adaptively capture multi-scale information and GCM is to guide the model to select suitable scales generated from PSM. Moreover, a reliable supervision manner improved from Bayesian and Counting loss (BCL) is utilized to learn the density probability and then compute the count expectation at each annotation. It can relieve non-uniform density distribution to a certain extent. Extensive experiments on four remote sensing counting datasets demonstrate the effectiveness of the proposed method and the superiority of it compared with state-of-the-arts. Additionally, experiments extended on four commonly used crowd counting datasets further validate the generalization ability of the model. Code is available at https://github.com/gaoguangshuai/PSGCNet.
Index Terms:
Object Counting, Pyramidal Scale, Global Context, Bayesian Loss, Remote SensingI Introduction
Object counting, which is to estimate the accurate number of object instances in images or videos, has been attracting remarkable interest in recent years owing to its potential value in traffic monitor [1], urban planning [2], public safety [3], and crowd behavior understanding [4], etc. Additionally, object counting has been applied in many practical applications, such as cell microscopy [5], animals [6], and remote sensing applications [7, 8, 9, 10].
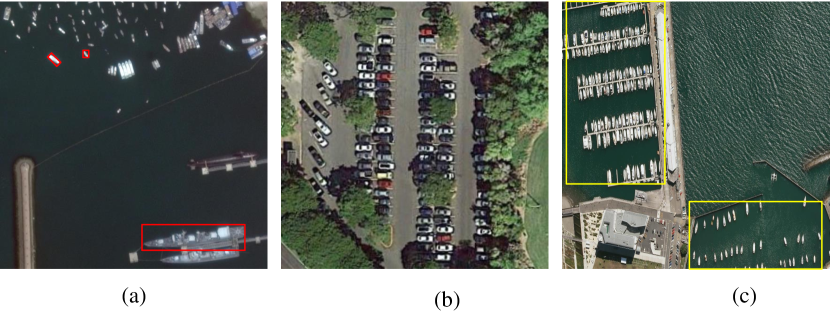
Recent prevalent object counting methods have been following the pioneering work [5], which estimates the count number over a density map. Lately, driven by the powerful feature representation ability of Convolutional Neural Networks (CNNs), a lot of CNN-based density estimation algorithms have been presented. Although remarkable progress has been achieved, there still exist challenges limiting the counting performance, such as large scale variation, complex background interference, non-uniform density distribution, which are much tougher in remote sensing images. Taking Fig.1 (a) as an example, the scale variation of different ship instances is large because of different types of ships. In Fig.1 (b), complex background interferences (such as the green plants) are easy to fool models to make wrong predictions. Furthermore, in Fig.1 (c), the spatial distribution is non-uniform varying from sparse to congested even in the same scene.
Many efforts tackle the scale variation problem by designing multi-column architectures [11, 12, 13] or employing techniques, such as dilated convolution [14, 15], Spatial Pyramid Pooling (SPP) [16, 15], Atrous Spatial Pyramid Pooling (ASPP) [17, 18], and Inception blocks [19] to capture multi-scale information [20, 21, 22, 23]. These models relieve scale variation problem yet still have some limitations. 1) Multi-column architectures or Inception blocks have multiple branches built with different kernel sizes, which introduce a large number of parameters and huge computation burdens [24]. 2) The pooling operation in these models (e.g., SPP) may lead to fine-detail information loss, thus degenerating the performance. 3) Hand-crafted dilation rates are hard to match the range of scale variations. To alleviate these issues, motivated by [25], we embed a pyramidal scale module (PSM) into our framework to effectively capture multi-scale information.
To suppress background distractors, visual attention has been successfully applied to the counting task [26, 7, 8] and achieves good performance. However, these attention modules suffer from heavy computation cost and high complexity, for instance, the fashionable Squeeze-and-Excitation network (SENet) [27] and its followers [28, 29] employ multiple fully connected (FC) layers to compute attention weights. Such designs are inefficient and not helpful for capturing the interactive information across channels. Inspired by [30, 31], we introduce an effective and efficient global context module (GCM) to select more suitable scales generated from PSM.
Most counting methods convert annotated points into density maps using Gaussian filters and then train CNN models using loss. Consequently, the counting performance highly depends on the quality of the “ground truth” density map. However, such a pixel-independent based “ground-truth” density map generation manner may be suboptimal, especially in non-uniform distributed regions. As an alternation, Ma et al. [32] propose a reliable supervision manner through learning the count expectation from the point annotations, named Bayesian Loss (BL). This effective supervision manner could alleviate the problem of non-uniform density distribution. However, there may exist an inconsistency between the training phase (point-to-point loss) and the testing stage (the difference between the overall summation of estimated density maps and ground truth counts). Therefore, apart from the Bayesian loss, we add a counting loss to mitigate this issue.
In summary, the contributions of this work are three-fold:
-
•
A novel Pyramidal Scale and Global Context-based framework for dense object counting in remote sensing images, termed PSGCNet, is presented.
-
•
A flexible pyramid scale module is designed to effectively extract multi-scale features of dense scenes. And a lightweight global context module is embedded to make use of the rich interaction information across channels of feature map to guide the model to select more suitable scales.
-
•
Extensive experiments conducted on four remote sensing object counting datasets demonstrate the effectiveness and superiority of the proposed approach, and the extension to four commonly used crowd counting datasets further validate the generalization ability and robustness of our proposed method.
The remainder of this paper is organized as follows. The related work of object counting algorithms is briefly surveyed in Section II. The details of our proposed method are introduced in Section III, following which experimental results and analysis are presented in Section IV. Finally, the conclusion is concluded in Section V.
II Related Work
II-A Object counting in congested scenes
Early object counting methods are mainly detection-based [33, 34], they first detect the interested object instances and then count the number of the bounding boxes. These methods obtain satisfactory performance in sparse scenarios thanks to the powerful detectors. However, they may fail in highly congested scenes, since the object instances are usually with small sizes and easily confused with background distractors. Another mainline is regression-based methods, which map the high dimension image space to natural numbers [35, 36]. As a highly non-linear regression task, it is very hard to optimize models and the performance is far from satisfactory. [5] rekindles the counting task as a density map generation problem, which estimates the counting number of object instances by integrating all the pixels of the density map. Entering the deep learning era, the performance of object counting has been significantly improved. Many deep neural networks have been designed for tackling the counting task. The performances on several representative benchmark datasets such as ShanghaiTech [11], UCF-QNRF [37], and UCF_CC_50 [38] have reached promising results. For a comprehensive review of the counting task, please refer to [39, 40].
II-B Object counting from the remote sensing view
Capturing from a remote distance, aerial images or videos provide a wider field of view and thus with much more complex scene contents, which brings great challenges to existing counting models. To facilitate research in this field, [41] introduces a drone-based crowd dataset and develops a multi-resolution network for estimating the number of pedestrians in aerial images. LPN [9] takes advantage of the regular spatial layout of cars and proposes a spatial layout proposal network for car counting and localization, simultaneously. LEP [42] proposes to predict the image-level count by dividing the image into a set of divisions. It achieves good performance on several drone-based counting datasets. Li et al. [43] draws inspiration from object detectors and proposes to detect and count cars simultaneously using a unified framework. STNNet [44] takes a step further and performs the density map estimation, localization, and tracking tasks in one network. ASPDNet [8] builds a new benchmark for aerial image counting. It employs recently developed techniques such as dilated convolution, attention, and deformable convolution to achieve a better performance.
II-C Alleviating large scale variation
Scale variation is a great challenge for object counting. Four strategies are widely studied to address this problem: multi-column network architectures, dilated convolution, Spatial Pyramid Pooling (SPP), and Inception module. For example, MCNN [11] is a simple multi-column network, in which, each column is built with different filter kernels. Switch-CNN [45] adopts a frame structure similar to MCNN [11]. The difference is that a specialized classifier is applied to select a suitable column network for inputs. CSRNet [20] takes advantage of dilated convolution to enlarge the receptive fields without increasing computation cost. CAN [22] combines scale-aware and context-aware feature information to boost the performance. SANet [23] captures multi-scale features built on the shoulder of the Inception module [19]. DSNet [46] cascades multiple dense dilated convolution blocks and links them with dense residual connections. ADSCNet [47] adopts adaptive dilated convolution to learn dynamic and continuous dilated rates for each pixel location. MRCNet [41] combines low-level and high-level features with lateral connections to learn contextual and detailed local information in aerial imagery. SACANet [48] utilizes a pyramid contextual module to extract long-range contextual information and enlarge the receptive fields of the objects in drone scenes. ASPDNet [7, 8] integrates a scale pyramid module to capture multi-scale information for counting in remote sensing images.
II-D Mitigating cluttered background interferences
Attention mechanism has been widely used to suppress cluttered backgrounds and highlight foreground regions. For instance, SAANet [49] develops a soft attention mechanism to learn a set of gating masks to aggregate the multi-scale density maps. ADCrowdNet [26] combines visual attention and deformable convolution [50] into a unified framework. HA-CNN [51] designs a hierarchical attention based network to selectively enhance the features at various levels. RANet [52] and ANF [53] incorporate self-attention to capture long-range dependencies of the feature maps. SDANet [54] builds a dense attention network based on shallow features. ASNet [55] learns attention scaling factors and automatically adjusts the density regions by multiplying multiple density attention masks on them. SACANet [48] leverages a scale-adaptive self-attention multi-branch module to address isolated clusters in aerial images. ASPDNet [7, 8] cascades channel attention and spatial attention to relieve the impact of complex cluttered backgrounds in diverse remote sensing scenarios. These methods have gained significant performance, nevertheless, the sophisticated structures of the attention modules incorporated in them introduce a large number of parameters, thus making them suffer from huge computation burdens. Although some lightweight attention modules such as Squeeze-and-Excitation networks (SENet) [27] and convolution block attention module (CBAM) [28] are developed to alleviate this problem, the fully connected (FC) layers still have many parameters. What’s more, the channel dimensionality reduction in these models also limits the upper bound of the performance.
Different from the aforementioned methods, our proposed PSGCNet takes advantage of a pyramidal scale module to capture multi-scale features, which can flexibly cover various scales and enlarge the receptive field without increasing any computation cost. Additionally, we devise an effective global context module, essentially a lightweight channel attention operation. It can not only reduce the computation burden of attention modules, but also make the cross-channel interaction more efficient by avoiding dimensionality reduction. Finally, we train our model with a reliable supervision manner on the count expectation at each annotation point.
III Proposed Method
III-A PSGCNet Overview
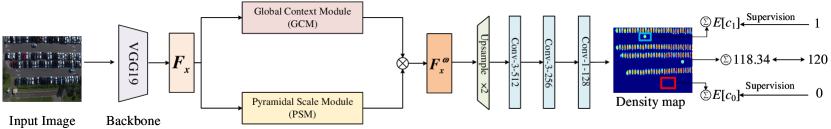
The architecture of PSGCNet is illustrated in Fig. 2. It has four key components, including a backbone network as feature extractor, a pyramidal scale module capturing multi-scale information, a global context module suppressing cluttered backgrounds, and a decoder to estimate the final density map.
Specifically, we adopt a truncated VGG19 [56] same to [32] as the backbone network, in which the three fully connected layers and one pooling layer are removed. The output feature map’s resolution of the backbone is 1/16 of the original input image. Afterwards, a pyramid scale module is built on top of the feature maps to capture multi-scale information. Then, an effective global context module (GCM) followed is leveraged to restrain the complex backgrounds. Then feature maps are upsampled twice with bilinear interpolation operation. Finally, a decoder is equipped to produce the density map, in which three successive convolutional layers are used, including two 33 convolution layers with 256 and 128 channels, and one 11 convolution. To further improve the performance, we optimize the model using a modified Bayesian Loss.
III-B Pyramidal Scale Module (PSM)
Scale variation is a critical problem in remote sensing image understanding. In this paper, we attack this problem by introducing a pyramidal scale module (PSM). PSM deploys two paralleled network paths: a local PyConv path and a global PyConv path. The two paths have a dual-oriented pyramid architecture, enabling richer multi-scale information capturing.
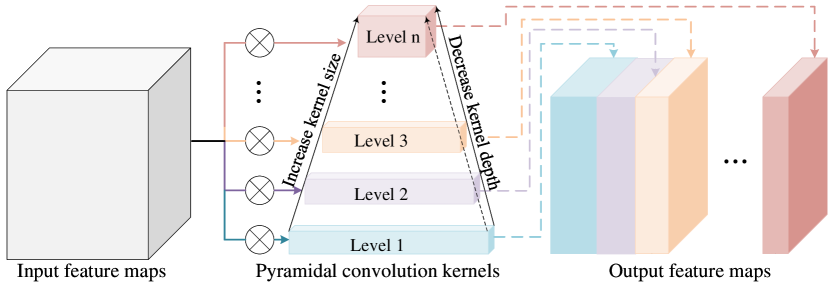
PyConv has a pyramid structure, as shown in Fig. 3. It contains increasing kernel sizes from bottom to top in a pyramidal manner, and decreasing kernel depths (connectivity) with grouped convolution. The double-oriented pyramid operation allows the model to capture richer multi-scale information, from larger receptive fields of kernels with lower connectivity to smaller receptive fields with higher connectivity. This design is efficient, flexible and economical computational cost.
The local PyConv path (the left branch in Fig. 4) has smaller receptive fields, which is responsible for tiny objects. It firstly applies 11 convolutions to reduce the channels to 512 and then aggregates four layers with different kernel sizes (i.e., 99, 77, 55, and 33). Besides, the number of groups (G) enables the kernels to have different connectivity. This is achieved with 11 convolutions. Note that each convolution block is followed by a batch normalization layer and a ReLU activation layer.
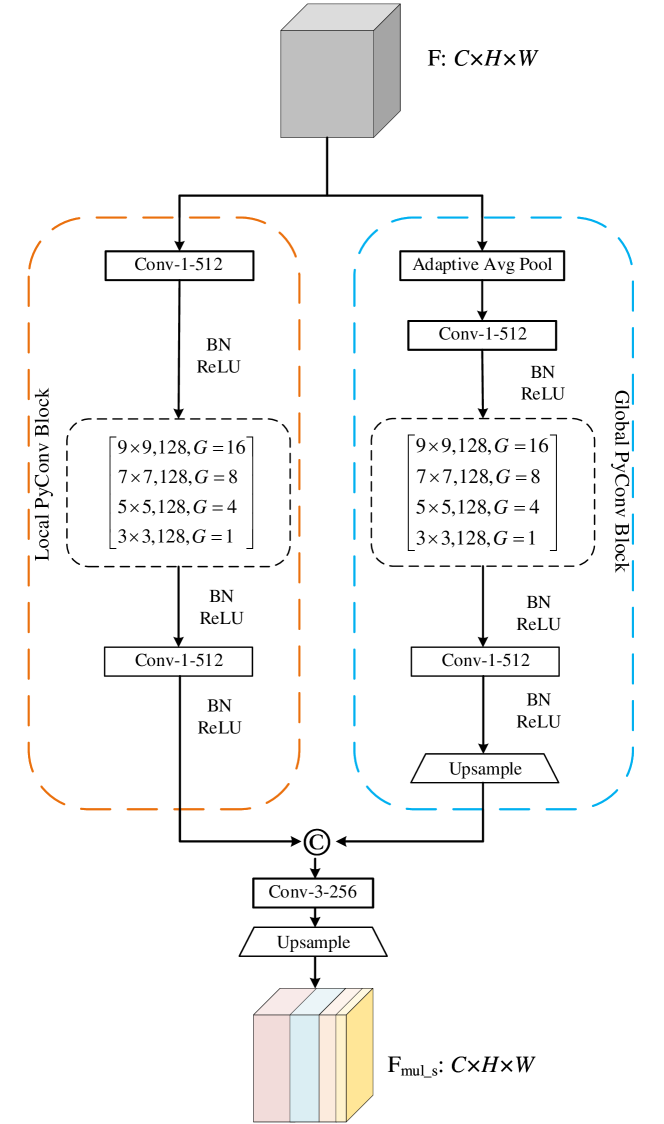
The global PyConv path (the right branch in Fig. 4) is to capture features of large objects in a global perspective. It has a similar structure to the local PyConv block, however, uses an adaptive average pooling operation on the top to reduce the spatial size of the feature maps to 99 and upsample the feature maps to the same resolution to the input through bilinear interpolation at the bottom.
The features from both local and global PyConv blocks are then concatenated and followed by a standard convolution layer with the size of 33. Finally, we upsample the feature maps to the original image size. The PSM module is efficient, flexible, and economical in computational cost. It could also boost the robustness of the model to scale variation.
III-C Global Context Module (GCM)
Visual attention has been claimed as a promising solution to overcome the interference of complex backgrounds. These models have achieved improved performance, however, with a cost of higher model complexities and heavier computational burden, since they usually use self-attention [57] or non-local modules [58].
Drawing inspiration from [30] and [31], we propose an efficient and lightweight global context module to model the dependencies across the channels. The global context module designed in our work is depicted in Fig. 5.
Concretely, given an intermediate feature map, denoted as , where , , and represent the number of channels, height, and width of the feature map, respectively. Let be the feature map corresponding to the c-th channel, i.e., . A global context module is embedded to capture global context information of each channel. The module is formulated as:
| (1) |
where denotes the embedding weight, and is a small constant to avoid the deviation at zero points. This global context module is somewhat similar to the global average pooling (GAP) but more robust than it [31].
Generally, to effectively learn cross-channel interactions, typical solutions are SENet [27] or CBAM [28], however, they destroy the correspondence between channels. Here, we adopt an alternation strategy, which first adaptively determines the kernel sizes ( in this paper) and then performs a 1D convolution operation, i.e.,
| (2) |
where means convolution.
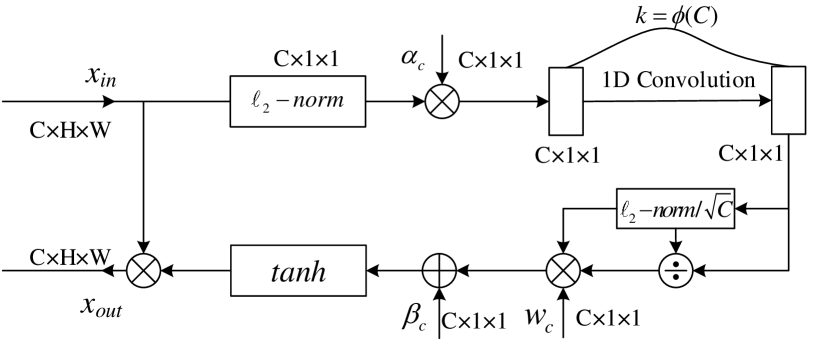
A subsequent channel normalization is applied, which can be formulated as:
| (3) |
Eventually, the final global context attention map is obtained after a activation layer:
| (4) |
where and represent the trainable weight and bias, which are both initialized to 0 in the training stage.
III-D Bayesian and counting loss function (BCL)
To optimize models, Euclidean distance ( loss) between the prediction and the ground truth density maps is widely used. However, the loss is not robust to the occlusion, scale variation, and non-uniform density. Recently, Ma et al. [32] propose a novel supervision manner, named Bayesian Loss to relieve this problem. It constructs a density contribution model from point annotations and then defines the loss as the difference between the count expectation and the ground truth number at each annotated point:
| (5) |
where is the total number of labelled objects, and indicate the expected counts for each instance and the entire background, respectively. The first term denotes that impelling the foreground count at each annotation point equals 1, while the second term means enforcing the background count to be zero. is a distance function, we adopt distance metric as suggested in [32].
Although reliable and effective, there may exist inconsistency between the training phase and the testing stage. Therefore, apart from Bayesian loss, we add a counting loss to mitigate this issue. The counting loss is defined as:
| (6) |
where and represent the count integrated by the estimated density map and ground truth count of the -th image. denotes training parameters and means -norm.
Therefore, the overall loss function is the combination of Bayesian loss and counting loss :
| (7) |
where is a tunable positive hyperparameter.
IV Experimental results
In this section, the datasets, evaluation protocols, and implementation details are first introduced. Then ablation studies and comparisons with state-of-the-art methods are provided to demonstrate the effectiveness and superiority of the proposed approach. Furthermore, some extension experiments to other object counting applications are conducted to validate the generalization ability and robustness of the model.
| Dataset | Sensor | #Images | Training/Test | Average Resolution | Count Statistics | |||
| Total | Min | Average | Max | |||||
| RSOC_building [7] | Satellite | 2468 | 1205/1263 | 512512 | 76,215 | 15 | 30.88 | 142 |
| RSOC_small-vehicle [7] | Satellite | 280 | 222/58 | 24732339 | 148,838 | 17 | 531.56 | 8531 |
| RSOC_large-vehicle [7] | Satellite | 172 | 108/64 | 15521573 | 16,594 | 12 | 96.48 | 1336 |
| RSOC_ship [7] | Satellite | 137 | 97/40 | 25582668 | 44,892 | 50 | 327.68 | 1661 |
| CARPK [9] | Drone | 1448 | 989/459 | 7201280 | 89,777 | 1 | 62 | 188 |
| PUCPR+ [9] | Camera | 125 | 100/25 | 7201280 | 16,915 | 0 | 135 | 331 |
| DroneCrowd [44] | Drone | 33,600 | 24,600/9,000 | 19201080 | 4,864,280 | 25 | 144.8 | 455 |
| SHT_A [11] | CCTV | 482 | 300/182 | 589 868 | 241,677 | 33 | 501.4 | 3,139 |
| SHT_B [11] | CCTV | 716 | 400/316 | 768 1024 | 88,488 | 9 | 123.6 | 578 |
| UCF-QNRF [37] | CCTV | 1,535 | 1201/334 | 2013 2902 | 1,251,642 | 49 | 815 | 12,865 |
| UCF_CC_50 [38] | CCTV | 50 | – | 2101 2888 | 63,974 | 94 | 1,280 | 4,543 |
IV-A Datasets and evaluation protocols
Datasets: Extensive experiments are conducted on four remote sensing object counting datasets including RSOC [7, 8], CARPK [9], PUCPR+ [9], and Drone-crowd [44] to evaluate the effectiveness and superiority of the proposed approach. Moreover, to validate the generalization ability and robustness of the model, we also conduct experiments on four widely used crowd counting datasets, i.e., ShanghaiTech Part_A and Part_B [11] , UCF-QNRF [37], and UCF_CC_50 [38]. The statistics of the datasets is presented in Table I.
RSOC [7, 8]111https://github.com/gaoguangshuai/Counting-from-Sky-A-Large-scale-Dataset-for-Remote-Sensing-Object-Counting-and-A-Benchmark-Method is a remote sensing object counting dataset, which is composed of four categories, including buildings, small vehicles, large vehicles, and ships. The dataset consists of 3,057 images with 286,539 instances in total. In which 2,468 building images, 1,205 and 1,263 are used for training and testing; 280 small vehicle images, 222 images for training and 58 for testing; 172 large vehicle images, 108 for training and 64 for testing; 137 ship images, 97 images for training and 40 images for testing, respectively.
CARPK [9]222https://lafi.github.io/LPN/ is a large-scale drone-view car counting dataset, which contains 1,448 images with nearly 90k cars in total, of which 989 images for training and the remaining 459 images for testing.
PUCPR+ [9]333https://lafi.github.io/LPN/ is also a car counting dataset, all the images are captured from the 10th floor of a building. The dataset contains 125 images with approximately 17k cars, of which 100 images are served as training set, and the rest as testing set.
Drone-crowd [44]444https://github.com/VisDrone/VisDrone-Dataset is a drone-captured dataset for density map estimation, crowd localization and tracking, which is composed of 112 video clips with 33,600 frames in total. The video clips are annotated with over 4.8 million head annotations and several video-level attributes. All the images are captured by drone-mounted cameras in 70 different scenarios across 4 different cities in China (i.e., Tianjin, Guangzhou, Daqing, and Hong Kong). For the counting task in this paper, we split the dataset into training and test set, of which 24,600 images for training and the remaining 9,000 for testing.
ShanghaiTech [11]555https://pan.baidu.com/s/1nuAYslz includes two parts, i.e., Part_A and Part_B, with a total number of 1,198 images. The images of Part_A are randomly crawled from the Internet, which are across diverse scenes and largely varied densities. Part_A has 482 images, of which 300 are served as training set and the remaining 182 for testing. The images of Part_B are taken from the metropolis in Shanghai, which consists of 400 images for training and 316 for testing.
UCF-QNRF [37]666https://www.crcv.ucf.edu/data/ucf-qnrf/ is a recently released large and challenging dataset, which has a wide range of image resolutions, counts, scale variations and diversely density distribution. The images of this dataset are crawled from Flickr, Web Search and Hajj footage, containing 1,535 images with over 125 million point annotations, where 1,201 images are used for training and the remaining 334 images for testing.
UCF_CC_50 [38]777https://github.com/davideverona/deep-crowd-counting crowdnet is composed of 50 images with various resolutions. The dataset is small-scale yet challenging since the average count is up to 1,280. Following [38], five-fold cross-validation is performed to obtain the final test result.
Evaluation protocol: Two most widely used evaluation metrics, i.e., Mean Average Error (MAE) and Root Mean Squared Error (RMSE), are employed to evaluate the performance of the proposed method. The two metrics are defined as follows:
| (8) |
| (9) |
where is the number of test images, denotes the predicted count and indicates the ground truth count for the -th image, respectively.
IV-B Implementation details
We implement our proposed PSGCNet in PyTorch and train it in an end-to-end manner. All the experiments are conducted on one NVIDIA 2080Ti GPU. A truncated VGG19 [56] pre-trained on ImageNet [59] is taken as the backbone, with the fully connected layers and the last pooling layer removed. During training, the initial learning rate is 1e-5, and Adam optimizer is used. For better training and avoiding overfitting, random crop and horizontal flipping are applied for augmentation. Specifically, the crop size is for RSOC_building datasets, ShanghaiTech Part_A, and UCF_CC_50, and for RSOC_small-vehicle, RSOC_large-vehicle, RSOC_ship, CARPK, PUCPR+, DroneCrowd, ShanghaiTech Part_B and UCF_QNRF, since they have large image sizes. In addition, for all the datasets, 10% of the images are randomly sampled for validation from each training set. The batch size is set 1 for all the datasets.
| Baseline | PSM | GCM | MAE | RMSE |
|---|---|---|---|---|
| ✓ | – | – | 11.51 | 15.96 |
| ✓ | ✓ | – | 9.06 | 13.24 |
| ✓ | – | ✓ | 8.64 | 12.08 |
| ✓ | ✓ | ✓ | 7.54 | 10.52 |
IV-C Ablation studies
To validate the effectiveness of each module of our approach, we conduct ablation studies on RSOC_building dataset. The baseline method is BL [32]. The specific settings are shown in Table II.
Effect of PSM and GCM. From Table II we can observe that when PSM is introduced, the performance can achieve a significant improvement. Specifically, there are relative improvements of 21.28% and 17.04% w.r.t MAE and RMSE, demonstrating the robustness of the proposed PSM to the problem of large scale variation. To validate the robustness of the model to the complex background interference, we adopt a global context module. From Table II we can find that the GCM can boost the baseline method with a considerable elevation. In particular, the performance will gain by 24.93% and 24.31% w.r.t. MAE and RMSE, which proves that it has made a significant impact on highlighting objects parts while diminishing background noise.
Effect of the hyperparameter . To verify the effectiveness of the proposed BCL loss function, we conduct experiments under the condition of different . As can be observed from Table III, when , we can obtain the best performance.
| MAE | RMSE | |
|---|---|---|
| =0 | 8.18 | 12.61 |
| =10 | 8.36 | 12.92 |
| =1 | 8.02 | 11.96 |
| =0.1 | 7.54 | 10.52 |
| =0.01 | 7.88 | 11.02 |
| =0.001 | 7.94 | 11.46 |
Different backbones. Our proposed modules and loss function can be readily applied to any network structures to improve the performance. Here we apply them to VGG-19 and VGG-16 backbones and perform comparisons with the L2 loss-based models. The quantitative results from Table IV show that our method achieves better performance compared with the naive L2-based modes by a considerable margin.
| VGG-19 | VGG-16 | |||
| MAE | RMSE | MAE | RMSE | |
| L2-loss | 9.08 | 12.48 | 9.94 | 14.04 |
| PSGCNet(Ours) | 7.54 | 10.52 | 8.84 | 12.18 |
IV-D Comparisons on RSOC dataset
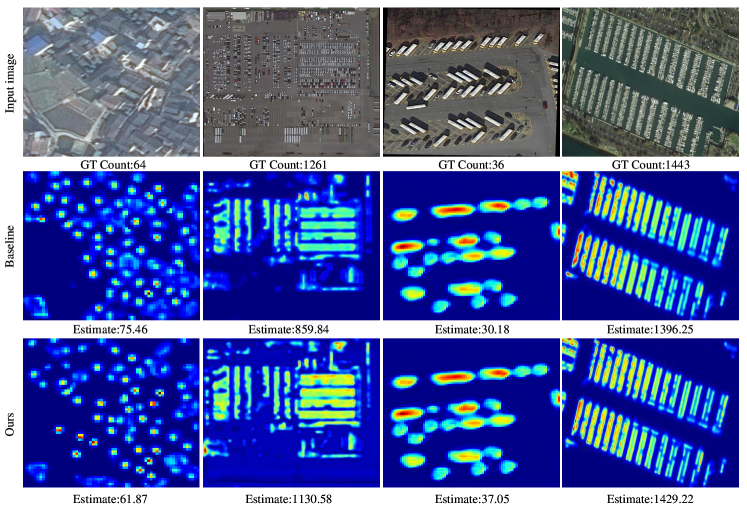
We compare our approach with state-of-the-art methods and show results in Table V and visualize some representative density maps in Fig. 6. Our model achieves substantial improvements on all the four subsets. Specifically, we improve the baseline with improvements of 34.49%, 6.76%, 17.85% and 11.01% on building, small-vehicle, large-vehicle and ship subsets in terms of MAE, respectively, indicating that our proposed method has a strong counting performance.
| YearVenue | RSOC_Building | RSOC_Small-vehicle | RSOC_Large-vehicle | RSOC_Ship | |||||
|---|---|---|---|---|---|---|---|---|---|
| MAE | RMSE | MAE | RMSE | MAE | RMSE | MAE | RMSE | ||
| MCNN [11] | 2016 CVPR | 13.65 | 16.56 | 488.65 | 1317.44 | 36.56 | 55.55 | 263.91 | 412.30 |
| CMTL [60] | 2017 AVSS | 12.78 | 15.99 | 490.53 | 1321.11 | 61.02 | 78.25 | 251.17 | 403.07 |
| CSRNet [20] | 2018 CVPR | 8.00 | 11.78 | 443.72 | 1252.22 | 34.10 | 46.42 | 240.01 | 394.81 |
| SANet [23] | 2018 ECCV | 29.01 | 32.96 | 497.22 | 1276.66 | 62.78 | 79.65 | 302.37 | 436.91 |
| SFCN [61] | 2019 CVPR | 8.94 | 12.87 | 440.70 | 1248.27 | 33.93 | 49.74 | 240.16 | 394.81 |
| SPN [21] | 2019 WACV | 7.74 | 11.48 | 445.16 | 1252.92 | 36.21 | 50.65 | 241.43 | 392.88 |
| SCAR [62] | 2019 NC | 26.90 | 31.35 | 497.22 | 1276.65 | 62.78 | 79.64 | 302.37 | 436.92 |
| CAN [22] | 2019 CVPR | 9.12 | 13.38 | 457.36 | 1260.39 | 34.56 | 49.63 | 282.69 | 423.44 |
| SFANet [63] | 2019 CVPR | 8.18 | 11.75 | 435.29 | 1284.15 | 29.04 | 47.01 | 201.61 | 332.87 |
| BL [32] | 2019 ICCV | 11.51 | 15.96 | 168.62 | 280.50 | 13.39 | 35.24 | 84.18 | 136.21 |
| ASPDNet [7, 8] | 2020 ICASSP/TGRS | 7.59 | 10.66 | 433.23 | 1238.61 | 18.76 | 31.06 | 193.83 | 318.95 |
| PSGCNet(Ours) | – | 7.54 | 10.52 | 157.55 | 245.31 | 11.00 | 17.65 | 74.91 | 112.11 |
| CARPK [9] | PUCPR+ [9] | |||
| MAE | RMSE | MAE | RMSE | |
| YOLO [64] | 102.89 | 110.02 | 156.72 | 200.54 |
| *YOLO [64] | 48.89 | 57.55 | 156.00 | 200.42 |
| Faster RCNN [65] | 103.48 | 110.64 | 156.76 | 200.59 |
| *Faster RCNN [65] | 24.32 | 37.62 | 39.88 | 47.67 |
| One-Look Regression [66] | 59.46 | 66.84 | 21.88 | 36.73 |
| SSD [67] | 37.33 | 42.32 | 119.24 | 132.22 |
| YOLO9000 [68] | 38.59 | 43.18 | 97.96 | 133.25 |
| LPN [9] | 23.80 | 36.79 | 22.76 | 34.46 |
| RetinaNet [69] | 16.62 | 22.30 | 24.58 | 33.12 |
| LEP [42] | 51.83 | – | 15.17 | – |
| MCNN [11] | 39.10 | 43.30 | 21.86 | 29.53 |
| CSRNet [20] | 11.48 | 13.32 | 8.65 | 10.24 |
| BL [32] | 9.58 | 11.38 | 6.54 | 8.13 |
| PSGCNet(Ours) | 8.15 | 10.46 | 5.24 | 7.36 |
IV-E Comparisons on CARPK and PUCPR+ dataset
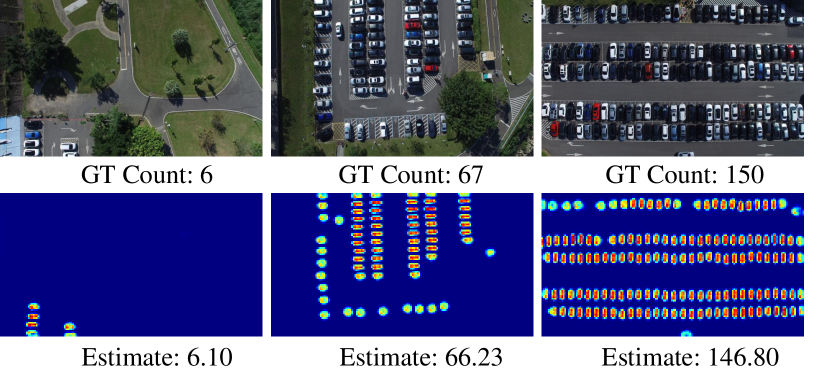
Table VI reports the MAE and RMSE results on two car counting datasets, i.e., CARPK and PUCPR+ [9]. We compare our proposed approach with state-of-the-art car counting methods including detection-based counting methods (YOLO [64], Faster RCNN [65], LPN [9], SSD [67], YOLO9000 [68], RetinaNet [69], and LEP [42]), a regression-based counting method (One-Look Regression [66]), and density map estimation based methods (MCNN [11], CSRNet [20], and BL [32]). The results reveal that our method consistently performs better than the comparative methods, which demonstrate the superiority of our method both in sparse and congested scenarios. Specifically, compared with several outstanding object detectors such as Faster RCNN [65] and YOLO [64], our proposed method surpasses them by a large margin. Moreover, compared with One-Look Regression [66], our approach shows better performance. We conjecture that it may be uncontrollable when regressing the count directly. Furthermore, compared with the density map estimation methods, i.e., MCNN [11], CSRNet [20], and BL [32], our proposed method still obtains the highest count scores. We visualize some qualitative results in Fig. 7. It demonstrates that the proposed method not only performs a better counting performance, but also shows strong localization ability.
IV-F Comparisons on DroneCrowd dataset
We also evaluate our method on a more challenging dataset, called DroneCrowd [44]. Table VII lists the counting results w.r.t MAE and RMSE, PSGCNet achieves comparable performance when compared with the state of the art methods. To further analyse the results, we also report the performance on several subsets according to three video-level attributes, i.e., two categories of scales including Large (the diameter of objects 15 pixels) and Small (the diameter of objects 15 pixels), three categories of illumination conditions including Cloudy, Sunny, and Night, two density levels including Crowded (with the number of objects in each frame larger than 150) and Sparse (with the number of objects in each frames less than 150). From the performance of subsets, we can find that our proposed method performs well in the Cloudy, Sunny, and Crowded subsets, degrades in the Night subset, this may be attributed to extremely low illumination and severe class imbalance. In particular, STNNet [44] performs the best across the whole dataset. It is a multi-task learning model to jointly solve density map estimation, localization and tracking. The method also leverages both spatial and temporal information, in which a neighboring context loss is applied to capture relations among neighboring targets in consecutive frames. Even so, our proposed model achieves a comparatively good performance and even surpasses it in the Sunny and Crowded subsets.
| Methods | Speed (FPS) | Overall | Large | Small | Cloudy | Sunny | Night | Crowded | Sparse | ||||||||
|---|---|---|---|---|---|---|---|---|---|---|---|---|---|---|---|---|---|
| MAE | RMSE | MAE | RMSE | MAE | RMSE | MAE | RMSE | MAE | RMSE | MAE | RMSE | MAE | RMSE | MAE | RMSE | ||
| MCNN [11] | 28.98 | 34.7 | 42.5 | 36.8 | 44.1 | 31.7 | 40.1 | 21.0 | 27.5 | 39.0 | 43.9 | 67.2 | 68.7 | 29.5 | 35.3 | 37.7 | 46.2 |
| CMTL [60] | 2.31 | 56.7 | 65.9 | 53.5 | 63.2 | 61.5 | 69.7 | 59.5 | 66.9 | 56.6 | 67.8 | 48.2 | 58.3 | 81.6 | 88.7 | 42.2 | 47.9 |
| MSCNN [70] | 1.76 | 58.0 | 75.2 | 58.4 | 77.9 | 57.5 | 71.1 | 64.5 | 85.8 | 53.8 | 65.5 | 46.8 | 57.3 | 91.4 | 106.4 | 38.7 | 48.8 |
| LCFCN [71] | 3.08 | 136.9 | 150.6 | 126.3 | 140.3 | 152.8 | 164.8 | 147.1 | 160.3 | 137.1 | 151.7 | 105.6 | 113.8 | 208.5 | 211.1 | 95.4 | 110.0 |
| SwitchCNN [45] | 0.01 | 66.5 | 77.8 | 61.5 | 74.2 | 74.0 | 83.0 | 56.0 | 63.4 | 69.0 | 80.9 | 92.8 | 105.8 | 67.7 | 79.8 | 65.7 | 76.7 |
| ACSCP [72] | 1.58 | 48.1 | 60.2 | 57.0 | 70.6 | 34.8 | 39.7 | 42.5 | 46.4 | 37.3 | 44.3 | 86.6 | 106.6 | 36.0 | 41.9 | 55.1 | 68.5 |
| AMDCN [73] | 0.16 | 165.6 | 167.7 | 166.7 | 168.9 | 163.8 | 165.9 | 160.5 | 162.3 | 174.8 | 177.1 | 162.3 | 164.3 | 165.5 | 167.7 | 165.6 | 167.8 |
| StackPooling [74] | 0.73 | 68.8 | 77.2 | 68.7 | 77.1 | 68.8 | 77.3 | 66.5 | 75.9 | 74.0 | 83.4 | 65.2 | 67.4 | 95.7 | 101.1 | 53.1 | 59.1 |
| DA-Net [75] | 2.52 | 36.5 | 47.3 | 41.5 | 54.7 | 28.9 | 33.1 | 45.4 | 58.6 | 26.5 | 31.3 | 29.5 | 34.0 | 56.5 | 68.3 | 24.9 | 28.7 |
| CSRNet [20] | 3.92 | 19.8 | 25.6 | 17.8 | 25.4 | 22.9 | 25.8 | 12.8 | 16.6 | 19.1 | 22.5 | 42.3 | 45.8 | 20.2 | 24.0 | 19.6 | 26.5 |
| CAN [22] | 7.12 | 22.1 | 33.4 | 18.9 | 26.7 | 26.9 | 41.5 | 11.2 | 14.9 | 14.8 | 17.5 | 69.4 | 73.6 | 14.4 | 17.9 | 26.6 | 39.7 |
| DM-Count [76] | 10.04 | 18.4 | 27.0 | 19.2 | 29.6 | 17.2 | 22.4 | 11.4 | 16.3 | 12.6 | 15.2 | 51.1 | 55.7 | 17.6 | 21.8 | 18.9 | 29.6 |
| STNNet [44] | 3.41 | 15.8 | 18.7 | 16.0 | 18.4 | 15.6 | 19.2 | 14.1 | 17.2 | 19.9 | 22.5 | 12.9 | 14.4 | 18.5 | 21.6 | 14.3 | 16.9 |
| PSGCNet(Ours) | 6.79 | 24.7 | 31.9 | 24.5 | 32.8 | 24.0 | 31.3 | 18.8 | 21.6 | 15.4 | 18.6 | 47.5 | 54.5 | 18.2 | 21.2 | 18.6 | 21.2 |
| YearVenue | ShanghaiTech_A | ShanghaiTech_B | UCF_QNRF | UCF_CC_50 | ||||||||||
| MAE | RMSE | R. | MAE | RMSE | R. | MAE | RMSE | R. | MAE | RMSE | R. | avg.R. | ||
| MCNN [11] | 2016 CVPR | 110.2 | 173.2 | 14.5 | 26.4 | 41.3 | 13.5 | 277 | 426 | 12 | 377.6 | 509.1 | 16 | 14 |
| CMTL [60] | 2017 AVSS | 101.3 | 152.4 | 13.5 | 20.0 | 31.1 | 11.5 | 252 | 514 | 12.5 | 322.8 | 397.9 | 14 | 12.9 |
| Switching-CNN [45] | 2017 CVPR | 90.4 | 135 | 12.5 | 21.6 | 33.4 | 12.5 | 228 | 445 | 11.5 | 318.1 | 439.2 | 14.5 | 12.8 |
| CSRNet [20] | 2018 CVPR | 68.2 | 115 | 11 | 10.6 | 16 | 9.5 | – | – | – | 266.1 | 397.5 | 11.5 | 10.7 |
| ACSCP [72] | 2018 CVPR | 75.7 | 102.7 | 9.5 | 17.2 | 27.4 | 10.5 | – | – | – | 291.0 | 404.6 | 13.5 | 11.2 |
| SFCN [61] | 2019 CVPR | 64.8 | 107.5 | 9.5 | 7.6 | 13.0 | 6 | 102.0 | 171.4 | 4.5 | 214.2 | 318.2 | 7 | 6.8 |
| CAN [22] | 2019 CVPR | 62.3 | 100.0 | 5 | 7.8 | 12.2 | 5 | 107 | 183 | 7.5 | 212.2 | 243.7 | 3 | 5.1 |
| TEDNet [77] | 2019 CVPR | 64.2 | 109.1 | 9 | 8.2 | 12.8 | 7 | 113 | 188 | 9 | 249.4 | 354.5 | 10 | 8.8 |
| BL [32] | 2019 ICCV | 62.8 | 101.8 | 6 | 7.7 | 12.7 | 5.5 | 88.7 | 154.8 | 2 | 229.3 | 308.2 | 6.5 | 5 |
| LS2M [78] | 2019 ICCV | 64.2 | 98.4 | 5.5 | 7.2 | 11.1 | 2.5 | 104.7 | 173.6 | 5.5 | 188.4 | 315.3 | 5 | 4.6 |
| DADNet [79] | 2019 MM | 64.2 | 99.9 | 6 | 8.8 | 13.5 | 8.5 | 113.2 | 189.4 | 10 | 285.5 | 389.7 | 11.5 | 8.8 |
| DUBNet [80] | 2020 AAAI | 64.6 | 106.8 | 8.5 | 7.7 | 12.5 | 5 | 105.6 | 180.5 | 6.5 | 243.8 | 329.3 | 9 | 7.3 |
| HYGNN [81] | 2020 AAAI | 60.2 | 94.5 | 2.5 | 7.5 | 12.7 | 4.5 | 100.8 | 185.3 | 6 | 184.4 | 270.1 | 3.5 | 4.1 |
| SDANet [54] | 2020 AAAI | 63.6 | 101.8 | 6.5 | 7.8 | 10.2 | 4 | – | – | – | 227.6 | 316.4 | 7 | 5.8 |
| ASNet [55] | 2020 CVPR | 57.78 | 90.13 | 1.5 | – | – | – | 91.59 | 159.71 | 3 | 174.84 | 251.63 | 1.5 | 2 |
| Baseline | – | 64.5 | 101.6 | – | 7.8 | 13.5 | – | 98.6 | 169.7 | – | 229.3 | 308.2 | – | – |
| PSGCNet(Ours) | – | 56.1 | 95.6 | 2 | 6.6 | 9.7 | 1 | 86.3 | 149.5 | 1 | 181.3 | 263.5 | 2.5 | 1.6 |
IV-G Comparisons on crowd counting datasets
To further validate the generalization ability and robustness of the proposed model, we extend it on four widely used crowd counting datasets, the counting results are reported in Table VIII. It demonstrates that our proposed approach can achieve consistent improvements compared with 15 state-of-the-art methods [11, 60, 45, 20, 72, 61, 22, 77, 82, 32, 78, 79, 80, 81, 54, 55]. Specifically, on ShanghaiTech dataset, our proposed model increases relative improvements of 12.4%/5.9% on Part_A and 15.4%/28.1% on Part_B, w.r.t, MAE/RMSE. Even on the more crowded UCF_QNRF and UCF_CC_50, we still improve the baseline with relative improvements of 12.5%/11.9% and 20.9%/14.5% w.r.t MAE/RMSE. It indicates that our proposed method achieves superior performance not only for sparse but also highly congested crowd scenes.
In consideration of some methods that may perform well on one dataset however poorly on other ones, for fairness, we adopt the average ranking evaluation strategy [55] to make a comprehensive evaluation (denoted by avg. R. in Tabel VIII). The average ranking value is obtained by summing all ranks that one method gains to divide the number of datasets it utilizes. The lower value indicates a higher rank. Therefore, our proposed method obtains the best average ranking, which reveals its powerful ability to deal with the diverse crowd scenes.
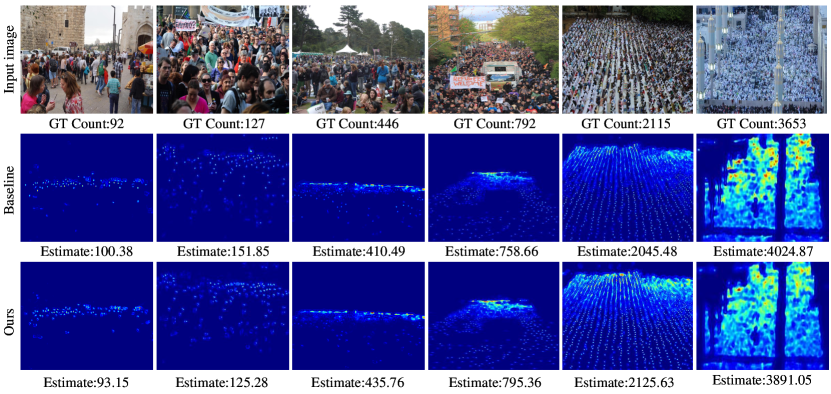
We visualize some estimated density maps of the proposed method and the baseline in Fig. 8, from which we can observe that our proposed method obtains more accurate estimations. Benefiting from the proposed PSM and GCM, our method can better reflect the scale variation of the pedestrians. Compared with the baseline method, our proposed model obtains more accurate estimations across diverse scenes from sparse to highly congested. Moreover, compared with baseline, our method obtains clearer density maps and shows stronger localization ability to a certain extent.
V Conclusion
In this paper, we have presented a novel supervised learning framework for dense object counting in remote sensing images, named PSGCNet. Our PSGCNet is characterized by three components: 1) capturing multi-scale features with an effective pyramidal scale module; 2) alleviating the interferences of complex background with a lightweight global context module, and 3) a reliable supervision manner combined with Bayesian loss and counting loss, which is utilized to train the network and learn the count expectation at each annotation point. Extensive experiments on four remote sensing object counting datasets demonstrate the effectiveness and superiority of the proposed approach. Moreover, extension experiments on four widely used crowd counting benchmark datasets further validate the generalization ability and robustness of the model.
References
- [1] D. Kang, Z. Ma, and A. B. Chan, “Beyond counting: Comparisons of density maps for crowd analysis tasks—counting, detection, and tracking,” IEEE Transactions on Circuits and Systems for Video Technology, vol. 29, no. 5, pp. 1408–1422, 2018.
- [2] T. Li, H. Chang, M. Wang, B. Ni, R. Hong, and S. Yan, “Crowded scene analysis: A survey,” IEEE Transactions on Circuits and Systems for Video Technology, vol. 25, no. 3, pp. 367–386, 2014.
- [3] S. Zhang, G. Wu, J. P. Costeira, and J. M. Moura, “Understanding traffic density from large-scale web camera data,” in Proceedings of the IEEE/CVF Conference on Computer Vision and Pattern Recognition, 2017, pp. 5898–5907.
- [4] C. Zhang, K. Kang, H. Li, X. Wang, R. Xie, and X. Yang, “Data-driven crowd understanding: A baseline for a large-scale crowd dataset,” IEEE Transactions on Multimedia, vol. 18, no. 6, pp. 1048–1061, 2016.
- [5] V. Lempitsky and A. Zisserman, “Learning to count objects in images,” Advances in Neural Information Processing Systems, 2010.
- [6] C. Arteta, V. Lempitsky, and A. Zisserman, “Counting in the wild,” in Proceedings of the European Conference on Computer Vision. Springer, 2016, pp. 483–498.
- [7] G. Gao, Q. Liu, and Y. Wang, “Counting dense objects in remote sensing images,” in IEEE International Conference on Acoustics, Speech and Signal Processing, 2020, pp. 4137–4141.
- [8] ——, “Counting from sky: A large-scale data set for remote sensing object counting and a benchmark method,” IEEE Transactions on Geoscience and Remote Sensing, pp. 3642–3655, 2020.
- [9] M.-R. Hsieh, Y.-L. Lin, and W. H. Hsu, “Drone-based object counting by spatially regularized regional proposal network,” in Proceedings of the IEEE/CVF International Conference on Computer Vision, 2017, pp. 4145–4153.
- [10] D. Du, Y. Qi, H. Yu, Y. Yang, K. Duan, G. Li, W. Zhang, Q. Huang, and Q. Tian, “The unmanned aerial vehicle benchmark: Object detection and tracking,” in Proceedings of the European Conference on Computer Vision, 2018, pp. 370–386.
- [11] Y. Zhang, D. Zhou, S. Chen, S. Gao, and Y. Ma, “Single-image crowd counting via multi-column convolutional neural network,” in Proceedings of the IEEE/CVF Conference on Computer Vision and Pattern Recognition, 2016, pp. 589–597.
- [12] V. A. Sindagi and V. M. Patel, “Generating high-quality crowd density maps using contextual pyramid cnns,” in Proceedings of the IEEE/CVF International Conference on Computer Vision, 2017, pp. 1861–1870.
- [13] Z.-Q. Cheng, J.-X. Li, Q. Dai, X. Wu, J.-Y. He, and A. G. Hauptmann, “Improving the learning of multi-column convolutional neural network for crowd counting,” in Proceedings of the 27th ACM International Conference on Multimedia, 2019, pp. 1897–1906.
- [14] F. Yu and V. Koltun, “Multi-scale context aggregation by dilated convolutions,” in International Conference on Learning Representations, 2016.
- [15] M. Lan, Y. Zhang, L. Zhang, and B. Du, “Global context based automatic road segmentation via dilated convolutional neural network,” Information Sciences, vol. 535, pp. 156–171, 2020.
- [16] K. He, X. Zhang, S. Ren, and J. Sun, “Spatial pyramid pooling in deep convolutional networks for visual recognition,” IEEE Transactions on Pattern Analysis and Machine Intelligence, vol. 37, no. 9, pp. 1904–1916, 2015.
- [17] L.-C. Chen, G. Papandreou, I. Kokkinos, K. Murphy, and A. L. Yuille, “Deeplab: Semantic image segmentation with deep convolutional nets, atrous convolution, and fully connected crfs,” IEEE Transactions on Pattern Analysis and Machine Intelligence, vol. 40, no. 4, pp. 834–848, 2017.
- [18] L. Zhang, M. Lan, J. Zhang, and D. Tao, “Stagewise unsupervised domain adaptation with adversarial self-training for road segmentation of remote-sensing images,” IEEE Transactions on Geoscience and Remote Sensing, 2021.
- [19] C. Szegedy, W. Liu, Y. Jia, P. Sermanet, S. Reed, D. Anguelov, D. Erhan, V. Vanhoucke, and A. Rabinovich, “Going deeper with convolutions,” in Proceedings of the IEEE/CVF Conference on Computer Vision and Pattern Recognition, 2015, pp. 1–9.
- [20] Y. Li, X. Zhang, and D. Chen, “Csrnet: Dilated convolutional neural networks for understanding the highly congested scenes,” in Proceedings of the IEEE/CVF Conference on Computer Vision and Pattern Recognition, 2018, pp. 1091–1100.
- [21] X. Chen, Y. Bin, N. Sang, and C. Gao, “Scale pyramid network for crowd counting,” in IEEE Winter Conference on Applications of Computer Vision, 2019, pp. 1941–1950.
- [22] W. Liu, M. Salzmann, and P. Fua, “Context-aware crowd counting,” in Proceedings of the IEEE/CVF Conference on Computer Vision and Pattern Recognition, 2019, pp. 5099–5108.
- [23] X. Cao, Z. Wang, Y. Zhao, and F. Su, “Scale aggregation network for accurate and efficient crowd counting,” in Proceedings of the European Conference on Computer Vision, 2018, pp. 734–750.
- [24] J. He, Z. Deng, and Y. Qiao, “Dynamic multi-scale filters for semantic segmentation,” in Proceedings of the IEEE/CVF International Conference on Computer Vision, 2019, pp. 3562–3572.
- [25] I. C. Duta, L. Liu, F. Zhu, and L. Shao, “Pyramidal convolution: Rethinking convolutional neural networks for visual recognition,” arXiv preprint arXiv:2006.11538, 2020.
- [26] N. Liu, Y. Long, C. Zou, Q. Niu, L. Pan, and H. Wu, “Adcrowdnet: An attention-injective deformable convolutional network for crowd understanding,” in Proceedings of the IEEE/CVF Conference on Computer Vision and Pattern Recognition, 2019, pp. 3225–3234.
- [27] J. Hu, L. Shen, and G. Sun, “Squeeze-and-excitation networks,” in Proceedings of the IEEE/CVF Conference on Computer Vision and Pattern Recognition, 2018, pp. 7132–7141.
- [28] S. Woo, J. Park, J.-Y. Lee, and I. S. Kweon, “Cbam: Convolutional block attention module,” in Proceedings of the European Conference on Computer Vision, 2018, pp. 3–19.
- [29] X. Li, W. Wang, X. Hu, and J. Yang, “Selective kernel networks,” in Proceedings of the IEEE/CVF Conference on Computer Vision and Pattern Recognition, 2019, pp. 510–519.
- [30] Q. Wang, B. Wu, P. Zhu, P. Li, W. Zuo, and Q. Hu, “Eca-net: Efficient channel attention for deep convolutional neural networks,” in Proceedings of the IEEE/CVF Conference on Computer Vision and Pattern Recognition, 2020, pp. 11 534–11 542.
- [31] Z. Yang, L. Zhu, Y. Wu, and Y. Yang, “Gated channel transformation for visual recognition,” in Proceedings of the IEEE/CVF Conference on Computer Vision and Pattern Recognition, 2020, pp. 11 794–11 803.
- [32] Z. Ma, X. Wei, X. Hong, and Y. Gong, “Bayesian loss for crowd count estimation with point supervision,” in Proceedings of the IEEE/CVF International Conference on Computer Vision, 2019, pp. 6142–6151.
- [33] D. Kamenetsky and J. Sherrah, “Aerial car detection and urban understanding,” in International Conference on Digital Image Computing: Techniques and Applications, 2015, pp. 1–8.
- [34] T. Moranduzzo and F. Melgani, “Automatic car counting method for unmanned aerial vehicle images,” IEEE Transactions on Geoscience and Remote Sensing, vol. 52, no. 3, pp. 1635–1647, 2013.
- [35] S. An, W. Liu, and S. Venkatesh, “Face recognition using kernel ridge regression,” in Proceedings of the IEEE/CVF Conference on Computer Vision and Pattern Recognition, 2007, pp. 1–7.
- [36] A. B. Chan, Z.-S. J. Liang, and N. Vasconcelos, “Privacy preserving crowd monitoring: Counting people without people models or tracking,” in Proceedings of the IEEE/CVF Conference on Computer Vision and Pattern Recognition, 2008, pp. 1–7.
- [37] H. Idrees, M. Tayyab, K. Athrey, D. Zhang, S. Al-Maadeed, N. Rajpoot, and M. Shah, “Composition loss for counting, density map estimation and localization in dense crowds,” in Proceedings of the European Conference on Computer Vision, 2018, pp. 532–546.
- [38] H. Idrees, I. Saleemi, C. Seibert, and M. Shah, “Multi-source multi-scale counting in extremely dense crowd images,” in Proceedings of the IEEE/CVF Conference on Computer Vision and Pattern Recognition, 2013, pp. 2547–2554.
- [39] G. Gao, J. Gao, Q. Liu, Q. Wang, and Y. Wang, “Cnn-based density estimation and crowd counting: A survey,” arXiv preprint arXiv:2003.12783, 2020.
- [40] V. A. Sindagi and V. M. Patel, “A survey of recent advances in cnn-based single image crowd counting and density estimation,” Pattern Recognition Letters, vol. 107, pp. 3–16, 2018.
- [41] R. Bahmanyar, E. Vig, and P. Reinartz, “Mrcnet: Crowd counting and density map estimation in aerial and ground imagery,” BMVC Workshop on Object Detection and Recognition for Security Screening, 2019.
- [42] T. Stahl, S. L. Pintea, and J. C. Van Gemert, “Divide and count: Generic object counting by image divisions,” IEEE Transactions on Image Processing, vol. 28, no. 2, pp. 1035–1044, 2018.
- [43] W. Li, H. Li, Q. Wu, X. Chen, and K. N. Ngan, “Simultaneously detecting and counting dense vehicles from drone images,” IEEE Transactions on Industrial Electronics, vol. 66, no. 12, pp. 9651–9662, 2019.
- [44] L. Wen, D. Du, P. Zhu, Q. Hu, Q. Wang, L. Bo, and S. Lyu, “Detection, tracking, and counting meets drones in crowds: A benchmark,” in Proceedings of the IEEE/CVF Conference on Computer Vision and Pattern Recognition, 2021, pp. 7812–7821.
- [45] D. B. Sam, S. Surya, and R. V. Babu, “Switching convolutional neural network for crowd counting,” in Proceedings of the IEEE/CVF Conference on Computer Vision and Pattern Recognition, 2017, pp. 4031–4039.
- [46] F. Dai, H. Liu, Y. Ma, X. Zhang, and Q. Zhao, “Dense scale network for crowd counting,” in Proceedings of the 2021 International Conference on Multimedia Retrieval, 2021, pp. 64–72.
- [47] S. Bai, Z. He, Y. Qiao, H. Hu, W. Wu, and J. Yan, “Adaptive dilated network with self-correction supervision for counting,” in Proceedings of the IEEE/CVF Conference on Computer Vision and Pattern Recognition, 2020, pp. 4594–4603.
- [48] H. Bai, S. Wen, and S.-H. Gary Chan, “Crowd counting on images with scale variation and isolated clusters,” in Proceedings of the IEEE/CVF International Conference on Computer Vision Workshops, 2019, pp. 0–0.
- [49] R. R. Varior, B. Shuai, J. Tighe, and D. Modolo, “Scale-aware attention network for crowd counting,” arXiv preprint arXiv:1901.06026, 2019.
- [50] J. Dai, H. Qi, Y. Xiong, Y. Li, G. Zhang, H. Hu, and Y. Wei, “Deformable convolutional networks,” in Proceedings of the IEEE/CVF International Conference on Computer Vision, 2017, pp. 764–773.
- [51] V. A. Sindagi and V. M. Patel, “Ha-ccn: Hierarchical attention-based crowd counting network,” IEEE Transactions on Image Processing, vol. 29, pp. 323–335, 2019.
- [52] A. Zhang, J. Shen, Z. Xiao, F. Zhu, X. Zhen, X. Cao, and L. Shao, “Relational attention network for crowd counting,” in Proceedings of the IEEE/CVF International Conference on Computer Vision, 2019, pp. 6788–6797.
- [53] A. Zhang, L. Yue, J. Shen, F. Zhu, X. Zhen, X. Cao, and L. Shao, “Attentional neural fields for crowd counting,” in Proceedings of the IEEE/CVF International Conference on Computer Vision, 2019, pp. 5714–5723.
- [54] Y. Miao, Z. Lin, G. Ding, and J. Han, “Shallow feature based dense attention network for crowd counting,” in Proceedings of the AAAI Conference on Artificial Intelligence, vol. 34, no. 07, 2020, pp. 11 765–11 772.
- [55] X. Jiang, L. Zhang, M. Xu, T. Zhang, P. Lv, B. Zhou, X. Yang, and Y. Pang, “Attention scaling for crowd counting,” in Proceedings of the IEEE/CVF Conference on Computer Vision and Pattern Recognition, 2020, pp. 4706–4715.
- [56] K. Simonyan and A. Zisserman, “Very deep convolutional networks for large-scale image recognition,” in International Conference on Learning Representations, 2015.
- [57] A. Vaswani, N. Shazeer, N. Parmar, J. Uszkoreit, L. Jones, A. N. Gomez, L. Kaiser, and I. Polosukhin, “Attention is all you need,” in Advances in Neural Information Processing Systems, 2017, pp. 5998–6008.
- [58] X. Wang, R. Girshick, A. Gupta, and K. He, “Non-local neural networks,” in Proceedings of the IEEE/CVF Conference on Computer Vision and Pattern Recognition, 2018, pp. 7794–7803.
- [59] A. Krizhevsky, I. Sutskever, and G. E. Hinton, “Imagenet classification with deep convolutional neural networks,” in Advances in Neural Information Processing Systems, 2012, pp. 1097–1105.
- [60] V. A. Sindagi and V. M. Patel, “Cnn-based cascaded multi-task learning of high-level prior and density estimation for crowd counting,” in IEEE International Conference on Advanced Video and Signal Based Surveillance, 2017, pp. 1–6.
- [61] Q. Wang, J. Gao, W. Lin, and Y. Yuan, “Learning from synthetic data for crowd counting in the wild,” in Proceedings of the IEEE/CVF Conference on Computer Vision and Pattern Recognition, 2019, pp. 8198–8207.
- [62] J. Gao, Q. Wang, and Y. Yuan, “Scar: Spatial-/channel-wise attention regression networks for crowd counting,” Neurocomputing, vol. 363, pp. 1–8, 2019.
- [63] L. Zhu, Z. Zhao, C. Lu, Y. Lin, Y. Peng, and T. Yao, “Dual path multi-scale fusion networks with attention for crowd counting,” arXiv preprint arXiv:1902.01115, 2019.
- [64] J. Redmon, S. Divvala, R. Girshick, and A. Farhadi, “You only look once: Unified, real-time object detection,” in Proceedings of the IEEE/CVF Conference on Computer Vision and Pattern Recognition, 2016, pp. 779–788.
- [65] S. Ren, K. He, R. Girshick, and J. Sun, “Faster r-cnn: towards real-time object detection with region proposal networks,” IEEE Transactions on Pattern Analysis and Machine Intelligence, vol. 39, no. 6, pp. 1137–1149, 2016.
- [66] T. N. Mundhenk, G. Konjevod, W. A. Sakla, and K. Boakye, “A large contextual dataset for classification, detection and counting of cars with deep learning,” in Proceedings of the European Conference on Computer Vision, 2016, pp. 785–800.
- [67] W. Liu, D. Anguelov, D. Erhan, C. Szegedy, S. Reed, C.-Y. Fu, and A. C. Berg, “Ssd: Single shot multibox detector,” in Proceedings of the European Conference on Computer Vision, 2016, pp. 21–37.
- [68] J. Redmon and A. Farhadi, “Yolo9000: better, faster, stronger,” in Proceedings of the IEEE/CVF Conference on Computer Vision and Pattern Recognition, 2017, pp. 7263–7271.
- [69] T.-Y. Lin, P. Goyal, R. Girshick, K. He, and P. Dollár, “Focal loss for dense object detection,” in Proceedings of the IEEE/CVF International Conference on Computer Vision, 2017, pp. 2980–2988.
- [70] L. Zeng, X. Xu, B. Cai, S. Qiu, and T. Zhang, “Multi-scale convolutional neural networks for crowd counting,” in IEEE International Conference on Image Processing, 2017, pp. 465–469.
- [71] I. H. Laradji, N. Rostamzadeh, P. O. Pinheiro, D. Vazquez, and M. Schmidt, “Where are the blobs: Counting by localization with point supervision,” in Proceedings of the European Conference on Computer Vision, 2018, pp. 547–562.
- [72] Z. Shen, Y. Xu, B. Ni, M. Wang, J. Hu, and X. Yang, “Crowd counting via adversarial cross-scale consistency pursuit,” in Proceedings of the IEEE/CVF Conference on Computer Vision and Pattern Recognition, 2018, pp. 5245–5254.
- [73] D. Deb and J. Ventura, “An aggregated multicolumn dilated convolution network for perspective-free counting,” in Proceedings of the IEEE/CVF Conference on Computer Vision and Pattern Recognition Workshops, 2018, pp. 195–204.
- [74] S. Huang, X. Li, Z.-Q. Cheng, Z. Zhang, and A. Hauptmann, “Stacked pooling: Improving crowd counting by boosting scale invariance,” arXiv preprint arXiv:1808.07456, 2018.
- [75] Z. Zou, X. Su, X. Qu, and P. Zhou, “Da-net: Learning the fine-grained density distribution with deformation aggregation network,” IEEE Access, vol. 6, pp. 60 745–60 756, 2018.
- [76] B. Wang, H. Liu, D. Samaras, and M. Hoai, “Distribution matching for crowd counting,” in Advances in Neural Information Processing Systems, 2020.
- [77] X. Jiang, Z. Xiao, B. Zhang, X. Zhen, X. Cao, D. Doermann, and L. Shao, “Crowd counting and density estimation by trellis encoder-decoder networks,” in Proceedings of the IEEE/CVF Conference on Computer Vision and Pattern Recognition, 2019, pp. 6133–6142.
- [78] C. Xu, K. Qiu, J. Fu, S. Bai, Y. Xu, and X. Bai, “Learn to scale: Generating multipolar normalized density maps for crowd counting,” in Proceedings of the IEEE/CVF International Conference on Computer Vision, 2019, pp. 8382–8390.
- [79] D. Guo, K. Li, Z.-J. Zha, and M. Wang, “Dadnet: Dilated-attention-deformable convnet for crowd counting,” in Proceedings of the 27th ACM International Conference on Multimedia, 2019, pp. 1823–1832.
- [80] M.-h. Oh, P. Olsen, and K. N. Ramamurthy, “Crowd counting with decomposed uncertainty,” in Proceedings of the AAAI Conference on Artificial Intelligence, vol. 34, no. 07, 2020, pp. 11 799–11 806.
- [81] A. Luo, F. Yang, X. Li, D. Nie, Z. Jiao, S. Zhou, and H. Cheng, “Hybrid graph neural networks for crowd counting,” in Proceedings of the AAAI Conference on Artificial Intelligence, vol. 34, no. 07, 2020, pp. 11 693–11 700.
- [82] L. Liu, Z. Qiu, G. Li, S. Liu, W. Ouyang, and L. Lin, “Crowd counting with deep structured scale integration network,” in Proceedings of the IEEE/CVF International Conference on Computer Vision, 2019, pp. 1774–1783.