MyFood: A Food Segmentation and Classification System to Aid Nutritional Monitoring
Abstract
The absence of food monitoring has contributed significantly to the increase in the population’s weight. Due to the lack of time and busy routines, most people do not control and record what is consumed in their diet. Some solutions have been proposed in computer vision to recognize food images, but few are specialized in nutritional monitoring. This work presents the development of an intelligent system that classifies and segments food presented in images to help the automatic monitoring of user diet and nutritional intake. This work shows a comparative study of state-of-the-art methods for image classification and segmentation, applied to food recognition. In our methodology, we compare the FCN, ENet, SegNet, DeepLabV3+, and Mask RCNN algorithms. We build a dataset composed of the most consumed Brazilian food types, containing nine classes and a total of 1250 images. The models were evaluated using the following metrics: Intersection over Union, Sensitivity, Specificity, Balanced Precision, and Positive Predefined Value. We also propose an system integrated into a mobile application that automatically recognizes and estimates the nutrients in a meal, assisting people with better nutritional monitoring. The proposed solution showed better results than the existing ones in the market. The dataset is publicly available at the following link http://doi.org/10.5281/zenodo.4041488.
I Introduction
Poor diet and lack of physical activities are among the main factors that contribute to the population increase in weight [1]. This is usually related to intensive routines and a lack of knowledge about a healthy diet. These aspects have a high impact on world health because, with the increase in the population’s weight, the number of people with chronic non-transmissible diseases (e.g., diabetes and hypertension) has grown [2].
According to the World Health Organization (WHO), obesity is more common than innutrition [3], i.e., the population is becoming increasingly overweight and less nourished. In Brazil, the obesity rate has increased by 67.8% in the last thirteen years, according to the Health Ministry [4]. Although obesity rates have grown in recent years, the survey in [4] states that this index has been established since 2015, corresponding today to around 18.9% of the entire population.
Despite the current scenario, it has been seen an increasing interest of people towards a healthier lifestyle and nutritional information for diet [5]. However, any diet must be accompanied by a nutritionist, which will require monitoring the number of calories and nutrients in the meals of each person. For this purpose, several intelligent systems have been proposed to help people maintain the right level of food consumption and awareness of their diet by monitoring their eating habits [4].
Current nutritional monitoring apps use traditional methods for food recognition, with algorithms based on classification, using convolutional neural networks (CNN) [6, 7, 8, 9]. However, such applications are either semi-automatic, which identifies a group of possible types of food and requires user interaction or have incomplete information, such as the amount of food and calorie information. In this work, we propose the use of state-of-the-art (SOTA) segmentation algorithms to segment foods consumed in Brazilian meals, providing nutritional information to help the monitoring of diet.
For food recognition problems, it is common to use data sets such as Food101 [10], composed of 101 food categories, with 101,000 images. However Food101 does not have images with various food classes, making it difficult to use in real-world settings. In this context, we chose to build our own image data set to meet local needs, with the most consumed food in Brazil. The built data set will be publicly available.
This works evaluates SOTA methods of segmentation and classification applied to a Brazilian food dataset, based on the most consumed types of dietary. We also build a prototype of an app to use with the best methods evaluated, which showed improvements compared to existing apps.
Our main contributions are described below:
-
•
Comparison of state-of-the-art approaches for segmentation of Brazilian type of food.
-
•
A dataset with 1250 images and 9 classes of food (with annotations of the images)
-
•
Mobile application with integrated food segmentation and classification system to aid nutritional monitoring, which shows better results than existing solutions in the market.
II Related Work
Deep learning has recently been used to solve complex problems, such as image segmentation and classification [11]. Recent approaches in literature have been applied for food recognition in images. Zhang et al. [12] proposed a food image recognition system, using CNN, which can recognize about 100 types of food. In [13], Sun et al. propose a mobile application for recognition of food items from a single image. They used the CNN architecture based on Mobilenet [14] with the detection mechanism YOLO_v2 [15] to generate bounding boxes for each class of food. A performance of 76.36% of average precision was obtained in UECFood100 and 75.05% in UECFood256.
Shimoda et al. [16] proposed a new regional targeting method that combines the ideas from the RCNN [17] network. The regions proposed in the method are generated by selective search, extracting activation resources from the network and applying a support vector machine (SVM) to evaluate the proposals and produce bounding boxes for the objects. The authors adjusted the pre-trained network to the ImageNet [18] database using the PASCAL VOC [19] data set with 20 categories. The result for the metric intersection over union (IoU) was greater than 50% between the detected bounding box and the actual bounding box, outperforming or RCNN in relation to the food detection region, and also a PASCAL VOC detection task.
III Methodology
For this work, Python was used with the library Keras [25] which provides a simple and objective way to create a variety of deep learning models using TensorFlow. The models implemented in this project were processed using the Google Colaboratory tool (Google Colab) [26], which allows the use of the Jupyter Notebook service hosted on Google servers, with free access to computational resources, including 16GB Tesla P100 GPU and 20GB of RAM.
III-A Construction of the Brazilian Food Image Dataset
The image dataset of this work was built through a survey carried out by the Vigilantes do Peso [27] platform, which gathered the classification of the 50 most consumed foods by the Brazilian population. The amount of 50 foods was restricted based on a research and observational study to filter the 10 foods most consumed by people on a daily basis. A list of the most consumed foods is shown in Figure 1.
From the results obtained, it was possible to determine 9 classes of foods that were used in the research experiments. The selected classes were rice, beans, boiled egg, fried egg, pasta, salad, roasted meat, apple, and chicken breast. To optimize the image acquisition process, the tomato and lettuce foods were grouped into salads, and the coffee, butter, and mozzarella cheese foods were removed due to the complexity of acquiring the images, being replaced by apples and roasted meat. In the end, we obtained an average of 125 images per class and a total of 1250 images to conduct the evaluation experiments, using 60% of dataset for training, 20% for validation and 20% for test.
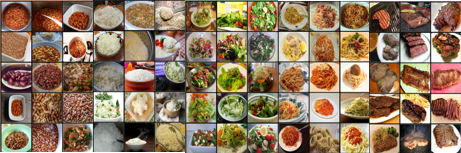
To obtain the images corresponding to the defined classes, a search and image capture script was developed on the servers of Google Image, Flickr and the Bing API, in order to facilitate the process of acquiring food images. All images were maintained according to their characteristics and were only resized to the 512x512 pixel standard. In the Figure 2 a section of our database is shown. Our dataset can be downloaded in Zenodo platatform [28] at http://doi.org/10.5281/zenodo.4041488.
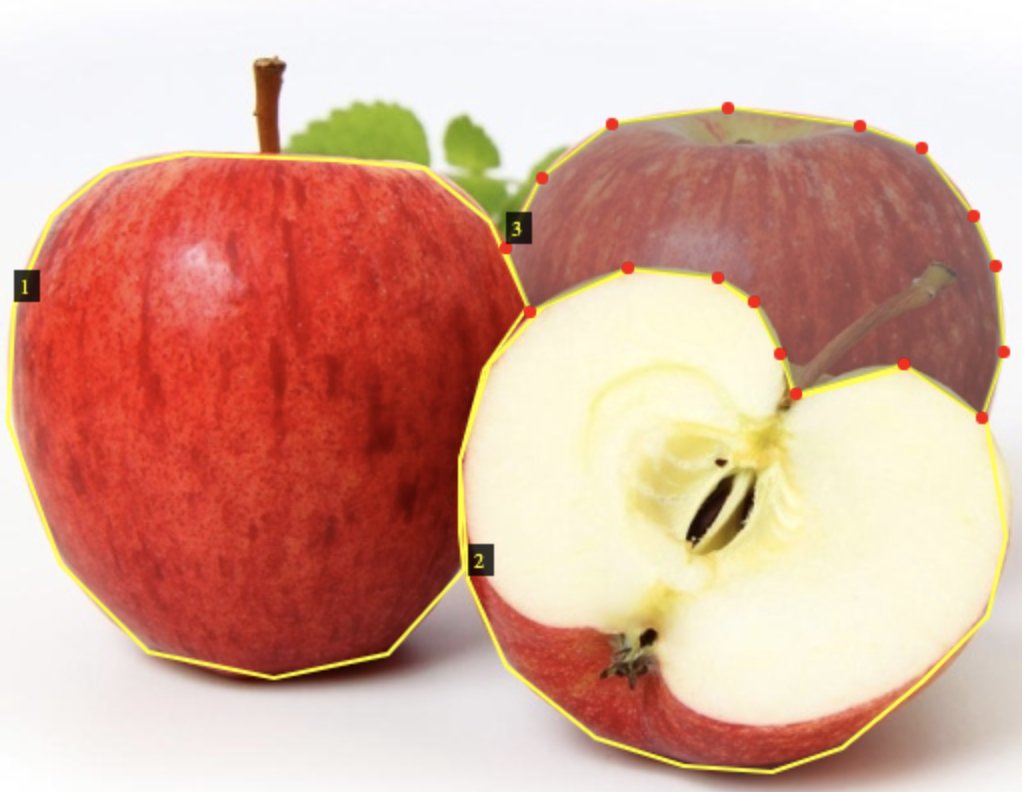
In each image of the training, validation and test subset, the process of labeling the food segmentation masks was performed, as shown in the figure 3. The process was performed manually with the support of the VGG Image Annotator (VIA) [29] tool, which saves the notes in a JSON file and each mask is represented by a set of polygon points. The masks are defined according to the characteristics (contours and shapes) of each image, assigning the segmentation masks corresponding to each identified class.
III-B Compared Approaches
We compare the following segmentation methods from SOTA for food segmentation:
FCN[20]: Fully Convolutive Networks (FCN) is built from locally connected layers [20], using a convolutional neural network to transform image pixels into categories of pixel [30]. J. Long et al. [20] were the first to develop a fully convolutive network trained from end to end for image segmentation. The authors modified known architectures (AlexNet, VGG16, GoogLeNet) to have an arbitrarily sized entry, replacing all fully connected layers with convolutional layers [31]. In this research, the FCN8 model was used, in which the VGG16 network is duplicated and the final classifying layer is discarded, converting all fully connected layers into convolutions.
Segnet[21]: SegNet is a deep encoder-decoder architecture for segmenting pixel-class of various classes, developed by members of the Vision Group and Computer Robotics at the University of Cambridge, United Kingdom. SegNet was mainly motivated by scene understanding applications. This research used a simplified version of SegNet, called SegNet-Basic [21], which has four encoders and four decoders, which allows us to explore many different variants (decoders) and train them in a reasonable time.
ENet [22]: ENet’s architecture is largely based on the ResNet network [32], being summarized to a main structure and several branches that separate, but also merge again through adding elements. In [22], the authors propose a new neural network architecture optimized for fast inference and high precision, with a focus use on mobile devices.
DeepLabV3+[23]: DeepLab is a targeting model, designed by the Google research group in 2016 [23]. The DeepLabv3+ proposal, according to the authors, is to extend the predecessor model (DeepLabv3) by applying the concept of atrous separable convolution composed of a deep convolution and a clockwise convolution (11 convolution with depth as input). Also employing an encoder-decoder structure, in which the encoder module processes contextual information at various scales applying the atrous convolution, while the simple yet effective decoder refines the segmentation results along with the limits of the object [23].
Mask RCNN[24]: Mask RCNN [24] is an extension of Faster RCNN, which is used for detection tasks of objects [33]. The Mask RCNN was developed by the Facebook research group and published in 2018, with the proposal of instance segmentation, in which the task of identifying each instance of the object the pixels corresponding to the classes contained in the image [24]. In summary, we can say that Mask RCNN combines the two main networks - Faster RCNN and FCN in a big architecture, whose loss function for the model is the total loss of the classification [34].
All the architectures implemented in the research were based on projects hosted in open source repositories. We made adjustments to the hyperparameters and the dataset loader to better adapt the research’s analysis and experimentation.
III-C Parameters
The parameters used in this research are based on the original papers of the architectures. Adjustments were applied to some parameters, such as input size, learning rate, decay, and epochs, to adapt the models to our dataset. We trained the models using momentum value of 0.9, image sizes of 224 224 pixels, 100 epochs of traning, batch sizes of 2, 10 and 32, and learning rate variations between , and , according to the basic definition of each architecture. Table I shows the best parameters found for each algorithm.
| Model | Optimizer | Rate | Decay | Batch Size | Backbone |
| FCN | SGD | 1E-2 | - | 32 | VGG16 |
| SegNet | SGD | 1E-2 | - | 32 | - |
| ENet | Adam | 5E-4 | - | 10 | - |
| DeepLabV3+ | SGD | 1E-2 | - | 32 | MobileNet |
| Mask RCNN | SGD | 1E-3 | 1E-4 | 2 | Resnet101 |
III-D Metrics
We evaluated the performance of each model according to the metrics used in literature: Intersection over Union (IoU), Positive Prediction Value (PPV), Sensitivity (SE), Specificity (SP), and Balanced Accuracy (BAC).
The metrics used are based on the values of true positive (TP), false positive (FP), true negative (TN) and false negative (FN). These values are calculated based on the binary segmentation ouput of each method. Each of the metrics are described bellow.
The Intersection over Union (IoU), also known as the Jaccard index, is a simple and extremely effective rating metric [35], which calculates the area of overlap between the predicted segmentation () and the ground truth (GT) (), divided by the union area between the predicted segmentation and the GT segmentation, as shown in the equation 1.
| (1) |
Positive prediction is calculated on all labels by measuring the number of times that a given class has been classified correctly. The prediction determined by the label considers only one class and measures the number of times that a specific label was correctly predicted (TP) normalized by the total number of positive predictions, as demonstrated in Equation 2.
| (2) |
Sensitivity (SE) is calculated as the number of correct positive predictions divided by the total number of positives. It is also called recall, it represents the effectiveness of the algorithm in correctly classifying the pixels of the image object [36]. Sensitivity is described according to the equation 3.
| (3) |
Specificity (SP) is calculated as the number of correct negative predictions divided by the total number of negatives. Specificity is calculated according to the equation 4.
| (4) |
Balanced Accuracy (BAC) is the average between specificity and sensitivity. The BAC is calculated according to the equation 5.
| (5) |
IV Results and Discussion
We evaluated the methods FCN, Segnet, ENet and DeepLabV3+, according to the metrics described in section III-D. We run the model for 100 epochs, and the results are shown in Table II.
| Model | IoU | SE | SP | BAC | PPV | ||
|---|---|---|---|---|---|---|---|
| FCN | 0.70(0.2) | 0.81(0.2) | 0.99(0.02) | 0.90(0.1) | 0.79(0.2) | ||
| Segnet | 0.52(0.2) | 0.64 (0.2) | 0.97(0.05) | 0.81(0.1) | 0.69(0.2) | ||
| Enet | 0.51(0.3) | 0.64(0.3) | 0.98 (0.03) | 0.81 (0.1) | 0.69(0.2) | ||
|
0.5(0.3) | 0.66 (0.3) | 0.98(0.05) | 0.82(0.1) | 0.79(0,2) | ||
|
0.70(0.2) | 0.76(0.2) | 0.98(0.05) | 0.87(0.09) | 0.87(0.1) |
As shown in Table II, the FCN model showed better results for most of the metrics. Although FCN used VGG16 backbone, it could generate more precise segmentation, with higher values of IoU and BAC. The Figure 4 shows qualitative results of segmentation for each method, for five images of the data set.
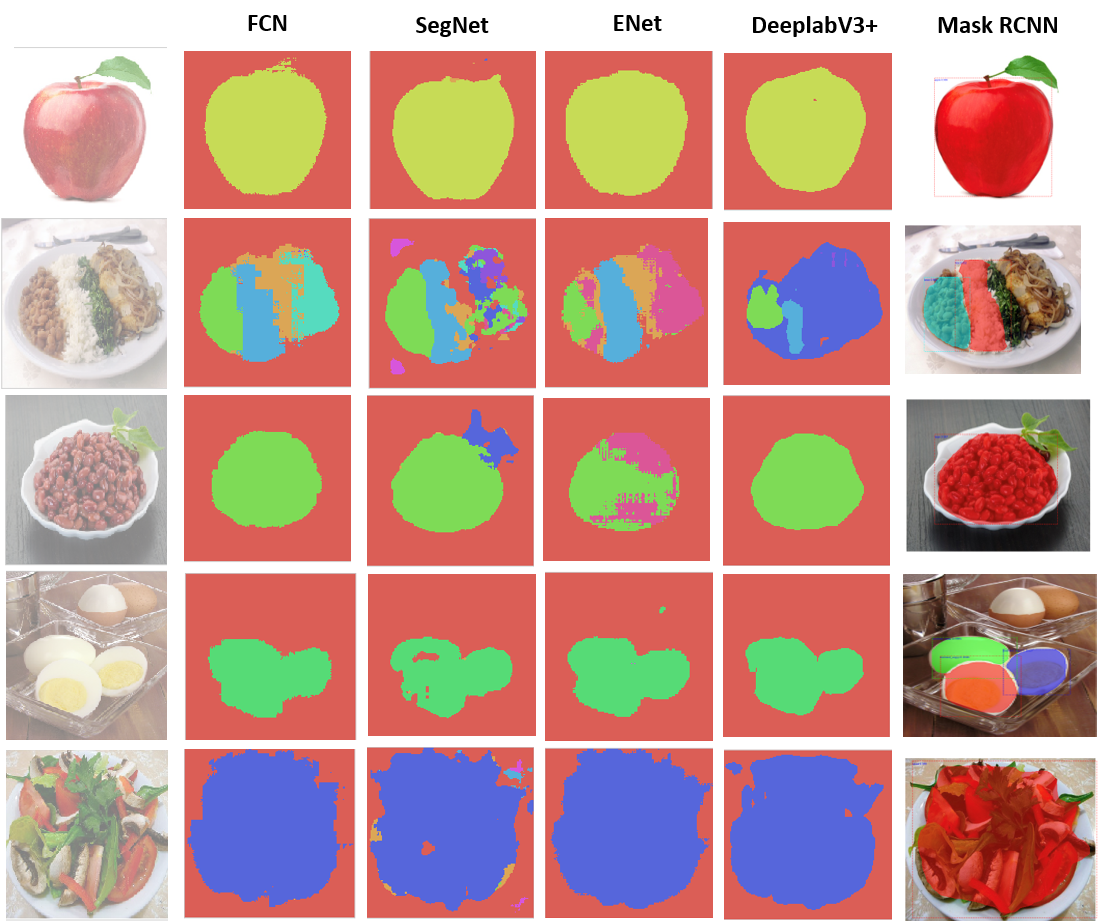
From Figure 4 we can see that most methods segment well the image when there is only one class of food in the image. However, when there are many classes, FCN segments better.
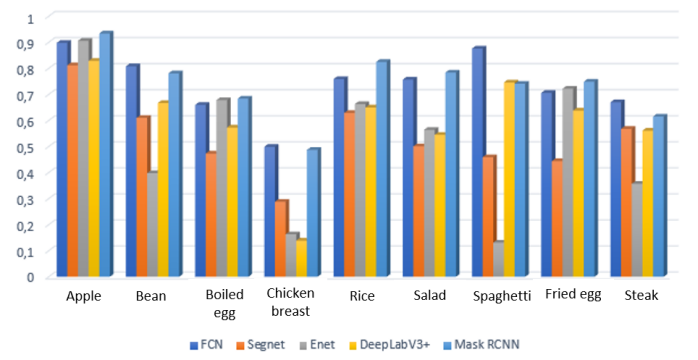
IV-A Class analysis
The analysis of IoU for each class is shown in Figure 5. It shows that the apple class was the class with the best results, meaning that it is the easiest one. The chicken breast class, on the other hand, was the one with the lowest rating among the models. The FCN and Mask RCNN models were the ones that obtained the best results in relation to most classes, with IoU values rates above 0.6.
IV-B System architecture and prototype
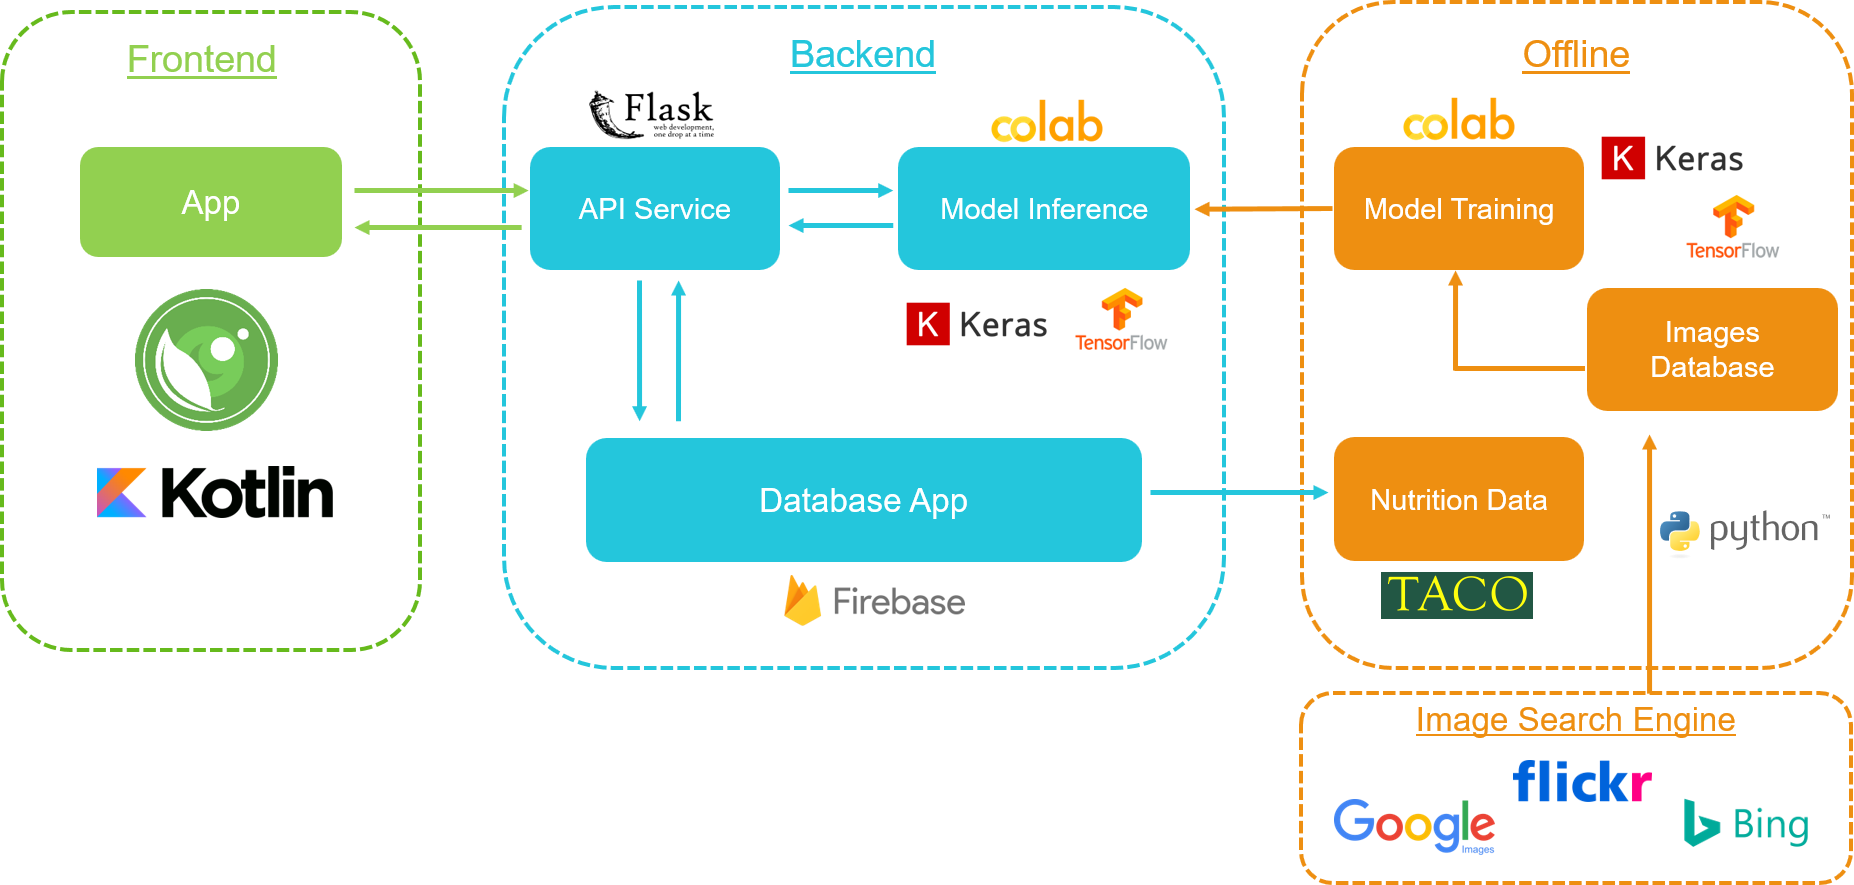
Our model was integrated with a mobile application, following the pipeline of capture, analysis, segmentation, and classification of food images, to create an application for food monitoring. The system consists of three parts: 1) offline, which comprises the base of images and experiments carried out with the implemented models; 2) backend, composed of the inference mechanisms (based on the model that obtained better results), a database with the nutritional information of the foods covered in the research and an API Service (Flask) to communicate with the application; and 3) a Frontend composed by the application mobile that will be the user interaction interface with the system. In figure 6 the complete architecture of the developed system is presented.
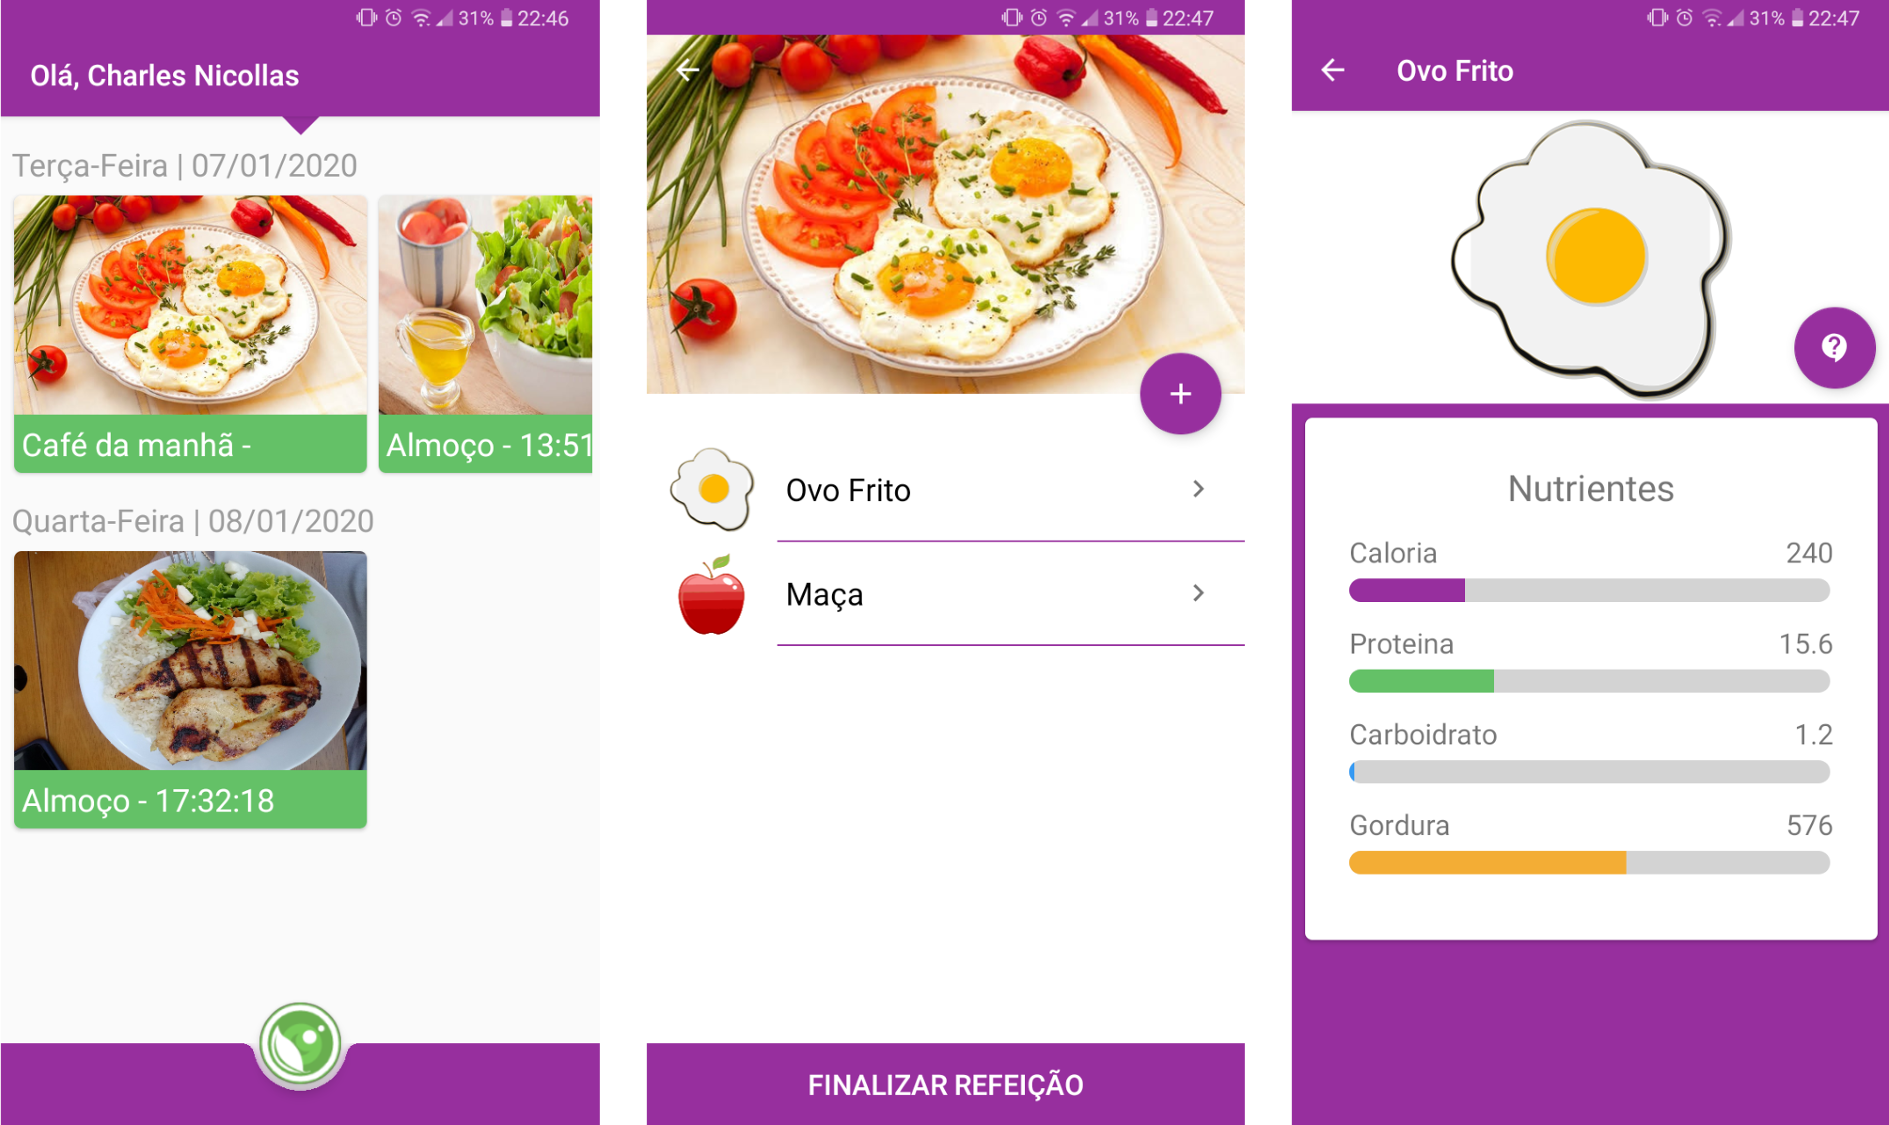
The model with the best results regarding the applied metrics was integrated into a mobile application, following the flow of capture, analysis, segmentation and classification of food images, with the purpose of creating an application for food monitoring. The prototype was developed following all current standards and methodologies for design and usability, to ensure greater acceptance and use of the application. Figure 7 illustrates some screens of the prototype of the developed application.
IV-C Comparison with existing apps
Based on the shown results, the Mask RCNN and FCN models obtained the best results in relation to the applied metrics. Based on that, Mask RCNN was chosen for a comparative analysis with three apps from the market: Calorie Mama[37], Lose It![38] and FoodVisor[39]). For this, 12 images of food were taken using a mobile phone and we compared the results of segmentation and classification for each image. Figure 8 shows the results:
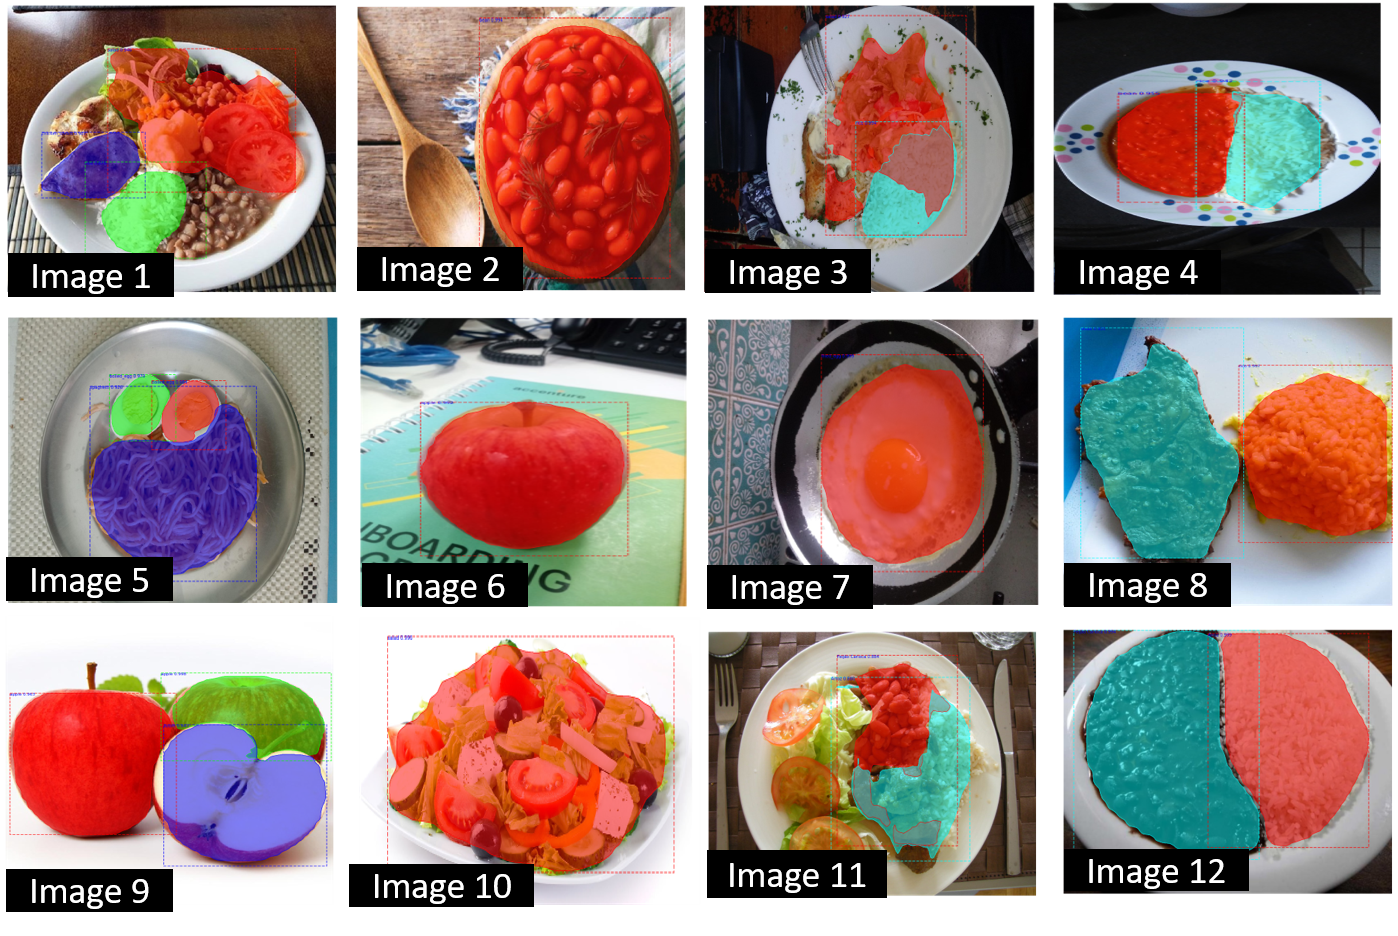
Real images of meals and food were used in order to analyze our solution and other similar applications. For Myfood one of the high challenges is the identification of meals with multiple foods, in which it is necessary to process, classify and segment each item in the image. Table III shows the comparative analysis performed with each application, using the previous 12 images.
| Calorie Mama | Lose It! | FoodVisor | MyFood | |
| Image 1 | good | good | bad | good |
| Image 2 | great | great | great | great |
| Image 3 | great | great | good | good |
| Image 4 | great | good | good | great |
| Image 5 | good | good | great | great |
| Image 6 | great | bad | great | great |
| Image 7 | great | bad | great | great |
| Image 8 | great | bad | bad | great |
| Image 9 | great | bad | great | great |
| Image 10 | great | great | bad | great |
| Image 11 | good | bad | great | good |
| Image 12 | good | good | bad | great |
As a way of carrying out an experiment in an equal way, precision was used in the recognition of each class in the images in the applications. Each application was classified according to its prediction, with 3 statuses being assigned, according to the result obtained: Bad (if the app detetcs less than 50% of the food in the image), Good (if it detects more than 50% of the food) and Great (if it detects all foods in the image). In this sample and experiment the results showed that MyFood obtained better prediction when compared to existing solutions.
V Conclusion and Future Work
This research focused on the development of a computer system for food recognition, through image classification and segmentation. The proposed system is capable of recognizing 9 classes of food, using deep learning methods and image segmentation algorithms. As main contribution, we built a Brazilian food dataset and conducted experiments of SOTA segmentation methods to perform food segmentation.
The segmentation analysis showed that FCN and Mask-RCNN obtained better results of segmentation, with a value of IoU of 0.70. The prototype developed in this research, using Mask-RCNN obtained better results compared with other approaches used in the market.
In future work, we will add 2D image volume analysis methods, and we will explore new methods to calculate the volume of food more accurately and thus have more nutritional information.
References
- [1] A. de Imprensa da CIC, “Má alimentação e falta de atividade fÃsica são as principais causas do sobrepeso,” 2011, available at https://ciccaxias.org.br/noticias/2011/03/31/ma-alimentacao-e-falta-de-atividade-fisica-sao-as-principais-causas-do-sobrepeso/.
- [2] W. O. Federation, “Obesity and overweight,” 2020, available at https://www.who.int/news-room/fact-sheets/detail/obesity-and-overweight.
- [3] W. H. Organization, “Obesity,” 2020, available at https://www.who.int/health-topics/.
- [4] P. B. M. da Saude, “Brasileiros atingem maior indice de obesidade nos ultimos treze anos,” 2019, available at http://www.saude.gov.br/noticias/agencia-saude/45612-brasileiros-atingem-maior-indice-de-obesidade-nos-ultimos-treze-anos.
- [5] M. Steingoltz, M. Picciola, and R. Wilson, “Consumer health claims 3.0: The next generation of mindful food consumption,” 2018, available at https://www.lek.com/insights/ei/next-generation-mindful-food-consumption.
- [6] H. Kagaya, K. Aizawa, and M. Ogawa, “Food detection and recognition using convolutional neural network,” 2014.
- [7] C. Liu, Y. Cao, Y. Luo, G. Chen, V. Vokkarane, and Y. Ma, “Deepfood: Deep learning-based food image recognition for computer-aided dietary assessment,” in International Conference on Smart Homes and Health Telematics. Springer, 2016, pp. 37–48.
- [8] P. Temdee and S. Uttama, “Deepfood: Food recognition on smartphone using transfer learning of convolution neural network,” IEEE Journal of Biomedical and Health Informatics, 2017.
- [9] P. Pandey, A. Deepthi, B. Mandal, and N. B. Puhan, “Foodnet: Recognizing foods using ensemble of deep networks,” IEEE Signal Processing Letters, vol. 24, pp. 1758–1762, 2017.
- [10] L. Bossard, M. Guillaumin, and L. Van Gool, “Food-101 – mining discriminative components with random forests,” in European Conference on Computer Vision, 2014.
- [11] N. Oa. Mahony, S. Campbell, A. Carvalho, S. Harapanahalli, G. V. Hernandez, L. Krpalkova, D. Riordan, and J. Walsh, “Deep learning vs. traditional computer vision,” in Science and Information Conference. Springer, 2019, pp. 128–144.
- [12] W. Zhang, D. Zhao, W. Gong, Z. Li, Q. Lu, and S. Yang, “Food image recognition with convolutional neural networks,” 08 2015, pp. 690–693.
- [13] J. Sun, K. Radecka, and Z. Zilic, “Foodtracker: A real-time food detection mobile application bydeep convolutional neural networks,” 09 2019.
- [14] A. G. Howard, M. Zhu, B. Chen, D. Kalenichenko, W. Wang, T. Weyand, M. Andreetto, and H. Adam, “Mobilenets: Efficient convolutional neural networks for mobile vision applications,” ArXiv, vol. abs/1704.04861, 2017.
- [15] J. Redmon and A. Farhadi, “Yolo9000: Better, faster, stronger,” arXiv preprint arXiv:1612.08242, 2016.
- [16] K. Shimoda, W. e Yanai, “Cnn-based food image segmentation without pixel-wise annotation,” The University of Electro-Communications, Tokyo, 2015.
- [17] R. Girshick, J. Donahue, T. Darrell, and J. Malik, “Rich feature hierarchies for accurate object detection and semantic segmentation,” Proceedings of the IEEE Computer Society Conference on Computer Vision and Pattern Recognition, 11 2013.
- [18] J. Deng, W. Dong, R. Socher, L.-J. Li, K. Li, and L. Fei-Fei, “ImageNet: A Large-Scale Hierarchical Image Database,” in CVPR09, 2009.
- [19] M. Everingham, L. Van Gool, C. K. I. Williams, J. Winn, and A. Zisserman, “The PASCAL Visual Object Classes Challenge 2012 (VOC2012) Results,” available at http://www.pascal-network.org/challenges/VOC/voc2012/workshop/index.html.
- [20] J. Long, E. Shelhamer, and T. Darrell, “Fully convolutional networks for semantic segmentation,” UC Berkeley, 2015.
- [21] V. Badrinarayanan, A. Kendall, and R. Cipolla, “Segnet: A deep convolutional encoder-decoder architecture for image segmentation,” IEEE Transactions on Pattern Analysis and Machine Intelligence, 2017.
- [22] A. Paszke, A. Chaurasia, S. Kim, and E. Culurciello, “Enet: A deep neural network architecture for real-time semantic segmentation,” 2016.
- [23] L.-C. Chen, Y. Zhu, G. Papandreou, F. Schroff, and H. Adam, “Encoder-decoder with atrous separable convolution for semantic image segmentation,” in ECCV, 2018.
- [24] K. He, G. Gkioxari, P. Dollar, and R. Girshick, “Mask r-cnn,” Facebook AI Research (FAIR), 2018.
- [25] F. Chollet et al., “Keras,” 2015, available at https://github.com/fchollet/keras.
- [26] G. Colaboratory, 2020, available at https://research.google.com/colaboratory/faq.html.
- [27] R. B. FORMA, “Os alimentos mais consumidos no vigilantes no peso,” 2018, available at https://boaforma.abril.com.br/dieta/os-alimentos-mais-consumidos-no-vigilantes-no-peso/.
- [28] C. Freitas, F. Cordeiro, and V. Macario, “Myfood dataset,” Sep. 2020. [Online]. Available: https://doi.org/10.5281/zenodo.4041488
- [29] A. Dutta, A. Gupta, and A. Zissermann, “VGG image annotator (VIA),” 2016, available at http://www.robots.ox.ac.uk/ vgg/software/via/.
- [30] A. Smola and M. Li, “Introduction to deep learning - semantic segmentation and data sets,” UC Berkeley, Tech. Rep., 2019.
- [31] A. Ouaknine, “Review of deep learning algorithms for image semantic segmentation,” 2018, available at https://medium.com/arthur_ouaknine/review-of-deep-learnin-algorithms-for-image-semantic-segmentation-509a600f7b57.
- [32] K. He, X. Zhang, S. Ren, and J. Sun, “Deep residual learning for image recognition,” CoRR, 2015.
- [33] P. SHARMA, “Computer vision tutorial: Implementing mask r-cnn for image segmentation,” 2019, available at https://www.analyticsvidhya.com/blog/2019/07/computer-vision-implementing-mask-r-cnn-image-segmentation/.
- [34] P. Dwivedi, “Semantic segmentation - popular architectures,” 2019, available at https://towardsdatascience.com/semantic-segmentation-popular-architectures-dff0a75f39d0.
- [35] E. Tiu, “Metrics to evaluate your semantic segmentation model,” 2019, available at https://towardsdatascience.com/metrics-to-evaluate-your-semantic-segmentation-model-6bcb99639aa2.
- [36] M. Andrade, F. Cordeiro, V. Macario, F. Lima, S. Hwang, and J. Mendonça, “Uma abordagem fuzzy-adaptativa para segmentação de imagens de cromossomos,” 10 2017.
- [37] C. Mama, 2017, available at https://www.caloriemama.ai/.
- [38] LoseIt!, 2008, available at https://www.loseit.com/.
- [39] FoodVisor, 2018, available at https://www.foodvisor.io/.