Effect of the charge distribution of virus coat proteins on the length of packaged RNAs
Abstract
Single-stranded RNA viruses efficiently encapsulate their genome into a protein shell called the capsid. Electrostatic interactions between the positive charges in the capsid protein’s N-terminal tail and the negatively charged genome have been postulated as the main driving force for virus assembly. Recent experimental results indicate that the N-terminal tail with the same number of charges and same lengths packages different amounts of RNA, which reveals that electrostatics alone cannot explain all the observed outcomes of the RNA self-assembly experiments. Using a mean-field theory, we show that the combined effect of genome configurational entropy and electrostatics can explain to some extent the amount of packaged RNA with mutant proteins where the location and number of charges on the tails are altered. Understanding the factors contributing to the virus assembly could promote the attempt to block viral infections or to build capsids for gene therapy applications.
pacs:
Valid PACS appear hereI Introduction
Viruses have optimized the feat of packaging of their negatively charged genomes into a protein shell called the capsid, often built from a large number of one or a few different kinds of protein subunits Bancroft (1970). Under many in vitro conditions, coat proteins of several single-stranded RNA (ssRNA) viruses can spontaneously encapsulate all types of anionic cargos including their native genome, linear polymers, and heterologous and nonviral RNAs Comas-Garcia et al. (2012); Beren et al. (2017); Borodavka et al. (2016); Hagan and Zandi (2016); Ning et al. (2016). The capsid proteins of several RNA viruses contain an unstructured positively charged N-terminal domain that extends toward the center of the capsid and interacts with the viral genome; see Fig. 1Cadena-Nava et al. (2011). Although the specific sequence of the viral RNA plays an important role in packaging Perlmutter and Hagan (2015); Stockley et al. (2013), it is now well established that the electrostatic interaction between N-terminal tails and RNA is the main driving force for the formation of viral particles and their stability Sun et al. (2007); Li et al. (2017); Zandi et al. (2020).
Self-assembly studies of various ssRNA viruses have revealed that the amount of RNA packaged depends directly on the number of positive charges on the N-terminal tails of capsid proteins. Many experiments show that mutant virions with less positive charges on N-terminal domain encapsidate lower amounts of RNA and mutants with increased positive charges package more Sivanandam et al. (2016); Ni et al. (2012). For example, the experimental studies of Sivanandam et al. show that the deletions of even one single positively charged residue of the satellite tobacco mosaic virus N-terminal domain results in the formation of virus particles with a reduced amount of viral RNAs Sivanandam et al. (2016). Belyi and Muthukumar as well as Hu et al. Belyi and Muthukumar (2006); Tao et al. (2008) also examined the relation between the total number of positive charges in the tails and the length of the encapsidated RNA in various viruses and found a strong relation between them.
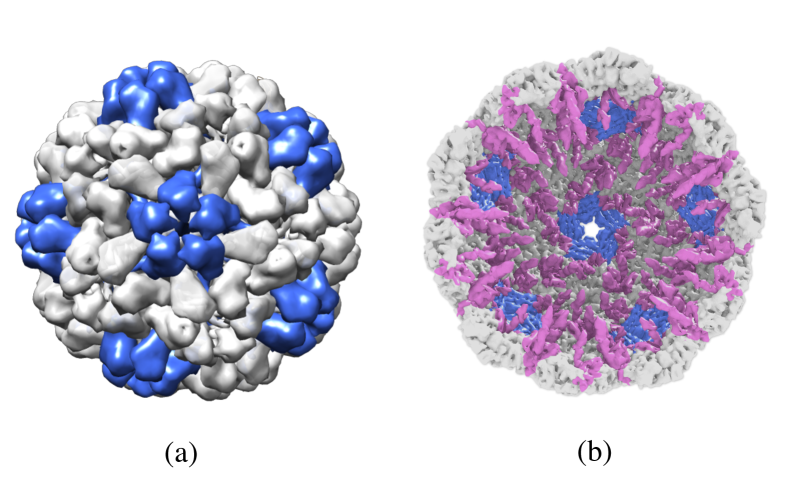
Of particular interest is the self-assembly experiments of Ni et al. who specifically focused on the brome mosaic virus (BMV) and systematically investigated the role of electrostatics on the amount of RNA packaged Ni et al. (2012). The N-terminal domain of BMV capsid proteins is composed of 26 residues, eight of which are positively charged. The genome of BMV consists of four RNA molecules: RNA1 (3.2 kb), RNA2 (2.9 kb), RNA3 (2.1 kb), and RNA4 (0.9 kb). While RNA3 and RNA4 co-assemble together in one capsid, RNA1 and RNA2 are each encapsidated separately. Quite interestingly, the total length of encapsidated genome is more or less the same in each capsid. The BMV capsids of these three types are virtually identical, i.e., have icosahedral structures consisting of 180 copies of the same protein with the same mechanical properties Zeng et al. (2017); see Fig. 1. We note that the structural index T, introduced by Casper and Klug, defines the number of protein subunits in viral shells, which is 60 times the T number Caspar and Klug (1962). Thus T = 1 and T = 3 capsids have 60 and 180 protein subunits, respectively.
To gain more insight into the effect of electrostatic interactions, Ni et al. made several mutants to increase the number of charges on N-terminal domains. A summary of their experimental results is presented in Fig. 2. In one case, they inserted eight residues including four positively charged ones after residue 15 (2H15). They also examined the impact of the length of the N-terminal without adding more positive charges but by introducing six alanines and two threonines, which are neutral (2HA15). To examine whether the position of the insertions has an impact on the amount of packaged RNA, they repeated the aforementioned experiments but introduced insertions after residue 7 and constructed 2H7 and 2HA7. Furthermore, to exclusively examine the effect of the increasing charges while keeping the length of the N-terminal tail the same as the wild-type one, they replaced four uncharged residues along the tail with four arginines (4R), each containing one positive charge. They found that in all cases, the structure of capsids was almost the same even though the amount of encapsidated RNA was different.
The spectroscopic analysis of the experiments of Ni et al. reveals that as the number of charges on the N-terminal increases, the higher amount of nucleotides per capsid is packaged Ni et al. (2012). Nevertheless, it appears that the amount of encapsidated RNA increase does depend on other factors than the number of positive charges on the N-terminals. While the experiments clearly indicate that electrostatics plays a major role in RNA packaging, it is not obvious whether electrostatics can explain all the effects observed in Fig 2. Many theoretical and experimental studies have already shown that the length of packaged RNA increases with the number of charges in N-terminal tails Li et al. (2017); Ni et al. (2012); Sivanandam et al. (2016), but how the amount of RNA encapsidated depends on the distribution and location of charges on the N-terminals have remained elusive.

In this paper we show that electrostatics is indeed able to explain at least to some extent many observed effects relevant to RNA packaging. Using the mean-field theory, we show that the charge discreteness, the location, and the distance between the charges along the N-terminal tails have a huge impact on the optimal number of nucleotides packaged. Consistently with the experiments of Ni et al. we find that the optimal amount of packaged RNA depends on the location of charges within the peptide sequence and increases non linearly with the total number of positive charges on the capsid.
The paper is organized as follows. In the next section, we introduce the model and derive the equations that we will employ later. In Sec. III, we present our results corresponding to the non uniform charge distribution along the N-terminal tails of BMV coat proteins. Section IV discusses the impact of the length and sequence of amino acid N-terminal tails on the the length of encapsidated genomes, and finally, we present our conclusion and summarize our findings.
II method
To explore the impact of N-terminal charge distribution on the length of packaged RNA, we model RNA as a negatively charged flexible polymer. Many experiments show that RNA acts effectively as a branched polymer in solution Gopal et al. (2014); Perlmutter et al. (2013). Due to the relatively weak strength of RNA base-pairing, the number of branch points of RNA can easily be modified through the interaction with the positive charges of virus coat proteins. Thus, we focus on the case of annealed branched polyelectrolyte, which allows the degree of branching of RNAs, a statistical quantity, to be modified van der Schoot and Zandi (2013). Using the mean-field theory, we calculate the free energy of the RNA confined into a spherical shell that interacts attractively with the positive charges residing on the N-terminal domains of the capsid proteins. Under the ground-state dominance approximation de Gennes (1979); Li et al. (2018) where only the dominating contribution to the polymer partition function is considered, the free energy of the genome-capsid complex in a salt solution is Borukhov et al. (1998); Siber and Podgornik (2008); Erdemci-Tandogan et al. (2014, 2016); Li et al. (2017)
| (1) |
where is the inverse of temperature in the units of energy, is the Kuhn length of the polymer, is the elementary charge, is the density of monovalent salt ions, and is the linear charge density of chain. The Bjerrum length is about for water at room temperature. The dielectric permittivity of the medium is assumed to be constantJanssen et al. (2014). See Ref. Wagner et al. (2015) and the Appendix of Ref. Erdemci-Tandogan et al. (2016) for a step by step derivation of Eq. (1), in the absence and presence of electrostatic interactions, respectively.
The field is the monomer density field and is the electrostatic potential. The density of positive charges on the N-terminal tails of capsid proteins is denoted by . The first term in Eq. (1) is the entropic cost of deviation from a uniform chain density. The last two lines of Eq. (1) are associated with the electrostatic interactions between the chain segments, the capsid, and the salt ions at the level of Poisson-Boltzmann theory Borukhov et al. (1998, 1995); Shafir et al. (2003); Siber et al. (2012). The term represents the free energy density associated with the annealed branching of the polymer including the self repulsion of the polyelectrolyte Lubensky and Isaacson (1979); Lee and Nguyen (2008); Elleuch et al. (1995),
| (2) |
where and are the fugacities of the end and branched points of the annealed polymer, respectively Wagner et al. (2015), and is the effective excluded volume for each monomer. Note that the stem-loop or hair-pin configurations of RNA are counted as end points in this model. The quantity indicates the density of end points and the density of branch points. The expectation numbers of end and branched points, and , are related to the fugacities and , and can be written as
| (3) |
There are two additional constraints in the system. The first one corresponds to the fact that the total number of monomers (Kuhn lengths) inside the capsid is fixed de Gennes (1982); Ji and Hone (1988),
| (4) |
We impose this constraint through a Lagrange multiplier, , introduced below. Second, there is a relation between the number of the end and branched points,
| (5) |
as there is only a single polymer in each capsid and no closed loops within the secondary structure of an RNA are allowed. The polymer is linear if , and the number of branched points increases with increasing value of . For our calculations, we vary and find through Eq. (3) and Eq. (5). To this end, is not a free parameter.
Extremizing the free energy with respect to the fields and , subject to the constraint that the total number of monomers inside the capsid is constant (Eq. (4)), we obtain three self-consistent non-linear coupled equations for the interior and exterior of the capsid,
| (6a) | ||||
| (6b) | ||||
| (6c) | ||||
where is the (dimensionless) Debye screening length and is the Lagrange multiplier implementing the fixed monomer number inside capsid. The polymer concentration in the exterior of the capsid is considered to be zero, . Equations (6) along with the constraints shown in Eqs. (4) and (5) represent a set of coupled nonlinear differential equations that, subject to appropriate boundary conditions, can only be solved numerically for the unknown parameters and and fields and .
The boundary conditions for the two coupled differential equations (6b) and (6c) can be obtained by minimizing the free energy with respect to the field on the surface of the capsid and are,
| (7) | ||||
We employ Dirichlet boundary condition for the monomer density field at the capsid wall. Because of the symmetric monomer distribution, we set . We emphasize that the derivations of all equations given in this section can be found in the Appendix of Ref. Erdemci-Tandogan et al. (2016). A more detailed derivation of the partition function and free energy for branched polymers can be found in Ref. Wagner et al. (2015).
II.1 N-terminal tails
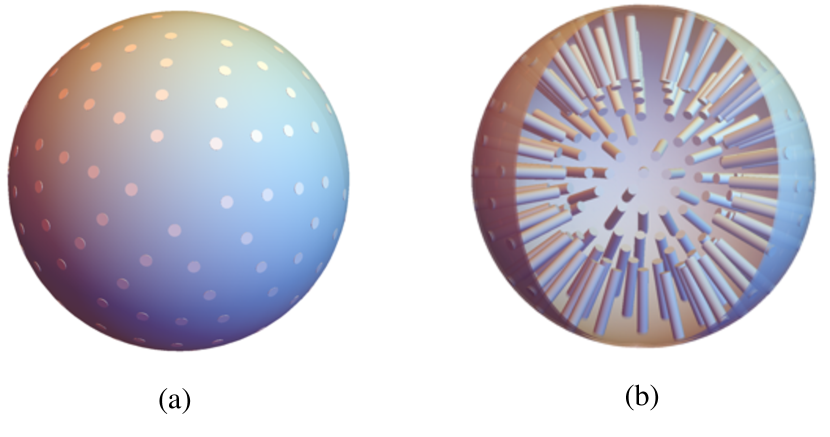
Figure 1 shows a structure with 180 N-terminal tails extending into the interior of the capsid, distributed with icosahedral symmetry. Because of the repulsion between the positive charges residing on the N-terminal tails, and the fact that RNA wraps around them, we assume that the N-terminal tails take an extended configuration. To this end, we model the N-terminal tails of BMV capsids as solid cylinders; see Fig. 3(b). We note that the charged tails are placed inside the capsid, and we will use the same boundary conditions for them as those given in Eq. (7) at the surface.
In the next section we will examine the impact of different charge distributions along N-terminal domains on the optimal genome length, which we will compare with the experimental results presented in Fig. 2. Since most of the positive charges are residing on the N-terminal tails, we consider that the charges of the coat proteins are only distributed in the cylindrical regions with no charges on the capsid wall.
For simplicity, we first consider a capsid with only two positive charges on each of its 60 N-terminal tails and then focus on the capsid of BMV.
III Results
III.1 A capsid with 60 tails ()
To obtain the optimal length of encapsidated genome in a shell, we numerically solve the nonlinear coupled differential equations (6a), (6b), and (6c), subject to the constraints given in Eqs. (4) and (5). We operate on the nonlinear coupled differential equations with the finite element method and deal with the convergence issue employing the Newton method Bangerth et al. (2007); Bathe (1996); Nocedal and Wright (2006).
After finding the solutions for the fields and we insert them into Eq. (1) to obtain the free energy of the polymer-capsid complex, Erdemci-Tandogan et al. (2014, 2016, 2017). To obtain the encapsidation free energy, we need to calculate the free energy of a polymer free in solution and that of a positively charged shell and then subtract them both from the polymer-capsid complex free energy, , given in Eq. (1). The capsid self-energy [F (N = 0)] due to the electrostatic interactions is calculated through Eqs. (6) and (7) in the limit as N → 0 and should be explicitly subtracted from the polymer-capsid complex free energy, . We emphasize that the focus here is on the solution conditions in which the capsid proteins can self-assemble in the absence of the genome. We also note that previous works have shown that the free energy associated with a free chain (both linear and branched) is negligible under most experimental conditions Erdemci-Tandogan et al. (2016); Siber and Podgornik (2008).
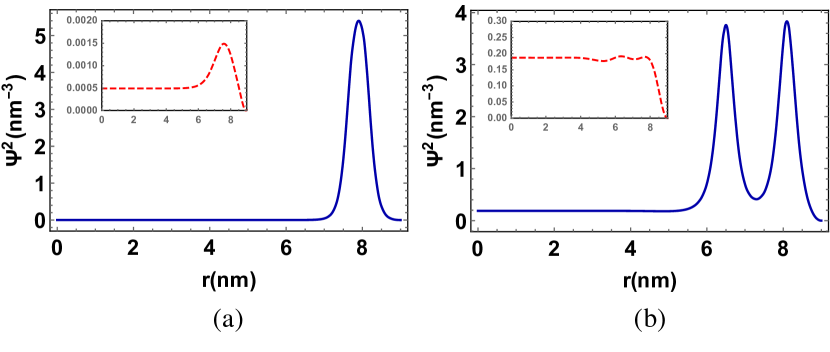
The results of our numerical calculations are given in Fig. 4 as a plot of the polymer concentration profile vs , the distance from the center of the shell for a branched polymer with the radius of capsid at salt concentrations. The total number of charges in the capsid is with two charges on each N-terminal tail. The length of N-terminal is and the size of each charge is (see Fig. 5(a)).
Figure 4(a) shows the genome profile if the distance between the two positive charges along the N-terminal tails is while Fig. 4(b) corresponds to when the distance between the charges is ; see Fig. 5(a) for a schematic presentation of the distribution of charges in both cases. Note that the charged amino acids are yellow and neutral ones are blue in Fig. 5(a). The optimal number of monomers enclosed in the shell for Fig. 4(a) is and for Fig. 4(b) is . The figure clearly shows that the polymer concentration is higher at the positions where the positive charges are located along the tails. When the distance between two charges is less than the Debye length , there is only one maximum in the profile. As the distance between the charges increases and goes beyond two Debye lengths, the genome density profile between the two charges goes almost to zero.
It is important to note that we have previously studied the impact of the number of branched points, which is closely connected to the value, on the length of the encapsidated genome and found that the length of the genome increases with Erdemci-Tandogan et al. (2014). Since our focus in this paper is only on the effect of charge distribution along the N-terminals, we set for all the calculations presented here. In a previous paper, we found that this value of would create a similar number of branch points to the case in the wild-type BMV genome Erdemci-Tandogan et al. (2014). The value of does not play an important role in our findings of the effect of N-terminal charge distribution.
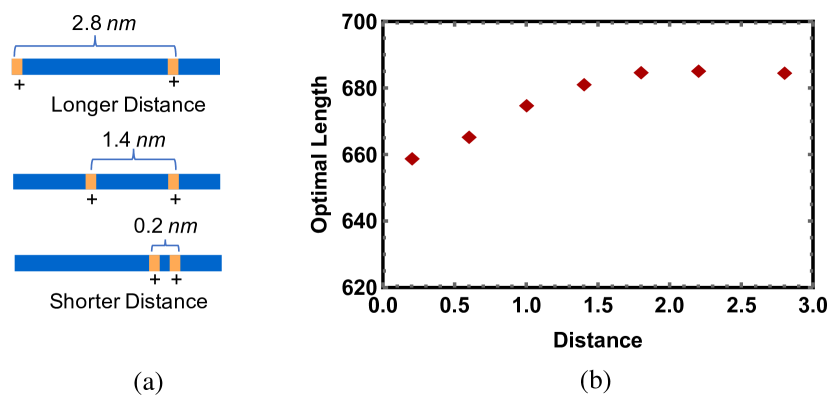
Figure 6 shows the encapsulation free energy as a function of , the number of monomers, for a structure. The dashed line in the figure corresponds to the case in which the distance between the charges is and solid lines to when the distance between the charges is ; see Fig. 5(a) for a schematic of two charge distributions. As illustrated in Fig. 6, when the charges are closer to each other, the free energy of the system is lower; however, the minimum of the free energy moves toward longer chains as the distance between the charges increases.
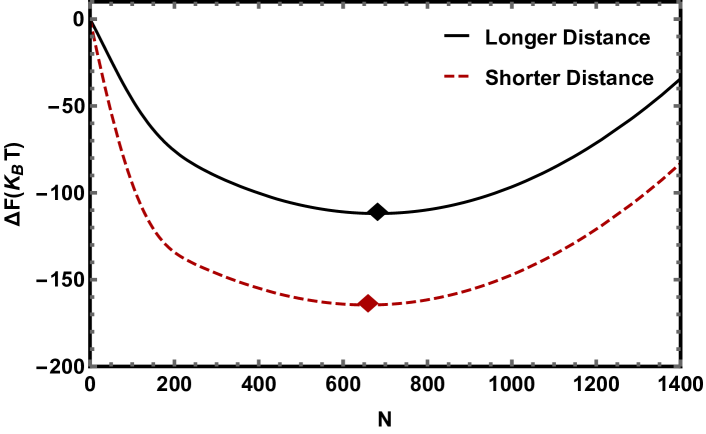
Figure 5(b) shows the optimal length of encapsidated RNA as a function of the distance between two charges along the N-terminal domains. One charge is placed at the end of the N-terminal tail next to the capsid wall, but the location of the other varies from the wall all the way to the tip. The figure clearly shows that as the distance between charges increases, the optimal length of the genome increases too. Thus, the location of charges along the N-terminal domains has an impact on the amount of the polymer packaged. It appears as the distance between the charges goes up, at some point the optimal length of the packaged genome saturates and does not keep increasing. A careful examination of the first term in Eq. (1) shows that for this size of capsid and charge distribution, the optimal genome density is too small and the impact of entropy is not strong enough to have a significant role in the optimal length of the genome. As the distance between the charges increases and becomes more than two Debye lengths ( for ), the electrostatic interaction becomes very weak between the two charges. Thus, the genome will be mostly adsorbed in the close proximity of each positive charge along the peptide. Note that even though entropy prefers a uniform genome density, the electrostatic interaction is much stronger and thus the optimal length of encapsidated genome first increases with the distance between the charges and then it remains more or less constant.
III.2 A capsid with 180 tails ()
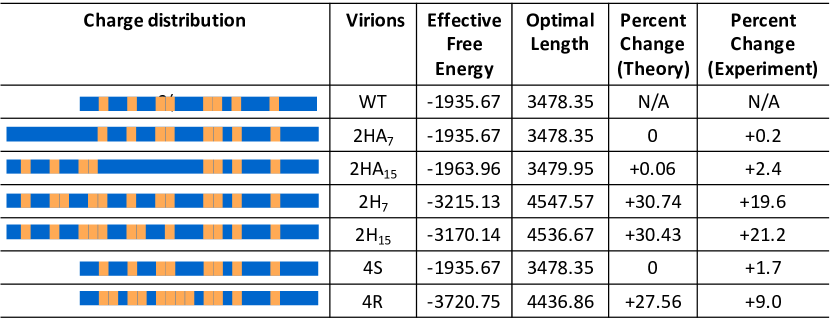
We now examine the impact of charge distribution along the N-terminal domain for a capsid with 180 N-terminal tails. More specifically, we focus on the self-assembly studies of Ni et al. in which the impact on the length of packaged RNA of the location and distribution of positive charges along the N-terminal domains of BMV capsid proteins were studied Ni et al. (2012). Figures 2(a) and 2(b) show the distribution of charges along N-terminal domains and the length of encapsulated RNA for different mutants, respectively. The schematic of the charge distribution along the N-terminals for various mutants and wild-type capsid proteins based on our model is illustrated in the left column of Fig. 7. The length of N-terminal is set equal to for the wild type and for the mutants with eight extra amino acids. We assume all amino acids have the same size, which is set equal to . The charged amino acids are yellow and neutral ones are blue as before.
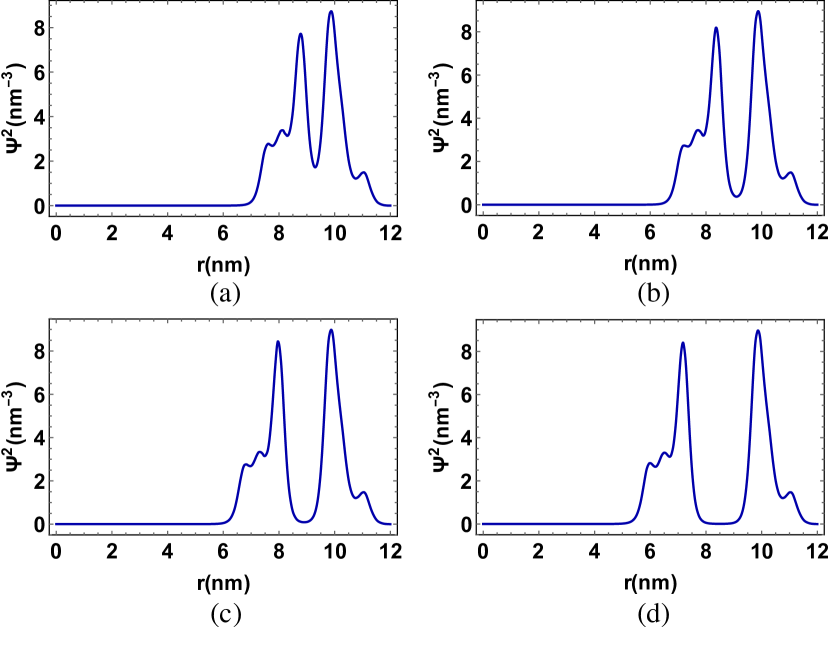
Following the same procedures as described above for a structure, we first obtain the genome profile for a given number of nucleotides and then use it to calculate the free energy of the system. Figure 8 shows the genome profiles for the wild type, 2HA15, and two other mutant proteins. The schematic of charge distribution for each case is illustrated in Figs. 7 and 9. The total number of monomers in each plot in Fig. 8 is , and the total number of charges in all capsids is . There are eight positive charges on each N-terminal tail, whose length is long for mutants and for wild-type proteins. The genome is considered to be a branched polymer ().
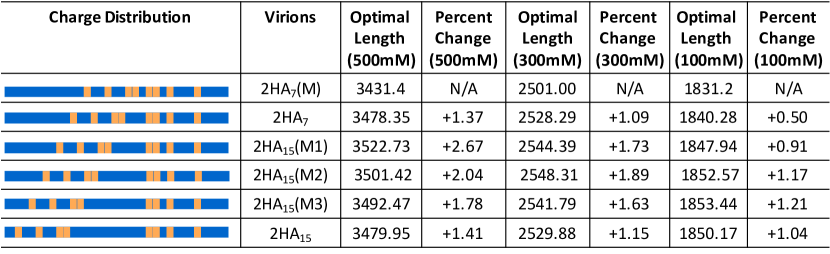
Figure 10 shows the free energy of a branched polymer packaged by the wild-type and mutant proteins of Fig. 7. The symbols in the figure correspond to the optimal genome length for each case. The figure reveals that the encapsulation free energy of the wild-type, 2HA7, 4S, and 2HA15 are almost the same. Note that all these mutants have the same number of charges on their capsids. The values of the minimum free energy, the corresponding optimal genome length, and the percent change (theory and experiment) of encapsulated genome compared to the wild-type case are presented in Fig. 7.

Consistent with the experimental data presented in Fig. 2 and the last column of Fig. 7, our theoretical calculations show that as the number of positive charges on the N-terminal tails increases, the optimal length of the genome increases too. The mutants 4R, 2H7, and 2H15 have four extra positive charges compared to wild-type proteins and they all encapsidate longer genomes. Both mutants 2H7 and 2H15 have longer tails compared to 4R, and our results show that they encapsidate longer genomes, consistent with the experimental findings. Thus the length of N-terminal tails influences the amount of packaged RNA.
While there are many similarities between the experiments presented in Fig. 2 and our theoretical results shown in Fig. 7, there are also some differences. The comparison of the experiment and theory reveals that more genome is encapsidated by 2HA15 proteins compared to wild-type or 2HA7 proteins, which is not observed in our calculations. Note that to perform the numerical calculations, we consider that all amino acids have the same effective size ( ), and the Debye length in our system is . Since the parameter landscape is quite vast and there are several unknowns, instead of changing the size of each amino acid, we modify the distance between the fourth and fifth charged amino acids in the N-terminal tail of the mutant 2HA15. More specifically, we systematically increase the distance between the fourth and fifth positive charges from to where the 8 amino acids were inserted for the case of the mutant 2HA15 and then calculate the optimal length of encapsidated genome for three different salt concentrations of , and . As illustrated in Fig. 9, the optimal length of encapsidated genome depends on both the distance between the fourth and fifth positively charged amino acids and the salt concentration. The figure reveals that as the distance increases from to , the optimal length of the encapsidated genome first increases and then later decreases.
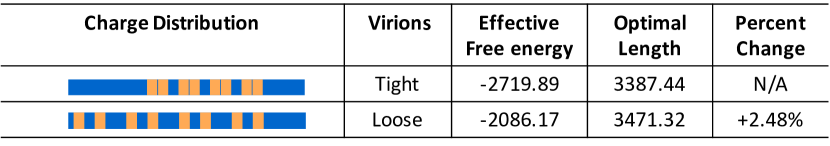
To gain more insights into the experimental results, we also examined the impact on the optimal polymer length of a uniform charge distribution along the N-terminals versus a tight one as presented in Fig. 11. As shown in the figure, for a given tail length and number of positive charges, when the charges are distributed more uniformly along the N-terminals, the optimal length of encapsidated genome becomes longer.
IV Discussion and Summary
Despite the fact that many experiments have shown that the number of nucleotides packaged by capsid proteins increases with the number of charges on N-terminal tails, how the amount of encapsidated RNA depends on the distribution of the charges along and the length of the N-terminal domain of capsid proteins is not well understood. Our results presented in Fig. 5(b) for T=1 capsid and Fig. 7 and Fig. 9 for T=3 viruses show that the electrostatic interaction alone is not sufficient to explain the dependence of the amount of packaged RNA on the amino sequence of N-terminal tails in the BMV experiments Ni et al. (2012). For example, the amount of packaged RNA is different for the mutant 2HA15 and 2HA7 as illustrated in Fig. 2 whereas both have the same number of charges, very similar charge distribution, and the same peptide length. This reveals the importance of specific interactions that depend on the exact type of amino acids, RNA secondary or tertiary structures, and packaging sequences or signals, which involve the highly specific, nonelectrostatic interactions between sections of RNA and capsid proteins Perlmutter and Hagan (2015); Stockley et al. (2013); Patel et al. (2015). Our mean-field theory does not include this effect and thus cannot explain the experimental observation due to specific interactions; nevertheless, our theory can describe how the length of N-terminal tails and distribution of charges along the peptide control the amount of RNA packaged by BMV capsid proteins, consistent with the experimental data.
The simple case of two charges on the N-terminal tails of the capsid (Fig. 5) shows clearly that when the distance between two positive charges increases, the optimal length of RNA encapsulated into the capsid also increases. A careful examination of Eq. (1) shows that the length of the encapsulated polyelectrolyte increases with the distance in order for the chain to be uniformly distributed between the two charges, lowering the entropy contribution (the first term in Eq. (1)) as much as possible. Figure 5 shows that the optimal length of the genome saturates and remains more or less constant beyond a certain distance between the two charges. This is mainly due to the fact that the optimal length of the genome for is such that the density of the genome is low. When the distance between the charges is more than two Debye lengths ( for ), the electrostatic interaction becomes very weak between the distant charges. It appears that the chain then prefers to reside only in the immediate vicinity of each positive charge along the peptide. More specifically, as the distance between the charges increases, the electrostatic does not promote encapsidation of longer genomes. Thus, the optimal length of the genome first increases and then it remains constant even if the distance between the charges increases further.
Figure 7 shows that the case for the structure relevant to BMV experiments is more complex. As seen in the figure, the mutant 4R whose charge is increased by substitution instead of insertion (keeping the length constant) has less encapsidated RNAs than do 2H7 and 2H15, while all three mutants have the same number of charges on their tails. Our calculations reveal that since 2H7 and 2H15 have longer N-terminal tails, a longer genome is necessary for the chain to uniformly wrap around the tail keeping the entropic contribution in Eq. (1) low. However, the difference between the length of the genome encapsidated by wild-type proteins and the mutant 2HA15 proteins whose N-terminal length is increased by insertion of eight neutral amino acids is not as pronounced in our theory as in the experiments. This could be explained at least in part by the distance between the charged amino acids in the peptide. To understand the impact of the distance between the charges, we systematically examined the effect of the distance between the charges in the middle of the N-terminal tail as illustrated in Fig. 9. The results presented in the figure are quite intriguing as the optimal length of the genome first increases and then decreases for the three different salt concentrations presented in the figure.
The large distance between the two charges along the N-terminal tail provides more space for the genome to reside. The careful examination of Eq. (1) shows that due to the entropic consideration, the genome will be distributed more or less uniformly along the N-terminal leading to the packaging of longer genomes. However, as the distance between the charges increases and goes beyond two Debye length ( for , for and for ), the optimal length of RNA becomes shorter. This effect can be well understood by investigating the genome profiles presented in Fig. 8. When the distance between the fourth and fifth charges is very large, there will be two distinct peaks in the genome profile with almost no nucleotides between the charges indicating that the negatively charged RNA prefers to be localized mainly around the positive charges. Figure 9 indicates that as the distance between the charges increases, at some point the optimal length of encapsidated RNA decreases resulting in the lower polymer density, which also reduces the entropy cost of formation of two completely separate peaks. Since the Debye length is longer for lower salt concentrations, the optimal length of the genome starts decreasing at for (2HA15(M3)), for (2HA15(M2)) and for (2HA15(M1)). While the behavior is the same for all three salt concentrations, the effect is less pronounced as the salt concentration decreases. Figure 11 further supports that for a given length and number of positive charges, the more uniformly charges are dispersed along the N-terminals, the longer the optimal length of the encapsidated genome becomes.
We emphasize that the goal of this paper has been to qualitatively explain the experimental results and to explore the impact of entropy and electrostatic interaction that depend on the distance between the charges and not the details of protein structures. A better quantitative comparison between the experiments and theory can be obtained if the theory includes many other effects such as counter-ion condensation, the presence of divalent ions, the structure of proteins, and the packaging signals discussed above.
In summary, in this paper we explore whether the variation in RNA packaging by BMV mutants observed in the experiments of Ni et al. and presented in Fig. 2 Ni et al. (2012) can be understood by the mean-field theory incorporating electrostatics, excluded volume interaction and RNA conformational entropy. In particular, we have calculated, as a function of the number and location of charges in the peptide tails, the free energy of an RNA confined in a spherical shell interacting with the N-terminal tails and ions. We find that the combined effect of the electrostatic interaction and the genome entropy considerations can shed light on many experimental data relevant to BMV assembly. While our mean-field theory cannot explain all the experimental data, we have been able to show that the location and the distance between charges along the N-terminal tails significantly influence the amount of packaged RNA. Understanding the factors contributing to the virus assembly and RNA packaging will pave the path for interfering with the different stages of the virus life cycle.
Acknowledgments
This work was supported by the National Science Foundation through Grant No. DMR-1719550.
References
- Bancroft (1970) J. B. Bancroft, Adv. Virus Res. 16, 99 (1970).
- Comas-Garcia et al. (2012) M. Comas-Garcia, R. D. Cadena-Nava, A. L. N. Rao, C. M. Knobler, and W. M. Gelbart, J. Virol. 86, 12271 (2012).
- Beren et al. (2017) C. Beren, L. L. Dreesens, K. N. Liu, C. M. Knobler, and W. M. Gelbart, Biophysical Journal 113, 339 (2017).
- Borodavka et al. (2016) A. Borodavka, S. Singaram, P. Stockley, W. Gelbart, A. Ben-Shaul, and R. Tuma, Biophysical Journal 111, 2077 (2016).
- Hagan and Zandi (2016) M. F. Hagan and R. Zandi, Curr. Opin. Virol. 18, 36 (2016).
- Ning et al. (2016) J. Ning, G. Erdemci-Tandogan, E. L. Yufenyuy, J. Wagner, B. A. Himes, G. Zhao, C. Aiken, R. Zandi, and P. Zhang, Nature Communications 7, 13689 (2016).
- Cadena-Nava et al. (2011) R. D. Cadena-Nava, Y. F. Hu, R. F. Garmann, B. Ng, A. N. Zelikin, C. M. Knobler, and W. M. Gelbart, J. Phys. Chem. B 115, 2386 (2011).
- Perlmutter and Hagan (2015) J. D. Perlmutter and M. F. Hagan, Journal of molecular biology 427, 2451 (2015).
- Stockley et al. (2013) P. G. Stockley, R. Twarock, S. E. Bakker, A. M. Barker, A. Borodavka, E. Dykeman, R. J. Ford, A. R. Pearson, S. E. V. Phillips, N. A. Ranson, and R. Tuma, J. Biol. Phys. 39, 277 (2013).
- Sun et al. (2007) J. Sun, C. DuFort, M.-C. Daniel, A. Murali, C. Chen, K. Gopinath, B. Stein, M. De, V. M. Rotello, A. Holzenburg, C. C. Kao, and B. Dragnea, Proc. Nat. Acad. Sci. USA 104, 1354 (2007).
- Li et al. (2017) S. Li, G. Erdemci-Tandogan, J. Wagner, P. Van Der Schoot, and R. Zandi, Physical Review E 96, 1 (2017).
- Zandi et al. (2020) R. Zandi, B. Dragnea, A. Travesset, and R. Podgornik, Phys. Rep. 847, 1 (2020).
- Sivanandam et al. (2016) V. Sivanandam, D. Mathews, R. Garmann, G. Erdemci-Tandogan, R. Zandi, and A. L. N. Rao, Scientific Reports 6, 26328 (2016).
- Ni et al. (2012) P. Ni, Z. Wang, X. Ma, N. C. Das, P. Sokol, W. Chiu, B. Dragnea, M. Hagan, and C. C. Kao, J. Mol. Biol. 419, 284 (2012).
- Belyi and Muthukumar (2006) V. A. Belyi and M. Muthukumar, PNAS 103, 17174 (2006).
- Tao et al. (2008) H. Tao, Z. Rui, and B. I. Shklovskii, Physica A 387, 3059 (2008).
- Zeng et al. (2017) C. Zeng, M. Hernando-Pérez, B. Dragnea, X. Ma, P. van der Schoot, and R. Zandi, Phys. Rev. Lett. 119, 038102 (2017).
- Caspar and Klug (1962) D. L. Caspar and A. Klug, Cold Spring Harbor Symp. Quant. Biol. 27, 1 (1962).
- Gopal et al. (2014) A. Gopal, E. D.E., Y. A.M., B.-S. A, R. ALN, C. M. Knobler, W. M. Gelbart, and A. Ben-Shaul, PLoS ONE 9, e105875 (2014).
- Perlmutter et al. (2013) J. D. Perlmutter, C. Qiao, and M. F. Hagan, eLife 2 (2013), 10.7554/eLife.00632.
- van der Schoot and Zandi (2013) P. van der Schoot and R. Zandi, J. Biol. Phys. 39, 289 (2013).
- de Gennes (1979) P.-G. de Gennes, Scaling concepts in polymer physics (Cornell University Press, Ithaca, New York, 1979).
- Li et al. (2018) S. Li, H. Orland, and R. Zandi, Journal of Physics: Condensed Matter 30, 144002 (2018).
- Borukhov et al. (1998) I. Borukhov, D. Andelman, and H. Orland, Euro. Phys. J. B 5, 869 (1998).
- Siber and Podgornik (2008) A. Siber and R. Podgornik, Phys. Rev. E 78, 051915 (2008).
- Erdemci-Tandogan et al. (2014) G. Erdemci-Tandogan, J. Wagner, P. van der Schoot, R. Podgornik, and R. Zandi, Phys. Rev. E 89, 032707 (2014).
- Erdemci-Tandogan et al. (2016) G. Erdemci-Tandogan, J. Wagner, P. van der Schoot, R. Podgornik, and R. Zandi, Phys. Rev. E 94, 022408 (2016).
- Janssen et al. (2014) M. Janssen, A. Härtel, and R. van Roij, Phys. Rev. Lett. 113, 268501 (2014).
- Wagner et al. (2015) J. Wagner, G. Erdemci-Tandogan, and R. Zandi, J. Phys.:Condens. Matter 27, 495101 (2015).
- Borukhov et al. (1995) I. Borukhov, D. Andelman, and H. Orland, Europhys. Lett. 32, 499 (1995).
- Shafir et al. (2003) A. Shafir, D. Andelman, and R. R. Netz, J. Chem. Phys. 119, 2355 (2003).
- Siber et al. (2012) A. Siber, A. L. Bozic, and R. Podgornik, Phys. Chem. Chem. Phys. 14, 3746 (2012), arXiv:1108:5905 .
- Lubensky and Isaacson (1979) T. C. Lubensky and J. Isaacson, Phys. Rev. A 20, 2130 (1979).
- Lee and Nguyen (2008) S. I. Lee and T. T. Nguyen, Phys. Rev. Lett. 100, 198102 (2008).
- Elleuch et al. (1995) K. Elleuch, F. Lequeux, and P. Pfeuty, J. Phys. I France 5, 465 (1995).
- de Gennes (1982) P.-G. de Gennes, Macromolecules 15, 492 (1982).
- Ji and Hone (1988) H. Ji and D. Hone, Macromolecules 21, 2600 (1988).
- Bangerth et al. (2007) W. Bangerth, R. Hartmann, and G. Kanschat, ACM Trans. Math. Softw. 33, 24/1 (2007).
- Bathe (1996) K. Bathe, Finite Element Procedures, Finite Element Procedures No. pt. 2 (Prentice Hall, New Jersey, 1996).
- Nocedal and Wright (2006) J. Nocedal and S. J. Wright, Numerical Optimization, 2nd ed. (Springer, New York, NY, 2006).
- Erdemci-Tandogan et al. (2017) G. Erdemci-Tandogan, H. Orland, and R. Zandi, Phys. Rev. Lett. 119, 188102 (2017).
- Patel et al. (2015) N. Patel, E. C. Dykeman, R. H. A. Coutts, G. P. Lomonossoff, D. J. Rowlands, S. E. V. Phillips, N. Ranson, R. Twarock, R. Tuma, and P. G. Stockley, Proceedings of the National Academy of Sciences 112, 2227 (2015), http://www.pnas.org/content/112/7/2227.full.pdf .