1Department of Physics and Astronomy, University of Calgary, Calgary, Canada.
\affilTwo2Johns Hopkins University, Baltimore, MD, USA.
\affilThree3Herzberg Institute of Astrophysics,Victoria, BC, Canada.
New Results from the UVIT Survey of the Andromeda Galaxy
Abstract
The Andromeda Galaxy (M31) has been observed with the UltraViolet Imaging Telescope (UVIT) instrument onboard the AstroSat Observatory. The M31 sky area was covered with 19 fields, in multiple UV filters per field, over the period of 2017 to 2019. The entire galaxy was observed in the FUV F148W filter, and more than half observed in the NUV filters. A new calibration and data processing is described which improves the astrometry and photometry of the UVIT data. The high spatial resolution of UVIT (1 arcsec) and new astrometry calibration (0.2 arcsec) allow identification of UVIT sources with stars, star clusters, X-ray sources, and other source types within M31 to a much better level than previously possible. We present new results from matching UVIT sources with stars measured as part of the Pan-chromatic Hubble Andromeda Treasury project in M31.
keywords:
UV astronomy—galaxies:M31—keyword3.leahy@ucalgary.ca
31 Oct 2020
12.3456/s78910-011-012-3 \artcitid#### \volnum000 0000 \pgrange1– \lp9
1 Introduction
M31 is the closest neighboring large galaxy to our Galaxy. It is a large spiral having many similarities to our Galaxy and can be used as a template to study the many aspects of our Galaxy which are difficult to study because of our location inside it and the resulting high extinction to much of our Galaxy. Another advantage of studying objects in M31 is that it is at a well known distance (783 kpc, McConnachie et al. 2005) thus the uncertainty in intrinsic brightness for many objects is better known than for most Galactic sources.
M31 has been observed in optical on numerous occasions. The highest resolution observations are carried out with the Hubble Space Telescope, including the Pan-chromatic Hubble Andromeda Treasury (PHAT) survey (Williams et al. 2014). In near and far ultraviolet (NUV and FUV), the GALEX instrument (Martin et al. 2005) has surveyed M31.
AstroSat has four instruments, covering NUV and FUV with the UltraViolet Imaging Telescope (UVIT), and soft through hard X-rays with the Soft X-ray Telescope (SXT), Large Area Proportional Counters (LAXPC) and Cadmium-Zinc-Telluride Imager (CZTI) instruments (Singh et al. 2014). We are carrying out a survey of M31 in NUV and FUV with UVIT.
UVIT observations have high spatial resolution (1 arcsec) and have capability of resolving individual stellar clusters and a large number of individual stars in M31. Previous observations of M31 with UVIT were presented in part by Leahy et al. (2020a), Leahy & Chen (2020) and Leahy, Bianchi & Postma (2017). Those papers presented an M31 UVIT point source catalog, matching M31 UVIT sources with Chandra sources, and analysis of UV bright stars in the bulge, respectively.
In this paper we describe new UVIT data processing which gives important improvements in astrometric accuracy and photometric accuracy for UVIT data. We compare the UVIT Field 2 data to observations in optical from the PHAT survey to study the properties of the stars northeast of the bulge of M31.
| \toplineField | RA(deg)1 | Dec(deg)1 | Filter2 | Exposure Time | Mean BJD3 |
|---|---|---|---|---|---|
| 1 | 10.71071 | 41.25023 | a, e, f | 7872, 7920, 4347 | 2457671 (+0.8010,+0.8010,+1.2626) |
| 2 | 11.03700 | 41.55735 | a, d, e, f | 7940, 16022, 7977, 7424 | 2457704 (+0.1355,+0.4858,+0.1354,+0.4857) |
| 7 | 11.22142 | 41.16111 | a, d, e, f | 4965, 10693, 10774, 3147 | 2458071 (+0.1875,+0.4520,+0.4520,+0.1874) |
| 13 | 11.59533 | 41.53595 | a, d, e, f | 4974, 10609, 10848, 5005 | 2458092 (+0.2157,+0.4981,+0.4327,+0.2157) |
1: RA and Dec are the J2000 coordinates of the nominal pointing center of the observation. \tablenotes2: Filter labels are a: F148W, b: F154W, c: F169M, d: F172M, e: N219M, f: N279N. \tablenotes3: Mean BJD is the mean solar-system Barycentric Julian Date of the observation. The common integer part for multiple observations is given as the first number.
2 Observations
UVIT consists of two 38 cm telescopes, each with field of view of 28 arcmin in diameter. The UVIT telescope and calibration are described in Tandon et al. (2017a, 2017b, 2020), Postma et al. (2011), Leahy et al. (2020b) and references therein. One telescope is for far ultraviolet (FUV) (130 to 180 nm) wavelengths and one for near ultraviolet (NUV) (200 to 300 nm) and visible (VIS) (320 to 550 nm) wavelengths. The FUV, NUV and VIS channels each have a number of filters with different bandpasses. The VIS channel is used for spacecraft pointing, so normally science observations are carried out simultaneously in FUV and NUV channels. The pixel scale for UVIT images is 0.4168 arcsec per pixel and point sources in the UVIT images have FWHM 1 arcsec in the FUV and NUV channels.
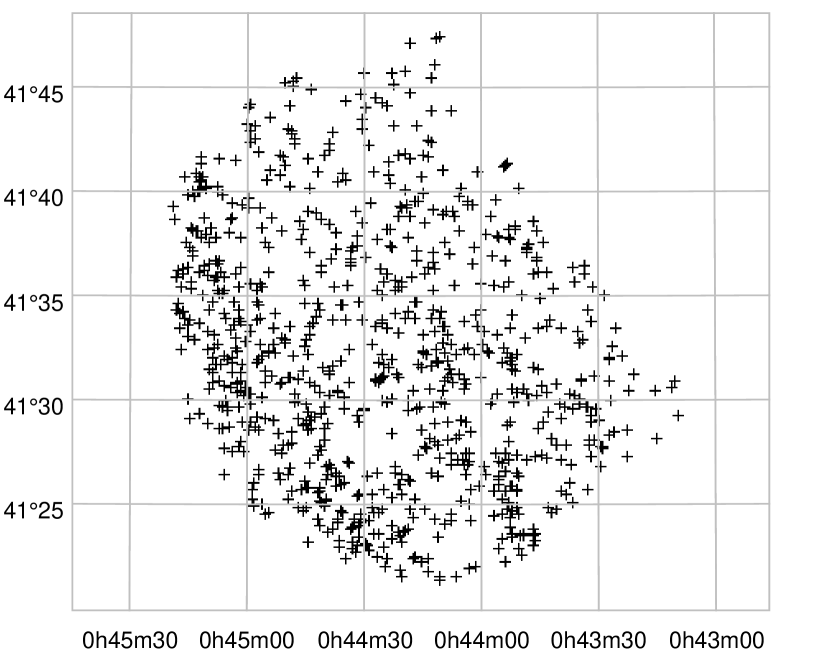
The survey of M31 with UVIT has been carried out since 2017. With UVIT’s 28 arcmin in diameter field of view, 19 different fields are required to cover the sky area of M31. Exposures in the following filters are being used : F148W (123 to 173 nm), F154W (135 to 173 nm), F169M (146 to 175 nm), F172M (165 to 178 nm), N219M (206 to 233 nm) and N279N (275 to 284 nm). The NUV channel failed in early 2018, so that science observations since then have been carried out in FUV only. Fortunately much of the UVIT survey which overlaps with the PHAT survey was observed prior to the NUV failure, so that most of the PHAT area is covered by both NUV and FUV UVIT observations. The sky positions of the 10 fields covering and adjacent to the area surveyed by HST as part of PHAT are shown in Fig. 1.
After the previous work (Leahy et al. 2020a) we developed new detector distortion corrections and new position calibration tools for processing UVIT images. Thus for the current work we are reprocessing the previous data on M31. For this study, we are comparing UVIT FUV and NUV data with NUV (the 275 nm band F275W filter) and optical data from the PHAT survey. The UVIT N279N filter covers nearly the same waveband as the HST F275W filter. Thus for the current analysis we restrict ourselves to the four UVIT Fields which overlap with PHAT (see Fig. 1) and also have N279N data: Fields 1, 2, 7 and 13. Table 1 here gives the basic properties these four Fields, including filters, exposure times and dates of observation.
3 Data Analysis
The UVIT detector distortion maps are utilized in the CCDLAB UVIT Pipeline (Postma & Leahy 2017). We have modified the pipeline to reduce astrometric errors as well as a reduce the PSF of point sources. Previously the distorion maps were utilized simply at the unit pixel scale of the CMOS given that this is the scale at which they were measured upon, in comparison to the 1/8th pixel scale of the final science centroid-based images. And so although the distortion maps do not have appreciably high-frequency spatial components, there are nonetheless finite differentials in distortion from any given CMOS pixel to the next. Thus, bilinear interpolation of the distortion map is now implented and is applied to each centroid at the 1/32 pixel scale.
Photometric calibration improvements have also been applied with updated filter-wise flat fields. Previously the flats were only at the detector level (Tandon et al. (2017a, 2017b), but ongoing in-orbit calibration has allowed for second-order corrections to these flat fields to be developed for each filter (Tandon et al. 2020).
Additionally, the previous WCS solutions were typically solved with approximately only ten sources across the field. With the development of the trigonometric WCS auto-solving algorithm (Postma & Leahy 2020) now implemented in CCDLAB, typically hundreds of sources spread across the field are now used for the plate solution. This provides for a more accurate average WCS solution across the field, with solution residuals commonly falling at 0.2 arcsec standard deviation.
| \toplineField | StDeva | No. Calibrators |
|---|---|---|
| 1b | 0.192 | 271 |
| 2b | 0.177 | 215 |
| 7b | 0.182 | 273 |
| 13b | 0.176 | 332 |
a. StDev is the standard deviation of positions with respect to Gaia positions in units of arcsec.
b. N279N is the filter image used for calibration with Gaia positions.
3.1 Point Source Analysis
This study aims to obtain UVIT photometry for stars already identified in the PHAT survey. Thus we searched for an excess above local background, in each UVIT reprocessed image, within 1′′ of the positions of the known PHAT sources. To avoid confusion of identifying a single UVIT source with either neighboring UVIT sources or with multiple PHAT sources, we only searched at the positions of PHAT sources which had F275W (275 nm band) magnitudes, and which were separated from eachother by more than 3.75′′111Tests showed that separations of 9 pixels (3.75′′) was enough to obtain good flux measurements for adjacent UVIT sources, and this same separation was more than enough to avoid confusion with nearby PHAT sources. We used the CCDLAB software (Postma & Leahy 2017) with a threshold of 3 sigma excess for a single pixel in the box and 8 sigma above local background for the total counts in the box. The centroids of the excesses were kept in a list of candidate point sources. Then we perform a PSF (point spread function) fit to a 9 pixel x 9 pixel box surrounding the position of the source to derive a more accurate position and total counts for each source.
The UVIT PSF has extended wings (Fig. 5 and Table 7 of Tandon et al. 2017b). Thus we made measurements of the correction from 9x9 box net counts to larger (17x17 pixels) box counts using fits to a set of bright isolated point sources in each field where we could use the larger box without interfering sources. An additional small correction was added to correct for the counts in a 17x17 pixel box to total counts in a circle of radius 27 pixels using the data in Tandon et al. (2017b). This way counts for sources separated by more than a few pixels were determined with reasonable accuracy. The counts and exposure times were used to convert to AB magnitudes using the updated calibration in Tandon et al. (2020).
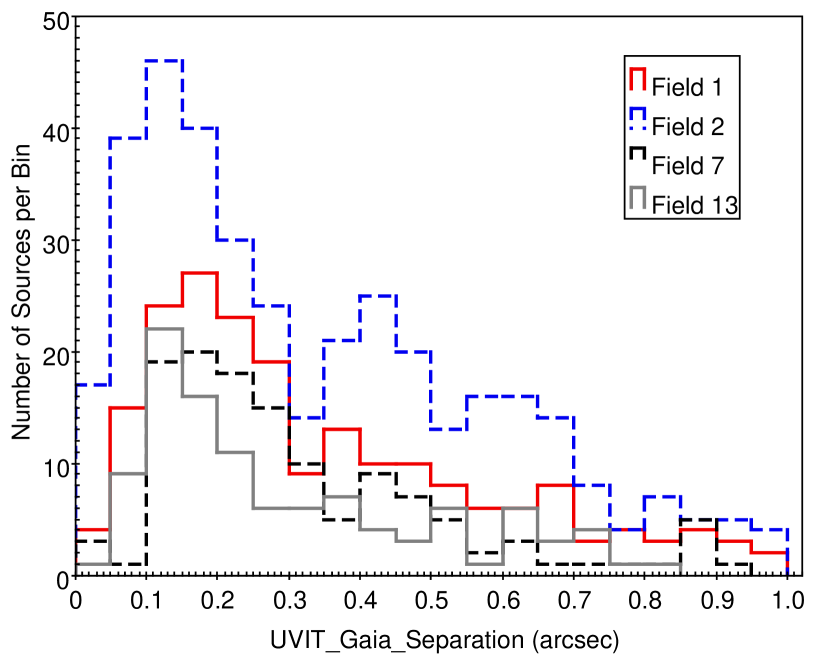
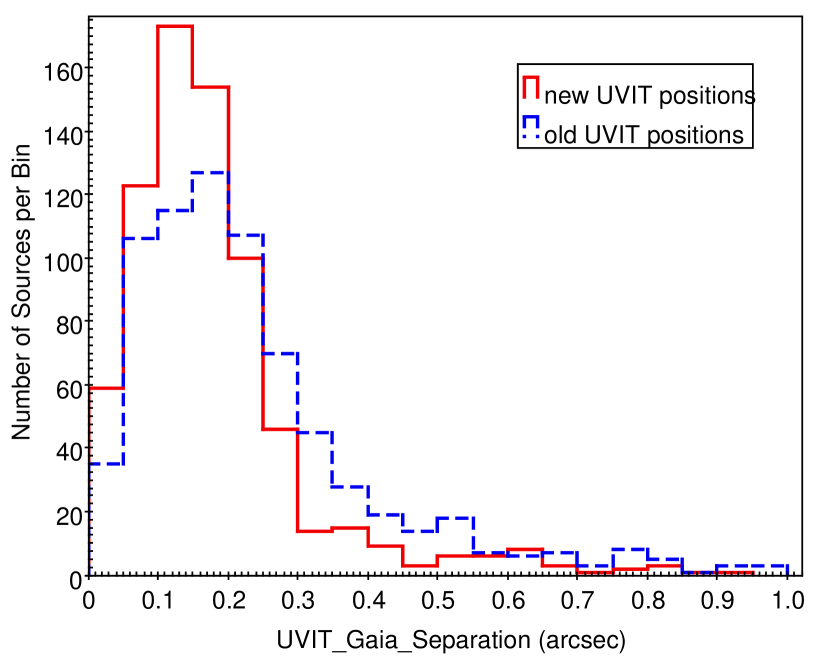
The position uncertainties for UVIT were determined as follows. The images were registered to optical position calibrators from Gaia as part of the reprocessing the images described in the previous section above. The standard deviation of the resulting Gaia-UVIT offsets ranged from 0.17 arcsec to 0.19 arcsec (see Table 2). Fig. 2 shows the distributions of all individual Gaia-UVIT offsets for fields 1, 2, 7 and 13 from the new data processing. Fig. 3 shows the distributions of the new-processing Gaia-UVIT offsets and the previous Gaia-UVIT offsets for the point sources combined from Fields 1, 2, 7 and 13. The new offsets are smaller than those from the previous (pre-2020) UVIT data processing procedure.
4 Results and Discussion
Our analysis above produced a catalog of UVIT AB magnitudes in the different observed UVIT filters (see Table 1) for PHAT sources with measured F275W magnitudes, and with separations between PHAT sources . For these individual stellar sources, we have the UVIT AB magnitudes for the different observed UVIT filters (Table 1) and PHAT Vega magnitudes from the PHAT source catalog (Williams et al. 2014). The UVIT bands range from F148W (150 nm) to N279N ( (280 nm), and the PHAT bands range from F275W (275 nm) to F160W (1600 nm). With this combined photometry, we can study the nature of individual stars in M31.
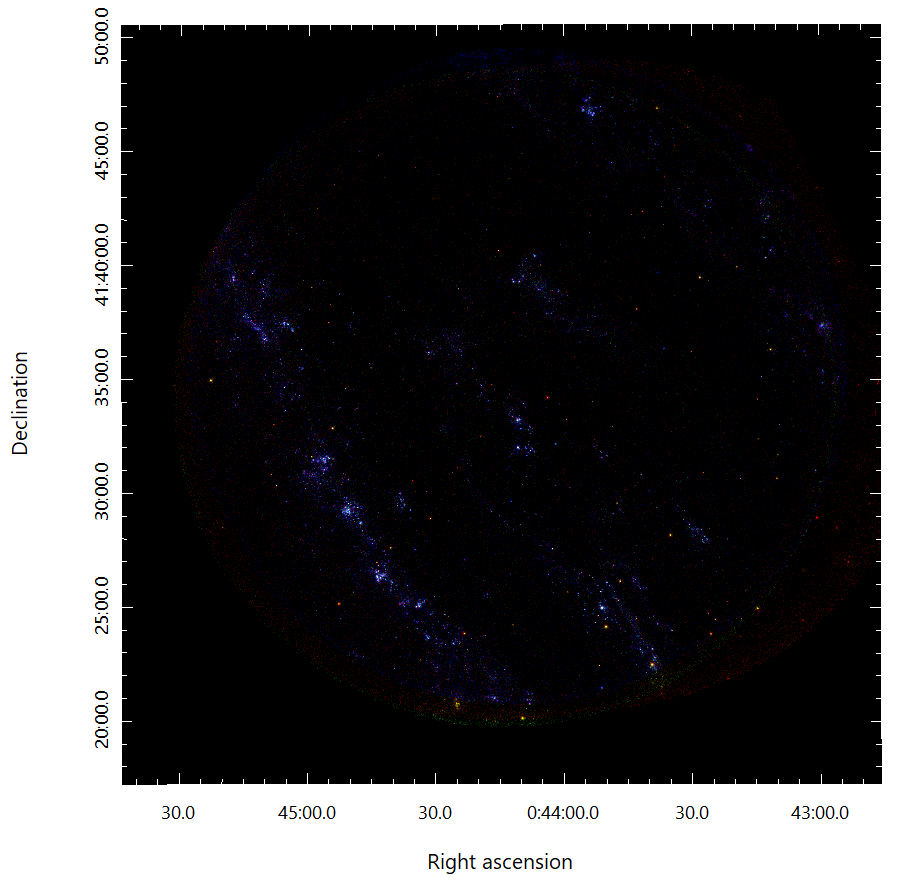
The UVIT Field 2 has the best overlap with PHAT, so we concentrate the current work on Field 2. A 3 color image was made using the 280 nm N279N (red), 220 nm N219M (green) and 150 nm F148W (blue) images, which were position registered as part of the data processing. Fig. 4 show the UVIT 3 color image of Field 2. The hot stars show up as blueish and the coolest stars as yellowish or reddish. There are color artifacts around the edge of the image because we used full field images from all three filters, but the pointing centers for the three images were slightly different. This means that the outer edges of the images can have data from only one or two of the three filters, which results in color errors, but not position distortion.
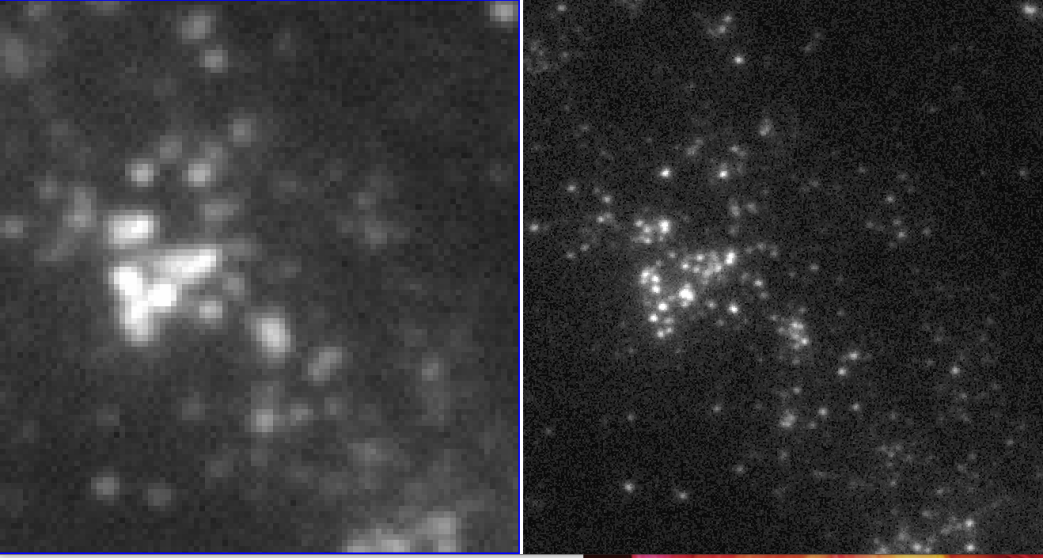
We compare the UVIT images, with 1 arcsecond resolution, to existing GALEX images of M31, which were taken with 5 arcsecond resolution. A concentration of hot stars is seen near RA 00:44:40, Dec. +41:26 in the Field 2 three-color image in Figure 4. In Figure 5 here we show an expanded view 1.5 arcmin by 1.5 arcmin across centered at 00:44:40.5 Dec.+41:26:37 (J2000). The left hand panel is the deepest image from the GALEX survey (from the Deep Imaging Survey, DIS), the right panel is the UVIT image in the F148W filter. The advantage of the higher resolution of UVIT is clearly seen, as several blobs of emission in the GALEX image are resolved into separate sources in the UVIT image. Here, the 3 brightest GALEX sources, just left of center in the GALEX image, are resolved into 19 separate sources in the UVIT F148W image.
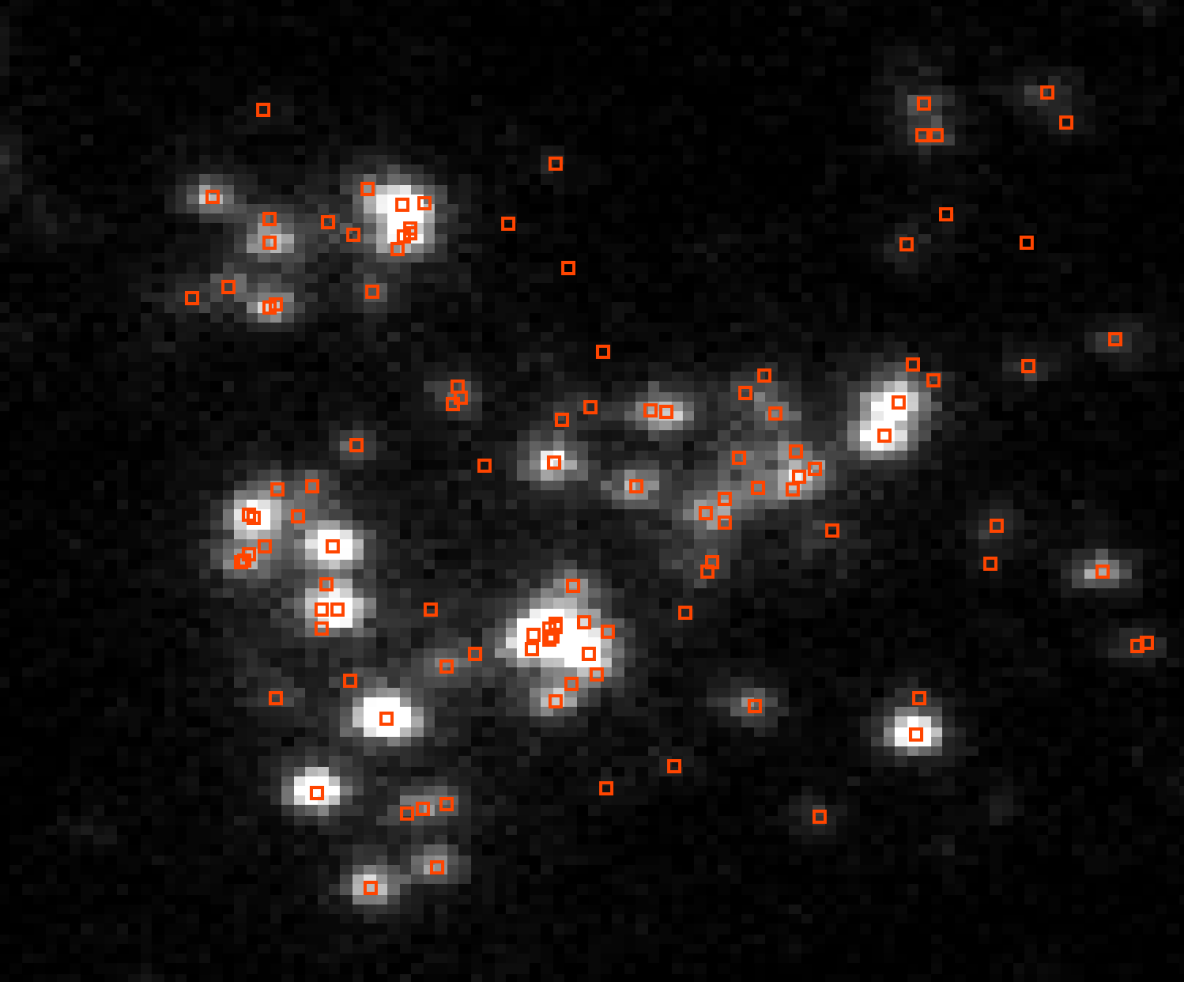
Fig. 6 shows an expanded UVIT F148W image, 30 arcsec by 30 arcsec, of the concentration of stars to left of center in Figure 5. UVIT is sensitive in N279N (same waveband as F275W) only to stars with N279N AB magnitudes brighter than 22. The conversion factor from AB to Vega magnitudes for the N279N filter is using the N279N filter response given in Tandon et al. (2017b). Thus this limit correspond to F275W Vega magnitudes brighter than 20.5. Overlaid on the UVIT image are the positions of all PHAT stars that have F275W Vega magnitude brighter than 20.5. It is seen that all UVIT F148W (150 nm) detections have a F275W counterpart, but not all F275W stars are detected in F148W. This is expected because only the hottest stars ( K) are strong emitters for wavelengths as short as 150 nm. In several locations multiple PHAT F275W stars overlap the UVIT F148W source. This occurs when there is source confusion in the UVIT image. However, there are a significant number of UVIT F148W sources that can be identified with unique PHAT F275W sources.
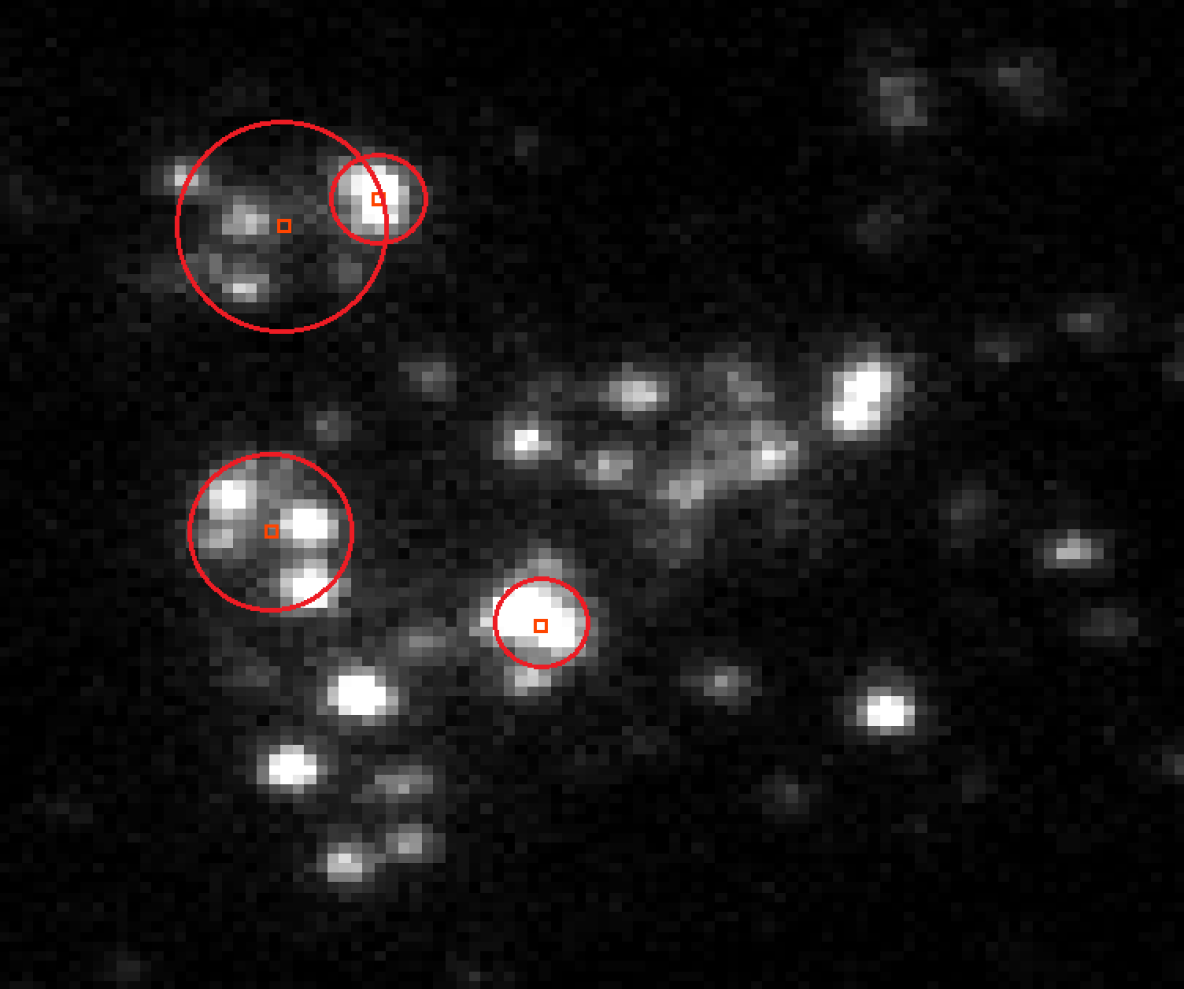
Figure 7 shows the same UVIT F148W image with the concentration of hot stars, but is now overlaid with the stellar clusters listed in Johnson et al. (2015). Four of those clusters are located in the region, with centers of the clusters marked by small red squares and with of each cluster marked by a red circle. Two of the clusters are compact (=2.66 and 2.63 arcseconds) and two are extended (=4.67 and 3.81 arcseconds). The compact clusters are not resolved by UVIT, and each compact cluster has several (10) PHAT F275W stars in it (see Fig. 6). The extended clusters are mostly resolved by UVIT, with more than half of the UVIT sources in each cluster corresponding with single PHAT F275W stars (see Fig. 6). Thus UVIT can resolve the larger clusters, 3 arcseconds, in M31 into individual stars, and thus allow fitting photometry of individual stars. Most hot stars outside clusters are less crowded, so also can be identified with unique UVIT and PHAT identifications.
For this work we consider the color-magnitude diagram (CMD) for UVIT sources which can be identified with individual PHAT stars. Model fitting of individual stars UVIT photometry combined with PHAT photometry will be done in future work. To study the CMD, we use our list of all isolated UVIT sources with unique F275W PHAT counterparts, that are not also associated with the known clusters in M31 from Johnson et al. (2015).
We found all UVIT sources with N279N detections which match with a PHAT F275W source within 1′′ in Field 2, then removed any UVIT sources which are within 9 pixels () of a second PHAT F275W source. Then we removed those sources with inconsistent N279N and F275W magnitudes, which indicates accidental matches.
| \toplineUVIT | x | y | RA | RAerr | DEC | DECerr | F148W | F148Werr |
|---|---|---|---|---|---|---|---|---|
| Field | (deg) | (deg) | (deg) | (deg) | (ABmag) | (ABmag) | ||
| 1 | 919.39 | 1418.74 | 10.72342 | 0.00006 | 41.27808 | 0.00014 | 23.25 | 0.19 |
| 1 | 2234.93 | 935.09 | 10.70634 | 0.00013 | 41.29259 | 0.00015 | 23.26 | 0.19 |
| 1 | 745.05 | 2340.21 | 10.70040 | 0.00009 | 41.29403 | 0.00011 | 99.99 | 99.99 |
| 1 | 2217.53 | 1583.89 | 10.71760 | 0.00008 | 41.29573 | 0.00012 | 23.01 | 0.17 |
| 1 | 919.23 | 3867.61 | 10.73030 | 0.00012 | 41.28674 | 0.00007 | 23.95 | 0.25 |
| 1 | 2435.96 | 1405.44 | 10.71301 | 0.00021 | 41.29761 | 0.00017 | 99.99 | 99.99 |
| 1 | 2130.13 | 2629.24 | 10.71587 | 0.00016 | 41.26595 | 0.00008 | 99.99 | 99.99 |
| 1 | 2511.07 | 275.40 | 10.69291 | 0.00007 | 41.29296 | 0.00003 | 22.75 | 0.16 |
| 1 | 653.60 | 3727.83 | 10.73082 | 0.00022 | 41.29087 | 0.00005 | 23.84 | 0.24 |
| 1 | 2547.25 | 1728.91 | 10.71788 | 0.00014 | 41.30073 | 0.00014 | 23.12 | 0.18 |
| F172M | F172Merr | F169M | F169Merr | N219M | N219Merr | N279N | N279Nerr | UVIT-PHAT |
| (ABmag) | (ABmag) | (ABmag) | (ABmag) | (ABmag) | (ABmag) | (ABmag) | (ABmag) | separation (′′) |
| 23.35 | 0.29 | 22.44 | 0.14 | 99.99 | 99.99 | 21.25 | 0.22 | 0.172 |
| 22.77 | 0.22 | 21.37 | 0.10 | 23.28 | 0.35 | 20.51 | 0.16 | 0.557 |
| 22.90 | 0.23 | 22.54 | 0.15 | 21.88 | 0.18 | 21.22 | 0.21 | 0.473 |
| 22.67 | 0.21 | 22.18 | 0.13 | 99.99 | 99.99 | 21.43 | 0.23 | 0.123 |
| 22.67 | 0.21 | 22.54 | 0.15 | 22.22 | 0.21 | 21.42 | 0.23 | 0.124 |
| 22.58 | 0.20 | 23.88 | 0.24 | 99.99 | 99.99 | 21.59 | 0.25 | 0.371 |
| 22.88 | 0.23 | 99.99 | 99.99 | 23.07 | 0.31 | 21.89 | 0.28 | 0.414 |
| 22.88 | 0.23 | 21.50 | 0.11 | 22.52 | 0.25 | 21.07 | 0.20 | 0.546 |
| 23.26 | 0.28 | 22.46 | 0.14 | 22.80 | 0.28 | 20.70 | 0.17 | 0.444 |
| 23.29 | 0.28 | 22.38 | 0.14 | 22.83 | 0.28 | 21.87 | 0.28 | 0.136 |
Notes:
a. The table is 18 columns by 712 rows. For display purposes here, the 18 columns are split into two sets of 9 columns.
b. Magnitude and error values of 99.99 indicate no flux detected in that filter, blank values means that position not observed in that filter.
c. The full table is available on-line in csv format as Table3_Full.csv at github.com under repository denisleahy/M31-UVIT-sources-at-PHAT-positions.
To have useful photometry for CMDs, we removed those sources from the list with large errors () on the UVIT N279N magnitudes by restricting the N279N AB magnitude to be brighter than 22, leaving 851 sources in Field 2222the errors increase rapidly for magnitudes fainter than 22. E.g. at magnitude 23, which is roughly the detection limit, typical errors are magnitudes.. The sky positions of these sources are shown in Figure 8. We have made a catalogue of the sources from all four fields which were matched to unique PHAT sources ( separation, N279N magnitude). The catalogue contains the UVIT photometry for all available bands and consists of 1705 UVIT sources. A sample of part of the catalogue is given in Table 3 here, and the full catalogue is available on line at https://github.com/denisleahy/M31-UVIT-sources-at-PHAT-positions.
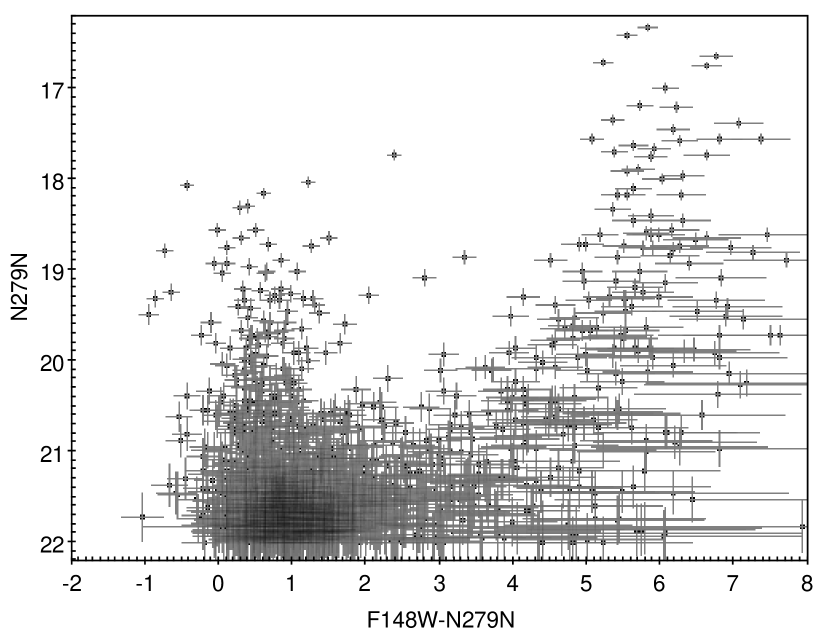
The UVIT CMD for these sources is shown in Figure 9, where the temperature indicator is F148WAB magnitude - N279NAB magnitude (hotter stars on the left), and the luminosity indicator is the N279NAB magnitude. The CMD shows two branches on the CMD: a near-vertical branch at F148W-N279N color 0-1 and and a sloped branch to the right from color F148W-N279N 2, N279N magnitude 22 to color F148W-N279N 6, N279N magnitude 18. The former likely corresponds to hot main-sequence stars; and the latter may correspond to cooler evolved giant stars.
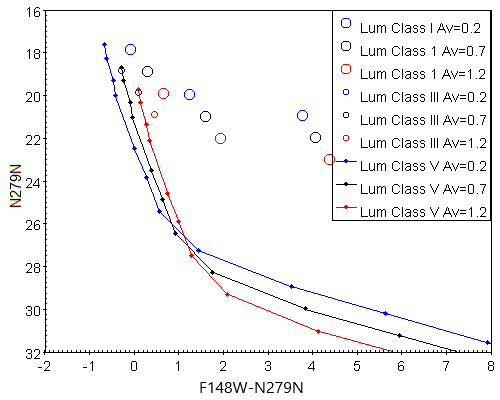
To verify this, a theoretical CMD was calculated for stars at the distance of M31, for main sequence stars of spectral type O3V through to G0V, giants BOIII through to M0III and supergiants B0I through to M0I. The radii, effective temperatures and log(g) values were taken from the recommended values for Castelli and Kurucz Atlas of Stellar Atmosphere Models at the Space Telescope Science Institute (https://www.stsci.edu/hst/instrumentation/reference-data-for-calibration-and-tools/astronomical-catalogs/castelli-and-kurucz-atlas). E.g. the O3V star has radius 15, =44800 K and log(g)=3.92, the G5III star has radius 10, =51500 K and log(g)=2.54, and the K5I star has 459, =3850 K and log(g)=0.00.
The theoretical CMD is shown in Figure 10 for 3 different values of extinction. =0.2 corresponds to the standard foreground extinction from the Milky Way in the direction of M31. We have included =0.7 and =1.2, corresponding to additional internal M31 extinction of 0.5 and 1.0. From Fig. 10, it is seen that normal upper main sequence stars (O3V to B5V) in M31 fall in the same region as the observed UVIT sources. B0I, A0I, F0I and B0III stars also fall in the same area as observed UVIT sources. None of the stars in the theoretical CMD fall in the region of the sloped branch on the right side of Fig. 9. However cooler main sequence stars (A0V through F5V) lie at the same color range (F148W-N279N color 2-8) but much fainter N279N magnitudes. However foreground stars, which are 100-1000 times closer, are brighter by 15 to 10 magnitudes, which places them in the same N279N magnitude range (16 to 21) as the observed UVIT sources. We conclude that most of the sources in the upper-right quadrant of the observed UVIT CMD diagram are foreground stars.
With position matching of the UVIT sources to PHAT sources, we make the PHAT CMD for these same sources. This is shown in Figure 11, where the temperature indicator is F275WVega magnitude - F336WVega magnitude, and the luminosity indicator is the F336WVega magnitude. The PHAT CMD shows two branches on the CMD: a near-vertical branch at color -0.5 and and a sloped branch to the right from color -0.5, F336W magnitude 21 to color 2, F336W magnitude 17.
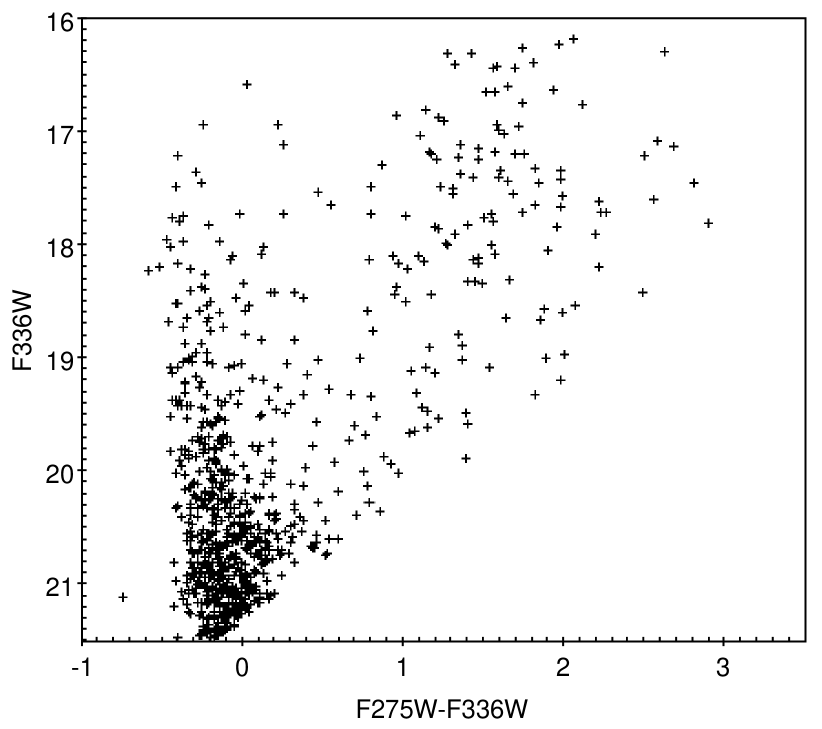
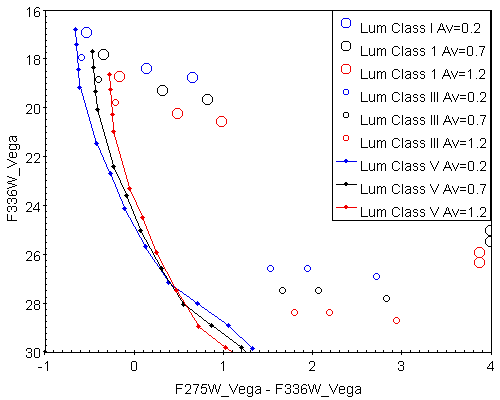
To examine the nature of these stars, the theoretical PHAT CMD was calculated for stars at the distance of M31, for the same parameters as for the theoretical UVIT CMD. The theoretical PHAT CMD is shown in Figure 12 for the 3 different values of extinction =0.2, 0.7 and 1.2. It is seen that normal upper main sequence stars (O3V to B5V) in M31 fall in the same region of the PHAT CMD as the near vertical branch of UVIT/PHAT sources. As for the UVIT CMD, none of the cool stars are luminous enough to fall in the cool branch of the observed PHAT CMD. However, foreground stars which are 100-1000 times closer (15 to10 magnitudes brighter) do fall in the same area as the cool branch of the observed PHAT CMD. Thus we find that the cool branch of both UVIT and PHAT CMDs is consistent with foreground stars, rather than stars in M31.
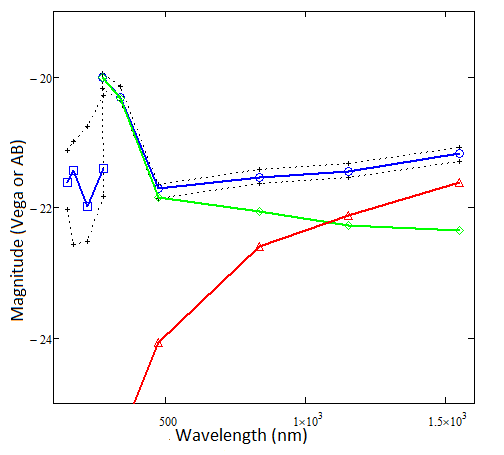
The UVIT FUV/NUV (4 filter bands) plus PHAT NUV-optical-IR (6 filter bands) photometry for a star from the main branch in the UVIT CMD is shown in Figure 13. The drop between PHAT F275W (275 nm) band and the UVIT N279N (280 nm) band is a result of specifying UVIT magnitudes in the AB system and PHAT magnitudes in the Vega system. As noted above, for the 275-280 nm band the difference in the 2 systems is 1.48 mag, with Vega magnitudes brighter. For Fig. 13 we plot the model spectrum for the UVIT bands in AB magnitudes and the model spectrum for the PHAT bands in the Vega system, so the model and data show the same offsets between UVIT and PHAT bands.
A single star does not fit the data. This is caused by crowding in the longer optical and IR bands (see Leahy et al. 2017 for similar model fits for stars in the bulge of M31), so is not surprising. The crowding is caused by two factors: the number of cool giant stars greatly exceeds that of hot main sequence stars, caused by the combination of initial mass function and stellar lifetimes; the PSF for PHAT is larger for longer wavelengths. A model consisting of a hot star plus a cool star fits the data well. The hot star is consistent with a massive young O-type star ( 20 ); the cool star is consistent with a G-type evolved supergiant.
5 Conclusion
The AstroSat Observatory has been carrying out a survey of M31 since 2017, which is nearly complete. The primary goal is to obtain near ultraviolet and far ultraviolet observations with the UVIT on AstroSat. Surveying M31 requirs 19 fields each of 28 arcminute diameter. All 19 fields were observed in the FUV F148W (150 nm) filter, and more than half of the fields observed in the NUV filters. Recently we have developed new calibration and data processing methods which improve the astrometry and photometry of UVIT data. With the new processing, the UVIT data has higher spatial resolution (1 arcsec) and better astrometry (0.2 arcsec).
This has allowed us to identify point sources detected by UVIT with sources at other wavelengths. In particular, UVIT sources have been identified with stars observed at high resolution with the Hubble Space Telescope as part of the Pan-chromatic Hubble Andromeda Treasury project (PHAT, Williams et al. 2014). We are able to use color magnitude diagrams, using UVIT FUV-NUV colors and using PHAT NUV-visible colors to detect hot main sequence stars and to separate out likely foreground stars. Future work will focus on carrying out UVIT photometry for the case of crowded UVIT sources, including multiple PHAT stars near to eachother and star clusters, and on modelling the multi-band UVIT-PHAT FUV through optical photometry of different sets of stars in M31 to obtain good constraints on their properties.
Acknowledgements
This project is undertaken with the financial support of the Canadian Space Agency and of the Natural Sciences and Engineering Research Council of Canada. This publication uses the data from the AstroSat mission of the Indian Space Research Organisation (ISRO), archived at the Indian Space Science Data Centre (ISSDC). This publication uses UVIT data processed by the payload operations centre at IIA. The UVIT is built in collaboration between IIA, IUCAA, TIFR, ISRO and CSA.