X-ray reprocessing in accreting pulsar GX 301-2 observed with Insight-HXMT
Abstract
We investigate the absorption and emission features in observations of GX 301-2 detected with Insight-HXMT/LE in 2017-2019. At different orbital phases, we found prominent Fe K, K and Ni K lines, as well as Compton shoulders and Fe K-shell absorption edges. These features are due to the X-ray reprocessing caused by the interaction between the radiation from the source and surrounding accretion material. According to the ratio of iron lines (K and K), we infer the accretion material is in a low ionisation state. We find an orbital-dependent local absorption column density, which has a large value and strong variability around the periastron. We explain its variability as a result of inhomogeneities of the accretion environment and/or instabilities of accretion processes. In addition, the variable local column density is correlated with the equivalent width of the iron K lines throughout the orbit, which suggests that the accretion material near the neutron star is spherically distributed.
keywords:
stars: neutron – X-rays: binaries – X-rays: individual: GX 301-21 Introduction
In high mass X-ray binaries (HMXBs), the main component of the mass outflow emitted by the donor star and responsible for the X-ray emission in the vicinity of the accreting compact object can be a spherically symmetric wind, a circumstellar disk, or a gas stream. The radiation, as seen from Earth, is absorbed both in the interstellar medium (ISM) and within the binary system. The latter is attributed to the accretion material that surrounds the compact star which is often inhomogeneous and highly clumpy as reflected by highly variable absorption. Absorption and re-emission of X-rays are affected by the distribution of material and one of the key diagnostic tools to probe the environment in binary systems (e.g., Aftab et al., 2019). Fluorescence lines, especially of iron atoms, are prominent features of the X-ray reprocessing in HMXBs (see, e.g., Torrejón et al., 2010; Tzanavaris & Yaqoob, 2018). They are produced by the absorption of high energy photons that remove K-shell electrons and lead to electronic transitions (LK: Fe and MK: Fe ) (Kallman et al., 2004). In addition, when the compact star is embedded in a dense wind, the Compton scattering is non-negligible, which scatters a fraction of emissions out of the line-of-sight (LOS) and reduces the observed flux. On the other hand, the down-scattering of fluorescence lines may lead to the appearance of a ’Compton shoulder’ (CS) due to electron recoils (Matt, 2002; Watanabe et al., 2003).
GX 301-2 is an HMXB consisting of a highly magnetized ( G, or even larger Doroshenko et al. 2010) pulsar and a B-type hyper-giant star Wray 977 (Vidal, 1973; Kaper et al., 1995; Staubert et al., 2019). According to modelling of high-resolution optical spectra, Wray 977 has a mass of 4310 , a radius of 62 and looses mass through powerfull stellar winds at a rate of with terminal velocity of 300 (Kaper et al., 2006). The system is highly eccentric ( 0.46), with an orbital period of d, and exhibits strong variation of the X-ray flux with orbital phase (Koh et al., 1997; Doroshenko et al., 2010). In particular, periodic outbursts at the orbital phase 1.4 days before the periastron passage (Sato et al., 1986), and a fainter one near the apastron passage are observed (Pravdo et al., 1995). The broad-band X-ray spectrum is orbital phase-dependent and can be approximately described as a power-law with a high energy cutoff and a cyclotron resonant scattering feature (CRSF) around 40 keV (Kreykenbohm et al., 2004; Mukherjee & Paul, 2004; La Barbera et al., 2005; Doroshenko et al., 2010; Suchy et al., 2012; Islam & Paul, 2014; Fürst et al., 2018; Nabizadeh et al., 2019). During the periastron flares the source exhibits strong variability with an amplitude of up to a factor of 25, reaching a few hundreds mCrab in the energy band of 2-10 keV (e.g., Rothschild & Soong, 1987; Pravdo et al., 1995). The flares are accompanied by the variability of the equivalent hydrogen column density () and of the fluorescent iron lines, which is believed to be associated with clumpiness of the stellar wind, launched from the donor star (Mukherjee & Paul, 2004). We note the clumpiness in this paper refers to any inhomogeneities in the stellar wind/stream, which are higher density regions, regardless of its specific formation mechanisms. On the other hand, Fürst et al. (2011) reported a long XMM-Newton observation in GX 301-2 around its periastron, which also exhibits systematic variations of the flux and at a time-scale of a few kilo-seconds. Several wind accretion models, consisting of stellar winds and a gas stream, were proposed to explain the observed flares (e.g., Haberl, 1991; Leahy, 1991; Leahy & Kostka, 2008; Mönkkönen et al., 2020).
As already mentioned, reprocessing of X-ray emission can be used to probe the environment surrounding the neutron star. We note that, however, a comprehensive and detailed study of the X-ray reprocessing over the entire orbit is still missing. Thanks to the high cadence observations of Insight-Hard X-ray Modulation Telescope (HXMT) (Zhang et al., 2019) in 2017-2019, we are able to study the X-ray reprocessing at different orbital phases, and compare it with the result of the flaring episode. This work aims at improving our understanding on the accretion environment of GX 301-2 by studying X-ray processing. This paper is organised as follows: In Section 2, we describe observations and procedures adopted for data reduction; the spectral analysis and results are represented in Section 3; we summarise our conclusions in Section 4 and 5.
2 Data reduction
Insight-HXMT is the first Chinese X-ray satellite, which consists of three telescopes, i.e., the low, medium and high energy telescopes (Zhang et al., 2014, 2019). In this work, we only used the low energy telescope (LE), which is made up of swept charge devices (SCDs) and cover the energy range of 1-10 keV. The broad-band spectral analysis will be published elsewhere, and here we only focus on the narrow emission and absorption features (i.e., iron line complex) observed in the soft X-ray band, and associated them with reprocessing of X-ray emission by winds. LE has an energy resolution of 140 eV at 5.9 keV, and an effective area of 384 (Chen et al., 2019). Thanks to its fast-readout, LE does not suffer from photon saturation and pile-up effects, and is therefore capable of observing strong sources, like the flaring state of GX 301-2. Insight-HXMT performed 67 pointing observations between 2017-2019, with an averaged exposure of 2000 s. However, in some cases, the observations were dominated by the background, especially when the source was faint, which precludes detailed spectral analysis. In particular, we only select the observations in which the source contributes to more than 25% of the count rate between 1-10 keV, and the exposure is larger than 1000 s for the analysis. Here the background was estimated by using lebkgmap, a python code that has been included in HXMTDAS-2.02.1. As a result, 23 observations have been selected in our sample, and their summary is shown in Table 1. We performed the data reduction of Insight-HXMT, following the official user guide 111see http://enghxmt.ihep.ac.cn/SoftDoc/169.jhtml: the criteria for data screening is that the elevation angle > 10 degree; the geomagnetic cutoff rigidity > 8 GeV; the pointing offset angle < 0.1 degree; at least 300 s away from the South Atlantic Anomaly (SAA). During the spectral analysis, we used xspec v12.10, an X-ray spectral fitting package in heasoft v6.26 (Arnaud, 1996). We assumed solar abundances (Wilms et al., 2000), as suggested by previous observations (Torrejón et al., 2010). In this paper, we identified the existence of a component only if its detection is at a confidence level of > 3 . The significance was estimated by Monte-Carlo simulations performed by using simftest, a built-in script in xspec. A systematic error of the LE calibration (CALDB 2.02.01), regarding the Energy-to-Channel (E-C) relation, has been found recently 222private communication with Dr. Xiaobo Li, which will lead to an overestimation of the line energy by a few tens of eV. Such a deviation is expected to be stable overall observations. Therefore an offset of the E-C relation has been taken into account in our analysis (see below). All uncertainties in this paper correspond to a 68 % confidence level.
3 Results
We focused on the energy band of 5.5-8.5 keV, where the emission and absorption features are expected from past observations of the source with Chandra/HEG (Watanabe et al., 2003; Torrejón et al., 2010; Tzanavaris & Yaqoob, 2018). In this narrow energy band, the continuum can be described with a power-law spectral model. The model () we used is:
| (1) | ||||
where
| (2) |
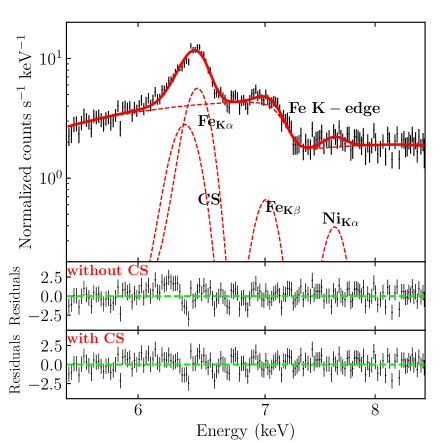
, and and represent photoelectric absorption caused by the Galactic and local interstellar medium respectively. In practice, we adopt the tbnew 333https://pulsar.sternwarte.uni-erlangen.de/wilms/research/tbabs/ model to describe them. The was fixed at (HI4PI Collaboration et al., 2016). The cabs444https://heasarc.gsfc.nasa.gov/xanadu/xspec/manual/node234.html model was used to account for the Compton scattering that decreases the flux along the line of sight. We note that our data can be also well described without inclusion of the cabs component which is coupled with the normalization of the powerlaw component and does not affect any of our conclusions. We also included several Gaussian lines to model fluorescent lines, and the line widths were fixed at 1 eV 555 We confirmed that LE is not able to constrain the line widths and only upper limits can be obtained if setting up them free. , as suggested by Chandra/HEG. Only most prominent fluorescent lines, i.e., Fe K, Fe K and Ni K, were considered because of statistics. In addition, we found that sometimes the Fe K line deviates from the symmetric Gaussian line profile (see residuals in Figure 1), which is likely due to the presence of a Compton shoulder. To account for this feature we included also a box-shaped function covering the energy range 6.24-6.40 keV (for details, see Matt, 2002). We considered the presence of CSs only if the box function could improve the goodness-of-fit at a significance level of > 3 estimated by simftest. The model in Eq. 1 can well describe all spectra in our sample with an averaged reduced- of 0.9 (269 dof), and we show a representative example in Figure 1. As studied by Torrejón et al. (2010), recombination lines (Fe xxv and Fe xxvi) were also detected in some high mass X-ray binaries. However, in our sample we did not find signals of Fe xxv and Fe xxvi, which is consistent with the previous conclusion that recombination lines are not present in supergiant X-ray binaries (Giménez-García et al., 2015).
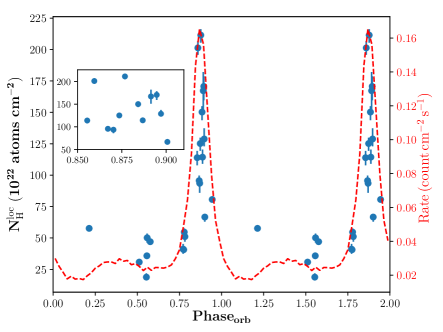
It has been known that the in GX 301-2 exhibits short-term and long-term variability (Mukherjee & Paul, 2004; Fürst et al., 2011). The former is thought to be caused by the clumpiness of the accretion material, while the latter is attributed to the evolution of the accretion environment of stellar winds or the gas stream, as a function of the orbital phase. Insight-HXMT covered a substantial fraction of the orbit, which allows us investigating the variability at different timescales. The results are presented in Figure 2 and Table 2. As it is evident from the figure, is largest and exhibits strongest variability around the orbital phase 0.9, when the flux is enhanced as well although it is important to emphasise that the local absorption column remains variable throughout the orbit. In addition, observational IDs having a same prefix (such as P0101309001*) are parts of a long pointed observation separated by short gaps, which allows us studying the variation at a short time-scale of a few kilo-seconds. To conclude, the observed is significantly variable at this short time-scale, which indicates that the fluctuation in Figure 2 is mainly caused by short-term effects. This result is well consistent with the long exposure XMM-Newton observation (Fürst et al., 2011).
The centroid energy of the Fe K line ( 6.43 keV) appears to be consistent for all observations and corresponds to the ionization degree of more than Fe xviii (Kallman et al., 2004). However, we note that the ionization state might be overestimated considering the optical depth of the absorber, and is inconsistent with previous reports (e.g., Watanabe et al., 2003; Fürst et al., 2011). On the other hand, if materials are ionized beyond Fe xviii, the resulting photoionization threshold should be much higher (Fig. 4c in Kallman et al., 2004), which is inconsistent with the fact that the data can be modelled with an absorption edge when assuming neutral ions (see below). We note that this discrepancy is likely caused by the systematic uncertainty of the E-C relation as mentioned above. Therefore, in practice, we fitted the spectrum of the first observation (ObsID:P010130900101), by freezing Fe K line at 6.4 keV and setting up the gain offset666For details, see https://heasarc.gsfc.nasa.gov/xanadu/xspec/manual/node99.html. free. The resulting offset was 35 eV, which hereafter was considered for other spectra.
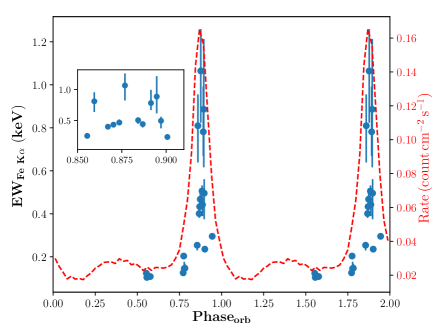
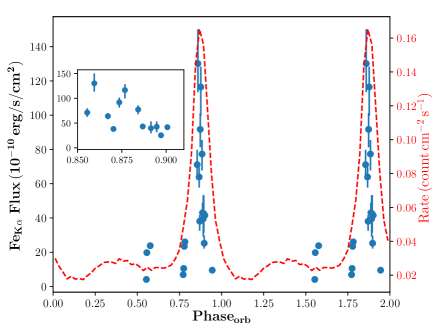
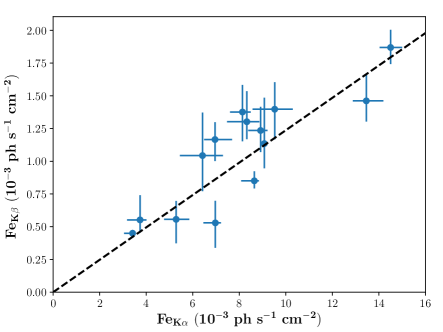
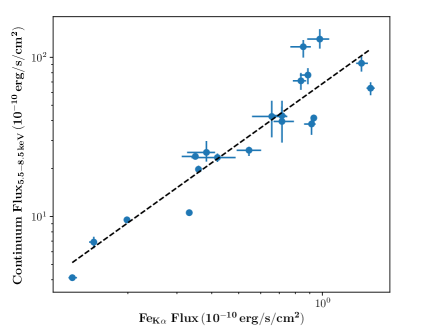
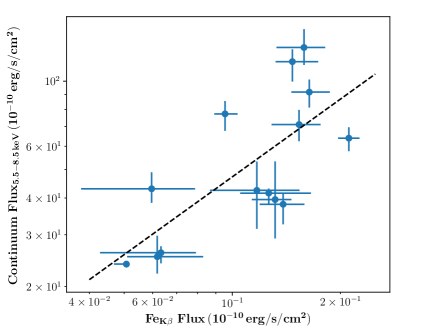
The fitting results have been summarized and tabulated in Table 2. Similar to the , the Fe lines are also highly variable and related to the orbital phase (Figure 2). Both the equivalent width (EW) and the flux of Fe K lines present large values and strong variability around the periastron. We show the linear relation between intensities of Fe K and K lines in Figure 3. A linear fitting leads to a linear coefficient of 0.120.01. We note that, in theory, this coefficient is described as a function of the iron ionization state (see Fig. 2 in Palmeri et al., 2003). Therefore, this result suggests a low ionization state (electron occupancy 22) and is consistent with our assumption mentioned above. In Figure 4 we represent the unabsorbed flux of the continuum in the energy range of 5.5-8.5 keV against the flux of Fe K/K lines. Clearly both of them are positively correlated, which is consistent with the relation among other sources (see Fig. 6 in Giménez-García et al., 2015).
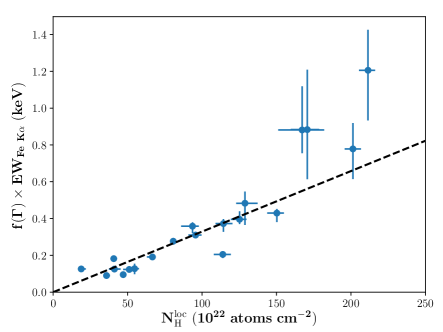
Assuming that Fe K lines are emitted from a spherical shell of gas surrounding the source, the equivalent width is expected to be related to the local hydrogen column density as , if considering a power-law continuum spectrum with a photon index () of 2 (Kallman et al., 2004; Inoue, 1985). Therefore, we compared our observations with the theoretical prediction shown in the upper panel of Figure 5. Since the photon index does not strictly equal to 2 in real observations, we included a correction factor f(), i.e., a normalization factor with respect to the case of =2 (Endo et al., 2002), where
| (3) |
Here is the photoionization threshold energy, and is the K shell photoionization cross-section. In spite of some scattering points, the EW significantly increases with the increasing of , which is generally in agreement with the theoretical estimation. The slight departure from the expected linear relationship, e.g., for the points with large values, might be a hint of the aspherical accretion, such as the formation of the accretion disk suggested by Mönkkönen et al. (2020).
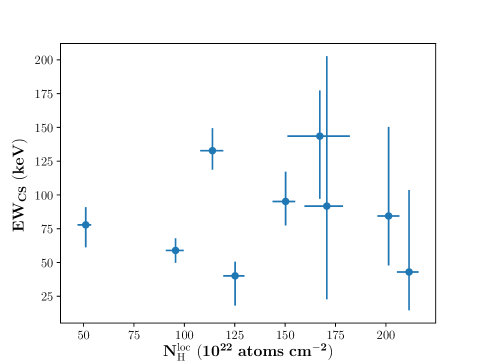
In nine out of 23 observations the Compton shoulder (CS) appears to be statistically significant. We show the relation between the EW of this component and the corresponding in the bottom panel of Figure 5. No apparent correlation can be identified due to the large scatter of individual data points. Considering the strong dependency between CSs and strong Fe K lines, we caution that such a scattering might be due to the imperfect description of observed features with simplified spectral models. Further observations with a better energy resolution are strongly encouraged in the future.
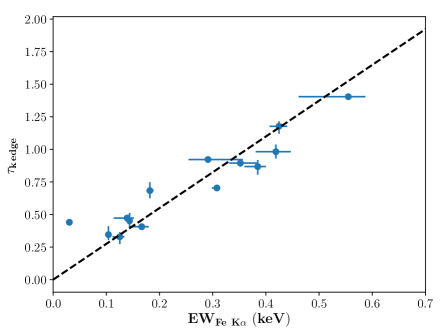
As shown in Figure 1, a flux decrease is visible around 7 keV, which is attributed to the K-shell photoionization. It is useful to determine the relation between and the absorption optical depth. We performed an additional spectral analysis using the same model mentioned above but setting up the iron abundance of "abs2" at 0. In addition, we included a phenomenological model, i.e., "edge"777https://heasarc.gsfc.nasa.gov/xanadu/xspec/manual/node236.html in xspec, to describe the absorption structure. There are two parameters in the "edge" model, the threshold energy () and the absorption optical depth (). To avoid the coupling with Fe K lines that are around 7.1 keV, we fixed at 7.11 keV 888http://skuld.bmsc.washington.edu/scatter/AS_periodic.html, i.e., the predicted value for neutral irons. We show the relation and a linear fitting, i.e., , in Figure 6. This relation suggests that the reprocessing material reaches an optical depth unit for EW 400 eV.
4 Discussion
As illustrated in Fig. 2, a strong variability of the local absorption column at all orbital phases is revealed by Insight-HXMT observations. In general, the shows a considerable increase close to the periastron (=0.9) of the binary system, which is consistent with previous reports (e.g., Haberl, 1991; Mukherjee & Paul, 2004). Several models have been proposed to explain the observed dependence of both the absorbtion and flux on the orbital phase (Stevens, 1988; Haberl, 1991; Leahy, 1991; Leahy & Kostka, 2008; Mönkkönen et al., 2020). It is generally believed that the pulsar accretes matters both via a spherically symmetric wind (Castor et al., 1975) and focused accretion stream with a higher density. The latter is believed to be due to the enhanced mass loss on the surface of the supergiant star towards the neutron star, resulting in an Archimedes spiral-like structure because of the conservation of angular momentum (Leahy & Kostka, 2008). We note that, although such a hybrid model can successfully reproduce the flux modulation of this source, the expected maximum of is at the orbital phase =0.2, which is inconsistent both with the RXTE results and our observations (Fig. 6 in Leahy & Kostka, 2008). On the other hand, the presence of the accretion stream itself with a shape similar to that deduced by Leahy & Kostka (2008) has been directly confirmed through near infrared interferometry (see i.e. Fig. 13 in Waisberg et al., 2017), which might suggest that the observed absorption is not strongly affected by global distribution of matter within the binary system and is mostly local. This conclusion is also supported by the fact that the local absorption column observed by Insight-HXMT is strongly variable on short timescales at all orbital phases, which is also consistent with reports from the literature (Mukherjee & Paul, 2004; Fürst et al., 2011).
In general, two possible interpretations have been discussed in the literature to account for the observed variability of in high mass X-ray binaries: wind clumps due to the line-deshadowing instability (e.g., MacGregor et al., 1979; Owocki & Rybicki, 1984; Owocki et al., 1988), and accretion instabilities in vicinity of a compact object. For instance, for GX 3012 the former scenario was considered by Mukherjee & Paul (2004). On the other hand, recently El Mellah et al. (2020) suggested that the clumpiness of the stellar wind is likely not sufficient to explain such a large variation.
Alternatively, if the is mainly contributed by the material close to the neutron star (see below), the variability could originate from some instabilities in accretion processes appearing in hydrodynamic simulations (Blondin et al., 1991; Manousakis et al., 2014; El Mellah et al., 2020). The dynamical time-scale of the accretion is 6 ks, which is well consistent with the observed timescales of both the flux and variability (Fürst et al., 2011). is the accretion radius, i.e., the impact parameter of streamlines gravitationally beamed by the neutron star. Here is the gravitational constant, is the mass of the neutron star, and is the velocity of the flow before it is altered by the neutron star (Edgar, 2004). The is a function of the terminal velocity () of the stellar wind and the velocity of the orbital movement. In GX 301-2, the is 400 km/s around the periastron (Doroshenko et al., 2010).
We note that the absorbing material is also expected to be responsible for reprocessing of X-ray emission, and in particular contribute to the formation of fluorescent iron lines. Thanks to the good energy resolution of Insight-HXMT/LE and its high cadence observational strategy, we are able to study the correlation of the with and the equivalent width of iron lines (), at different orbital phases. We find that their correlation is well consistent with the theoretical prediction, if assuming that the iron line originates from X-ray reprocessing of hard X-rays with the accretion material surrounding the neutron star in approximately spherically symmetric geometry. This strongly suggests that same material is responsible both for absorption and X-ray reprocessing, which is consistent with results in supergiant X-ray binaries as reported by Giménez-García et al. (2015). The origin of the iron line (i.e., whether it forms close to the neutron star or on larger scales), however, is also still uncertain, and we discuss two possibilities here.
Based on the observed line width, Endo et al. (2002) proposed that it might be close to the Alfvén radius of the neutron star ( m). In this case, the approximate spherical configuration (resembling an "atmosphere") of accretion matter is expected (Davies et al., 1979; Davies & Pringle, 1981), which is consistent with the observed - relation revealed by our observations as described above. On the other hand, Zheng et al. (2020) deduced somewhat longer distance (1.20.6 m) to the iron line emitting region, based on the cross-correlation between light-curves of the iron line and the continuum. If true, the variability might be caused by the large structure of the accretion stream. However, there might be a problem that how to keep a spherical symmetry of matter at such a large scale.
We note that, in either case, according to the - relation, the variability of the cannot be caused by a dense clump moving through the line of sight far away from the neutron star. We note also that observed variations of the local absorption column are largely driven by short-term variations, and correlation of the iron line equivalent width and local absorption column also holds in this case as revealed both by Insight-HXMT and XMM-Newton observations during a flaring episode (Fig. 12 in Fürst et al., 2011). This indicates that both the absorbing and re-processing material are located close to the neutron star and global spatial distribution of the accreting material does not play an important role in iron line and local absorption column properties, regardless on whether accretion proceeds from wind or accretion stream (e.g., Leahy & Kostka, 2008; Mönkkönen et al., 2020). Enhancement of the local absorption column close to the periastron passage coincident with the increase of X-ray flux could in this case be explained by increased local wind density around the neutron star.
It is interesting to note also that for spherically symmetric distribution of reprocessing material, a significantly reduced pulse fraction is predicted in the energy range around the Fe K line complex. Indeed, in this case the X-ray reprocessing only produces non-pulsed radiation thereby reducing the total pulsed fraction. This inference is generally consistent with observations (e.g., Fig. 5 in Nabizadeh et al., 2019). We note that a large size (700-ls) of the line forming region suggested by Suchy et al. (2012) is therefore not required. On the other hand, Liu et al. (2018) reported pulsed iron line in a time interval of 7 ks near the periastron, which disappeared afterwards. They explained that the intermittent pulsed iron line is associated with the anisotropic accretion, e.g., when going into or leaving the accretion stream. We note, however, that also in this case the asymmetry of reprocessing material may be local to the neutron star, i.e., be associated with an accretion wake or other features associated with interaction of the pulsar and the wind.
5 Summary
We studied the emission and absorption features of accreting X-ray pulsar GX 301-2 observed with Insight-HXMT in 2017-2019. We found prominent fluorescent lines of Fe K, Fe K and Ni K, and the K-shell absorption of irons, in observations at its different orbital phases. Our results show the capacity of Insight-HXMT in the context of iron complex studies on several timescales associated with good energy resolution and the fast read-out that prevents pile-up effects. We find that the Fe lines are orbital-dependent and their fluxes are correlated with those of the continuum. We report on the first extensive study of the intensity ratio between Fe K and K lines in GX 301-2. In particular, we find a linear coefficient is 0.12 0.01 between them, which is in a good agreement with the theoretical prediction of irons with a low ionization state (Palmeri et al., 2003).
We find that in GX 301-2 the optical depth of the K-shell absorption of irons is correlated to with a linear coefficient of 2.50.4. This coefficient is smaller than the result of Chandra, which is 0.5 (Torrejón et al., 2010). We note that the discrepancy might be caused by the influence of Fe K lines that cannot be resolved by Insight-HXMT.
Compton shoulder previously reported based on the Chandra data (Watanabe et al., 2003; Torrejón et al., 2010; Tzanavaris & Yaqoob, 2018) is significantly detected in several observations but find no clear relation with . We caution that, however, the energy resolution of Insight-HXMT/LE is not sufficient to fully resolve shape of the iron line complex and observations with grating or micro-calorimeter instruments are required to verify our conclusion.
We find also strong variations of the observed absorption column both on short and long timescales. In particular, the absorption is significantly enhanced around the periastron passage which is consistent with earlier studies (e.g., Mukherjee & Paul, 2004; La Barbera et al., 2005; Islam & Paul, 2014). For the first time, we studied also the relation between and measured at different orbital phases in GX 301-2. We find that it is in line with a theoretical estimation assuming that the accretion material is distributed spherically, regardless of specific accretion types, i.e., via stellar winds or a gas stream (Leahy & Kostka, 2008; Mönkkönen et al., 2020). We argue that together with rapid variations of both the and iron line amplitude, this suggests that same material located close to the neutron star is likely responsible for both the absorption and X-ray reprocessing. We suggest, therefore, that rapid variability of the observed is likely associated with inhomogenities and/or instabilities of the accretion flow around the neutron star. This conclusion is important in context of modelling of the observed orbital variation of X-ray flux and absorption column which shall thus be mostly considered as a tracer of local density around the pulsar rather than integral density of material along the line of sight.
Acknowledgements
This work made use of the data from the Insight-HXMT mission, a project funded by China National Space Administration (CNSA) and the Chinese Academy of Sciences (CAS). The Insight-HXMT team gratefully acknowledges the support from the National Program on Key Research and Development Project (Grant No. 2016YFA0400800) from the Minister of Science and Technology of China (MOST) and the Strategic Priority Research Program of the Chinese Academy of Sciences (Grant No. XDB23040400). The authors thank supports from the National Natural Science Foundation of China under Grants No. 11503027, 11673023, 11733009, U1838201, U1838202, U1938103 and U2038101. JL, SV and NA thank the German Academic Exchange Service (DAAD, project57405000) for travel grants. VS, ST and VD acknowledge the support from the Russian Science Foundation grant 19-12-00423. VS thanks the Deutsche Forschungsgemeinschaft (DFG) grant WE 1312/51-1. MO acknowledges support from the Italian Space Agency under grant ASI-INAF 2017-14-H.0.
6 Data Availability
The data that support the findings of this study are available from Insight-HMXT’s data archive999http://enghxmt.ihep.ac.cn/ and the Swift/BAT transient monitor101010https://swift.gsfc.nasa.gov/results/transients/.
References
- Aftab et al. (2019) Aftab N., Paul B., Kretschmar P., 2019, ApJS, 243, 29
- Arnaud (1996) Arnaud K. A., 1996, in Jacoby G. H., Barnes J., eds, , Astronomical Data Analysis Software and Systems V. Astronomical Society of the Pacific Conference Series, Vol. 101, p. 17
- Blondin et al. (1991) Blondin J. M., Stevens I. R., Kallman T. R., 1991, ApJ, 371, 684
- Castor et al. (1975) Castor J. I., Abbott D. C., Klein R. I., 1975, ApJ, 195, 157
- Chen et al. (2019) Chen Y., et al., 2019, arXiv e-prints, p. arXiv:1910.08319
- Davies & Pringle (1981) Davies R. E., Pringle J. E., 1981, MNRAS, 196, 209
- Davies et al. (1979) Davies R. E., Fabian A. C., Pringle J. E., 1979, MNRAS, 186, 779
- Doroshenko et al. (2010) Doroshenko V., Santangelo A., Suleimanov V., Kreykenbohm I., Staubert R., Ferrigno C., Klochkov D., 2010, A&A, 515, A10
- Edgar (2004) Edgar R., 2004, New Astron. Rev., 48, 843
- El Mellah et al. (2020) El Mellah I., Grinberg V., Sundqvist J. O., Driessen F. A., Leutenegger M. A., 2020, arXiv e-prints, p. arXiv:2006.16216
- Endo et al. (2002) Endo T., Ishida M., Masai K., Kunieda H., Inoue H., Nagase F., 2002, ApJ, 574, 879
- Fürst et al. (2011) Fürst F., et al., 2011, A&A, 535, A9
- Fürst et al. (2018) Fürst F., et al., 2018, A&A, 620, A153
- Giménez-García et al. (2015) Giménez-García A., Torrejón J. M., Eikmann W., Martínez-Núñez S., Oskinova L. M., Rodes-Roca J. J., Bernabéu G., 2015, A&A, 576, A108
- HI4PI Collaboration et al. (2016) HI4PI Collaboration et al., 2016, A&A, 594, A116
- Haberl (1991) Haberl F., 1991, ApJ, 376, 245
- Inoue (1985) Inoue H., 1985, Space Sci. Rev., 40, 317
- Islam & Paul (2014) Islam N., Paul B., 2014, MNRAS, 441, 2539
- Kallman et al. (2004) Kallman T. R., Palmeri P., Bautista M. A., Mendoza C., Krolik J. H., 2004, ApJS, 155, 675
- Kaper et al. (1995) Kaper L., Lamers H. J. G. L. M., Ruymaekers E., van den Heuvel E. P. J., Zuiderwijk E. J., 1995, A&A, 300, 446
- Kaper et al. (2006) Kaper L., van der Meer A., Najarro F., 2006, A&A, 457, 595
- Koh et al. (1997) Koh D. T., et al., 1997, ApJ, 479, 933
- Kreykenbohm et al. (2004) Kreykenbohm I., Wilms J., Coburn W., Kuster M., Rothschild R. E., Heindl W. A., Kretschmar P., Staubert R., 2004, A&A, 427, 975
- La Barbera et al. (2005) La Barbera A., Segreto A., Santangelo A., Kreykenbohm I., Orlandini M., 2005, A&A, 438, 617
- Leahy (1991) Leahy D. A., 1991, MNRAS, 250, 310
- Leahy & Kostka (2008) Leahy D. A., Kostka M., 2008, MNRAS, 384, 747
- Liu et al. (2018) Liu J., Soria R., Qiao E., Liu J., 2018, MNRAS, 480, 4746
- MacGregor et al. (1979) MacGregor K. B., Hartmann L., Raymond J. C., 1979, ApJ, 231, 514
- Manousakis et al. (2014) Manousakis A., Walter R., Blondin J., 2014, in European Physical Journal Web of Conferences. p. 02006 (arXiv:1310.8205), doi:10.1051/epjconf/20136402006
- Matt (2002) Matt G., 2002, MNRAS, 337, 147
- Mönkkönen et al. (2020) Mönkkönen J., Doroshenko V., Tsygankov S. S., Nabizadeh A., Abolmasov P., Poutanen J., 2020, MNRAS, 494, 2178
- Mukherjee & Paul (2004) Mukherjee U., Paul B., 2004, A&A, 427, 567
- Nabizadeh et al. (2019) Nabizadeh A., Mönkkönen J., Tsygankov S. S., Doroshenko V., Molkov S. V., Poutanen J., 2019, A&A, 629, A101
- Owocki & Rybicki (1984) Owocki S. P., Rybicki G. B., 1984, ApJ, 284, 337
- Owocki et al. (1988) Owocki S. P., Castor J. I., Rybicki G. B., 1988, ApJ, 335, 914
- Palmeri et al. (2003) Palmeri P., Mendoza C., Kallman T. R., Bautista M. A., Meléndez M., 2003, A&A, 410, 359
- Pravdo et al. (1995) Pravdo S. H., Day C. S. R., Angelini L., Harmon B. A., Yoshida A., Saraswat P., 1995, ApJ, 454, 872
- Rothschild & Soong (1987) Rothschild R. E., Soong Y., 1987, ApJ, 315, 154
- Sato et al. (1986) Sato N., Nagase F., Kawai N., Kelley R. L., Rappaport S., White N. E., 1986, ApJ, 304, 241
- Staubert et al. (2019) Staubert R., et al., 2019, A&A, 622, A61
- Stevens (1988) Stevens I. R., 1988, MNRAS, 235, 523
- Suchy et al. (2012) Suchy S., Fürst F., Pottschmidt K., Caballero I., Kreykenbohm I., Wilms J., Markowitz A., Rothschild R. E., 2012, ApJ, 745, 124
- Torrejón et al. (2010) Torrejón J. M., Schulz N. S., Nowak M. A., Kallman T. R., 2010, ApJ, 715, 947
- Tzanavaris & Yaqoob (2018) Tzanavaris P., Yaqoob T., 2018, ApJ, 855, 25
- Vidal (1973) Vidal N. V., 1973, ApJ, 186, L81
- Waisberg et al. (2017) Waisberg I., et al., 2017, ApJ, 844, 72
- Watanabe et al. (2003) Watanabe S., et al., 2003, ApJ, 597, L37
- Wilms et al. (2000) Wilms J., Allen A., McCray R., 2000, ApJ, 542, 914
- Zhang et al. (2014) Zhang S., et al., 2014, Proc. SPIE, 9144, 914455
- Zhang et al. (2019) Zhang S., et al., 2019, arXiv e-prints, p. arXiv:1910.09613
- Zheng et al. (2020) Zheng X., Liu J., Gou L., 2020, MNRAS, 491, 4802
| ObsID | Time | Exposure | Unabsorbed | |||
|---|---|---|---|---|---|---|
| (MJD) | (s) | () | ||||
| P010130900101 | 57968.33 | 1886 | 0.87 | |||
| P010130900102 | 57968.46 | 2027 | 0.87 | |||
| P010130900103 | 57968.60 | 1792 | 0.87 | |||
| P010130900104 | 57968.73 | 1506 | 0.88 | |||
| P010130900107 | 57969.15 | 2538 | 0.89 | |||
| P010130900401 | 57969.58 | 1827 | 0.90 | |||
| P010130900402 | 57969.73 | 1264 | 0.90 | |||
| P010130900502 | 58121.32 | 1088 | 0.55 | |||
| P010130900701 | 58137.54 | 1036 | 0.94 | |||
| P010130900808 | 58148.71 | 2513 | 0.21 | |||
| P010130900901 | 58163.01 | 2914 | 0.56 | |||
| P010130901501 | 58218.03 | 7713 | 0.88 | |||
| P010130901601 | 58258.34 | 1645 | 0.86 | |||
| P010130901602 | 58258.50 | 1188 | 0.86 | |||
| P010130901701 | 58259.83 | 1012 | 0.89 | |||
| P010130901702 | 58259.96 | 1182 | 0.89 | |||
| P010130901802 | 58327.04 | 1206 | 0.51 | |||
| P010130901901 | 58494.92 | 2685 | 0.56 | |||
| P010130902001 | 58495.75 | 3432 | 0.58 | |||
| P010130902101 | 58545.36 | 2092 | 0.77 | |||
| P010130902102 | 58545.49 | 2214 | 0.78 | |||
| P010130902103 | 58545.63 | 2495 | 0.78 | |||
| P010130902104 | 58545.79 | 2894 | 0.78 |
| ObsID | |||||||||||
| (MJD) | (keV) | (eV) | () | (keV) | (eV) | () | (keV) | (eV) | () | (eV) | |
| P010130900101 | |||||||||||
| P010130900102 | - | - | - | - | |||||||
| P010130900103 | |||||||||||
| P010130900104 | - | - | - | - | |||||||
| P010130900107 | - | ||||||||||
| P010130900401 | - | - | - | - | - | ||||||
| P010130900402 | - | - | - | - | |||||||
| P010130900502 | - | - | - | - | - | - | - | - | |||
| P010130900701 | - | - | - | - | - | - | - | ||||
| P010130900808 | - | - | - | - | - | - | - | - | - | - | - |
| P010130900901 | - | - | - | - | - | - | - | - | - | - | |
| P010130901501 | - | - | - | ||||||||
| P010130901601 | |||||||||||
| P010130901602 | - | - | - | - | |||||||
| P010130901701 | - | - | - | - | |||||||
| P010130901702 | - | - | - | - | |||||||
| P010130901802 | - | - | - | - | - | - | - | - | - | - | - |
| P010130901901 | - | - | - | - | - | - | - | ||||
| P010130902001 | - | - | - | - | |||||||
| P010130902101 | - | - | - | - | - | - | - | - | |||
| P010130902102 | - | - | - | - | - | - | - | ||||
| P010130902103 | - | - | - | - | - | - | - | ||||
| P010130902104 | - | - | - |