Heterostrain rules the flat-bands in magic-angle twisted graphene layers
The moiré of twisted graphene bilayers can generate flat bands in which charge carriers do not posses enough kinetic energy to escape Coulomb interactions with each otherTrambly de Laissardière et al. (2010); Bistritzer & MacDonald (2011) leading to the formation of novel strongly correlated electronic statesCao et al. (2019a, b). This exceptionally rich physics relies on the precise arrangement between the layers.Carr et al. (2018); Yankowitz et al. (2019) We survey published Scanning Tunnelling Microscope (STM) measurementsHuder et al. (2018); Kerelsky et al. (2019); Choi et al. (2019); Jiang et al. (2019); Xie et al. (2019); Zhang et al. (2020a); Wong & et al. (2020); Choi et al. (2020); Nuckolls et al. (2020); Zhang et al. (2020b) to prove that near the magic angle, native heterostrain, the relative deformations between the layers, dominates twist in determining the flat bands. This is demonstrated at large doping where electronic correlations have a weak effect and where we also show that tip-induced strain can have a strong influence. In the opposite situation of low doping, we find that electronic correlation further normalize the flat bands in a way that strongly depends on experimental details.
The strongly correlated electron physics recently observed in twisted graphene layersCao et al. (2019a, b) develops in flat bands Trambly de Laissardière et al. (2010); Bistritzer & MacDonald (2011) which are very sensitive to the relative arrangement between the layers. For instance, the superconducting phase has been reported to occur in a very narrow range of rotation angle between the layers around the magic angle. As another illustration, hydrostatic pressure changes the interlayer distance which also strongly influences superconductivity Carr et al. (2018); Yankowitz et al. (2019). Heterostrain, the in-plane deformation of one layer with respect to the other is an ubiquitous source of modification of the relative arrangement between the layersHuder et al. (2018); Kerelsky et al. (2019); Choi et al. (2019); Jiang et al. (2019); Xie et al. (2019); Zhang et al. (2020a); Wong & et al. (2020); Choi et al. (2020); Nuckolls et al. (2020); Zhang et al. (2020b). ExperimentsHuder et al. (2018) and theoryCosma et al. (2014); Bi et al. (2019) have shown that heterostrain affects the flat bands which could have an impact on the strongly correlated electron physics. Bi, Yuan and Fu have even predicted that near the magic angle, the bandwith becomes insensitive to the twist angle and that the effect of heterostrain is dominant,Bi et al. (2019) calling for systematic experimental study of its effect. Such program is however difficult to implement owing to the lack of controllability of heterostrain, and its inhomogeneity previously referred to as ”twist angle disorder” and which was also found to impact strongly correlated states at the macroscopic scale Lu & et al. (2019); Choi et al. (2020). In order to overcome these issues, we survey already published experimental STM dataHuder et al. (2018); Kerelsky et al. (2019); Choi et al. (2019); Jiang et al. (2019); Xie et al. (2019); Wong & et al. (2020); Zhang et al. (2020a); Choi et al. (2020); Nuckolls et al. (2020) in view of quantifying the effect of homogeneous heterostrain on the physics of magic-angle twisted graphene layers.
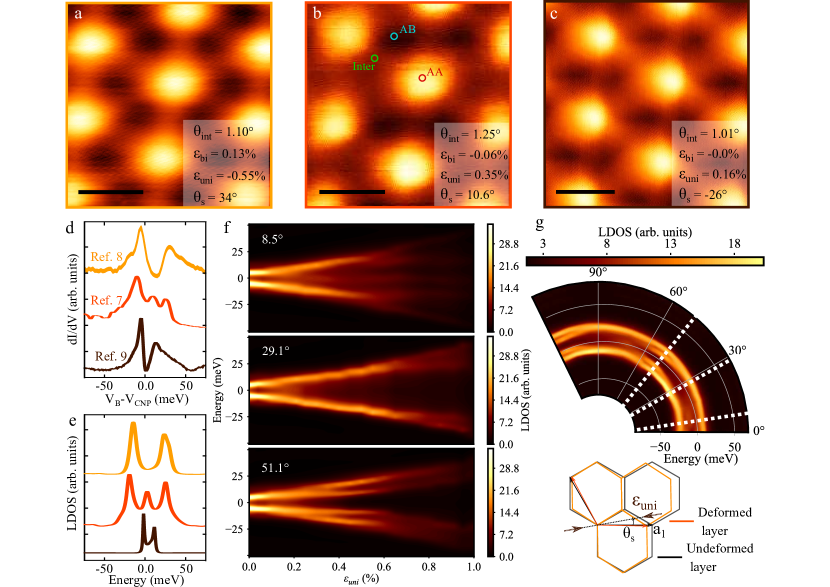
Figure 1 presents typical STM images collected from Refs. Huder et al., 2018; Kerelsky et al., 2019; Choi et al., 2019. An immediate observation is that the STM images all look very similar. This is not surprising because these samples have a twist angle very close to one another. This similarity is only apparent as evidenced by the variety of shapes of the local density of states (LDOS) measured from the dI/dV(V) spectroscopy (Fig. 1d). Despite the flat-bands should merge at the magic angle, the spectra of Ref. Kerelsky et al., 2019 and Choi et al., 2019 show two van Hove singularities indicating that the flat bands are still separated. Their spacing is doping dependent which has been attributed to electron-electron interactions.Kerelsky et al. (2019); Choi et al. (2019); Jiang et al. (2019); Xie et al. (2019); Wong & et al. (2020); Zhang et al. (2020a) It can reach several tens of meV, even at large doping where correlations are not expected to renormalize strongly the bands. Still, while the two samples have a twist angle differing by only 0.1∘, doping does not explain why their differ by a factor 2-3. Sample to sample variation is obvious from other published data.Jiang et al. (2019); Xie et al. (2019); Wong & et al. (2020); Zhang et al. (2020a); Choi et al. (2020); Nuckolls et al. (2020) Strikingly the data of Ref. Huder et al., 2018 show a third peak at zero energy, a result which was recently reproducedZhang et al. (2020b). In order to determine whether this variety in sample behaviour can be understood within the framework of heterostrain, we use the method described in Ref. Artaud et al., 2016 to determine the precise arrangement of the layers and calculate the corresponding local density of states using a tight-binding method.Trambly de Laissardière et al. (2010); Brihuega et al. (2012); Trambly de Laissardière et al. (2012)
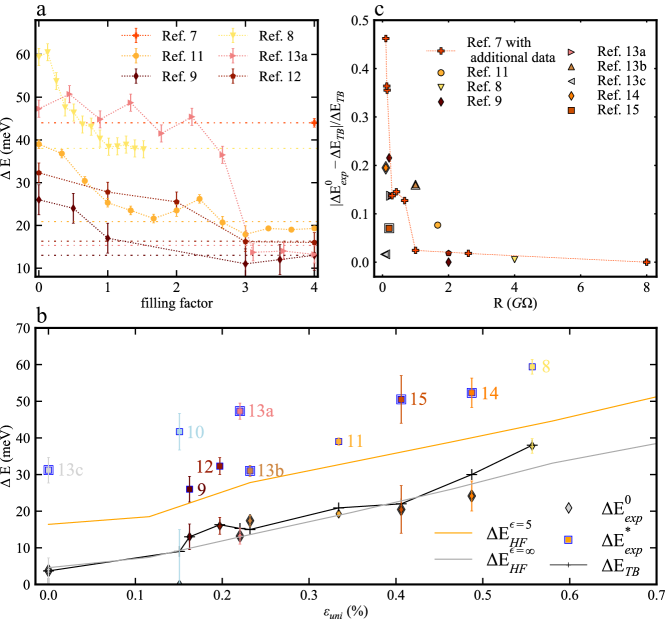
Figure. 1a, b and c include our estimates of heterostrain. In all cases, biaxial heterostrain is smaller than uniaxial heterostrain which varies by a factor 3 from the smallest to the largest. Figure. 1d shows that the calculated local density of states agrees very well with experimental data. In particular the number of peaks is controlled by heterostrain which also influences their spacing pointing to a strong contribution of heterostrain to the observed phenomenology. The tight-binding calculations presented in Fig. 1f show that the van Hove singularities separate linearly with uniaxial heterostrain for all angle of application of heterostrain. This angle controls the splitting of the van Hove singularities (Fig. 1g) leading to three typical behaviours reported in Fig. 1f (See supplementary information and videos for more theoretical results). These results agree with those of the continuum model Bi et al. (2019). The more quantitative comparison of Fig. 2a shows that converges to the value predicted by our tight-binding calculation at large doping. This has to be expected because the effect of electronic correlations measured by the ratio of Coulomb to kinetic energy reduces with doping and the system evolves towards the non-interacting situation modeled by our tight binding calculations. It establishes that heterostrain controls the physics of twisted graphene layers near the magic angle at large doping. This can be viewed explicitly in Fig. 2b which shows that , the experimental spacings of van Hove singularities at large doping, depends linearly on heterostrain as predicted by tight binding and the continuum model. On the contrary, the same data plotted as function of the twist angle do not show particular correlation with this parameter (Supplementary Fig. S5).
Figure 2c provides a deeper level of comparison between theory and experiment. It presents the relative difference between the and the experimental as function of the tunnelling resistance ( and are the tunnelling bias and current). The excellent agreement obtained for 2 G degrades below this value pointing to a possible influence of tip-induced strain which is known to be controlled by .Mamin et al. (1986) The deformations seen in Fig 3a, b and c showing the evolution of the image of Fig. 1b for decreasing corroborate this interpretation (The reader may also refer to Fig. S3 of Ref. Choi et al. (2019) for another example).
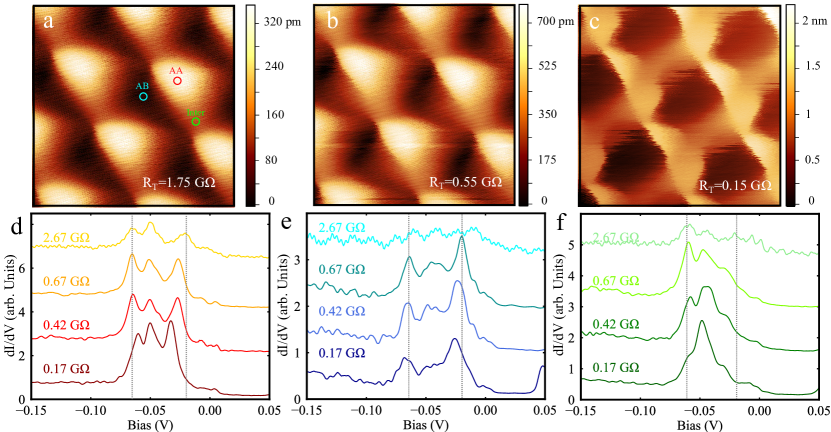
Figure 3 shows that while spatial variations of the LDOS at high only reflect electronic localisation in AA regions, the response to tip-induced strain at low strongly depends on the position on the moiré pattern. While AB regions are weakly affected (Fig. 3e), is reduced by 40% at low tunnel resistance in AA regions indicating a flattening of the bands (Fig. 3d). The flattening culminates in intermediate regions between two AA regions where a 15 meV wide single LDOS peak signals that very flat bands can be engineered there (Fig. 3f). It is not surprising that these regions are the most sensitive to tip-induced strain because they are characterized by an excess of elastic energy Alden et al. (2013); van Wijk et al. (2015); You & et al. (2019); Gornostyrev & Katsnelson (2020) and are therefore more easily perturbed. We note that the tip may induce a complex strain pattern including hetero-, homostrain as well as vertical displacement all of which depend on the position on the moiré. It follows that the relative arrangement between the layers can no longer be determined from STM images at low and that the response to tip-induced strain is largely sample dependent. This is illustrated by Fig. S5 of Ref. Choi et al., 2019 in which, contrary to our experiment, the spacing between van Hove singularities increases with decreasing . We conclude that great care is needed when discussing quantitatively experimental results and that the STM tip can be used to locally engineer the relative arrangement between the layers.
The very good agreement between experiments and theory obtained so far raises the question about the influence of heterostrain on electronic correlations which express most at zero doping.Kerelsky et al. (2019); Choi et al. (2019); Jiang et al. (2019); Xie et al. (2019); Wong & et al. (2020); Zhang et al. (2020a) Figure 2b shows that , the experimental spacing of van Hove singularities in this regime is increased by electronic correlations and tends to increase with strain. This tendency is well pictured by our Hartree-Fock calculations presented in Fig. 2b including both heterostrain and electronic correlations for the dielectric constant (See Ref. Cea et al., 2019 and supplementary information for the details). These calculations however underestimate . Further increasing the effect of interactions by decreasing the dielectric constant does not lead to a better agreement especially at large strains where the low energy bands become so wide that they merge into the continuum of the higher energy bands and van Hove singularities can no longer be clearly defined (Supplementary information). Also the calculations do not capture the large experimental scatter of which we were not able to correlate to any experimental parameter (twist angle, heterostrain value or angle of application, bandwidths as measured by the FWHM of van Hove singularities, tunnelling resistance, temperature). The scatter also does not correlate with the appearance of polarized states leading to the cascade of transitions seen in some samples at intermediate fillings.Wong & et al. (2020); Choi et al. (2020); Nuckolls et al. (2020) This points to a strong sensitivity of electronic correlations to some additional experimental parameters beyond those investigated here. This could be due to the substrate or more generally to the detailed electrostatic environment as suggested by several studies reviewed in Ref. Balents et al., 2020, and to atomic lattice relaxation effects You & et al. (2019) calling for a systematic experimental study of the effect of those parameters.
Returning to heterostrain, its strong impact on the flat bands of magic angle twisted graphene layers also calls for a systematic investigation of its influence on the strongly correlated phases and that of other moiré materials. In this context, it would be extremely desirable to be able to tune it. Alternatively, one could also rely of the variability in the fabrication process to generate a representative set of samples such as the one we have studied here.
References
- Trambly de Laissardière et al. (2010) Trambly de Laissardière, G., Mayou, D. & Magaud, L. Localization of Dirac Electrons in Rotated Graphene Bilayers. Nano Lett. 10, 804–808 (2010).
- Bistritzer & MacDonald (2011) Bistritzer, R. & MacDonald, A. H. Moiré bands in twisted double-layer graphene. PNAS 108, 12233 12237 (2011).
- Cao et al. (2019a) Cao, Y. et al. Magic-angle graphene superlattices: a new platform for unconventional superconductivity. Nature 55, 43–50 (2019a).
- Cao et al. (2019b) Cao, Y. et al. Correlated insulator behaviour at half-filling in magic-angle graphene superlattices. Nature 556, 80 (2019b).
- Carr et al. (2018) Carr, S., Fang, S., Jarillo-Herrero, P. & Kaxiras, E. Pressure dependence of the magic twist angle in graphene superlattices. Phys. Rev. B 98, 085144 (2018). URL https://link.aps.org/doi/10.1103/PhysRevB.98.085144.
- Yankowitz et al. (2019) Yankowitz, M., Chen, S. & Dean, C. R. Tuning superconductivity in twisted bilayer graphene. Science 363, 1059–1064 (2019).
- Huder et al. (2018) Huder, L. et al. Electronic spectrum of twisted graphene layers under heterostrain. Physical Review Letters 120, 156405 (2018).
- Kerelsky et al. (2019) Kerelsky, A. et al. Maximized electron interactions at the magic angle in twisted bilayer graphene. Nature 572, 95–100 (2019).
- Choi et al. (2019) Choi, Y. et al. Electronic correlations in twisted bilayer graphene near the magic angle. Nature Physics 15, 1174–1180 (2019).
- Jiang et al. (2019) Jiang, Y. et al. Charge order and broken rotational symmetry in magic-angle twisted bilayer graphene. Nature 573, 91–95 (2019).
- Xie et al. (2019) Xie, Y. et al. Spectroscopic signatures of many-body correlations in magic-angle twisted bilayer graphene. Nature 572, 101–105 (2019).
- Zhang et al. (2020a) Zhang, Z., Myers, R., Watanabe, K., Taniguchi, T. & LeRoy, B. J. Probing the wave functions of correlated states in magic angle graphene. Phys. Rev. Research 2, 033181 (2020a). URL https://link.aps.org/doi/10.1103/PhysRevResearch.2.033181.
- Wong & et al. (2020) Wong, D. & et al. Cascade of electronic transitions in magic-angle twisted bilayer graphene. Nature 582, 198 (2020).
- Choi et al. (2020) Choi, Y. et al. Tracing out Correlated Chern Insulators in Magic Angle Twisted Bilayer Graphene. arXiv 2008.11746 (2020).
- Nuckolls et al. (2020) Nuckolls, K. P. et al. Strongly Correlated Chern Insulators in Magic-Angle Twisted Bilayer Graphene. arXiv 2007.03810 (2020).
- Zhang et al. (2020b) Zhang, Y. et al. Electron interactions in strain-induced zero-energy flat band in twisted bilayer graphene near the magic angle. arXiv 2002.10073 (2020b).
- Cosma et al. (2014) Cosma, D. A., Wallbank, J. R., Cheianov, V. & Fal, V. I. Moiré pattern as a magnifying glass for strain and dislocations in van der Waals heterostructures. Faraday Discussions 173, 137–143 (2014). URL http://dx.doi.org/10.1039/C4FD00146J.
- Bi et al. (2019) Bi, Z., Yuan, N. F. Q. & Fu, L. Designing flat bands by strain. Phys. Rev. B 100, 035448 (2019). URL https://link.aps.org/doi/10.1103/PhysRevB.100.035448.
- Lu & et al. (2019) Lu, X. & et al. Superconductors, orbital magnets and correlated states in magic-angle bilayer graphene. Nature 574, 653–657 (2019).
- Artaud et al. (2016) Artaud, A. et al. Universal classification of twisted, strained and sheared graphene moiré superlattices. Scientific Reports 6, 25670 (2016).
- Brihuega et al. (2012) Brihuega, I. et al. Unraveling the Intrinsic and Robust Nature of van Hove Singularities in Twisted Bilayer Graphene by Scanning Tunneling Microscopy and Theoretical Analysis. Phys. Rev. Let. 109, 196802 (2012).
- Trambly de Laissardière et al. (2012) Trambly de Laissardière, G., Mayou, D. & Magaud, L. Numerical studies of confined states in rotated bilayers of graphene. Phys. Rev. B. 86, 125413 (2012).
- Mamin et al. (1986) Mamin, H. J., Ganz, E., Abraham, D. W., Thomson, R. E. & Clarke, J. Contamination-mediated deformation of graphite by the scanning tunneling microscope. Phys. Rev. B 34, 9015–9018 (1986).
- Alden et al. (2013) Alden, J. S. et al. Strain solitons and topological defects in bilayer graphene. Proceedings of the National Academy of Sciences 110, 11256–11260 (2013). URL https://www.pnas.org/content/110/28/11256.
- van Wijk et al. (2015) van Wijk, M. M., Schuring, A., Katsnelson, M. I. & Fasolino, A. Relaxation of moiré patterns for slightly misaligned identical lattices: graphene on graphite. 2D Materials 2, 034010 (2015). URL https://doi.org/10.1088%2F2053-1583%2F2%2F3%2F034010.
- You & et al. (2019) You, H. & et al. Atomic and electronic reconstruction at the van der Waals interface in twisted bilayer graphene. Nature Materials 18, 448 (2019).
- Gornostyrev & Katsnelson (2020) Gornostyrev, Y. N. & Katsnelson, M. I. Origin of the vortex displacement field in twisted bilayer graphene. arXiv 2006.11551 (2020).
- Cea et al. (2019) Cea, T., Walet, N. R. & Guinea, F. Electronic band structure and pinning of Fermi energy to Van Hove singularities in twisted bilayer graphene: A self-consistent approach. Phys. Rev. B 100, 205113 (2019). URL https://link.aps.org/doi/10.1103/PhysRevB.100.205113.
- Balents et al. (2020) Balents, L., Dean, C. R., Efetov, D. K. & Young, A. F. Superconductivity and strong correlations in moiré flat bands. Nature Physics 16, 725–733 (2020). URL http://www.nature.com/articles/s41567-020-0906-9.
- Stewart (1984) Stewart, G. R. Heavy-fermion systems. Rev. Mod. Phys. 56, 755–787 (1984). URL https://link.aps.org/doi/10.1103/RevModPhys.56.755.
- Lee et al. (2006) Lee, P. A., Nagaosa, N. & Wen, X.-G. Doping a Mott insulator: Physics of high-temperature superconductivity. Rev. Mod. Phys. 78, 17–85 (2006). URL https://link.aps.org/doi/10.1103/RevModPhys.78.17.
- Stewart (2011) Stewart, G. R. Superconductivity in iron compounds. Rev. Mod. Phys. 83, 1589–1652 (2011). URL https://link.aps.org/doi/10.1103/RevModPhys.83.1589.
- Guinea & Walet (2018) Guinea, F. & Walet, N. R. Electrostatic effects, band distortions, and superconductivity in twisted graphene bilayers. Proceedings of the National Academy of Sciences 10947 (2018).
- Xie & MacDonald (2020) Xie, M. & MacDonald, A. H. Nature of the Correlated Insulator States in Twisted Bilayer Graphene. Phys. Rev. Lett. 124, 097601 (2020). URL https://link.aps.org/doi/10.1103/PhysRevLett.124.097601.
- Goodwin et al. (2020) Goodwin, Z., Vitale, V., Liang, X., Mostofi, A. A. & Lischner, J. Hartree theory calculations of quasiparticle properties in twisted bilayer graphene. arXiv:2004.14784 (2020).
- Calderón & Bascones (2020) Calderón, M. J. & Bascones, E. Interactions in the 8-orbital model for twisted bilayer graphene. arXiv:2007.16051 (2020).
Methods
Data collection
When possible, the raw data used in the survey were retrieved from the authors of the publications. Otherwise, the data were digitized from the corresponding publications. We could use the method of Ref. Artaud et al. (2016) to extract heterostrain for Refs. Huder et al. (2018); Kerelsky et al. (2019); Choi et al. (2019) which had STM images with atomic resolution. The strength of this method is to isolate heterostrain from homostrain and possible artefacts due to the calibration of the piezoelectric tube. For Refs. (10, 11, 13a, 14, 15), we used the method described in Ref. Kerelsky et al. (2019) to determine heterostrain. Although it does not allow to determine biaxial heterostrain we found it to provide good estimates of uniaxial heterostrain for the data of Refs. Huder et al. (2018); Kerelsky et al. (2019); Choi et al. (2019). For Refs. (12, 13b, 13c), we did not have the data to do our own analysis and used the values of heterostrain provided by the authors. Error bars in Fig. 2 of main text present the uncertainty as estimated the full width at half maximum of a van Hove singularity.
STM measurements
We performed the measurements presented in Figure 3 of the main text in order to document the effect of tip-induced strain on the twisted graphene layers described in Ref. Huder et al. (2018). Tip-induced strain was changed by changing the bias for a given tunnel current in imaging conditions. In spectroscopic mode, the tip-sample interaction was defined by the set point prior to switching off the feedback loop and subsequent sweeping of the bias voltage between -200 mV and 200 mV. The signal was measured using phase sensitive detection with a 2 mV oscillation at 263 Hz added to the tunnel bias. The di/dV curves were normalised to 1 at -200 mV.
Acknowledgements
The authors thank E. Andrei, S. Nadj-Perge, for sharing their data and for interesting discussions. AM is supported by Paris//Seine excellence initiative (Grant No. 2019-055-C01-A0). FG and TC acknowledge funding from the European Commision, under the Graphene Flagship, Core 3, grant number 881603, and from grants NMAT2D (Comunidad de Madrid, Spain), SprQuMat and SEV-2016-0686, (Ministerio de Ciencia e Innovación, Spain)
Author contributions:
VTR,FM and CC defined the project. FM performed the data analysis from the literature and provided the cells for tight binding calculations which were performed by AM and GTL. TC and FG performed Hartree-Fock calculations. LH, VTR and CC performed the STM experiments. VTR and FM wrote the manuscript with input from all the authors. VTR supervised the project.
Supplementary materials
Supplementary file and videos available on request to vincent.renard@cea.fr.