Massive MIMO goes Sub-GHz: Implementation and Experimental Exploration for LPWANs
Abstract
Low-Power Wide-Area Networks operating in the unlicensed bands are being deployed to connect a rapidly growing number of Internet-of-Things devices. While the unlicensed sub-GHz band offers favorable propagation for long-range connections, measurements show that the energy consumption of the nodes is still mostly dominated by the wireless transmission affecting their autonomy. We investigate the potential benefits of deploying massive MIMO technology to increase system reliability and at the same time support low-energy devices with good coverage at sub-GHz frequencies. The impact of different antenna configurations and propagation conditions is analyzed. Both actual average experienced array gain and channel hardening are examined. The assessment demonstrates the effect of channel hardening as well as the potential benefits of the experienced array gain. These measurements serve as a first assessment of the channel conditions of massive MIMO at sub-GHz frequencies and are, to the best of our knowledge, the first of its kind.
Index Terms:
Internet-of-Things, LPWAN, Massive MIMO, Sub-GHz, TestbedI Introduction
The Internet-of-Things (IoT) is strongly growing. A variety of applications – each having its own requirements – are being deployed in a fast pace. Consequently, the number of IoT devices are increasing exponentially. Furthermore, a high number of all the applications demand that these devices are autonomous for a couple of years. Low-Power Wide-Area Networks (LPWANs) operating in the unlicensed sub-GHz spectrum are being deployed to connect these devices. However, the current LPWANs are unable to meet the new stringent requirements of a new wave of IoT demanding low-power, massive connectivity and high reliability.
Massive MIMO is a technology where a large number of antennas is used at the base station to serve multiple devices at the same time. By introducing more antennas, the reliability, coverage, energy-efficiency and the number of connected nodes can be enhanced in comparison to when using conventional single-antenna gateways. Hence, there is a potential benefit of using massive MIMO in the unlicensed sub-GHz spectrum to support the growth of IoT applications.
In order to validate the anticipated benefits of using massive MIMO for LPWANs, testbeds or other measurement equipment is required. In Table I an overview of current available massive MIMO testbeds operating at sub-6GHz is presented. In contrast to LPWAN applications, most of these testbeds are designed for high throughput. The trend is also to rather explore higher frequencies and therefore a lot of attention is given to designing equipment to operate in the mmWave, or even terahertz, bands. For instance, Facebook introduced Terragraph [1], which is operating at . Although some of the testbeds can operate at sub-GHz frequencies, massive MIMO measurements in this unlicensed band are still lacking and the actual benefit of deploying massive MIMO to support future LPWANs have until now remained unexplored.
To cover this gap, we extended a massive MIMO testbed to be narrow-band, operate in the unlicensed sub-GHz band and designed a versatile antenna array. Secondly, we conducted the first sub-GHz massive MIMO measurement campaign to collect channels in an outdoor scenario with two different array configurations and made them available open-source111dramco.be/massive-mimo/measurement-selector/#Sub-GHz. An initial assessment of the radio propagation characteristics were studied, based on the average array gain and channel hardening, showcasing the potential gain of using massive MIMO to evolve current LPWANs in order to pave the way for the new wave of IoT.
The structure of this paper is as follows. In Section II the versatile antenna array is described, followed by a section elaborating on the implementations made in the framework and in the setup in order to comply to the regulations in the unlicensed band. Section IV presents the measurement scenario and Section V shows the results from the experimental exploration. Finally, the conclusions are given.
| University/Company | Location | Number of antennas | Frequency range |
|---|---|---|---|
| Sub-GHz | |||
| Eurecom (OAI) [2] | Sophia Antipolis, France | 64 | depends on RF platform |
| KU Leuven [3] | Leuven, Belgium | 64 | to |
| Rice University (Argos) [4] | Houston, Texas, USA | 64 (v1) 96 (v2) flexible (v3) | to (v3) |
| Sub-6GHz | |||
| Norwegian University of Science and Technology [5] | Trondheim, Norway | 64 | to |
| University of Lund (LuMaMi) [6] | Lund, Sweden | 100 | to |
| University of Bristol [7] | Bristol, UK | 128 | to |
| Southeast university [8] | Nanjing, China | 128 | to |


II Versatile Large Array
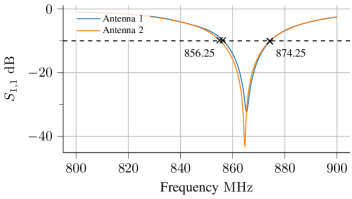
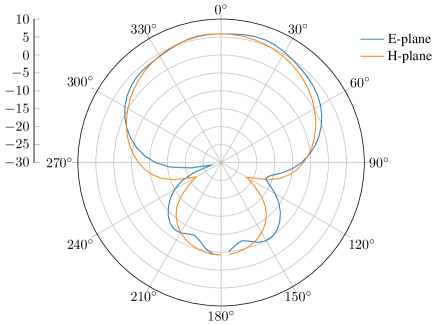
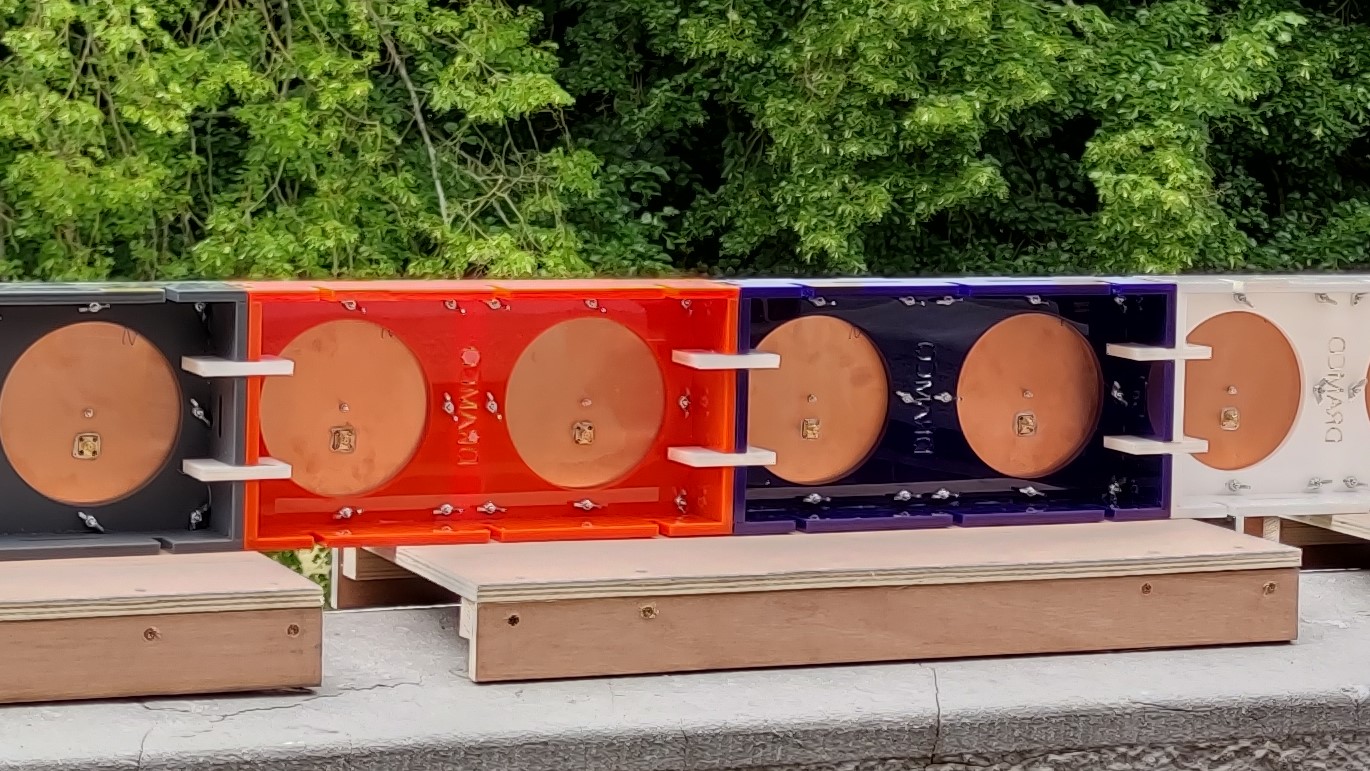
A flexible patch antenna array was developed in-house and deployed at the base station side. The patch was designed for the unlicensed frequency band . In this band, an lower than was targeted. As can been seen from Figure 1, the is lower than between and is hence meeting the specifications. To lower the impact of mutual coupling between these antennas [9], patch antennas were preferred over dipoles. The radiation pattern of the patch antenna is shown in Fig. 2. The antenna has a gain of . Two patch antennas are contained in one antenna holder. The array is made up of antenna holders, where each holder has two patch antennas. The holders were designed to be modular such that different configurations could be easily assembled222dramco.be/massive-mimo/sub-ghz-array/animation.gif; the back side of these holders and how to connect them can be seen in Fig. 3. Furthermore, our design enforces that the antennas are always spaced by half a wavelength, independent of the the manner in which the holders are connected, i.e., vertically or horizontally. For the experiments we targeted a antenna ULA but also a URA with the antennas split in four rows of eightantennas each. These configurations are shown in Fig. 4. Due to the modular design of the antenna holders, many other configurations could be made including, but not limited to, cylindrical and distributed setups.
III Transmission in the Unlicensed Sub-GHz Band
In order to comply to the regulations of short-range devices (SRD860), the utilized frequency band, the transmit power, bandwidth and duty cycle of the existing massive MIMO framework needed to be adapted. An overview of these limitations are given in [10]. These restrictions apply to specific frequency bands and applications. The allowed bandwidth in the SRD band varies between and . In these bands a maximum transmit power and duty cycle are also specified. The duty cycle ranges from 0.1% ( per hour) to 10% ( per hour). The maximum transmit power is defined as the Effective Radiated Power (ERP). The ERP is the total power that would have been fed to a half-wave dipole to get the same radiation intensity as the actual device at the same distance and in the direction of the antenna’s strongest beam. Hence, the ERP can be expressed as
| (1) |
where is the gain of the actual antenna compated to a reference half-wave antenna and the input power. The ERP is limited between () and ().
In this work, we use the SRD band 54333European Union, Commission Decision of 9 November 2006 on harmonisation of the radio spectrum for use by short-range devices (2006). 2006/771/EC. Consolidated version of August 2017.. The band is defined between and , and limits the ERP to () and the duty cycle to 10%. We use a carrier frequency of .
Transmit Power. As the base station in this measurement setup is only acting as a receiver, the only transmit power that needs to be restricted is the one of the node. This is easily done in the interface of the original framework. The utilized USRP (NI USRP 2952) has a maximum transmit power of , thereby respecting the maximum allowable transmit power of as per SRD860.
Bandwidth. The bandwidth used for real-time operation of the testbed is . Orthogonal frequency-division multiplexing (OFDM) is used and as in LTE, subcarriers are used for carrying the data, which is further divided into resource blocks and a subcarrier spacing of . To respect the regulations of having a bandwidth of maximum , this has to be reduced. Implementation-wise this was solved by transmitting zeros on all subcarriers except for the subcarriers in the middle of the symbols, resulting in a total bandwidth of . This means that uplink pilots were transmitted at two subcarriers in an OFDM symbol and that one resource block of data was utilized.
Duty Cycle. The maximum duty cycle, i.e., transmit-to-silent ratio, depends on the radio frequency (RF) band. The duty cycle is computed as
| (2) |
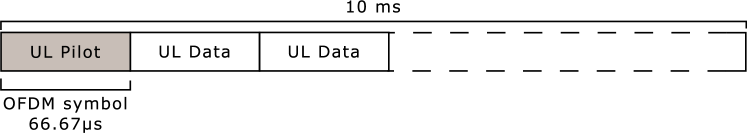
over a time window of one hour. In order to respect the duty cycle regulations, the frame structure had to be changed as well. The default frame structure is based on LTE with subframes, each with two slots where each slot is containing seven OFDM symbols. For all experiments, the first OFDM symbol in the first slot was an uplink pilot. The two symbol following symbols were set to be transmitting uplink data, as in Fig. 5 where the first three symbols of the the first slot in the frame structure is shown. All other symbols were empty yielding a duty cycle of 2% ().
The framework featured Over-the-Air (OTA) synchronization. Due to the modification the original slots dedicated for synchronization were removed. Atomic clocks were instead used for syncing the base station and the mobile station. Therefore, the synchronization source in the framework needed to be changed from the local oscillator to the input clock reference where the atomic clock is connected.
IV Measurement campaign and Open-Source Data
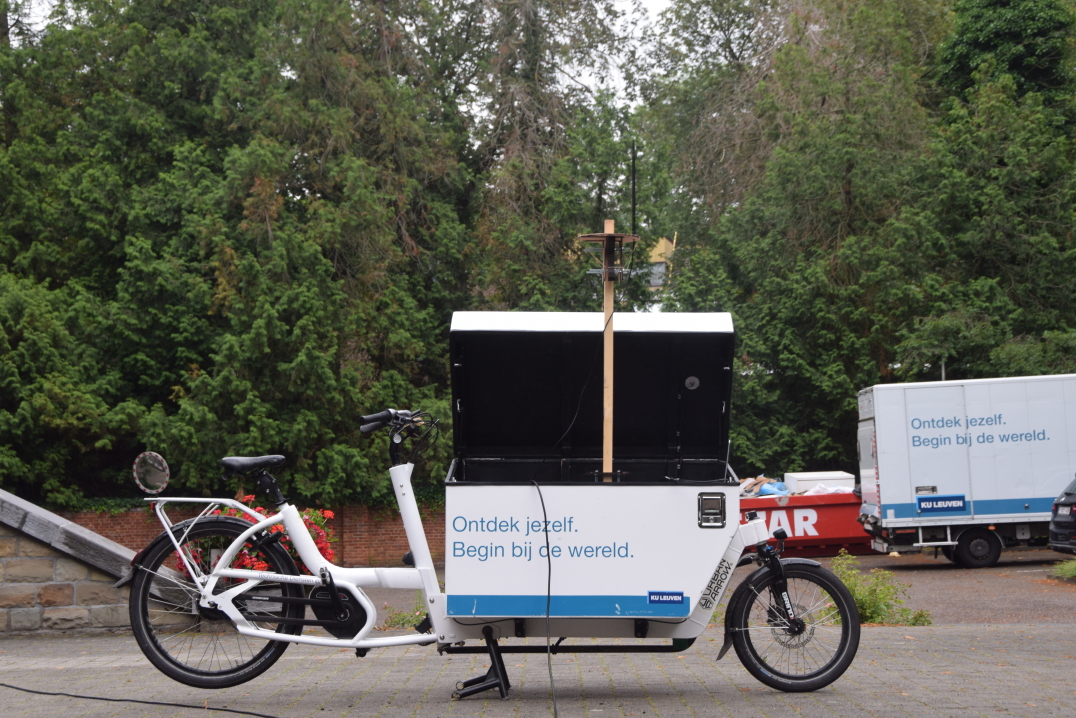
The measurement campaign was performed in front of the Department of Electrical Engineering (ESAT) in Heverlee, Belgium. An overview of this environment can be seen in Fig. 6. The base station was equipped with either an ULA or an URA, as shown in Fig. 4(b) and 4(a), and placed on the balcony of the building at a height of 7 meters. Meanwhile the node, seen in Fig. 7, was moving around along the paths that are also depicted on the map. Measurements were collected for all 32 antennas444Due to an unexpected issue, only the first 31 channels could be used. at static points, spaced 10 meters apart, and continuously along the same paths. The chosen paths include positions both in Line-of-Sight (LoS) and non-LoS (NLoS) and also paths that are either perpendicular or parallel to the base station antenna array. The details of the measurement setup can be found in Table II and the measurements are available open-source1.
| Parameter | Symbol | Value |
|---|---|---|
| Carrier frequency | ||
| Number of subcarriers () | 2 | |
| Number of snapshots | 1000\tnotextnote:static /6000\tnotextnote:continuous | |
| Transmit power (coerced) | ||
| Number of base station antennas | 32 | |
| Number of nodes | 1 | |
| Base station Array configuration | ULA/URA | |
| Type of BS antenna | Patch | |
| Type of UE antenna | Dipole | |
| Sample interval | ||
| Sample duration | ||
| Measurement duration | 10s/60s | |
| Subcarrier modulation | QPSK | |
| BS height | ||
| UE height | ||
| Antenna polarization | vertical |
-
a
For static measurements.
-
b
For continuous measurements.
V Experimental Exploration
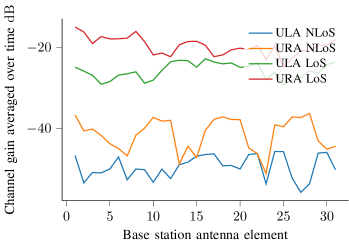
In this section a first assessment of the channel conditions of measured massive MIMO at sub-GHz frequencies is presented. The antenna elements are numbered from right to left and from the bottom to the top. A first look of what the average received channel gain for the different antennas can look like for an ULA and an URA in both LoS and NLoS is shown in Fig. 8. The channel gain per antenna at position is averaged over time and frequency as in
| (3) |
where is the channel vector measured at position k at snapshot , frequency and at antenna . By averaging the channel gain over time and frequency, the small-scale effect is averaged out and thus Fig. 8 depicts the large-scale fading coefficient per antenna. The differences between these large-scale fading coefficients per antenna illustrate the large-scale fading over the array. The LoS and NLoS points are chosen as one static point in the beginning of path A, close to the base station array, and one static point 100 meters away along the same path, respectively. Due to the different path losses, the NLoS curves will naturally be lower than the LoS ones. Another difference that can be observed is that for the LoS cases the average channel gain is more similar for the different antennas in both arrays while in NLoS a more prominent large-scale fading effect can be observed over the array; this is especially clear for the URA where four dips of channel gain can be observed – one for each row in the array. Furthermore, the variation of channel gain per antenna is also larger for the NLoS points. The difference between the standard deviation of channell gain per antenna for the ULA between the LoS and NLoS scenario is and the corresponding value for the URA is . The URA experiences a higher standard deviation than the ULA in the NLoS scenario. Finally, one last observation from Fig. 8 is that the URA in general has a higher average channel gain than the ULA.
One advantage with massive MIMO is the array gain resulting from combining the many antennas, resulting in a potential transmit power reduction at the node side. Moreover, as the number of base station antennas increases, the variation of channel gain decreases; this phenomena is called channel hardening and makes a fading channel behave more deterministic. We adopt the definition given in [11], stating that a channel offers channel hardening when the number of base station antennas goes to infinity if
| (4) |
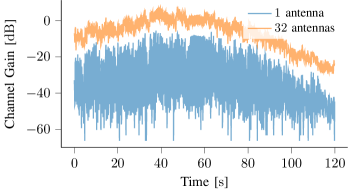
where is the variance, the expectation and is the Euclidean norm. Both the array gain and the channel hardening can be observed in the experimental results depicted in Fig. 9 where the lower curve corresponds to one antenna and the upper curve is when combining all antennas for the ULA along the continuous path B measurement. Due to the array gain, the latter is moved up and the channel hardening effect can be seen as the variations of channel gain becoming insignificant in comparison to the one antenna case. Both the increased received gain and the smaller fading margin required can reduce the transmit power needed at the node side.
VI Conclusions
In this work, we have presented an experimental setup and the first measurement campaign using massive MIMO at sub-GHz frequencies and made the data available open-source. Our initial assessment shows the potential benefits of using massive MIMO for connecting remote energy-constrained devices. Due to the presence of channel hardening, the reliability of the link can be increased. In addition, the array gain allows to decrease the transmit power of the devices, or to extend the coverage. The impact of using an ULA in comparison to an URA in LoS and NLoS conditions is investigated. Our study demonstrates the feasibility of using massive MIMO at sub-GHz frequencies to support future LPWANs. These measurements enable further investigation of, e.g., precoding and scheduling algorithms for IoT devices.
VII Acknowledgment
We would like to thank Vladimir Volski for designing the patch antenna and our colleagues in Dramco for assisting us during the experiments.
References
- Choubey and Panah [2016] N. Choubey and A. Panah, “Introducing Facebook’s new terrestrial connectivity systems-Terragraph and Project ARIES,” Facebook Research, 2016.
- Jiang and Kaltenberger [2017] X. Jiang and F. Kaltenberger, “Demo: an LTE Compatible Massive MIMO Testbed based on OpenAirInterface,” in WSA 2017; 21th International ITG Workshop on Smart Antennas, 2017, pp. 1–2.
- Martinez et al. [2018] A. O. Martinez, J. Ø. Nielsen, E. De Carvalho, and P. Popovski, “An experimental study of massive MIMO properties in 5G scenarios,” IEEE Transactions on Antennas and Propagation, vol. 66, no. 12, pp. 7206–7215, 2018.
- Shepard et al. [2017] C. W. Shepard, R. Doost-Mohammady, R. E. Guerra, and L. Zhong, “ArgosV3: An Efficient Many-Antenna Platform,” in Proceedings of the 23rd Annual International Conference on Mobile Computing and Networking, 2017, pp. 501–503.
- Ghiaasi et al. [2019] G. Ghiaasi, J. Abraham, E. Eide, and T. Ekman, “Effective Channel Hardening in an Indoor Multiband Scenario,” International Journal of Wireless Information Networks, vol. 26, 07 2019.
- Malkowsky et al. [2017] S. Malkowsky, J. Vieira, L. Liu, P. Harris, K. Nieman, N. Kundargi, I. C. Wong, F. Tufvesson, V. Öwall, and O. Edfors, “The World’s First Real-Time Testbed for Massive MIMO: Design, Implementation, and Validation,” IEEE Access, vol. 5, pp. 9073–9088, 2017.
- Harris et al. [2015] P. Harris, S. Zang, A. Nix, M. Beach, S. Armour, and A. Doufexi, “A Distributed Massive MIMO Testbed to Assess Real-World Performance and Feasibility,” in 2015 IEEE 81st Vehicular Technology Conference (VTC Spring), 2015, pp. 1–2.
- Yang et al. [2017] X. Yang, W. Lu, N. Wang, K. Nieman, C. Wen, C. Zhang, S. Jin, X. Mu, I. Wong, Y. Huang, and X. You, “Design and implementation of a TDD-based 128-antenna massive MIMO prototype system,” China Communications, vol. 14, no. 12, pp. 162–187, 2017.
- Chen et al. [2017] C. Chen, V. Volski, L. Van der Perre, G. A. E. Vandenbosch, and S. Pollin, “Finite Large Antenna Arrays for Massive MIMO: Characterization and System Impact,” IEEE Transactions on Antennas and Propagation, vol. 65, no. 12, pp. 6712–6720, 2017.
- Saelens et al. [2019] M. Saelens, J. Hoebeke, A. Shahid, and E. De Poorter, “Impact of EU duty cycle and transmission power limitations for sub-GHz LPWAN SRDs: an overview and future challenges,” EURASIP JOURNAL ON WIRELESS COMMUNICATIONS AND NETWORKING, vol. 2019, no. 1, pp. 219:1–219:32, 2019. [Online]. Available: http://dx.doi.org/10.1186/s13638-019-1502-5
- Ngo and Larsson [2017] H. Q. Ngo and E. G. Larsson, “No Downlink Pilots Are Needed in TDD Massive MIMO,” IEEE Trans Wireless Commun, vol. 16, no. 5, pp. 2921–2935, May 2017.