11email: berta@iram.fr 22institutetext: Department of Physics and Astronomy, Rutgers, The State University of New Jersey, 136 Frelinghuysen Road, Piscataway, NJ 08854-8019, USA 33institutetext: Sorbonne Université, UPMC Université Paris 6 & CNRS, UMR 7095, Institut d’Astrophysique de Paris, 98b boulevard Arago, 75014 Paris, France 44institutetext: Jodrell Bank Centre for Astrophysics, Department of Physics and Astronomy, The School of Natural Sciences, The University of Manchester, Manchester M13 9PL, UK 55institutetext: School of Physics and Astronomy, Cardiff University, The Parade, Cardiff CF24 3AA, UK 66institutetext: Instituto Astrofísica de Canarias (IAC), E-38205 La Laguna, Tenerife, Spain 77institutetext: Universidad de La Laguna, Dpto. Astrofísica, E-38206 La Laguna, Tenerife, Spain 88institutetext: University of Cape Town, Department of Astronomy. Private Bag X3 Rondebosch, 7701 Cape Town, South Africa 99institutetext: Department of Physics and Astronomy, University of the Western Cape, Private Bag X17, Bellville 7535, Cape Town, South Africa 1010institutetext: Istituto Nazionale di Astrofisica, Istituto di Radioastronomia, via Gobetti 101, 40129 Bologna, Italy 1111institutetext: European Southern Observatory, Alonso de Córdova 3107, Casilla 19001, Vitacura, Santiago, Chile 1212institutetext: Department of Astronomy, Cornell University, Space Sciences Building, Ithaca, New York (NY) 14853, USA 1313institutetext: Max-Planck-Institut für Astronomie, Königstuhl 17, D-69117 Heidelberg, Germany 1414institutetext: Leiden University, Leiden Observatory, PO Box 9513, 2300 RA Leiden, The Netherlands 1515institutetext: Division of Particle and Astrophysical Science, Graduate School of Science, Nagoya University, Aichi 464-8602, Japan 1616institutetext: National Astronomical Observatory of Japan, 2-21-1, Osawa, Mitaka, Tokyo 181-8588, Japan 1717institutetext: European Southern Observatory, Karl-Schwarzschild-Strasse 2, D-85748 Garching, Germany 1818institutetext: Aix-Marseille Université, CNRS & CNES, Laboratoire d’Astrophysique de Marseille, 38, rue Frédéric Joliot-Curie 13388 Marseille, France 1919institutetext: University of California Irvine, Physics & Astronomy, FRH 2174, Irvine CA 92697, USA 2020institutetext: School of Physics and Astronomy, University of Nottingham, University Park, Nottingham NG7 2RD, UK 2121institutetext: Department of Astronomy, University of Maryland, College Park, MD 20742, USA 2222institutetext: Instituto Nacional de Astrofísica, Óptica y Electrónica, Astrophysics Department, Apdo 51 y 216, Tonantzintla, Puebla 72000 Mexico 2323institutetext: Instituto de Astrofísica e Ciências do Espaço, Tapada da Ajuda, Edifício Leste, 1349-018 Lisboa, Portugal 2424institutetext: Department of Physical Sciences, The Open University, Milton Keynes MK7 6AA, UK 2525institutetext: National Radio Astronomy Observatory, 520 Edgemont Road, Charlottesville VA 22903, USA 2626institutetext: Max-Planck-Institut für Radioastronomie, Auf dem Hügel 69, 53121 Bonn, Germany.
Close-up view of a luminous star-forming galaxy at
Exploiting the sensitivity of the IRAM NOrthern Extended Millimeter Array (NOEMA) and its ability to process large instantaneous bandwidths, we have studied the morphology and other properties of the molecular gas and dust in the starburst galaxy, H-ATLAS J131611.5+281219 (HerBS-89a), at z=2.95. High angular resolution () images reveal a partial diameter Einstein ring in the dust continuum emission and the molecular emission lines of (9-8) and . Together with lower angular resolution () images, we report the detection of a series of molecular lines including the three fundamental transitions of the molecular ion , namely , and , seen in absorption; the molecular ion seen in absorption (and tentatively in emission); two transitions of amidogen (), namely and seen in emission; and and/or seen in absorption. The NOEMA data are complemented with Very Large Array data tracing the emission line, which provides a measurement of the total mass of molecular gas and an anchor for a CO excitation analysis. In addition, we present Hubble Space Telescope imaging that reveals the foreground lensing galaxy in the near-infrared (). Together with photometric data from the Gran Telescopio Canarias, we derive a photometric redshift of for the foreground lensing galaxy. Modelling the lensing of HerBS-89a, we reconstruct the dust continuum (magnified by a factor ) and molecular emission lines (magnified by ) in the source plane, which probe scales of (or 800 pc). The and emission lines have comparable spatial and kinematic distributions; the source-plane reconstructions do not clearly distinguish between a one-component and a two-component scenario, but the latter, which reveals two compact rotating components with sizes of , that are likely merging, more naturally accounts for the broad line widths observed in HerBS-89a. In the core of HerBS-89a, very dense gas with is revealed by the emission lines and the possible absorption line. HerBS-89a is a powerful star forming galaxy with a molecular gas mass of , an infrared luminosity of , and a dust mass of , yielding a dust-to-gas ratio . We derive a star formation rate and a depletion timescale years. The and absorption lines, which trace low () density molecular gas, all have their main velocity component red-shifted by relative to the global CO reservoir. We argue that these absorption lines trace a rare example of gas inflow towards the center of a starburst galaxy, indicating that HerBS-89a is accreting gas from its surroundings.
Key Words.:
galaxies: high-redshift – galaxies: ISM – galaxies: star formation – gravitational lensing: strong – submillimeter: galaxies – radio lines: ISM1 Introduction
In the last two decades, surveys in the far-infrared and sub-millimeter wavebands have opened up a new window for our understanding of the formation and evolution of galaxies, revealing a population of massive, dust-enshrouded galaxies forming stars at enormous rates in the early Universe (see, e.g., Blain et al., 2002; Carilli & Walter, 2013; Casey et al., 2014; Hodge & da Cunha, 2020). In particular, the extragalactic imaging surveys done with the Herschel Space Observatory (Pilbratt et al., 2010), such as Herschel-ATLAS (Eales et al., 2010a), HerMES (Oliver et al., 2012), and PEP (Lutz et al., 2011), have increased the number of dust-obscured star-forming galaxies from hundreds to several hundred thousand. Together with other large-area surveys, like the all-sky Planck-HFI (Planck Collaboration et al., 2015a), the South Pole Telescope (SPT Carlstrom et al., 2011) cosmological survey (Staniszewski et al., 2009; Vieira et al., 2010) and the Atacama Cosmology Telescope (ACT) (Marsden et al., 2014; Gralla et al., 2020), we have today vast samples of luminous dusty star-forming galaxies (DSFGs) that are amongst the brightest galaxies in the Universe, including numerous examples of strongly lensed systems (e.g., Negrello et al., 2010, 2017; Cox et al., 2011; Bussmann et al., 2013; Spilker et al., 2014; Cañameras et al., 2015; Reuter et al., 2020) and rare cases of galaxies with intrinsic infrared luminosities, , and star formation rates (SFRs) in excess of , known as Hyper-Luminous Infrared Galaxies (HyLIRGs, see, e.g., Ivison et al., 1998, 2013, 2019; Fu et al., 2013; Oteo et al., 2016; Riechers et al., 2013, 2017).
Detailed follow-up studies of these galaxies to investigate their nature and physical properties require robust estimates of their distances. Due to the dust obscuration in these objects, searching for CO emission lines via sub/millimeter spectroscopy has proved to be the most reliable method for measuring accurate redshifts, an approach that has become more and more efficient thanks to the increased bandwidths of the receivers and backends, most notably at the NOrthern Extended Millimeter Array (NOEMA) and the Atacama Large Millimeter/submillimeter Array (ALMA) (e.g., Weiß et al., 2013; Fudamoto et al., 2017; Neri et al., 2020; Reuter et al., 2020, and references therein).
Using NOEMA, Neri et al. (2020) reported the results of a project whose aim was to measure robust spectroscopic redshifts for 13 bright Herschel-selected galaxies with , preferentially selecting lensed systems (Negrello et al., 2010). Reliable spectroscopic redshifts were derived for 12 individual sources, demonstrating the efficiency of deriving redshifts of high- galaxies using the new correlator and broadband receivers on NOEMA. Based on the success of this Pilot Programme, we started a comprehensive redshift survey of a sample of 125 of the brightest Herschel-selected galaxies (using the same selection criteria as above), the NOEMA Large Program z-GAL, whose main scientific goal is to further characterize the properties of luminous DSFGs in the early Universe. Interestingly, half of the sources in the Pilot Programme sample display CO emission line widths in excess of . Based on their estimated locations relative to the versus relationship of Harris et al. (2012), several of the sources are inferred to be gravitationally amplified, while a number of them appear to belong to the rare class of hyper-luminous infrared galaxies (Neri et al., 2020).
One of these galaxies, H-ATLAS J131611.5+281219 (hereafter HerBS-89a), at , displays a very strong 2-mm continuum (with a flux density ) and CO emission lines that are the broadest of the entire sample with a line width (FWHM) of . Both the 2-mm continuum and line emission were resolved by the imaging, with an extension of in the east-west direction. The corresponding infrared luminosity of HerBS-89a (between 8 and 1000 m in the rest-frame; uncorrected for amplification) is estimated to be , which suggested that HerBS-89a could be a HyLIRG.
In order to further explore the properties of HerBS-89a, we used NOEMA to perform high angular resolution observations at 1 mm. We observed, in addition to the underlying dust continuum, the emission lines of and ; the three lines of the ground state of the molecular ion , , and , which are for the first time reported together in a high- galaxy; the line seen in absorption (and tentatively in emission); seen in emission; and and/or seen in absorption, here also reported for the first time in a high- galaxy.
In HerBS-89a, the images of the molecular emission lines and the dust continuum reveal a partial diameter Einstein ring. All of the observed transitions of the molecular ions and are seen in absorption against the strong dust continuum. Together, the molecular emission and absorption lines allow us to probe simultaneously in HerBS-89a regions that have very different properties, ranging from the (very) dense molecular gas traced by , , and (overlapping with ), to the low fraction, diffuse gas traced in and the reservoirs of turbulent, cold and low-density molecular gas traced by , thereby providing a unique view at sub-kpc spatial resolution (in the source plane) of the physical properties and feedback activity in this high- system.
The NOEMA data are complemented by Hubble Space Telescope (HST) imaging that traces the foreground massive lensing galaxy in the near-infrared (using the F110W filter around ), and by optical/near-infrared data obtained with the Gran Telescopio Canarias (GTC) that provide constraints on the redshift of the lensing galaxy. In addition, we also present data obtained with the Karl G. Jansky Very Large Array (VLA) on the emission line, which allow us to derive the mass of molecular gas in HerBS-89a and give an anchoring point for an analysis of its CO spectral line energy distribution.
The structure of the paper is as follows. Section 2 describes the NOEMA, VLA, HST, and GTC observations, and the reduction of the respective data sets; Section 3 presents the main results, including the morphology of the source, the properties of the molecular emission and absorption lines and the underlying continuum; Section 4 describes the characteristics of the foreground lensing galaxy; Section 5 presents the lensing model and the morphology of HerBS-89a in the source plane; and Section 6 outlines the global intrinsic properties of the dust and molecular gas (derived from the CO and water emission lines) corrected for amplification, including the CO excitation. The molecular gas kinematics and the dynamical mass are reported in Sect. 7; the properties of the molecular absorption and emission lines other than CO and are outlined in Sect. 8; and a discussion of the gas inflow suggested by the red-shifted molecular absorption lines of and is presented in Sect. 9. Finally, Section 10 summarizes the main conclusions of this paper and outlines future prospects.
2 Observations and Data Reduction
2.1 NOEMA
We used NOEMA to target high-frequency molecular lines in HerBS-89a, redshifted into the 1-mm band. The observations were carried out under two separate projects.
The first project was a Discretionary Directorial Time (DDT) project, labelled E18AE (P.I.: R. Neri), observed on February 5, 2019 with ten antennas using the extended A-configuration, yielding an angular resolution of , for a total observing time of 4.3 hours on-source time. This project, which was specifically tailored to measure the and emission lines, also enabled the detection of two strong absorption lines of the molecular ion corresponding to the redshifted ground state transitions of and ( GHz and 971.803 GHz, respectively)111The adopted frequencies correspond to the strongest of the hyperfine transitions for the specific (Indriolo et al., 2015, and references therein)..
The second project, labelled W19DE (P.I.: S. Berta), was completed on March 30th, 2020 with ten antennas using the intermediate C-configuration, yielding an angular resolution of , for a total on-source observing time of 4.2 hours. This project was a follow-up of the DDT to measure the third ground state transition of ()11footnotemark: 1 and the ground state transition of the molecular ion ()222The rest frequency of the transition is taken from Müller (2010)..
Observing conditions were excellent for both projects with an atmospheric phase stability of 20o RMS and 0.8 mm of precipitable water vapor. The correlator was operated in the low resolution mode to provide spectral channels with nominal resolution of 2 MHz. The NOEMA antennas were equipped with 2SB receivers that cover a spectral window of 7.744 GHz in each sideband and polarization. For the first series of observations, we covered the frequency range from 244.9 to 252.6 GHz and 260.4 to 268.1 GHz; for the second series, the frequency ranges were from 209.4 to 217.1 GHz and 224.9 to 232.6 GHz.
The strength of the continuum in HerBS-89a at 1-mm ( - see Table 3) enabled phase self-calibration, which significantly improved the image fidelity and dynamic range both in the continuum and molecular line emission (see Sects. 3.1.1 and 3.1.2). The flux calibrator used in both projects was LkH101. The phase calibrator for the high-angular resolution project (E18AE) was 1308+326. The data were calibrated, averaged in polarization, mapped, and analyzed in the GILDAS software package. The absolute flux calibration is accurate to within 10% and the error on the absolute position of HerBS-89a is estimated to be .

2.2 VLA
The National Radio Astronomy Observatory’s (NRAO) VLA was used to observe the emission line in HerBS-89a when the array was in the C configuration. The observations are part of a larger project (program I.D.:VLA/20A-083 - P.I.: D. Riechers) whose goal was to measure the emission lines in the sample of Herschel-selected galaxies studied in Neri et al. (2020); the complete results of that project will be presented in a forthcoming paper (Stanley et al. in prep.). The data were acquired on March 22, 2020 under stable atmospheric conditions. The 0.9 cm Ka band receivers were tuned (1 GHz bandwidth per IF) to the expected frequency of the CO emission line, i.e., 29.1848 GHz based on the redshift determined by Neri et al. (2020), and to 38.499 GHz for the second baseband. In total, we observed for 1.6 hours (with 62 minutes on-source) recording MHz dual-polarization channels across a total bandwidth of 2 GHz, which was chosen to maximize line sensitivity while retaining as much bandwidth as possible. The 2 GHz bandwidth setup was used to maximize the potential for stacking of faint lines (for the entire VLA project), while at same time retaining sufficient spectral resolution (2 MHz, i.e. ) to finely sample the broad CO emission line of HerBS-89a. The 8-bit samplers were selected to maximize sensitivity. The source 3C286 was observed to determine accurate complex gain and bandpass correction solutions and was also observed to set the absolute scale flux density based on the Perley & Butler (2017) models; the pointing accuracy was checked regularly. The data were calibrated, averaged in polarization, mapped used natural baseline weighting and analyzed in the CASA (Common Astronomy Software Applications) package. The resulting line map has a spatial resolution of (P.A. ) and a rms noise level of over a band width of 0.13 GHz. The absolute flux scale is estimated to be accurate to within 10%.
| HerBS-89a | HerBS-89b | |||
|---|---|---|---|---|
| [mm] | [GHz] | mJy | Ref. | |
| Herschel | ||||
| 0.10 | 130.8 | – | (1,2) | |
| 0.16 | 136.2 | – | ” | |
| 0.25 | 71.85.7 | – | ” | |
| 0.35 | 103.45.7 | – | ” | |
| 0.50 | 95.77.0 | – | ” | |
| SCUBA-2 | ||||
| 0.85 | 52.84.3 | – | (3) | |
| NOEMA | ||||
| 1.14 | 263.3 | 22.330.04 | 0.660.04 | (4) |
| 1.21 | 248.3 | 19.220.04 | 0.550.04 | ” |
| 1.31 | 229.3 | 13.620.05 | 0.340.05 | ” |
| 1.41 | 212.4 | 11.310.04 | 0.250.04 | ” |
| 1.89 | 158.6 | 4.560.05 | 0.240.05 | (5) |
| 2.01 | 149.0 | 3.400.30 | ¡0.1 | ” |
| 2.09 | 143.2 | 3.020.04 | – | ” |
| 2.25 | 133.5 | 2.200.20 | – | ” |
| 2.69 | 111.5 | 1.100.08 | – | (5) |
| 2.89 | 103.7 | 0.830.05 | – | ” |
| 3.12 | 96.0 | 0.560.06 | – | ” |
| 3.40 | 88.3 | 0.440.06 | – | ” |
| VLA | ||||
| 7.89 | 38.0 | 0.147 | – | (4) |
| 10.34 | 29.0 | 0.065 | – | ” |
2.3 HST
HerBS-89a was observed with the in March 2012 as part of a cycle-19 SNAPshot proposal (program I.D.: 12488 - P.I.: M. Negrello), which aimed, amongst other goals, at characterising the nature of the putative lenses in a large sample of candidate lensing systems selected at 500 m in the Herschel extragalactic surveys. Observations were obtained with the Wide Field Camera 3 (WFC3) using the wide-J filter F110W (peak wavelength 1.15 m). The total exposure time is 252 seconds. Data were reduced using the Python AstroDrizzle package, with parameters optimised to improve the final image quality. The pixel scale of the Infrared-Camera is , but the image was resampled to a finer pixel scale of by exploiting the adopted sub-pixel dither pattern. The astrometry of the resulting image was calibrated by matching the positions of 11 stars from SDSS DR12 and 2MASS and is accurate to within .
2.4 GTC
HerBS-89a was observed with the GTC 10.4 m telescope in two observing runs (program ID: GTC03-19ADDT and GTC09-19ADDT; PI: H. Dannerbauer). First, optical imaging was obtained using the instrument OSIRIS on April 6th, 2019 . The observations were conducted in service mode under clear skies (although with non-photometric conditions), integrating for 10 minutes in the Sloan r-band filter with a seeing of . The field of view is and the pixel size . Standard procedures for data reduction and calibration of the raw images were performed with the IRAF data reduction package (Tody, 1986).
The second series of observations was performed on June 7th, 2020 using the visitor instrument HiPERCAM for a total observing time of 1.25 hours under average seeing conditions (). HiPERCAM is a quintuple-beam CCD imager enabling the five Sloan filter ugriz to be observed simultaneously over a field of view of with a pixel size of (Dhillon et al., 2018, and references therein). The HiPERCAM team designed a dedicated data reduction tool444http://deneb.astro.warwick.ac.uk/phsaap/hipercam/docs/html/ that applies standard procedures for the reduction and calibration of the raw images.
3 NOEMA and VLA Results
In this section, we describe the new data obtained on HerBS-89a, outline the properties derived from the NOEMA 1-mm high-angular resolution observations for both the continuum and the molecular emission and absorption lines (Sect. 3.1), and present the results on the emission line measured with the VLA (Sect. 3.3).
3.1 NOEMA Results
3.1.1 Continuum emission
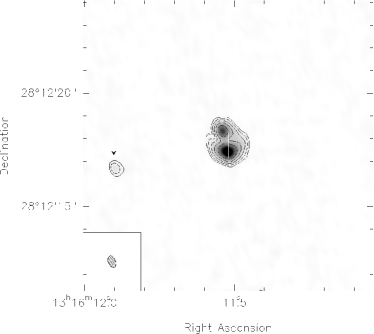
Figure 1 presents the two continuum maps of HerBS-89a obtained by merging the lower and upper side-bands of each set of observations, resulting in a high-angular resolution image centered at and a lower angular resolution image at . We reach a sensitivity of and Jy/beam in the two bands, respectively. Merging the two side-bands of the high-resolution continuum images improves the S/N ratio and resulted, by applying a uniform weight, in a final image with beam size of , to be compared to the achieved by the A-configuration that was used for these observations with natural weighting.
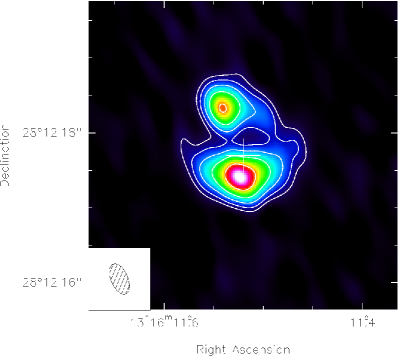
Figure 2 presents a zoom-in on this high-resolution continuum image of HerBS-89a. It displays an Einstein ring-like morphology, with a double source linked by weak arc structures, indicating that HerBS-89a is lensed. The high quality of the image reveals the details of the morphology of the dust continuum, such as the differences between the northern and southern continuum peaks as well as the weaker emission extending between them.
For the lower frequency data obtained using the medium-compact C-configuration of NOEMA, the source is only marginally resolved. Combining the data from the upper and lower side-bands resulted in a beam of .
To the east of HerBS-89a, the weak unresolved source (labeled HerBS-89b), which was already detected in 2-mm continuum by Neri et al. (2020), is detected in the 1.2-mm continuum emission in both images (Fig. 1), about east of the phase center of our observations. The detection reported here confirms the authenticity of this source. However, there is no corresponding source in the SDSS catalogue at that position. The faintness of HerBS-89b precludes the extraction of spectroscopic information from the available NOEMA data.
Continuum aperture flux densities have been measured for each side-band separately. Table 3 summarizes the values, both for HerBS-89a and the serendipitous source HerBS-89b, which is seen to be fainter than HerBS-89a. The effective frequencies of the adopted continuum bands and the statistical uncertainties on the flux densities are also provided. Note that the latter should be added in quadrature to the 10% absolute flux calibration uncertainty (see Sect. 2.1).
3.1.2 Molecular emission and absorption lines
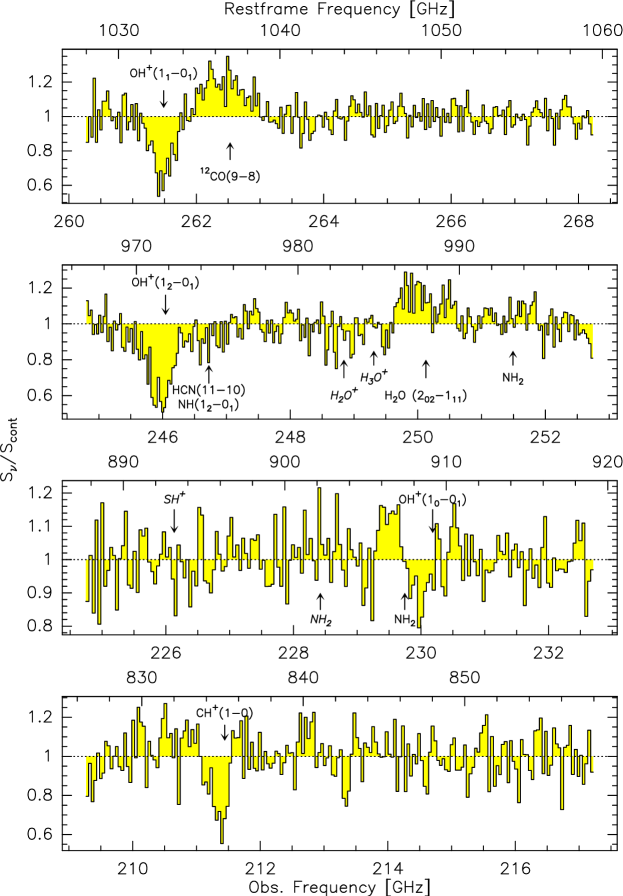
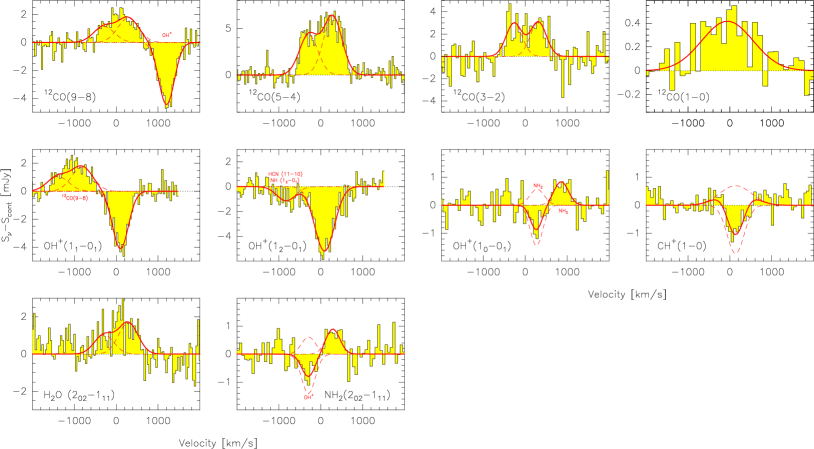
The large bandwidth of the NOEMA receivers allows us to search in HerBS-89a for redshifted emission and absorption lines over a wide range in frequency. The complete spectra of HerBS-89a, integrated over the areas subtended by the lines (see below) and normalized by the continuum, are displayed in Fig. 3. Each of the panels covers the frequency range of one sideband (LSB or USB) of one of the two observational projects discussed above, namely between 245 and 268 GHz (two upper panels) and between 209 and 233 GHz (two lower panels). Two strong molecular emission lines are present, and , which both display wide profiles similar to those seen in the and emission lines (Neri et al., 2020). In addition, the three lines of the ground state of the molecular ion are all detected in absorption: the line, which is adjacent in frequency to the emission line, and the and lines, which are detected for the first time in a high- galaxy. Blue-shifted from the strong absorption line, another weaker absorption line is detected that is due to ( GHz) and/or ( GHz) (see Sect. 8.1 for a detailed discussion). Next to the absorption line, another line is seen in emission, which corresponds to ( GHz). A second line is detected with lower signal-to-noise ratio at higher frequency, the transition at GHz. Finally, the molecular ion is detected in the ground transition, ; its profile is dominated by an absorption line that has a width similar to those of the absorption lines and at the same red-shifted velocity; in addition, a weak and broad () emission component is likely present, of which the extreme red and blue wings are detected at low signal-to-noise at either side of the absorption line.
Also identified in Fig. 3 are the positions of red-shifted molecular lines that fall within the observed frequency range but remained undetected in HerBS-89a, including: ( GHz), ( GHz), ( GHz), and ( GHz), most of which are seen in the spectrum of the local merger Arp 220 (Rangwala et al., 2011).
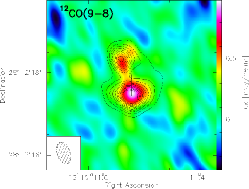
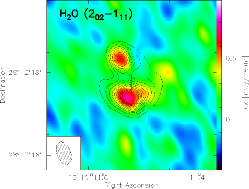
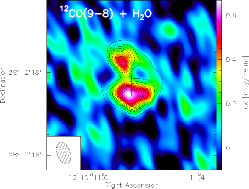
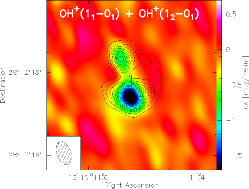
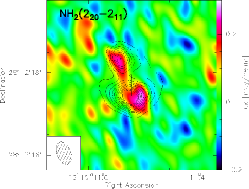
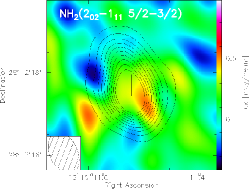
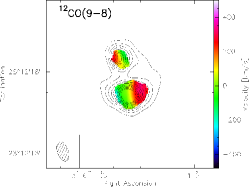
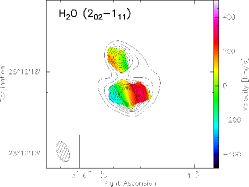
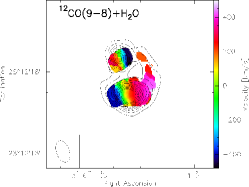
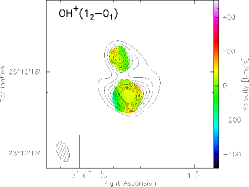
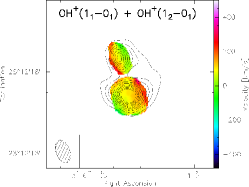
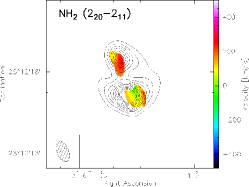
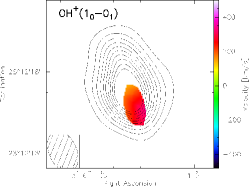
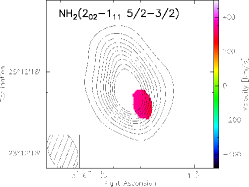
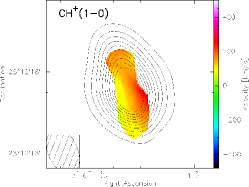
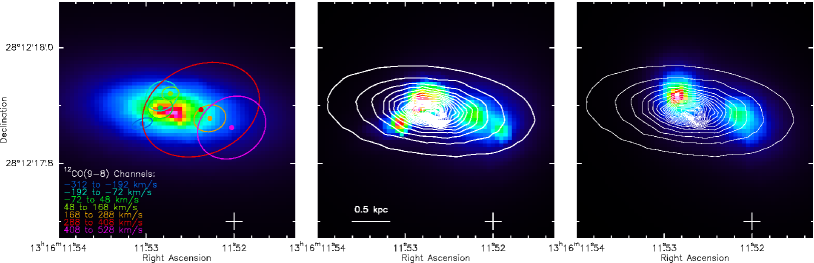
Figure 4 shows the angular extents of the eight molecular emission and absorption lines detected with NOEMA in HerBS-89a, each compared to the continuum extracted in the respective sideband to which it belongs. The and emission lines are detected in both lensed components of HerBS-89a, but are slightly shifted in position with respect to each other, with the water line being well centered on the continuum emission peaks. In order to recover more information on the distribution of the molecular emission lines, we combined the and velocity averaged images, under the assumption that they are probing roughly the same reservoir of high density and temperature molecular gas in HerBS-89a. The increased signal-to-noise ratio of the combined image (see upper right panel in Fig. 4) reveals the molecular emission to the west, joining the southern and northern peaks, and resembling the image of the dust continuum emission.
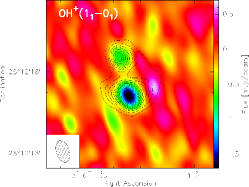
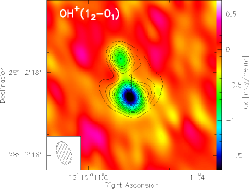
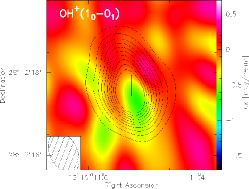
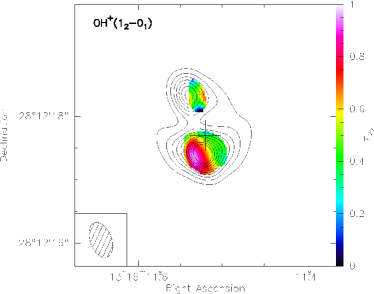
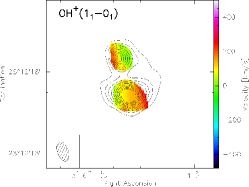
The two strong OH+ absorption lines detected in our higher angular resolution data, namely the and transitions, also coincide with the southern and northern peaks of the continuum emission. The combined and map, integrated between -400 and +400 from the line center in order to avoid contamination by neighboring lines (right panel in the second row of Fig. 4), further highlights this spatial coincidence.
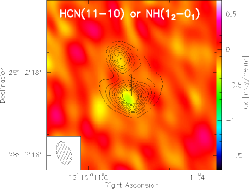
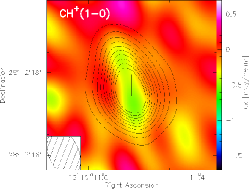
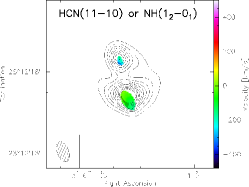
The faint absorption lines of our lower angular resolution data are detected mainly towards the southern component of HerBS-89a; the CH+ absorption seems to be more extended than the absorption. The image of the and/or absorption line shows two peaks exactly centered on the dust continuum emission peaks with no indication of emission extending further out. Finally, the emission line peaks westward of the continuum peak, as expected for red-shifted gas (see below).

In Fig. 5, we show the integrated spectra of all the individual molecular emission and absorption lines detected in HerBS-89a, including the and emission lines reported in Neri et al. (2020).
For the two low- CO emission lines, Neri et al. (2020) fitted each of the double-peaked line profiles with two Gaussian components, with identical widths () and central velocities shifted by from the nominal line frequency at the redshift of HerBS-89a () (Table 5). We adopt here the same approach for the , and emission lines, fixing their component velocities to the values found for and . We also force the two Gaussian components (of each line) to have the same width (see Table 5). For the emission line, the detection has too low S/N ratio to enable a reasonable fit and we therefore here report only upper limits to its line flux.
As mentioned above, the line seems to display weak emission features on both sides of the absorption line. The fit to the profile shows the overlapping deep absorption feature and the less-well defined, broad component seen in emission.
The absorption line displays strong, red-shifted absorption, whose profile is well reproduced by a narrow and deep absorption line, red-shifted by . Next to this absorption line, the broad weak absorption line, which corresponds to and/or , is centered at zero velocity and has a width of . As shown in Fig. 4, this broad absorption line is very concentrated spatially, peaking on the northern and southern peaks of the dust continuum emission.
The and lines are close to each other in frequency (i.e., 230.18 and 229.74 GHz, corresponding to a velocity difference of ). In the observed spectrum (Fig. 5) there is an apparent shift for both species to the red by with respect to their nominal frequencies. For the absorption, this shift is larger than for the two other transitions, and in the case of , the profile seems to be inconsistent with those seen for other molecular emission lines tracing dense gas (CO and ). Since (amidogen) is a photodissociation product of (ammonia), it should probe the dense gas traced in the high- CO or water lines, and therefore display a similar double Gaussian profile. However, we only see the red-shifted component of the double-peaked line profile, most likely because the blue-shifted part of the emission line has been entirely suppressed by the absorption line. We have therefore fitted simultaneously the overlapping absorption and emission lines using three Gaussian profiles, namely: i) two components for , where the velocities are derived from the and emission lines and the ratio of the blue and red peaks similar to that of the double Gaussian profile of the emission line; ii) one Gaussian for the absorption line whose width and the center velocity are derived from the narrow and deep absorption line. The fit shown in Fig. 5 reproduces very well the observed spectrum including the velocity shift described above.
Table 5 summarizes the results of the spectral line fitting. For each molecular line, the main properties of the best Gaussian fits are listed, including the central velocity and frequency, the full width at half maximum (FWHM), the integrated intensity, and the intrinsic frequency. All the uncertainties are propagated into the derived quantities.
| Molecule | Transition | FWHM | ||||||||||
| GHz | GHz | km s | km s | Jy km s | [] | |||||||
| Emission Lines | ||||||||||||
| 12CO | 115.271 | 29.186 | -57. | 6119.5 | 1443 | 293 | 0. | 640.13 | 25. | 765.23 | ||
| 345.796 | 87.549 | 0. | 0 | 1102 | 83 | 4. | 000.60 | 17. | 752.66 | |||
| 576.268 | 145.902 | 0. | 0 | 1028 | 107 | 8. | 400.80 | 13. | 421.28 | |||
| 1036.912 | 262.530 | 0. | 0 | 1168 | 94 | 1. | 780.21 | 0. | 880.10 | |||
| H2O | 987.927 | 250.127 | 0. | 0 | 1128 | 174 | 1. | 590.37 | 0. | 860.20 | ||
| NH2 | 907.433 | 229.747 | 0. | 0 | 972 | 237∗ | 0. | 640.27∗ | 0. | 410.17 | ||
| 993.322 | 251.493 | 0. | 0 | 0. | 33 | |||||||
| Absorption Lines | ||||||||||||
| OH+ | 1033.118 | 261.546 | 102. | 213.0 | 447 | 32 | -1. | 960.14 | ||||
| 971.804 | 246.026 | 91. | 620.1 | 558 | 51 | -3. | 080.28 | |||||
| 909.159 | 230.132 | 267. | 632.2 | 349 | 121 | -0. | 280.15∗∗ | |||||
| CH+ | 835.137 | 211.419 | 137. | 612.6 | 354 | 108∗∗∗ | -0. | 390.09∗∗∗ | ||||
| HCN | 974.487 | 246.724 | 0. | 0 | 523 | 239 | -0. | 630.28 | ||||
| NH | 974.471 | 246.720 | 0. | 0 | 523 | 239 | -0. | 630.28 | ||||
∗ Combination of the two Gaussian components.
∗∗ Only the visible red component.
∗∗∗ Net absorption only.
† The two transitions are and , respectively. In the case of the latter transition, we provide a upper limit.
‡ In the case of the absorption line observed at 246.72 GHz, we here provide the derived properties for HCN and NH separately, noting that both molecules likely do contribute to the observed absorption (see Sect. 8.1).
| Line | V | |||
|---|---|---|---|---|
| km s | km s | cm | ||
| to | ||||
| to | ||||
| to | ||||
| to | ||||
| to | ||||
| to |
3.2 Optical depths and column densities of lines seen in absorption
The optical depth of an absorption line () can be evaluated from the observed spectrum normalized by the continuum as follows
| (1) |
where is the flux density of the spectrum and that of the continuum only. The optical depth is evaluated at the central frequency of the line. Table 6 reports the values of obtained from the integrated spectra shown in Fig. 3, i.e., averaged over the angles covered by the lines on the sky. In the case of the two strongest absorption lines (the and transitions), maps of the opacity are displayed in Fig. 6.
Using Eq. 1 and the continuum-normalized spectra, we compute “optical depth spectra” that describe the variation of along the absorption lines, as a function of frequency or velocity. The column density of the absorption line is derived by integrating over the velocity range of the line along the line of sight (e.g., Comito et al. 2003; see also Indriolo et al. 2015; 2018):
| (2) |
The quantity and the speed of light can be expressed in units of cm s, and the transition frequency in Hz (see Table 5 for the corresponding frequencies of each line), so that is directly computed in units of cm. The quantities and are the lower and upper state statistical weights, and is the spontaneous emission coefficient. We compute the column density for the strongest of the hyperfine transitions for the specific rotational , and we assume that nearly all molecules are in the ground rotational state. The values of the statistical weights and the emission coefficients are taken from the Cologne Database for Molecular Spectroscopy (CDMS; Müller et al., 2005).
Table 6 summarizes the results for the absorption lines observed in HerBS-89a, i.e, the three transitions, and the absorption line observed at 246.72 GHz that is due to and/or , listing the velocity integration ranges, the integrated optical depths, and the column densities. Uncertainties are computed from the dispersions of the spectra, via standard error propagation.
3.2.1 Velocity fields
Detailed views on the dynamics of HerBS-89a are presented in Fig. 7, which displays the velocity fields of all the molecular emission and absorption lines detected in this source. The emission lines of and show similar, regular east-west velocity gradients, from blue to red along the southern arc, and reversed in the northern peak, as expected from gravitational lensing (see Sect. 5). The combined image of the and emission lines reveals further details, in particular the velocity distribution along the western arc. The velocity field of these dense gas tracers is consistent with the presence of kinematically distinct components that could indicate a merger system, or with a single rotating disc-like structure (see Sect. 7). The main peaks of the three and one absorption lines are seen to be red-shifted across most of the continuum (Fig. 7). Finally, the red-shifted component of the emission line is clearly seen west of the continuum peak, as expected from the velocity field revealed in the higher angular resolution data for the and emission lines.
3.3 VLA Results: The 12CO(1-0) emission line
Figure 5 shows the VLA emission line spectrum, resampled to a velocity resolution of to highlight the key properties of the line profile. Because of the limited S/N ratio, we fit the observed line with a single Gaussian profile. The position of the emission line is consistent with the nominal redshift of HerBS-89a. Its FWHM is , comparable to those of the three high- CO emission lines, and the observed total line intensity is (Table 5).
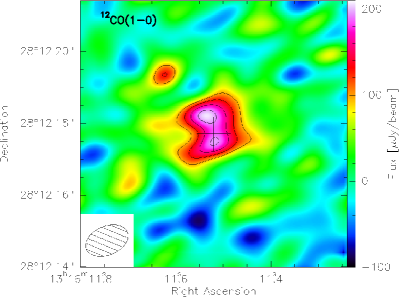
The emission line map, which is shown in Fig. 8, was obtained by integrating the VLA data cube between and relative to the frequency of at . The line emission is slightly resolved and displays an east-west extension, similar to what is observed in the other CO lines for which the emission has been resolved (i.e., the and lines). It is noteworthy that, contrary to what is seen in the and dust continuum emission, the northern component in appears slightly stronger than the southern component; however, the difference is at a level. If confirmed, this inconsistency may be the result of differential magnification and indicate that the molecular gas reservoir traced in is more extended than that traced by the high- CO and water transitions (see Sect. 5 for a detailed discussion).
Due to the limited sensitivity of the VLA data, the underlying continuum of HerBS-89a was not detected. We measure an r.m.s. of and in the continuum maps at 29 GHz (band width 0.74 GHz) and 38 GHz (band width 0.93 GHz) in the observed frame, with beam sizes of and , respectively.
4 The foreground lensing galaxy
In this section, we derive the characteristics of the foreground lensing galaxy from the near-infrared HST image and the GTC photometry, supplemented by NOEMA data.
4.1 Imaging results (HST)
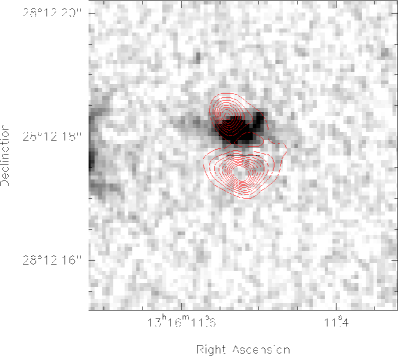
Figure 9 displays the HST wide- filter F110W image (at ) towards HerBS-89a compared to the 1.2 mm dust continuum emission. The HST image reveals a galaxy along the line of sight to HerBS-89a, which lies close to its northern component but is offset by southwest from the northern dust continuum peak. The lensed galaxy itself remains undetected in the HST image. The near-infrared emission of the foreground lensing galaxy is resolved in the HST image. It is dominated by a bright bulge-like structure. It also displays a weak emission that extends in the east-west direction and that could resemble a disk. A bright spot to the North-West of the spheroidal component seems to wrap around the northern peak of the dust continuum, and could be a small satellite galaxy. From the HST data, the foreground galaxy has an estimated flux density of at 1.15 m.
4.2 Photometric redshift (GTC)
The foreground lensing galaxy is also detected in our GTC OSIRIS -band imaging with a magnitude AB mag. The deeper imaging with HiPERCAM detects the foreground galaxy in the griz bands, while in the band the object remains undetected. The target lies very close to a bright () point-like object, to the east, and the photometric measurement needs to take properly into account the wings of the bright neighbor.
The HiPERCAM maps were calibrated on SDSS DR12 stars present in the field. The code GALFIT (Peng et al., 2002) was used to subtract the profile of the bright point-like nearby object using a model PSF. Aperture photometry was performed on the residual image to measure the emission of the target lensing galaxy. Uncertainties were derived measuring the noise level in an annulus around the object, thus taking into account the presence of the nearby source. Finally, systematic zero-point uncertainties were propagated in the estimate of the magnitude uncertainties. Table 8 lists the derived magnitudes and the 3 band upper limit in the AB system (Oke & Gunn, 1983).
The foreground galaxy is also detected by WISE (Wright et al., 2010) at 3.4 and 4.6 m. However, the WISE photometry likely includes contributions from the lensing galaxy, the lensed HerBS-89a galaxy, and the nearby bright point-like source. Because of the broad WISE beam ( at 3.4 m), it is impossible to disentangle the different components. Therefore only the GTC and HST data points have been retained in this analysis.
At it is far from easy to obtain an optical spectroscopic redshift, but thanks to the sensitivity of HiPERCAM and the capability to observe simultaneously the five bands, together with the HST F110W imaging results, it is possible to derive an photometric redshift.
To get the best possible result, and test systematics due to the chosen method, we applied various photometric redshift codes EAZY (Brammer et al., 2008), Hyper-z (Bolzonella et al., 2000), Le PHARE (Arnouts et al., 1999; Ilbert et al., 2006), and MAGPHYS-z (da Cunha et al., 2008; Battisti et al., 2019) to the ugriz and F110W data, adopting different template libraries (Coleman et al., 1980; Bolzonella et al., 2000; Berta et al., 2003, 2013; Babbedge et al., 2004; Polletta et al., 2007; Brammer et al., 2008; Ilbert et al., 2009; da Cunha et al., 2015). Since it best accounts for the upper limits, the final choice is the Le PHARE code.
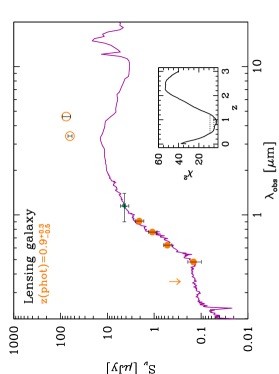
The best photometric redshift of the foreground lensing galaxy thus obtained is , with a 99% confidence interval of . The best fit solution is obtained with a SB spiral template from the COSMOS library (Ilbert et al., 2009), originally belonging to the SWIRE library (Polletta et al., 2007). Figure 10 shows the best fit model together with the distribution. The photometric redshift is best constrained by the color, tracing the D4000 break777The 4000 Å discontinuity is defined as the ratio between the average flux density between 4050 and 4250 Å and that between 3750 and 3950 Å (Bruzual A., 1983).. The lack of rest-frame near-infrared coverage and the upper limit in the band restrict the accuracy of the photo- measurement. Deeper data and a wider wavelength coverage would be necessary to improve its precision.
In addition, various attempts were made using templates that include emission lines (e.g. Babbedge et al., 2004), with the aim to verify if the and F110W bands could be contaminated by lines at , namely Oii () and H (), but none produced a better fit to the data.
| Band | mag | Flux Density | Instrument | |
| m | AB | [Jy] | ||
| 0.36 | 25.0 | 0.36 | GTC HiPERCAM | |
| 0.48 | 26.00.3 | 0.150.05 | ” | |
| 0.64 | 24.50.3 | 0.630.06 | GTC OSIRIS | |
| 0.63 | 24.60.2 | 0.530.11 | GTC HiPERCAM | |
| 0.77 | 23.80.2 | 1.100.22 | ” | |
| 0.91 | 23.10.2 | 2.090.42 | ” | |
| F110W | 1.15 | 22.30.2 | 4.360.88 | HST WFC3 |
| W1 | 3.35 | 19.40.1 | 63.16.1 | WISE |
| W2 | 4.60 | 19.20.2 | 75.915.3 | ” |
4.3 Spectroscopic redshift (NOEMA)
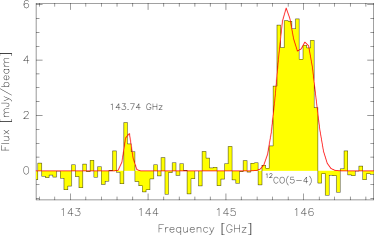
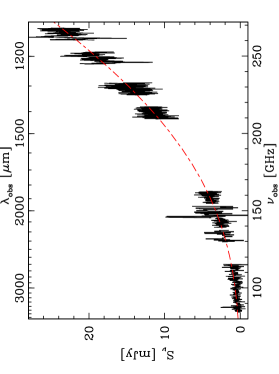
An independent indication of the redshift of the lensing foreground can possibly be derived from the 2-mm spectral scan that was obtained to derive the spectroscopic resdhift of HerBS-89a in Neri et al. (2020). In the frequency range 139.3 to 147.0 GHz, where the emission line of HerBS-89a was detected, a weaker narrow () emission line is seen at 143.74 GHz, close to the center position of HerBS-89a (see Fig. 11). The narrowness of this emission line excludes the possibility that it could be related to HerBS-89a. If it traces instead the foreground lensing galaxy, the line could correspond to a emission line, either detected in the transition, in which case , or in the transition for which . The former is consistent within the uncertainties with the photometric redshift derived from the GTC and HST data. A search for the counterpart of this emission line (at 1-mm) could allow us to verify the above identification, and eventually derive a precise spectroscopic redshift of the foreground galaxy gravitationally amplifying HerBS-89a.
| Parameter | Value | Uncertainties | |
|---|---|---|---|
| 1 | Systematic | ||
| Ref. Point (RA) | 13:16:09.79 | – | – |
| Ref. Point (Dec) | 28:12:18.17 | – | – |
| Position RA | -00612 | 0.0005 | |
| Position Dec | -00989 | 0.0008 | |
| Einstein Radius | 04832 | 0.0006 | 0.0483 |
| Ellipticity | 0.177 | 0.002 | 0.018 |
| Position Angle | 32∘4 | 0.4 | 3.2 |
| Tracer | RA | Dec | |||||||
|---|---|---|---|---|---|---|---|---|---|
| [Jy/beam] | [mas] | [deg] | [mas] | [pc] | |||||
| Continuuma | 0.160.01 | -1.90.2 | -277.80.4 | 0.5220.007 | -97.40.4 | 121 | 958 | 1.820.04 | 5.050.03 |
| syst. unc. | (0.02) | (9.5) | (9.5) | (0.052) | (9.7) | (1.0) | (10.0) | (0.18) | (0.51) |
| 0.30 | -9.6 | -254.5 | 0.408 | -92.8 | 0.4 | 3.0 | 3.21 | 5.23 | |
| syst. unc. | (0.03) | (11.2) | (11.2) | (0.041) | (9.3) | (0.1) | (1.0) | (0.32) | (0.52) |
| 0.010 | 15.35 | -248.3 | 0.189 | 87.8 | 0.8 | 5.9 | 4.08 | 5.0 | |
| syst. unc. | (0.001) | (45.0) | (45.0) | (0.019) | (8.8) | (0.1) | (0.6) | (0.41) | (1.0) |
| 0.008 | -19.1 | -312.4 | 0.559 | -79.7 | 50.0 | 396.0 | 1.50 | 3.87 | |
| syst, unc. | (0.001) | (22.5) | (22.5) | (0.056) | (8.0) | (5.0) | (40.0) | (0.15) | (0.39) |
| 0.044 | -3.3 | -287.1 | 0.045 | -23.9 | 26.0 | 206.0 | 0.861 | 4.69 | |
| syst. unc. | (0.004) | (7.0) | (7.0) | (0.005) | (2.4) | (3.0) | (24.0) | (0.086) | (0.47) |
| 0.042 | -2.7 | -314.1 | 0.271 | -68.6 | 29.0 | 230.0 | 1.113 | 4.24 | |
| syst. unc. | (0.004) | (9.4) | (9.4) | (0.027) | (6.9) | (3.0) | (24.0) | (0.111) | (0.42) |
5 Lens Modelling
In order to recover the source-plane morphology and the intrinsic properties of HerBS-89a, we derive a lens model from the high-angular resolution NOEMA continuum data as shown in Fig. 2 (with initial lens parameters informed by HST observations) and proceed to apply it to the molecular line data. We perform the lens modelling and source reconstruction using the lensmodel package (Keeton, 2001) with the pixsrc extension (Tagore & Keeton, 2014; Tagore & Jackson, 2016). For the sake of computational efficiency, all modelling has been done in the sky plane, although we recognize that fitting directly to visibility data can prevent specific choices in the interferometric imaging process (e.g., related to weighting and deconvolution) from having undue impact on a model. Although the quality of our NOEMA observations is excellent, the limited number of resolution elements across the source prevents us from leveraging the full power of the non-parametric approach of Tagore & Keeton (2014), instead limiting us to the use of parametric (Sérsic profile) components in reconstructing the sources.
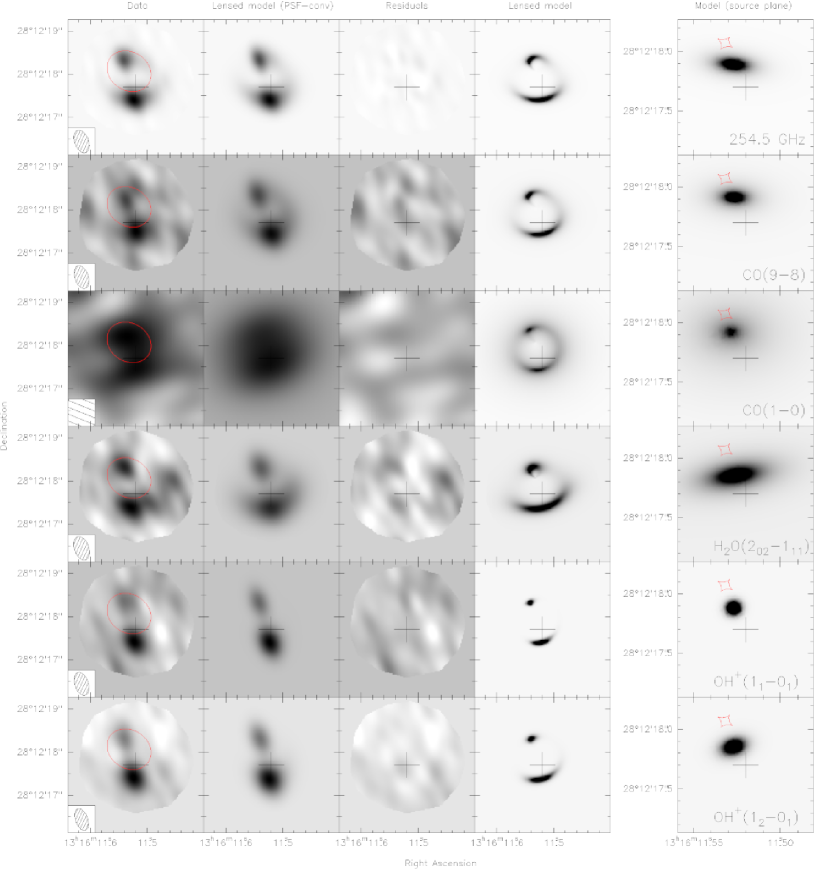
Because we are not using regularization to guide the reconstruction of non-parametric sources, correlations in the noise introduced by the finite sampling do not require special handling à la Riechers et al. (2008). In all cases, we convolve the lensed model images (fourth column of Fig. 12) with the appropriate (two-dimensional Gaussian) synthesized beams to generate the reconstructed model images (second column of Fig. 12) that are directly compared to the data.
The foreground deflector is assumed to have a singular isothermal elliptical mass distribution (SIEMD) described by five parameters: Einstein radius (), R.A., Dec., ellipticity (),111111Ellipticity is defined as , where is the axis ratio. and ellipticity position angle (; measured east of north). Table 9 lists the best fit values of these parameters and their uncertainties as determined from a Markov chain Monte Carlo (MCMC) exploration of parameter space. The position of the lens is given relative to the reference position RA=13:16:09.79 and Dec=28:12:18.17. Because of the very high S/N of the continuum data, we use the lens model derived from the continuum data when reconstructing the spectral line data.
The left panels of Fig. 12 include the critical curve (i.e., the locus of infinite magnification in the image plane; red lines). In the case of a SIEMD with no external shear, this curve is also an iso-density contour of the deflector’s mass distribution whose position and geometry can be compared to the HST image of the lensing galaxy (Fig. 9). The corresponding source-plane caustic is plotted in the right panels of Fig. 12.
The continuum and (almost) all of the spectral line zeroth moment maps are fit well by single Sérsic components in the source plane (see Table 10 and Fig. 12 for fitting results, and below for more discussion of the line data). The profile is parametrized in terms of its position, normalization , ellipticity , position angle , scale radius , and Sérsic index :
| (3) |
Using the estimated photometric redshift of the foreground galaxy and its uncertainty (see Sect. 4.2), we estimate that the deflector mass enclosed within the Einstein radius is M⊙ (where the upper and lower bounds are at 3).
Statistical uncertainties in the lens and continuum source model were evaluated with two MCMC cycles. The first fixed the source model and determined the uncertainties of the lens parameters; the second fixed the lens model to its optimal parameters and let the source parameters vary. This approach was chosen for computing speed and for ease of comparison between continuum and line results (because the latter assume the lens model derived from the continuum data, i.e., the lens model is fixed in this case). However, it should be noted that the MCMC approach underestimates the lenssource errors. Appendix A presents the conditional posterior distributions of the lens and source model parameters.
To these statistical uncertainties, we add fiducial systematic uncertainties of 10% associated with the choices of lensing potential, source brightness profile, interpolation errors, etc. The only exceptions are the source model positional errors, for which we adopt systematic uncertainties given by
| (4) |
in terms of the synthesized beam dimensions and , the S/N of the observed detection , and the magnification (see, e.g., Downes et al., 1999). For the lens model, we estimate systematic positional errors as the astrometric errors from the continuum imaging. Because we expect systematic errors to dominate and because of computational constraints, we do not perform MCMC on the line spectral source parameters.
As mentioned above, nearly all of the spectral line data are fit well by single Sérsic components; the exception is the H2O() zeroth-moment map, which shows faint (, compared to the peak) emission to the west and northwest that motivated some exploration of a two-component model. We adopt here a single-component fit for this line, due to numerical instability in the two-component fit, but note that there are some systematic features in the residuals associated with the peak of the emission. The results are listed in Table 10, along with the corresponding magnification factors , for the high resolution data and for . Because of the lower resolutions and S/N ratios, we do not model the spectral lines and continuum that were measured at lower frequencies (from 209 to 232 GHz).
The magnification factor for the continuum and line data was computed using samples from the lens and source parameter MCMC runs. We estimate a magnification of for the 254.6 GHz dust continuum emission, where the term in parentheses represents the 10% systematic uncertainty.
In the case of the line, we infer a lensing magnification , with a large systematic uncertainty mainly due to possible different choices in how the zeroth-moment map is derived (also reflecting the limited S/N of the current data set). Deeper and higher angular resolution observations of the emission would be helpful to better constrain the amplification factor as well as to study in greater detail the morphology (extent and kinematics) of the cold gas reservoir of HerBS-89a.
6 Global properties of HerBS-89a: dust and molecular gas
In this section, we derive the intrinsic properties of HerBS-89a from the new millimeter, centimeter, and optical/near-infrared data presented in Sect. 3, and the lensing model described in Sect. 5. The discussion is organized as follows: the analysis of the continuum spectral energy distribution and the derivation of the molecular gas mass and dust-to-gas ratio are described in Sections 6.1 and 6.2; the CO line excitation is investigated in Sect. 6.3, and the properties of the water emission line are examined in Sect. 6.4.
6.1 Continuum Spectral Energy Distribution
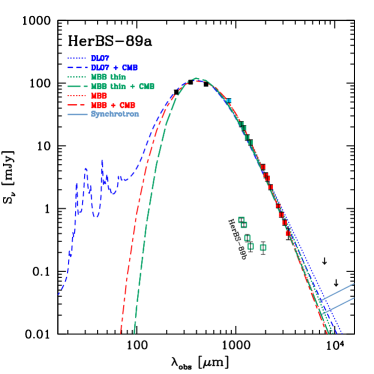
The new NOEMA continuum measurements (see Table 3), combined with the data from Neri et al. (2020) and Herschel and SCUBA-2 photometry (Bakx et al., 2018, 2020), provide an exquisite sampling of the far-infrared (FIR) and sub-mm spectral energy distribution (SED) of HerBS-89a. A total of 16 broad band measurements cover the range from 250 to 3 mm in the observed frame, 12 of which are spread along the Rayleigh-Jeans tail.
Figure 13 shows the continuum data available for HerBS-89a as well as the continuum measurements extracted for the nearby source HerBS-89b. The latter source shows an increase of flux at wavelengths above with respect to the dust emission, which could be due to non-thermal processes and rules out the possibility that HerBS-89b is a third lensed image of HerBS-89a.
Following and extending the work by Neri et al. (2020) and Berta et al. (2016), we model the SED of HerBS-89a using three different approaches: i) the Draine & Li (2007, hereafter DL07) dust model; ii) a single-temperature modified black body (MBB) in the optically-thin approximation; and iii) an MBB model in its general form.
In the case of the DL07 modelling, interstellar dust is described as a mixture of carbonaceous and amorphous silicate grains, whose size distributions are chosen to reproduce different observed extinction laws. We defer to Draine & Li (2001, 2007), Li & Draine (2001), and Berta et al. (2016) for a detailed description of the model and its implementation. Despite the richness of the long-wavelength data, the SED is still lacking measurements in the mid-infrared, so that the fine details of the DL07 model, e.g., the possible contribution of the polycyclic aromatics hydrocarbons (PAHs), are not constrained. The dust mass estimate is nevertheless robust, because it is dominated by the colder dust components.
For the optically thin MBB case, the emergent luminosity from a given dust mass is described as:
| (5) |
where is the Planck function, is the dust temperature, and is the mass absorption coefficient of dust at rest frequency .
The general form of the MBB differs from the optically thin approximation by the factor , with , instead of the term. Here is the frequency at which (see Berta et al., 2016). Therefore, the general form of the MBB tends to produce best fit solutions with higher dust temperature than the optically thin case. In the optically thin approximation, three free parameters are at play: , and the model normalization. In the general form, is also a free parameter.
The MBB fits are limited to the data with rest-frame wavelength ¿ m, thus avoiding biases towards warmer temperatures. The effects of the cosmic microwave background (CMB) have been taken into account, following the prescription of da Cunha et al. (2013). A correction similar to that derived for the MBB has also been applied to the DL07 model.
Berta et al. (2016) and Bianchi (2013) present thorough discussions of the proper use of and . Appendix B summarizes the current panorama. Following the choice often found in the literature, we adopt the Draine (2003) and apply the correction prescribed by Draine et al. (2014): m2 kg-1 at 850 m. The same correction is also applied to the dust masses derived with the DL07 approach.
The best fit models are shown in Fig. 13, and the results are listed in Table 12. We include all the values obtained with our fits using the continuum flux densities not corrected for the lens magnification, as well as our preferred source-plane values for the infrared luminosity and the dust mass based on the DL07 fit corrected for gravitational magnification (see Sect. 5). The CMB effect produces a steepening of the millimetric slope by , comparable to the uncertainty on . At the redshift and for the dust temperature of HerBS-89a, the effect is milder than what found at by Jin et al. (2019).
Finally, the VLA 3 upper limits for HerBS-89a that are shown in Fig.13 have been computed over an area equivalent to the NOEMA 263.3 GHz continuum (see Table 3). For comparison, a power-law spectrum is plotted, representing a synchrotron emission (e.g. Ibar et al., 2010; Thomson et al., 2014), normalized on the basis of the radio-far-infrared correlation (Magnelli et al., 2015; Delhaize et al., 2017).
| Quantity | Value | Units | |
|---|---|---|---|
| DL07 model | |||
| (2.89 | 0.25) 1013 | ||
| (1.30 | 0.07) 1010 | ||
| Optically thin MBB | |||
| 28.0 | 1.3 | K | |
| 2.01 | 0.11 | – | |
| (1.94 | 0.08) 1013 | ||
| (1.11 | 0.06) 1010 | ||
| MBB in general form | |||
| 49.2 | 2.7 | K | |
| 2.24 | 0.13 | – | |
| 1214 | 121 | GHz | |
| 247 | 24 | m | |
| (2.00 | 0.08) 1013 | ||
| (6.06 | 0.71) 109 | ||
| De-magnified values from DL07 | |||
| (4.6 | 0.4) 1012 | ||
| (2.6 | 0.2) 109 | ||
6.2 Molecular gas mass and gas-to-dust ratio
The observed emission line intensity can be translated into a luminosity (in ), from which an estimate of the molecular gas mass can be made, using the following relation (Solomon & Vanden Bout, 2005):
| (6) |
where is the integrated line flux in units of ; is the line rest frequency in GHz; and is the luminosity distance in Mpc.
The line luminosity, expressed in units of , can be derived as:
| (7) |
We define the molecular and total gas masses as
| (8) |
| (9) |
where is the mass of helium, is the mass of molecular hydrogen and the mass of atomic hydrogen. Hereafter, we will assume that and thus that .
The molecular hydrogen gas mass is computed from the luminosity applying a conversion factor in units of (K km s-1 pc2)-1:
| (10) |
In the Milky Way and nearby star-forming galaxies with near-solar metallicity, the empirical conversion factor is , already including a contribution due to helium (see, e.g., Magnelli et al., 2012; Bolatto et al., 2013; Carilli & Walter, 2013; Tacconi et al., 2020). For extreme local starbursts, there is good evidence from dynamical arguments that is 0.8–1.5 (e.g., Downes & Solomon, 1998; Daddi et al., 2010; Genzel et al., 2010), as has also been suggested that for DSFGs for which =0.8 (Carilli & Walter, 2013). Applying a correction factor to account for the helium contribution, the latter value becomes . Dunne et al. (2020) used the far-infrared continuum of a small but statistically complete sample of 12 low redshift galaxies together with CO and CI measurements to determine the conversion factor . In another paper, Dunne et al. (in prep.) combined this sample will others measurements found in the literature for a total of more than 70 far-infrared and sub-mm selected galaxies with CO and CI detection and 230 with CO only. In these studies, a value of m2 kg-1 is adopted (in agreement with the results by Planck Collaboration et al., 2011, see Appendix B for details.) and it is found that a value is consistent with the behaviour of the three gas tracers in a diverse population of galaxies, ranging from high- powerful star-forming galaxies to local disks.
For the computation of the molecular gas mass of HerBS-89a, we here adopt (K km s-1 pc2)-1, and we multiply it by the usual factor 1.36 to account for the helium contribution. Possible consequences of using a different value are discussed at the end of this Section.
The resulting line luminosity and molecular gas mass, corrected for lensing magnification, are thus
| (11) |
| (12) |
The molecular gas mass derived from the emission line and the SED-based estimate of the dust mass (see Sect. 6.1) provide the basis for deriving the average gas-to-dust ratio () in HerBS-89a:
| (13) |
where the assumption is made that the two estimates are representative for the whole galaxy, and that .
The data lead to a value of between 80 and 174, depending on whether the DL07 or the MBB (general form) dust mass estimate is used, with an uncertainty of 21 based on error propagation. Interestingly, this value is consistent within the errors with those seen in typical star-forming galaxies of solar metallicity, near the so-called “Main Sequence of star formation” (MS), for which (e.g., Leroy et al., 2011; Magdis et al., 2012; Rémy-Ruyer et al., 2014). This result is nevertheless subject to the adopted value for
The total molecular gas mass () and SFR relate to each other via the so-called depletion timescale (in years):
| (14) |
where the rate of star formation is computed as with the infrared luminosity expressed in units of (Kennicutt et al. 1998a, after modification for a Chabrier et al. 2003 IMF).
Assuming that the observed infrared luminosity is entirely associated with the ongoing star formation activity of HerBS-89a, we derive an intrinsic star formation rate and a depletion timescale years. For its current formation rate, HerBS-89a would exhaust its molecular gas reservoir in only 340 million years, not considering any mass return to the interstellar medium or further gas inflow (see Sect. 9).
The value for M was derived from the luminosity using , a value that is close to the Milky Way value (K km s-1 pc2)-1, commonly used for MS galaxies, rather than , often associated to starbursts or outliers in the main sequence. This choice leads to and values that would position HerBS-89a close to or on the MS star-forming galaxies on the integrated Kennicutt-Schmidt relation of star formation (e.g., Lada, 2015; Liu et al., 2019), which suggests that HerBS-89a is dominated by a “secular” star-forming mode.
However, despite the evolution of the MS normalization (increasing as a function of redshift, e.g., Elbaz et al., 2011; Whitaker et al., 2014; Schreiber et al., 2015), and because of the bending of the MS at the high stellar mass end, even at , a yr-1 would hardly be associated with a galaxy on the main sequence. It is therefore more likely that HerBS-89a is located in between the MS and the starbursts region. Using , the gas-to-dust ratio and the depletion time scale of HerBS-89a would both decrease by a factor of 3.74, yielding and yr. Realistically, the actual value of , on which these results depend, is likely between the two above mentioned extremes.
Further insights into the position of HerBS-89a with respect to the MS would require the knowledge of its stellar mass . Detecting HerBS-89a and distinguishing it from its deflector seem out of reach for currently existing optical/NIR facilities, but the James Webb Space Telescope (JWST) could provide the needed sensitivity.
6.3 CO Spectral Line Energy Distribution
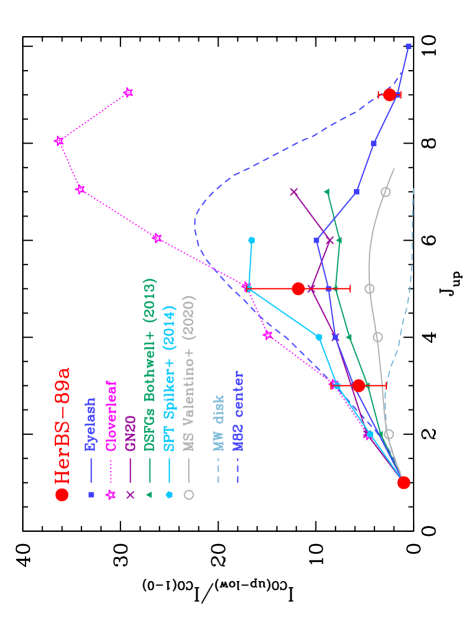
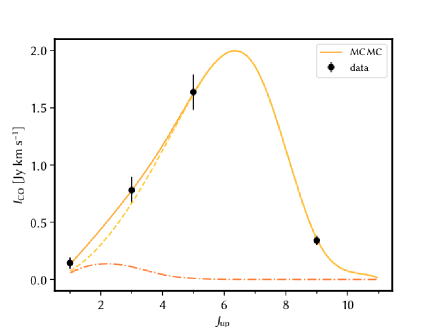
Together with the measurements reported in Neri et al. (2020), we have detected in total four emission lines in HerBS-89a, namely the 1-0, 3-2, 5-4 and 9-8 transitions. The Spectral Line Energy Distribution (SLED) of HerBS-89a, normalized to the =1-0 transition after correcting for the lens magnification (see Table 10), is shown in Fig. 14. The velocity-integrated fluxes of the lines increase monotonically with rotational quantum number up to =5-4, with a turnover around that transition, before decreasing at higher values, with the =9-8 emission line about a factor of 8 times weaker than the =5-4 line. The peak of the CO SLED for HerBS-89a should therefore occur around the =5-4 and =6-5 transitions. This result makes HerBS-89a comparable to other starburst galaxies as shown in Fig. 14, where various SLEDs of several individual DSFGs and one quasar (the Cloverleaf) are displayed together with the center of M82 and the Milky Way disk. In addition, the average SLEDs of three samples are shown: the (mostly) unlensed sample of 32 DSFGs selected at , at from Bothwell et al. (2013), the sample of 22 (mostly lensed) high- () DSFGs selected from the SPT survey (Spilker et al., 2014), and the sample of 78 “main sequence” star-forming galaxies from Valentino et al. (2020). The CO SLED of HerBS-89a most closely resembles that of the Cosmic Eyelash, which has a similar peak around 5-6 and a falloff towards higher . It is also remarkably similar to the CO SLED of the starburst GN20 (Carilli et al., 2010), up to ; however, recent observations by Cortzen et al. (2020, and in prep.) report an increase of the GN20 CO SLED at .
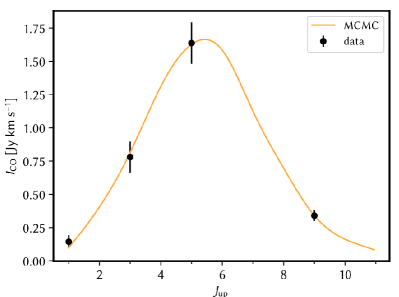
To investigate the CO line excitation further and constrain the physical conditions of the molecular gas in HerBS-89a, we model the CO line fluxes using a large velocity gradient (LVG) statistical equilibrium method (following the approach described in Yang et al., 2017, and references therein). The free parameters are the kinetic temperature of the molecular gas (), the volume density (), the column density of CO per unit velocity gradient (), and the solid angle () of the source. The CO SLED only depends on , and . A Bayesian approach is used to fit the line fluxes generated from the model and the code is adopted to perform a MCMC calculation. The resulting single component fit to the CO SLED of HerBS-89a is shown in Fig. 15. The SLED peaks around =6-5, and, from the single excitation component fitting, the molecular gas density is found to be , the kinetic temperature and the CO column density , where the errors are .
A second fit including an additional, colder and more extended component is shown in the lower panel of Fig. 15. Because of the paucity of available data points, the cold component is poorly constrained, with , , and , where the errors are . The warm component is in broad agreement with the previous single component fitting results.
6.4 The para- emission line
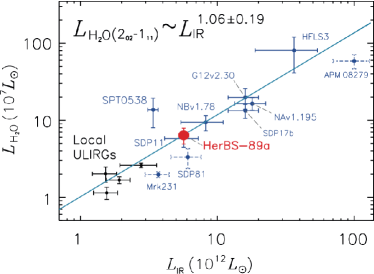
Water is one of the most abundant molecules after and CO in the gaseous interstellar medium (ISM). It serves as a unique diagnostic for probing the physical conditions of the ISM in both local (e.g., González-Alfonso et al., 2014) and high-redshift galaxies (e.g., Omont et al., 2013; Riechers et al., 2013; Yang et al., 2016, 2020, and references therein). In particular, since the levels of H2O are primarily excited through absorption of far-infrared photons from dust emission in warm dense regions, it is a useful diagnostic of the far-infrared radiation field independent of gas conditions. In addition, sub-millimeter water lines are the second strongest molecular emitter after the CO lines (e.g., Yang et al., 2013). The detection of the para-H2O() emission line () in HerBS-89a is an illustration thereof: the line width is broad () and comparable to those of the mid/high- CO lines, consistent with the finding that the H2O lines are spatially co-located with the CO lines (e.g., Omont et al., 2013; Yang et al., 2016). The observed line flux is bright, with , and comparable to the line flux of the emission line (Table 5). The CO and H2O lines have morphologies and velocity fields that are broadly comparable (see Figs. 4 and 7) indicating that they both trace the same warm high-density gas in HerBS-89a. Using Eqs. 6 and 7, we derive an intrinsic line luminosity (corrected for lensing magnification) of , yielding a ratio , in terms of the 8 to (Table 12). HerBS-89a lies on the correlation between and , i.e. derived by Yang et al. (2016), as shown in Fig. 16. This result is in line with the fact that far-infrared pumping is the dominant mechanism for the excitation of the sub-millimeter H2O emission that originates in very dense, heavily obscured star-formation dominated regions (see, e.g., González-Alfonso et al., 2014; Yang et al., 2016). The steeper-than-linear growth is likely the result of an increase of the optical depth in the dust continuum (at ) with increasing infrared luminosity. Finally, the ratio of also indicates that an AGN component, if present in HerBS-89a, is not contributing much to the infrared luminosity, in contrast to a system like Mrk 231 or APM 08279+5455 where the AGN is dominant (and references therein Yang et al., 2016).
7 Molecular gas kinematics
In an ideal situation, analysis of spectral line data cubes like those presented here for HerBS-89a can enable detailed analyses of source-plane kinematics. The lens model derived in Section 4 can in principle be applied to the emission in a particular line across many independent velocity channels, allowing them to be reconstructed in the source plane, used to compute moment maps, and fits to dynamical models (e.g., Sharon et al., 2019). In practice, although the quality of our NOEMA observations is excellent, the S/N and the number of resolution elements (i.e., synthesized beams) across the observed size of HerBS-89a are not high enough to fully achieve this goal. Several factors are at play here. First, as noted in Sect. 5 above, the combination of S/N and effective resolution limits us to the use of parametric (Sérsic profile) sources in reconstructing individual channels. Second, reconstruction of a given source-plane channel map tends to (a) favor sources that are very (sometimes implausibly) compact as a result of the use of a constrained emission profile, and (b) couple with the noise fluctuations in that channel in such a way that introduces uncertainties on the centroids of the reconstructed sources. Finally, comparison of a delensed source-plane reconstruction with an observed channel map necessarily involves the convolution of the former to the (coarser) resolution of the latter, meaning that many possible source-plane reconstructions are formally compatible with the observed data.
To provide a transparent (and possibly cautionary) picture of what properties can be derived from the current data, we show in Figs. 17 and 18 (as well as in Figs. 22 and 23 in the Appendix) some of the results of our lens modelling efforts. Our main focus is the 12CO(9–8) line, which has higher S/N than the H2O() line and is therefore more promising as a kinematic probe. In order to improve the S/N, we rebin the data to a resolution of , yielding a total of seven independent velocity channels that are suitable for modelling, although they do not span the line’s full velocity width. Each of these channels is independently reconstructed with a Sérsic profile in the source plane; these reconstructions are shown in the rightmost column of Fig. 22, and are represented with the colored ellipses centered on dots in the left panel of Figure 17 superposed on the dust continuum Sérsic profile in the source plane. The modest (generally in the vicinity of the line emission) level of the data–model residuals in the third column of Fig. 22 indicates that these reconstructions are formally acceptable, although the five channels blue-ward of have scale radii that are notably smaller than those of the two most highly redshifted channels. The centroids of all seven channels fall within the envelope defined by the reconstructed dust continuum emission, and in turn by the reconstruction of the 12CO(9–8) zeroth moment map (second row of Fig. 12), giving confidence that the overall spatial extent of the warmest and densest material in HerBS-89a is understood.
The center panel of Fig. 17 presents a source-plane zeroth moment map constructed by summing the source-plane reconstructions of the individual channel maps. This map seems to indicate an arc-like shaped morphology and the possibility of two separate components. However, we have here entered a regime in which the three limiting factors noted above are highly salient: because of the compactness of reconstructed Sérsic-profile sources in most of the velocity channels, the moment map derived from them suggests that we have reliable information about the internal source structure on much finer scales than is actually the case. It is also worth noting that when the moment map derived from the reconstructed channel maps is lensed forward into the image plane, it provides a poorer match to the observed 12CO(9–8) moment map than does the single Sérsic-component reconstruction in the second row of Fig.12. This apparent paradox occurs because small noise fluctuations in the observed channel maps have unavoidably affected the source centroids, shapes, and orientations of the corresponding source-plane reconstructions. Similar inconsistencies have been seen by other authors who have separately delensed both channel maps and integrated moment maps (e.g., Dong et al., 2019). Use of prior information on the expected relationships between emitting regions in adjacent velocity channels (e.g., Rizzo et al., 2018, Young et al., in preparation) would be one way to mitigate this tendency, but we have not used such an approach here.
Figure 17 provides a further illustration of the degree to which small noise fluctuations in the observed channel maps can perturb the centroids of the source-plane reconstructions. Initially inspired by the apparent bent morphology (and nominal associated velocity gradients; see below) in the central panel of Fig. 17, we constructed new, roughly half-line moment maps from the bluest four and reddest three of our seven channels, and reconstructed these using the lens model optimized in Sec. 5. The sum of these two reconstructions (i.e., another zeroth moment map) is presented in the right panel of Fig. 17. The apparent double morphology might at first right suggest a pre-coalescence merging system; however, the “doubleness” of the morphology stems at least in part from the general compactness of our Sérsic profile reconstructions. Moreover, notable aspects of the internal source structure (e.g., the distinct southeastern offset of the reconstructed to channel map) in the center panel do not translate to the reconstructions used to derive the right panel. This level of inconsistency raises the question of whether detailed information on the intrinsic or the internal source structure (as distinct from the overall extent of emission) can be robustly recovered from this dataset, and suggests that the apparent small-scale structure in the resulting zeroth-moment maps has to be interpreted with caution.
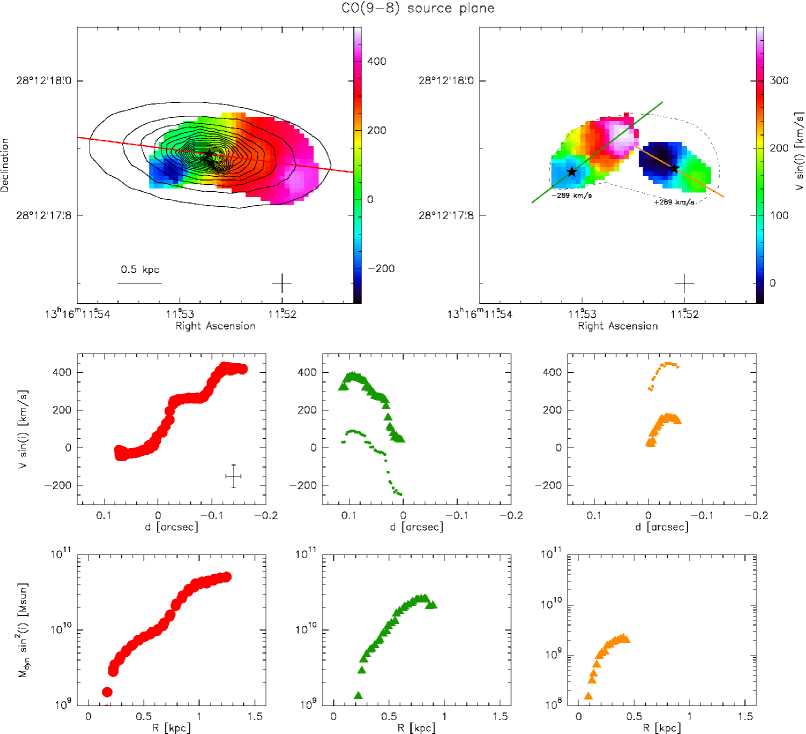
With the above discussion as preamble, we turn now to Fig. 18, which shows source-plane velocity fields derived from the seven-channel ( resolution) reconstructions of Fig. 22 in two different ways. The left panel presents an intensity-weighted first moment map calculated in the usual way. We find that the dominant velocity gradient is in an east-west direction, roughly consistent with the east-west elongation of the reconstructed dust continuum emission. The comparison of the center and right panels in Fig. 17 discussed above suggests that the perturbation from an exactly east-west velocity gradient due to the most highly blue-shifted emission may not be robust.
Assuming a single rotationally supported disk, the radial profile of the dynamical mass of the system is given by
| (15) |
where is the inclination angle of the rotating disk with respect to the line of sight, and is the observed velocity as a function of radius. Although the inclination could be derived from the ellipticity of the light profile, as , since the velocity gradient does not fully correspond to the continuum Sérsic profile in the source plane, we opt to keep the term explicit in our computations. The constant is a dimensionless scale factor that depends on the structure of the galaxy and has value for a thin disk embedded in a massive spheroid (Lequeux, 1983).
Along the major axis of the continuum profile (red line in the top-left panel of Fig. 18), we extract the velocity curve shown in the middle-left panel. The corresponding bottom-left panel presents the radial dynamical mass profile, which leads to an estimate of within .
In contrast, the top-right panel of Fig. 18 presents a first moment map in which masking has been used to highlight the two regions of strongest integrated emission (compare also to Figs. 17 and 22). These two regions’ velocity scales have been artificially offset by , corresponding to the separation between the two peaks in the integrated CO spectrum (see Fig.5) in order to better present them as candidate rotating disks. Velocity curves extracted along the axes of these two possible structures (green and orange lines) are shown in the middle row of Fig. 18, both before (small symbols) and after (large symbols) applying the shift.
The individual dynamical masses of these components, assuming rotational support as above, would be within for the eastern component and within for the western component, again under the assumption that in Eq. 15. The bottom panels of Fig. 18 show the dynamical mass radial distributions, limited to the extension of the first-moment maps.
Assuming a baryon fraction (e.g., Tacconi et al., 2020), and supposing that at high redshift the gas content of a galaxy is dominated by its molecular component and the atomic gas mass can be neglected (see, e.g., Tacconi et al., 2018), the dynamical mass could yield an estimate of the stellar mass and of the molecular gas fraction , thereby solving the question of whether or not the galaxy lies on the MS. However, the dynamical mass profiles derived for HerBS-89a do not extend to large enough radii to allow for a determination of the total mass.
For the sake of completeness, we also performed the reconstructions of multiple velocity channels across the emission line, adopting the same approach as above, using a coarser velocity re-binning to boost the S/N ratio (see Appendix A). As already suggested by the slightly different observed and reconstructed source-plane zeroth moment maps (see Fig. 12), the individual and velocity channels reconstruct to slightly different locations in the source plane (see Figs. 22 and 23). However, a first moment map derived from the reconstructed channel maps shows a velocity gradient similar to the one shown in the top left panel of Fig. 22 for the emission line, albeit at a slightly different position angle, suggesting once more that this aspect of the system’s kinematics has been robustly recovered. Due to the higher S/N of the emission line, we have limited the kinematic modelling to this line, rather than adventuring further in the realm of water.
To summarize, given the uncertainties discussed above, ambiguity remains as to whether the broad, double-peaked spectral lines in HerBS-89a reflect a single rotating disk or a pair of galaxies on their way to merging, as in the case of previous studies of high- lensed starburst galaxies (e.g., Genzel et al., 2003; Ivison et al., 2010; Sharon et al., 2015). On balance, we favor the latter scenario, which would provide a natural explanation of the very large widths of the emission lines in this system. Observations with higher S/N and angular resolution that can support a more detailed lens model will be needed to resolve the one vs. two sources question in a definitive way for this system, shed further light on the properties of this galaxy, unveil the finer details of its structure and kinematics, and fully recover the secrets of its starburst nature.
8 Molecular lines other than CO and water
In the following sub-sections, we present and discuss the various molecular absorption and emission lines other than CO and that have been detected in the spectrum of HerBS-89a. The individual molecular lines are described starting with the very dense molecular gas tracers, namely: and/or , and (Sect. 8.1), followed by the two molecular ions, and , which probe the low density molecular gas with low fractions (Sect. 8.2).
8.1 Very dense gas tracers: , and and/or
Amidogen () is a molecule that is an important reactant intermediate in the production and destruction of N-bearing molecules, in particular as a photodissociation product of ammonia (). It is an asymmetrical molecule with a ground electronic state characterized by a complex rotational spectrum (similar to ). It was first detected in the interstellar medium (in SgrB2) by van Dishoeck et al. (1993) and Goicoechea et al. (2004). was later detected in the Herschel SPIRE-FTS spectra of Mrk 231 and Arp 220 (González-Alfonso et al., 2018; Rangwala et al., 2011), where the emission line is seen next to the absorption line, and, possibly, the emission line as well.
In the case of HerBS-89a, two emission lines of are detected. The first is the emission line, which overlaps with the absorption line, such that only the red-shifted part of the emission line is apparent in the spectrum. However, the nearby remains undetected, which is in line with the expected ratio of between the and transitions. The second detected transition is weaker but uncontaminated by nearby lines.
As the data are of low signal-to-noise, a detailed study of , first reported here in a high- galaxy, remains out of reach. However, from the velocity-integrated emission map of the high-angular resolution data of the emission line (Fig.4), it is clear that the emission closely resembles the distributions of the and water emission lines, with the southern peak being stronger, in accordance with the fact that this molecule also traces the high-density gas. Dedicated future observations can further explore the properties of this molecule in HerBS-89a or in other high- galaxies to study the properties of their dense gas reservoirs.
The absorption feature observed at 246.72 GHz in HerBS-89a may be due to redshifted and/or . With the current data, there is no way to distinguish between these molecular species, so we will briefly describe each molecule separately. The absorption feature is relatively weak and detected at a low signal-to-noise ratio. As shown in Fig. 4, it is spatially well centered on both dust continuum emission peaks. This is the first detection of a high- HCN line and/or NH in a high- galaxy. Clearly, detecting other transitions of HCN and NH in HerBS-89a will help to determine the relative contributions of each of these species to the observed 246.72 GHz absorption feature.
-
•
HCN is known to be a reliable tracer of dense molecular gas (), with critical densities 100 to 1000 times higher than of CO. Although HCN emission lines are typically one to two orders of magnitude fainter than CO emission lines, HCN has been observed in its low- transitions in local starburst galaxies, revealing a tight correlation between the HCN luminosity and the star formation rate (e.g., Gao & Solomon, 2004; Zhang et al., 2014). Emission lines of low- HCN have also been detected in a few high- galaxies (Weiß et al., 2007; Riechers et al., 2010; Oteo et al., 2017; Canameras et al., 2020, and references therein), and HCN is seen in the stacked rest-frame 220-770 GHz spectrum of 22 high- DSFGs selected from the SPT survey (Spilker et al., 2014).
Between =54 and 1110, HCN flips from emission to absorption as shown in the case of Arp 220 where Rangwala et al. (2011) detect the =1211 to 1716 transitions in absorption131313The transition was not discussed in Rangwala et al. (2011). These transitions of HCN have critical densities around and probe very dense () gas. The high- lines of HCN are thought to be populated by radiative pumping of infrared photons (rather than by collisional excitation) in an intense high-temperature () radiation field Rangwala et al. (2011) .
In HerBS-89a, the optical depth of the 246.72 GHz line is estimated to be yielding, in the case of HCN, a column density of (Table 6). Future observations of both high- HCN lines (in absorption) and low- lines (in emission) in HerBS-89a would allow us to confirm if this absorption line is indeed due (or partly due) to HCN, and, once verified, allow us to probe and constrain the properties of the reservoir of extremely dense gas in this high- starburst galaxy.
-
•
NH (imidogen) is a molecular radical that is linked (as for ) to the formation and destruction of . It was first detected in the diffuse interstellar medium (Meyer & Roth, 1991) and later in the dense molecular gas of SgrB2 (Cernicharo et al., 2000; Goicoechea et al., 2004). The Herschel SPIRE-FTS spectra of Mrk 231 and Arp 220 (González-Alfonso et al., 2018; Rangwala et al., 2011) show the presence of with various transitions detected. has a spectrum similar to that of , since these molecules are isoelectronic. Many of the transitions of overlap with transitions, in particular with , with similar column densities derived for and in Mrk 231 (González-Alfonso et al., 2018). In the case of HerBS-89a, attributing all of the 246.72 GHz absorption line to implies a column density of , which is also comparable to the column density of (Table 6). Together with , the likely detection of in HerBS-89a opens up the possibility of exploring the chemistry of N-bearing molecules in a high- galaxy by measuring other transitions of and searching for , and exploring whether (as is the case in SgrB2) the derived column densities are compatible with grain-surface chemistry and sputtering by shocks (see, e.g., Goicoechea et al., 2004).
8.2 Low density gas tracers: and
The molecular ion is a reliable and powerful tracer of molecular outflows in DSFGs as has been demonstrated with the Herschel SPIRE-FTS studies in Arp 220 (Rangwala et al., 2011) and Mrk 231 (González-Alfonso et al., 2018), and in high- galaxies with NOEMA in HLFS 3 (Riechers et al., 2013) and ALMA (Indriolo et al., 2018, who reported absorption line in two lensed sources, i.e., the Cosmic Eyelash and SDP.17). As discussed in Indriolo et al. (2018), absorption is thought to arise in the extended cool, diffuse, low fraction gas that surrounds galaxies. has been found to be useful in constraining the cosmic-ray ionization rate of atomic hydrogen, , particularly in gas with a low fraction. The three ground state lines of (all are split into hyperfine components, which are blended due to the broad line widths measured in galaxies) are generally observed in absorption. In a few cases, they can be seen in emission as a red wing, as observed in Mrk 231 or Arp 220, or as recently reported for the line in the quasar SDSS231038+1855 by Li et al. (2020) and the hot dust-obscured galaxy W04100913 at by Stanley et al. (2020), where they can provide a measurement of the local density (e.g., Rangwala et al., 2011).
In HerBS-89a, all three ground-state lines () are seen in absorption (Fig. 5 middle panel). The and transitions are the strongest, while the transition is nearly five times weaker (Table 5). None of the lines in HerBS-89a show any indication of emission above the continuum as in Mrk 231 or Arp 220 (González-Alfonso et al., 2018; Rangwala et al., 2011). All three lines have comparable line widths with and the inferred column density is (Table 6), comparable to the value derived for the Cosmic Eyelash (Indriolo et al., 2018). The spectra show clear indications of red-shifted gas, with all three transitions peaking in opacity at relative to the systemic velocity, including the transition after the contamination of the emission line is accounted for (see Sec. 3.1.2).
The methylidyne cation, , has been shown to be a sensitive tracer of feedback mechanisms in high- DSFGs (Falgarone et al., 2017), who report the detection of in six lensed galaxies at redshifts , including the Cosmic Eyelash and SDP.17141414The first detection of was made in the far-infrared spectrum of the planetary nebula NGC 7027 through rotational lines from to seen in emission Cernicharo et al. (1997).. The line is found both in emission and absorption, providing critical information on the mechanisms of mechanical energy dissipation and/or strong UV irradiation in these high- galaxies. Due to its high critical density for excitation ( for the transition), the line is seen in emission in dense () gas, probing shocked regions powered by galactic winds, and in absorption, in large () reservoirs of turbulent, cold (), low-density () gas (see, e.g., Falgarone et al., 2017).
In HerBS-89a, the is detected in absorption with a width of , comparable to that of the lines, and is also red-shifted to (Fig. 5). The inferred column density is estimated to be (Table 8), similar to what has been derived in the case of the Cosmic Eyelash (Falgarone et al., 2017).
The low signal-to-noise, tentative detection of CH+ emission could indicate that in HerBS-89a there is also dense gas () with a significant velocity dispersion (the line has a full width at zero intensity of and is centered at the systemic velocity), as was reported for three of the sources studied by Falgarone et al. (2017). However, higher quality data are required to probe this dense gas component in greater detail.
9 Inflowing gas
In HerBS-89a, the three ground-state lines () and the line are all seen in absorption and red-shifted with respect to the systemic velocity (defined by the CO emission lines) by . As shown in the velocity maps of these absorption lines, the red-shifted gas is distributed over the southern and northern dust continuum peaks (in the image plane), uniformly covering the distribution of the blue- and red-shifted gas traced in the and water emission lines (Fig. 4). The kinematics of the absorbing gas in HerBS-89a indicate that this red-shifted gas is therefore not kinematically related to the dense molecular gas. We argue here that we are in fact tracing, in both and , low density gas that is flowing into the central regions of HerBS-89a,
The number of high- sources for which measurements of absorption by molecular ions such as or are available is still low; however, it is noteworthy that the majority of the sources for which observations of these species have been made do show blue-shifted absorption lines, indicating vigorous outflow activity. Out of the five high- lensed galaxies where has been found in absorption, only one source 151515In the case of the galaxy G09v1.40 reported in Falgarone et al. (2017), adopting the precise redshift of (Yang et al., 2017) shifts the absorption line to with respect to the systemic velocity of the source as defined by the CO emission lines; the absorption line is therefore blue-shifted in this system - see also Butler et al. (in prep.). shows a red-shifted line, namely the Cosmic Eyelash (Falgarone et al., 2017); for this source, the absorption line is shifted by with respect to the systemic velocity as defined by the CO emission lines. A similar velocity shift in the Cosmic Eyelash is also observed in the and absorption lines (Indriolo et al., 2018). Recently, Butler et al. (in prep.) report absorption lines towards ten gravitationally lensed Herschel-selected high- galaxies; for all of them, the line is invariably seen in absorption and blue-shifted with respect to the systemic velocity, with the exception of one source where the absorption line peaks at the systemic velocity. Together, the currently available observations of (and ) have established that these molecular ions are robust tracers of molecular gas outflows in high- galaxies, confirming the results of observations of or in local ultra-luminous galaxies (e.g., Lu et al., 2017; González-Alfonso et al., 2017, and references therein). In addition, recent studies of absorption lines in high- lensed DSFGs in the OH doublet, in SPT-231955 at (Spilker et al., 2018) and the quasar ULASJ131911+095051 at (Herrera-Camus et al., 2020), and in the and transitions in SPT-034652 at (Jones et al., 2019), have revealed blue-shifted lines tracing powerful outflows (with rates of ).
In contrast to the above trends, the detection of red-shifted molecular absorption lines in high- systems seems much less common. Only two cases are known, namely the Cosmic Eyelash (Falgarone et al., 2017; Indriolo et al., 2018) and HerBS-89a (here described), out of the total of 18 high- sources observed to date for which and/or (or other tracers such as OH, or ) have been seen in absorption.
Direct observational evidence of inflow is indeed scarce. Signatures of infalling gas are notoriously difficult to observe: the accreting material may have low metallicity, low density, and/or a small covering factor (less than 10% at ; see, e.g., Fumagalli et al., 2011), and it might be ionized or obscured by outflows. The need for a good alignment of an accretion structure with a background continuum source along the line of sight lowers the chance of detection even further.
The findings here described for molecular absorption lines in high- galaxies are in line with the scarcity of infall evidence gathered from previous studies. Using optical spectroscopy, Rubin et al. (2012) report evidence of cool, metal-enriched gas accretion onto galaxies at . Wiseman et al. (2017) found a rare case of inflow of metal-poor gas from the intergalactic medium onto a galaxy. More recently, Ao et al. (2020) report evidence of infalling gas in a Lyman- blob at , and Daddi et al. (2020) presented observations revealing cold gas filaments accreting toward the center of a massive group galaxy at . In the local Universe, a few examples of inflow activity have been found through Herschel spectroscopic observations of compact luminous infrared galaxies. These include NGC 4418 and , where reversed P-Cygni profiles, a clear signature of infall, were revealed in the fine-structure lines (González-Alfonso et al., 2012; Falstad et al., 2015); Arp 299 where the absorption of the ground state of OH at 119 is found red-shifted by , suggesting a low excitation inflow in this source (Falstad et al., 2017); Circinus, which shows an unambiguous OH 119 inverted P-Cygni profile (Stone et al., 2016); and IRAS 10091+4704, the starburst-dominated system at , were a clear inverted P-Cygni OH profile indicates the presence of a fast inflow of molecular gas with a rate of (Herrera-Camus et al., 2020).
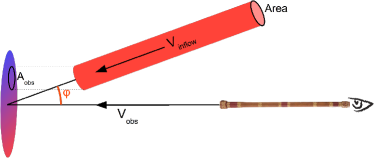
Theoretically, gas flowing into less massive () galaxies should be dynamically and thermally cold, while more massive halos receive most of their baryons as hotter () gas (e.g., Dekel & Woo, 2003; Kereš et al., 2005). Thus cold, dense, metal-poor circum-galactic gas is often interpreted as direct evidence of accretion. Metal-poor Lyman-limit systems have been used as tracers of accretion in observations (e.g., Lehner et al., 2013) and simulations (e.g., Fumagalli et al., 2011).
Inflow and outflow rates of galaxies are constrained by cosmological simulations (e.g., Kereš et al., 2005) and analytic models based on the mass assembly history of dark matter halos (Bouché et al., 2010; Lilly et al., 2013). Erb (2008) reproduces the gas mass fraction and metallicity distribution of galaxies with a simple chemical model involving gas inflow and outflow. Inverting their reasoning, Yabe et al. (2015) constrain gas inflow and outflow rates based on the observed stellar masses, gas mass fractions, and metallicities of star-forming galaxies at .
Taken together, the above evidence strongly indicates that galaxies possess large reservoirs of circum-galactic gas eligible for accretion (Tumlinson et al., 2017). Nevertheless, evidence for fuel does not necessarily imply the presence of fueling.
We can describe the gas flow as a cylindrical channel that brings the gas onto the galaxy (see Fig. 19 for a schematic representation). Given the distance of the infalling clouds from the galaxy (i.e., given the line-of-sight distance that the gas has yet to travel), and assuming that the accreting gas travels at a constant speed , the mass inflow rate can be computed as follows:
| (16) |
Here X denotes either the or molecular ion; is the column density of the inflowing gas; is the mass of the molecular ion; is the de-magnified projected area covered by the inflowing gas in the sky; is the angle between the line of sight and the inflow direction; and is the measured red-shifted velocity of the line. With these definitions, the term represents the de-projected inflow velocity , and the cross-sectional area of the cylinder perpendicular to the flow is given by .
The value measured from the high angular resolution spectra for and is (Table 6). The mass of the molecular ion is . The observed projected area can be computed from the Sérsic radius of the source plane reconstruction (0.21-0.23 kpc; Table 10) yielding kpc2. The observed velocity of the flow is . The distance that the inflowing gas travels from the observed position to the center of the galaxy is one of the most uncertain quantities in Eq. 16. Typical distances found in the literature are of the order of one to a few kpc. Using the positions of lines and continuum in the source plane (Table 10), we can only compute the distances projected on the sky as between and kpc, which are of the same order than the systematic positional uncertainty computed via Eq. 4 ( kpc). Assuming a geometry similar to that of , because no source plane reconstruction has been attempted for the low angular resolution NOEMA data, a similar reasoning can be applied to the line. Based on these values and estimates and using Eq. 16, we find
| (17) |
and
| (18) |
modulo the angle between the flow direction and the line of sight, which is unknown.
In order to transform these results into the total inflow rate, we assume that the gas mass is dominated by hydrogen, and we adopt
as abundances relative to hydrogen the quantities
(computed as the Galactic average value from Table 5 of Indriolo et al., 2015)
and (Godard et al., 2014; Indriolo et al., 2018).
By dividing Eq. 16 by and multiplying by the ratio
of the molecular ion’s mass relative to H, we derive mass inflow rates of
from ,
and from .
In the so-called “bathtub” or “gas regulator” model (Bouché et al., 2010; Lilly et al., 2013; Sánchez Almeida et al., 2014; Peng & Maiolino, 2014; Dekel & Mandelker, 2014; Somerville & Davé, 2015, among many others), the evolution of the gas content of a galaxy can be formulated as follows:
| (19) |
where is the inflow rate; , as per the Schmidt-Kennicutt star formation law (Schmidt, 1959; Kennicutt, 1998b) ; is the fraction of mass of newly formed stars quickly returned to the ISM through stellar winds and supernovae; is the outflow rate, linked to the SFR by the mass loading factor ; finally, is the fraction of gas ejected by outflows falling back onto the galaxy. Additional factors, e.g., due to AGN feedback, possible mergers or other external causes, are here summarized by the term .
Different scenarios can be at play in the case of HerBS-89a. In the least likely scenario, we might be witnessing a flow channeling gas from the intergalactic medium onto the galaxy, i.e., the term of Eq. 19. While such flow would in principle consist of pristine gas, the detected and transitions testify to the presence of enriched material. To produce these molecular ions, first of all, as the reaction rates go with , pockets of dense gas should be present; second, the most important formation channel for (and ) requires high temperatures, which could be produced in an accretion shock in the infalling gas as it enters the halo of the galaxy, although this scenario remains speculative.
Yabe et al. (2015) use a simple analytic model of galaxy chemical evolution to constrain the inflow (and outflow) rates of three samples of star forming galaxies at and 2.2 (Erb et al., 2006; Peeples & Shankar, 2011, and their work). They show that the average gas inflow rate of the samples is 2 to 3 their SFRs. Turning into physical units, is a few solar masses per year at growing to yr-1 at . Model predictions reproduce these values for dark matter halos masses of (e.g., Bouché et al., 2010; Yabe et al., 2015). If the SFR is fed by the inflow, then it is naturally proportional to the inflow rate. the detailed process of gas accretion and its relation to the fuel of SFR is more complex and still poorly understood. The gas fraction and SFR efficiency (i.e., the reciprocal of ) come into play. How they relate to is yet to be fully investigated by observations, because of the rare occurrence of direct inflow measurements.
In this frame, HerBS-89a would require a very high inflow rate to sustain its large measured star formation rate. Although the angle between the line of sight and the inflow is unknown, the values derived above seem too low to support this scenario.
Alternatively, the flow could be part of a galactic fountain, in which a fraction of the gas expelled by the starburst winds falls back onto the galaxy (the term in Eq. 19). In this case, an outflow should also be detected, as described by . No evidence of any outflow feature was found in the spectra of HerBS-89a, neither in the form of blue-shifted emission (e.g., inverted P-Cygni profile) nor through absorption components of the detected lines. Nevertheless, it is worth noting that the absorption lines of here reported are not isolated, and have emission or absorption lines of other molecular species on their blue sides, perhaps preventing the identification of a blue-shifted component. Moreover — despite the superb quality of the NOEMA spectra — the S/N reached in the spectra of the main emission lines is not high enough to detect any faint, very broad wings, that could indicate the presence of an outflow.
Finally, if HerBS-89a is in fact a merging pair or a multiple source (see Sect. 7), a third possibility is that the red-shifted and lines originate in a stream of matter between the two components. This case belongs to the term in Eq. 19, and would naturally explain the enriched composition of the flow. One possibility is that HerBS-89a is similar to a scaled-up version of the merger in the local Antennae galaxy (NGC 4038/9), in which an off-nuclear high concentration of dust and gas and a powerful starburst are found in the region between the two galaxies: a “Hyper-Antennae”.
With the data in hand, it is however not possible to distinguish between these different scenarios and draw a definitive conclusion. Also in this case, higher angular resolution and deeper sensitivity observations of HerBS-89a will be required to shed further light on the nature of the mass inflow observed in this system.
10 Summary and concluding remarks
We report new millimeter NOEMA and VLA observations of the lensed starburst galaxy HerBS-89a at that are complemented with near-infrared and optical data (obtained with the HST and GTC) that reveal the foreground lensing galaxy. The ability to process large instantaneous bandwidths with NOEMA enables an in-depth exploration of a sizeable part of the 1-mm spectrum of HerBS-89a, covering in total 121 GHz in the rest-frame, leading to the detection of transitions of molecular ions and molecular species that have not been previously observed in a high- galaxy. In addition to the strong emission lines of and , we detect the three ground-state lines () and the line, all four seen in absorption and red-shifted with respect to the systemic velocity of HerBS-89a, two transitions of in emission, and and/or lines, seen in absorption. Modelling the lensing of HerBS-89a, we reconstructed the dust continuum emission and the molecular emission lines in the source plane deriving the morphology and the kinematics of this high- galaxy.
The main conclusions of this paper are as follows:
-
•
The high-angular resolution () images of HerBS-89a in dust continuum and the emission lines of and show two distinct components - one to the north and a brighter slightly more extended component to the south, which are linked by an arc-like diameter structure reminiscent of an Einstein ring. HerBS-89a is gravitationally amplified by a foreground massive galaxy at , with an estimated deflector mass of . Using lens modelling, we have reconstructed the source-plane morphologies of HerBS-89a in dust continuum and molecular line emission. The magnification factor is estimated to be for the dust continuum and for the emission lines.
-
•
HerBS-89a is a high- dusty star forming galaxy. From the measurements, we derive a mass for the molecular gas reservoir of . Modelling the available CO lines (1-0, 3-2, 5-4 and 9-8) with an LVG approach indicates that the molecular gas in HerBS-89a has an average density of and a kinetic temperature . Using the fine sampling of the dust continuum flux densities observed from to 3.4 mm (or 63 to in the rest-frame), we derive an infrared luminosity of , and a dust mass of , yielding a dust-to-gas ratio . The star formation rate is estimated to be and the depletion timescale years.
-
•
Lens modelling suggests that the warmest and densest material in HerBS-89a (i.e., as traced by dust, 12CO(9–8), and H2O() emission) is distributed across a region a few kpc across. We cannot distinguish definitively between a single-disk and a two-component description of this distribution on the basis of existing observations, but dynamical and molecular gas mass estimates are consistent in either scenario, and the two-component scenario in particular provides a natural explanation for the very large observed CO velocity widths.
-
•
A series of molecular emission and absorption lines are detected in HerBS-89a that trace very dense gas (up to ). is seen in emission and detected in two transitions, while an absorption feature at 246.72 GHz corresponds to HCN(11-10), or a combination of both. Future observations of additional transitions of these species (particularly HCN and NH) would be needed to further explore the densest regions of HerBS-89a.
-
•
The three fundamental transitions of and (1-0) are all seen in absorption and all red-shifted by with respect to the systemic velocity of HerBS-89a. The molecular ions and both trace low-density () gas. The fact that the velocity red-shifted absorption lines cover substantially the distribution of the CO and water emission lines in the image (and source) planes indicates that this low-density gas must be kinematically unrelated to the dense gas. We here argue that we are tracing a rare case of inflow of low-density gas, indicating that HerBS-89a is accreting matter from its surroundings. Based on the available data, we have estimated that the mass inflow rate is of the order of . Various scenarios are possible to account for the observations including inflowing gas from the intergalactic medium, a galactic fountain or a stream of matter between the two merging components.
The results here described highlight the importance of processing large instantaneous bandwidth in the study of high- galaxies, as such observations allow us to efficiently measure multiple lines and explore in an unbiased way the entire available frequency range for the presence of molecular species. In the case of HerBS-89a, we were able to probe this system from the very highest to the lowest molecular gas densities with high-quality spectral data in the 830 to 1060 GHz rest-frame frequency range, which includes key molecular ionic transitions tracing feedback mechanisms. The findings here reported show that it is possible to unravel the complex physics at play within this starburst (likely to be a merger) system in the early Universe from the kinematics of its inner most regions to the low-density inflowing molecular gas. They provide the foundation for future follow-up observations to further study the nature of HerBS-89a and better constrain its morphology and kinematics, which will need higher-angular resolution and higher signal-to-noise ratio data, as well as for future studies of larger samples of high- galaxies, with properties akin to those of HerBS-89a, selected from on-going large redshift surveys.
Acknowledgements.
This work is based on observations carried out under programs, E18AE (a Discretionary Directorial Time project) and W19DE, using the IRAM NOrthern Extended Millimeter Array (NOEMA), and, program VLA/20A-083 using the National Radio Astronomy Observatory’s (NRAO) Karl G. Jansky Very Large Array (VLA). IRAM is supported by INSU/CNRS (France), MPG (Germany) and IGN (Spain). The National Radio Astronomy Observatory is a facility of the National Science Foundation operated under cooperative agreement by Associated Universities, Inc. The authors are grateful to the IRAM Director, K.F. Schuster, for enabling the initial observations of this project. This paper makes also use of observations made with the Gran Telescopio Canarias (GTC), installed at the Spanish Observatorio del Roque de los Muchachos of the Instituto de Astrofísica de Canarias, in the island of La Palma, under Director’s Discretionary Time. The authors are grateful to the referee for constructive and insightful comments. We would like to thank J. Cernicharo, F. Cox, and E. Falgarone for useful discussions about some aspects of this study and E. Chapillon for her help with the JVLA data reduction. A.J.Y. and A.J.B. acknowledge enlightening discussions with C.R. Keeton about the lens modelling. The authors would also like to highlight interesting exchanges triggered by the thoughts of J. de Chabannes. This work benefited from the support of the project Z-GAL ANR-AAPG2019 of the French National Research Agency (ANR). A.J.B. and A.J.Y acknowledge support from the National Science Foundation grant AST-1716585. B.M.J. acknowledges the support of a studentship grant from the UK Science and Technology Facilities Council (SFTC). L.D. acknowledges support from the ERC consolidator grant CosmicDust (PI: H. Gomez). T.B. acknowledges funding from NAOJ ALMA Scientific Research Grant 2018-09B and JSPS KAKENHI No. 17H06130. C.Y. acknowledges support from an ESO Fellowship. S.D. is supported by a UK STFC Rutherford Fellowship. H.D. acknowledges financial support from the Spanish Ministry of Science, Innovation and Universities (MICIU) under the 2014 Ramón y Cajal program RYC-2014-15686 and AYA2017-84061-P, the later one co-financed by FEDER (European Regional Development Funds). D.A.R. acknowledges support from the National Science Foundation under grant numbers AST-1614213 and AST-1910107 and from the Alexander von Humboldt Foundation through a Humboldt Research Fellowship for Experienced Researchers. S.J. acknowledges financial support from the Spanish Ministry of Science, Innovation and Universities (MICIU) under grant AYA2017-84061-P, co-financed by FEDER (European Regional Development Funds). A.C.R. acknowledges financial support from the Spanish Ministry of Science, Innovation and Universities (MICIU) under grant AYA2017-84061-P, co-financed by FEDER (European Regional Development Funds) and by the Spanish Space Research Program “Participation in the NISP instrument and preparation for the science of EUCLID” (ESP2017-84272-C2-1-R).References
- Ao et al. (2020) Ao, Y., Zheng, Z., Henkel, C., et al. 2020, Nature Astronomy, 4, 670
- Arnouts et al. (1999) Arnouts, S., Cristiani, S., Moscardini, L., et al. 1999, MNRAS, 310, 540
- Babbedge et al. (2004) Babbedge, T. S. R., Rowan-Robinson, M., Gonzalez-Solares, E., et al. 2004, MNRAS, 353, 654
- Bakx et al. (2018) Bakx, T. J. L. C., Eales, S. A., Negrello, M., et al. 2018, MNRAS, 473, 1751
- Bakx et al. (2020) Bakx, T. J. L. C., Eales, S. A., Negrello, M., et al. 2020, MNRAS, 494, 10
- Barvainis et al. (1997) Barvainis, R., Maloney, P., Antonucci, R., & Alloin, D. 1997, ApJ, 484, 695
- Battisti et al. (2019) Battisti, A. J., da Cunha, E., Grasha, K., et al. 2019, ApJ, 882, 61
- Berta et al. (2003) Berta, S., Fritz, J., Franceschini, A., Bressan, A., & Pernechele, C. 2003, A&A, 403, 119
- Berta et al. (2016) Berta, S., Lutz, D., Genzel, R., Förster-Schreiber, N. M., & Tacconi, L. J. 2016, A&A, 587, A73
- Berta et al. (2013) Berta, S., Lutz, D., Santini, P., et al. 2013, A&A, 551, A100
- Bianchi (2013) Bianchi, S. 2013, A&A, 552, A89
- Bianchi et al. (2019) Bianchi, S., Casasola, V., Baes, M., et al. 2019, A&A, 631, A102
- Blain et al. (2002) Blain, A. W., Smail, I., Ivison, R. J., Kneib, J.-P., & Frayer, D. T. 2002, Phys. Rep, 369, 111
- Bolatto et al. (2013) Bolatto, A. D., Wolfire, M., & Leroy, A. K. 2013, ARA&A, 51, 207
- Bolzonella et al. (2000) Bolzonella, M., Miralles, J. M., & Pelló, R. 2000, A&A, 363, 476
- Boselli et al. (2010) Boselli, A., Eales, S., Cortese, L., et al. 2010, PASP, 122, 261
- Bothwell et al. (2013) Bothwell, M. S., Smail, I., Chapman, S. C., et al. 2013, MNRAS, 429, 3047
- Bouché et al. (2010) Bouché, N., Dekel, A., Genzel, R., et al. 2010, ApJ, 718, 1001
- Bradford et al. (2009) Bradford, C. M., Aguirre, J. E., Aikin, R., et al. 2009, ApJ, 705, 112
- Brammer et al. (2008) Brammer, G. B., van Dokkum, P. G., & Coppi, P. 2008, ApJ, 686, 1503
- Bruzual A. (1983) Bruzual A., G. 1983, ApJ, 273, 105
- Bussmann et al. (2013) Bussmann, R. S., Pérez-Fournon, I., Amber, S., et al. 2013, ApJ, 779, 25
- Cañameras et al. (2015) Cañameras, R., Nesvadba, N. P. H., Guery, D., et al. 2015, A&A, 581, A105
- Canameras et al. (2020) Canameras, R., Nesvadba, N. P. H., Kneissl, R., et al. 2020, arXiv e-prints, arXiv:2009.13538
- Carilli et al. (2010) Carilli, C. L., Daddi, E., Riechers, D., et al. 2010, ApJ, 714, 1407
- Carilli & Walter (2013) Carilli, C. L. & Walter, F. 2013, ARA&A, 51, 105
- Carlstrom et al. (2011) Carlstrom, J. E., Ade, P. A. R., Aird, K. A., et al. 2011, PASP, 123, 568
- Casey et al. (2014) Casey, C. M., Narayanan, D., & Cooray, A. 2014, Phys. Rep, 541, 45
- Cernicharo et al. (2000) Cernicharo, J., Goicoechea, J. R., & Caux, E. 2000, ApJ, 534, L199
- Cernicharo et al. (1997) Cernicharo, J., Liu, X. W., González-Alfonso, E., et al. 1997, ApJ, 483, L65
- Chabrier (2003) Chabrier, G. 2003, ApJ, 586, L133
- Clark et al. (2019) Clark, C. J. R., De Vis, P., Baes, M., et al. 2019, MNRAS, 489, 5256
- Clark et al. (2016) Clark, C. J. R., Schofield, S. P., Gomez, H. L., & Davies, J. I. 2016, MNRAS, 459, 1646
- Coleman et al. (1980) Coleman, G. D., Wu, C. C., & Weedman, D. W. 1980, ApJS, 43, 393
- Comito et al. (2003) Comito, C., Schilke, P., Gerin, M., et al. 2003, A&A, 402, 635
- Cortzen et al. (2020) Cortzen, I., Magdis, G. E., Valentino, F., et al. 2020, A&A, 634, L14
- Cox et al. (2011) Cox, P., Krips, M., Neri, R., et al. 2011, ApJ, 740, 63
- da Cunha et al. (2008) da Cunha, E., Charlot, S., & Elbaz, D. 2008, MNRAS, 388, 1595
- da Cunha et al. (2013) da Cunha, E., Groves, B., Walter, F., et al. 2013, ApJ, 766, 12
- da Cunha et al. (2015) da Cunha, E., Walter, F., Smail, I. R., et al. 2015, ApJ, 806, 110
- Daddi et al. (2010) Daddi, E., Elbaz, D., Walter, F., et al. 2010, ApJ, 714, L118
- Daddi et al. (2020) Daddi, E., Valentino, F., Rich, R. M., et al. 2020, arXiv e-prints, arXiv:2006.11089
- Danielson et al. (2011) Danielson, A. L. R., Swinbank, A. M., Smail, I., et al. 2011, MNRAS, 410, 1687
- Dekel & Mandelker (2014) Dekel, A. & Mandelker, N. 2014, MNRAS, 444, 2071
- Dekel & Woo (2003) Dekel, A. & Woo, J. 2003, MNRAS, 344, 1131
- Delhaize et al. (2017) Delhaize, J., Smolčić, V., Delvecchio, I., et al. 2017, A&A, 602, A4
- Dhillon et al. (2018) Dhillon, V., Dixon, S., Gamble, T., et al. 2018, in Society of Photo-Optical Instrumentation Engineers (SPIE) Conference Series, Vol. 10702, Proc. SPIE, 107020L
- Dong et al. (2019) Dong, C., Spilker, J. S., Gonzalez, A. H., et al. 2019, ApJ, 873, 50
- Downes et al. (1999) Downes, D., Neri, R., Greve, A., et al. 1999, A&A, 347, 809
- Downes & Solomon (1998) Downes, D. & Solomon, P. M. 1998, ApJ, 507, 615
- Draine (2003) Draine, B. T. 2003, ARA&A, 41, 241
- Draine et al. (2014) Draine, B. T., Aniano, G., Krause, O., et al. 2014, ApJ, 780, 172
- Draine & Li (2001) Draine, B. T. & Li, A. 2001, ApJ, 551, 807
- Draine & Li (2007) Draine, B. T. & Li, A. 2007, ApJ, 657, 810
- Dunne et al. (2020) Dunne, L., Maddox, S. J., Vlahakis, C., & Gomez, H. L. 2020, MNRAS
- Eales et al. (2010a) Eales, S., Dunne, L., Clements, D., et al. 2010a, PASP, 122, 499
- Eales et al. (2010b) Eales, S. A., Smith, M. W. L., Wilson, C. D., et al. 2010b, A&A, 518, L62
- Elbaz et al. (2011) Elbaz, D., Dickinson, M., Hwang, H. S., et al. 2011, A&A, 533, A119
- Erb (2008) Erb, D. K. 2008, ApJ, 674, 151
- Erb et al. (2006) Erb, D. K., Shapley, A. E., Pettini, M., et al. 2006, ApJ, 644, 813
- Falgarone et al. (2017) Falgarone, E., Zwaan, M. A., Godard, B., et al. 2017, Nature, 548, 430
- Falstad et al. (2017) Falstad, N., González-Alfonso, E., Aalto, S., & Fischer, J. 2017, A&A, 597, A105
- Falstad et al. (2015) Falstad, N., González-Alfonso, E., Aalto, S., et al. 2015, A&A, 580, A52
- Fixsen et al. (1999) Fixsen, D. J., Bennett, C. L., & Mather, J. C. 1999, ApJ, 526, 207
- Fu et al. (2013) Fu, H., Cooray, A., Feruglio, C., et al. 2013, Nature, 498, 338
- Fudamoto et al. (2017) Fudamoto, Y., Ivison, R. J., Oteo, I., et al. 2017, MNRAS, 472, 2028
- Fumagalli et al. (2011) Fumagalli, M., Prochaska, J. X., Kasen, D., et al. 2011, MNRAS, 418, 1796
- Gao & Solomon (2004) Gao, Y. & Solomon, P. M. 2004, ApJ, 606, 271
- Genzel et al. (2003) Genzel, R., Baker, A. J., Tacconi, L. J., et al. 2003, ApJ, 584, 633
- Genzel et al. (2010) Genzel, R., Tacconi, L. J., Gracia-Carpio, J., et al. 2010, MNRAS, 407, 2091
- Godard et al. (2014) Godard, B., Falgarone, E., & Pineau des Forêts, G. 2014, A&A, 570, A27
- Goicoechea et al. (2004) Goicoechea, J. R., Rodríguez-Fernández, N. J., & Cernicharo, J. 2004, ApJ, 600, 214
- González-Alfonso et al. (2014) González-Alfonso, E., Fischer, J., Aalto, S., & Falstad, N. 2014, A&A, 567, A91
- González-Alfonso et al. (2018) González-Alfonso, E., Fischer, J., Bruderer, S., et al. 2018, ApJ, 857, 66
- González-Alfonso et al. (2012) González-Alfonso, E., Fischer, J., Graciá-Carpio, J., et al. 2012, A&A, 541, A4
- González-Alfonso et al. (2017) González-Alfonso, E., Fischer, J., Spoon, H. W. W., et al. 2017, ApJ, 836, 11
- Gralla et al. (2020) Gralla, M. B., Marriage, T. A., Addison, G., et al. 2020, ApJ, 893, 104
- Harris et al. (2012) Harris, A. I., Baker, A. J., Frayer, D. T., et al. 2012, ApJ, 752, 152
- Hensley & Draine (2020) Hensley, B. S. & Draine, B. T. 2020, arXiv e-prints, arXiv:2009.00018
- Herrera-Camus et al. (2020) Herrera-Camus, R., Sturm, E., Graciá-Carpio, J., et al. 2020, A&A, 633, L4
- Hodge & da Cunha (2020) Hodge, J. A. & da Cunha, E. 2020, arXiv e-prints, arXiv:2004.00934
- Ibar et al. (2010) Ibar, E., Ivison, R. J., Best, P. N., et al. 2010, MNRAS, 401, L53
- Ilbert et al. (2006) Ilbert, O., Arnouts, S., McCracken, H. J., et al. 2006, A&A, 457, 841
- Ilbert et al. (2009) Ilbert, O., Capak, P., Salvato, M., et al. 2009, ApJ, 690, 1236
- Indriolo et al. (2018) Indriolo, N., Bergin, E. A., Falgarone, E., et al. 2018, ApJ, 865, 127
- Indriolo et al. (2015) Indriolo, N., Neufeld, D. A., Gerin, M., et al. 2015, ApJ, 800, 40
- Ivison et al. (2019) Ivison, R. J., Page, M. J., Cirasuolo, M., et al. 2019, MNRAS, 489, 427
- Ivison et al. (1998) Ivison, R. J., Smail, I., Le Borgne, J. F., et al. 1998, MNRAS, 298, 583
- Ivison et al. (2010) Ivison, R. J., Smail, I., Papadopoulos, P. P., et al. 2010, MNRAS, 404, 198
- Ivison et al. (2013) Ivison, R. J., Swinbank, A. M., Smail, I., et al. 2013, ApJ, 772, 137
- James et al. (2002) James, A., Dunne, L., Eales, S., & Edmunds, M. G. 2002, MNRAS, 335, 753
- Jin et al. (2019) Jin, S., Daddi, E., Magdis, G. E., et al. 2019, arXiv e-prints, arXiv:1906.00040
- Jones et al. (2013) Jones, A. P., Fanciullo, L., Köhler, M., et al. 2013, A&A, 558, A62
- Jones et al. (2017) Jones, A. P., Köhler, M., Ysard, N., Bocchio, M., & Verstraete, L. 2017, A&A, 602, A46
- Jones et al. (2019) Jones, G. C., Maiolino, R., Caselli, P., & Carniani, S. 2019, A&A, 632, L7
- Keeton (2001) Keeton, C. R. 2001, arXiv e-prints, astro
- Kennicutt (1998a) Kennicutt, Robert C., J. 1998a, ARA&A, 36, 189
- Kennicutt (1998b) Kennicutt, Robert C., J. 1998b, ApJ, 498, 541
- Kereš et al. (2005) Kereš, D., Katz, N., Weinberg, D. H., & Davé, R. 2005, MNRAS, 363, 2
- Lada (2015) Lada, C. J. 2015, in Galaxies in 3D across the Universe, ed. B. L. Ziegler, F. Combes, H. Dannerbauer, & M. Verdugo, Vol. 309, 31–38
- Lehner et al. (2013) Lehner, N., Howk, J. C., Tripp, T. M., et al. 2013, ApJ, 770, 138
- Lequeux (1983) Lequeux, J. 1983, A&A, 125, 394
- Leroy et al. (2011) Leroy, A. K., Bolatto, A., Gordon, K., et al. 2011, ApJ, 737, 12
- Li & Draine (2001) Li, A. & Draine, B. T. 2001, ApJ, 554, 778
- Li et al. (2020) Li, J., Wang, R., Riechers, D., et al. 2020, ApJ, 889, 162
- Lilly et al. (2013) Lilly, S. J., Carollo, C. M., Pipino, A., Renzini, A., & Peng, Y. 2013, ApJ, 772, 119
- Liu et al. (2019) Liu, D., Schinnerer, E., Groves, B., et al. 2019, ApJ, 887, 235
- Lu et al. (2017) Lu, N., Zhao, Y., Díaz-Santos, T., et al. 2017, ApJS, 230, 1
- Lutz et al. (2011) Lutz, D., Poglitsch, A., Altieri, B., et al. 2011, A&A, 532, A90
- Magdis et al. (2012) Magdis, G. E., Daddi, E., Béthermin, M., et al. 2012, ApJ, 760, 6
- Magnelli et al. (2015) Magnelli, B., Ivison, R. J., Lutz, D., et al. 2015, A&A, 573, A45
- Magnelli et al. (2012) Magnelli, B., Saintonge, A., Lutz, D., et al. 2012, A&A, 548, A22
- Marsden et al. (2014) Marsden, D., Gralla, M., Marriage, T. A., et al. 2014, MNRAS, 439, 1556
- Meyer & Roth (1991) Meyer, D. M. & Roth, K. C. 1991, ApJ, 376, L49
- Müller (2010) Müller, H. S. P. 2010, A&A, 514, L6
- Müller et al. (2005) Müller, H. S. P., Schlöder, F., Stutzki, J., & Winnewisser, G. 2005, Journal of Molecular Structure, 742, 215
- Negrello et al. (2017) Negrello, M., Amber, S., Amvrosiadis, A., et al. 2017, MNRAS, 465, 3558
- Negrello et al. (2010) Negrello, M., Hopwood, R., De Zotti, G., et al. 2010, Science, 330, 800
- Neri et al. (2020) Neri, R., Cox, P., Omont, A., et al. 2020, A&A, 635, A7
- Oke & Gunn (1983) Oke, J. B. & Gunn, J. E. 1983, ApJ, 266, 713
- Oliver et al. (2012) Oliver, S. J., Bock, J., Altieri, B., et al. 2012, MNRAS, 424, 1614
- Omont et al. (2013) Omont, A., Yang, C., Cox, P., et al. 2013, A&A, 551, A115
- Oteo et al. (2016) Oteo, I., Ivison, R. J., Dunne, L., et al. 2016, ApJ, 827, 34
- Oteo et al. (2017) Oteo, I., Zhang, Z. Y., Yang, C., et al. 2017, ApJ, 850, 170
- Peeples & Shankar (2011) Peeples, M. S. & Shankar, F. 2011, MNRAS, 417, 2962
- Peng et al. (2002) Peng, C. Y., Ho, L. C., Impey, C. D., & Rix, H.-W. 2002, AJ, 124, 266
- Peng & Maiolino (2014) Peng, Y.-j. & Maiolino, R. 2014, MNRAS, 443, 3643
- Perley & Butler (2017) Perley, R. A. & Butler, B. J. 2017, ApJS, 230, 7
- Pilbratt et al. (2010) Pilbratt, G. L., Riedinger, J. R., Passvogel, T., et al. 2010, A&A, 518, L1
- Planck Collaboration et al. (2011) Planck Collaboration, Abergel, A., Ade, P. A. R., et al. 2011, A&A, 536, A21
- Planck Collaboration et al. (2016) Planck Collaboration, Ade, P. A. R., Aghanim, N., et al. 2016, A&A, 586, A132
- Planck Collaboration et al. (2020) Planck Collaboration, Aghanim, N., Akrami, Y., et al. 2020, A&A, 641, A6
- Planck Collaboration et al. (2015a) Planck Collaboration, Aghanim, N., Altieri, B., et al. 2015a, A&A, 582, 29
- Planck Collaboration et al. (2015b) Planck Collaboration, Fermi Collaboration, Ade, P. A. R., et al. 2015b, A&A, 582, A31
- Polletta et al. (2007) Polletta, M., Tajer, M., Maraschi, L., et al. 2007, ApJ, 663, 81
- Priestley & Whitworth (2020) Priestley, F. D. & Whitworth, A. P. 2020, MNRAS, 494, L48
- Rangwala et al. (2011) Rangwala, N., Maloney, P. R., Glenn, J., et al. 2011, ApJ, 743, 94
- Rémy-Ruyer et al. (2014) Rémy-Ruyer, A., Madden, S. C., Galliano, F., et al. 2014, A&A, 563, A31
- Reuter et al. (2020) Reuter, C., Vieira, J. D., Spilker, J. S., et al. 2020, arXiv e-prints, arXiv:2006.14060
- Riechers et al. (2013) Riechers, D. A., Bradford, C. M., Clements, D. L., et al. 2013, Nature, 496, 329
- Riechers et al. (2011) Riechers, D. A., Carilli, C. L., Maddalena, R. J., et al. 2011, ApJ, 739, L32
- Riechers et al. (2017) Riechers, D. A., Leung, T. K. D., Ivison, R. J., et al. 2017, ApJ, 850, 1
- Riechers et al. (2008) Riechers, D. A., Walter, F., Brewer, B. J., et al. 2008, ApJ, 686, 851
- Riechers et al. (2010) Riechers, D. A., Weiß, A., Walter, F., & Wagg, J. 2010, ApJ, 725, 1032
- Rizzo et al. (2018) Rizzo, F., Vegetti, S., Fraternali, F., & Di Teodoro, E. 2018, MNRAS, 481, 5606
- Rubin et al. (2012) Rubin, K. H. R., Prochaska, J. X., Koo, D. C., & Phillips, A. C. 2012, ApJ, 747, L26
- Sánchez Almeida et al. (2014) Sánchez Almeida, J., Elmegreen, B. G., Muñoz-Tuñón, C., & Elmegreen, D. M. 2014, A&A Rev., 22, 71
- Schmidt (1959) Schmidt, M. 1959, ApJ, 129, 243
- Schreiber et al. (2015) Schreiber, C., Pannella, M., Elbaz, D., et al. 2015, A&A, 575, A74
- Sharon et al. (2015) Sharon, C. E., Baker, A. J., Harris, A. I., et al. 2015, ApJ, 798, 133
- Sharon et al. (2019) Sharon, C. E., Tagore, A. S., Baker, A. J., et al. 2019, ApJ, 879, 52
- Solomon & Vanden Bout (2005) Solomon, P. M. & Vanden Bout, P. A. 2005, ARA&A, 43, 677
- Somerville & Davé (2015) Somerville, R. S. & Davé, R. 2015, ARA&A, 53, 51
- Spilker et al. (2018) Spilker, J. S., Aravena, M., Béthermin, M., et al. 2018, Science, 361, 1016
- Spilker et al. (2014) Spilker, J. S., Marrone, D. P., Aguirre, J. E., et al. 2014, ApJ, 785, 149
- Staniszewski et al. (2009) Staniszewski, Z., Ade, P. A. R., Aird, K. A., et al. 2009, ApJ, 701, 32
- Stanley et al. (2020) Stanley, F., Knudsen, K. K., Aalto, S., et al. 2020, arXiv e-prints, arXiv:2011.09991
- Stone et al. (2016) Stone, M., Veilleux, S., Meléndez, M., et al. 2016, ApJ, 826, 111
- Swinbank et al. (2011) Swinbank, A. M., Papadopoulos, P. P., Cox, P., et al. 2011, ApJ, 742, 11
- Tacconi et al. (2018) Tacconi, L. J., Genzel, R., Saintonge, A., et al. 2018, ApJ, 853, 179
- Tacconi et al. (2020) Tacconi, L. J., Genzel, R., & Sternberg, A. 2020, arXiv e-prints, arXiv:2003.06245
- Tagore & Jackson (2016) Tagore, A. S. & Jackson, N. 2016, MNRAS, 457, 3066
- Tagore & Keeton (2014) Tagore, A. S. & Keeton, C. R. 2014, MNRAS, 445, 694
- Thomson et al. (2014) Thomson, A. P., Ivison, R. J., Simpson, J. M., et al. 2014, MNRAS, 442, 577
- Tody (1986) Tody, D. 1986, in Society of Photo-Optical Instrumentation Engineers (SPIE) Conference Series, Vol. 627, Instrumentation in astronomy VI, ed. D. L. Crawford, 733
- Tumlinson et al. (2017) Tumlinson, J., Peeples, M. S., & Werk, J. K. 2017, ARA&A, 55, 389
- Valentino et al. (2020) Valentino, F., Daddi, E., Puglisi, A., et al. 2020, A&A, 641, A155
- Valiante et al. (2016) Valiante, E., Smith, M. W. L., Eales, S., et al. 2016, MNRAS, 462, 3146
- van Dishoeck et al. (1993) van Dishoeck, E. F., Jansen, D. J., Schilke, P., & Phillips, T. G. 1993, ApJ, 416, L83
- Vieira et al. (2010) Vieira, J. D., Crawford, T. M., Switzer, E. R., et al. 2010, ApJ, 719, 763
- Weingartner & Draine (2001) Weingartner, J. C. & Draine, B. T. 2001, ApJ, 548, 296
- Weiß et al. (2013) Weiß, A., De Breuck, C., Marrone, D. P., et al. 2013, ApJ, 767, 88
- Weiß et al. (2007) Weiß, A., Downes, D., Neri, R., et al. 2007, A&A, 467, 955
- Weiß et al. (2003) Weiß, A., Henkel, C., Downes, D., & Walter, F. 2003, A&A, 409, L41
- Weiß et al. (2005) Weiß, A., Walter, F., & Scoville, N. Z. 2005, A&A, 438, 533
- Whitaker et al. (2014) Whitaker, K. E., Franx, M., Leja, J., et al. 2014, ApJ, 795, 104
- Wiseman et al. (2017) Wiseman, P., Perley, D. A., Schady, P., et al. 2017, A&A, 607, A107
- Wright et al. (2010) Wright, E. L., Eisenhardt, P. R. M., Mainzer, A. K., et al. 2010, AJ, 140, 1868
- Yabe et al. (2015) Yabe, K., Ohta, K., Akiyama, M., et al. 2015, ApJ, 798, 45
- Yang et al. (2013) Yang, C., Gao, Y., Omont, A., et al. 2013, ApJ, 771, L24
- Yang et al. (2020) Yang, C., González-Alfonso, E., Omont, A., et al. 2020, A&A, 634, L3
- Yang et al. (2017) Yang, C., Omont, A., Beelen, A., et al. 2017, A&A, 608, A144
- Yang et al. (2016) Yang, C., Omont, A., Beelen, A., et al. 2016, A&A, 595, A80
- Zhang et al. (2014) Zhang, Z.-Y., Gao, Y., Henkel, C., et al. 2014, ApJ, 784, L31
Appendix A Details of lens model
The statistical uncertainties on the lens model parameters, for both the foreground lens object and the HerBS-89a lensed source were computed via two MCMC run, focusing on the lens and the source, respectively (see Section 5). Figure 20 and 21 show the posterior distribution of the lens and source parameters, as obtained with MCMC.
In order to perform the kinematic analysis described in Sect. 7, we apply the lens model to high resolution emission line data preserving the velocity information by fitting Sérsic profiles to channel images in the data cubes. To obtain a sufficient S/N ratio, we bin the channels of and by a factor of 3 and 6, respectively. Despite this rebinning, the S/N ratios for some of the channels is still very low.
Figures 22 and 23 present the results of this channel by channel modelling, for the and emission lines, respectively.
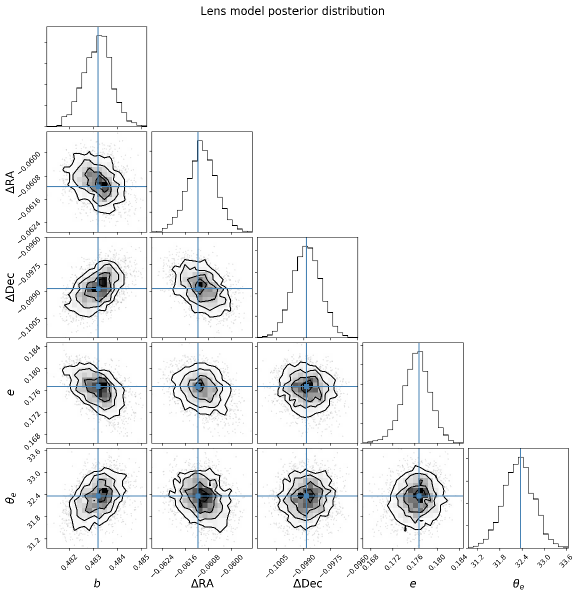
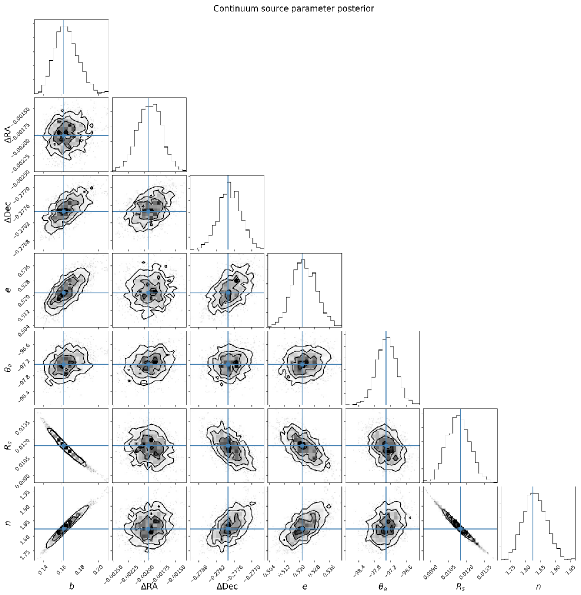
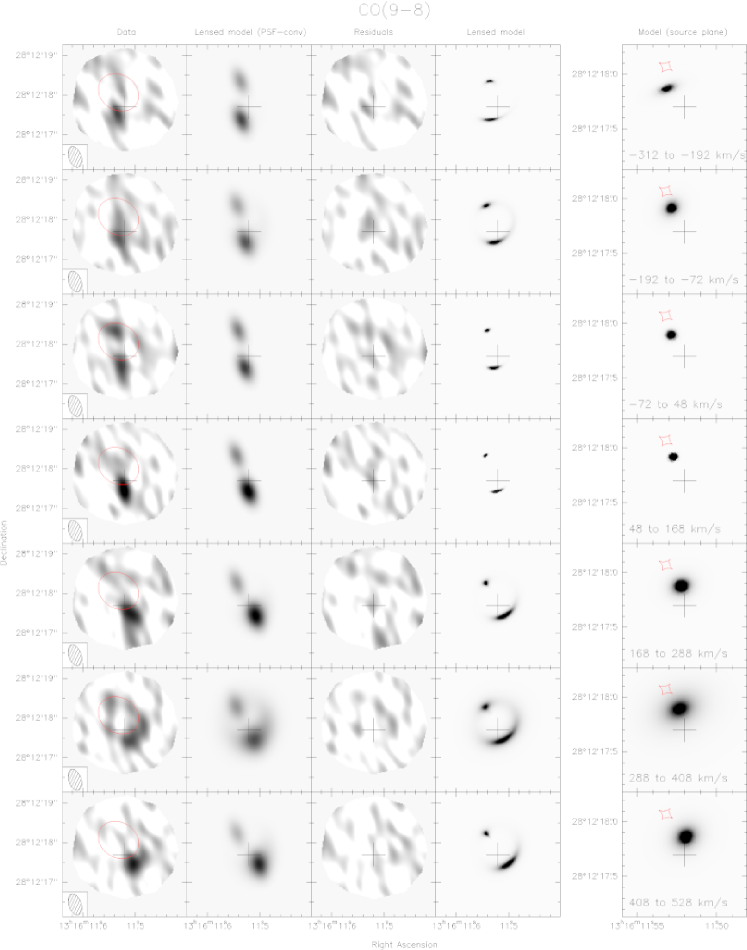
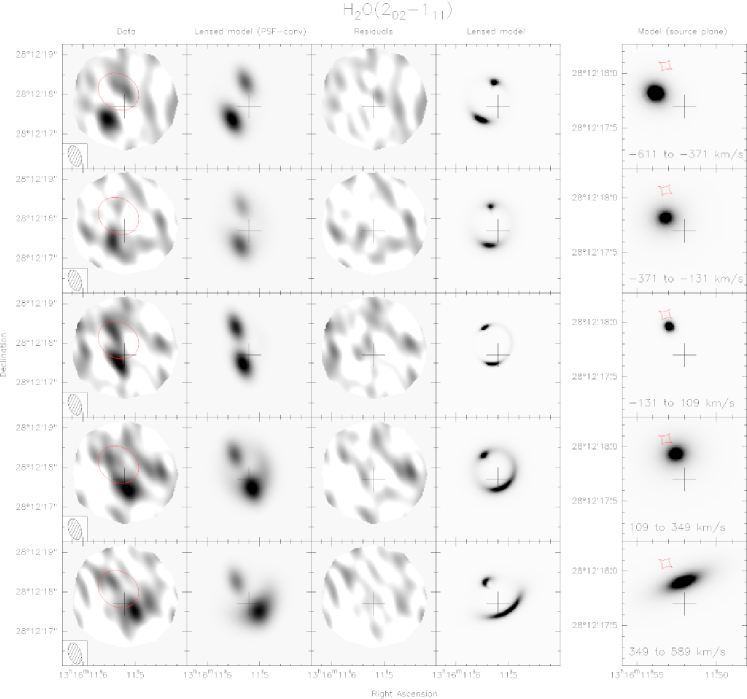
Appendix B Review of values
Although the use of the MBB model and Eq. 5 to derive dust masses is common and well-established in the literature, the actual value of is far from being well defined. Moreover, it is not granted that a universal value shared by all galaxies does exist; evidence rather points to the opposite. We here review the current status on taking into account recent studies
The common preference found in the literature is to adopt the values tabulated by Li & Draine (2001) or its updated version by Draine (2003). At 850 m, the reference value is m2 kg-1 with a dependence on frequency at and 600 m (Berta et al. 2016). To reconcile with a small conflict between the dust to hydrogen mass ratio predicted by their model and the elemental abundances in the solar neighborhood ISM, Draine et al. (2014) re-normalized their dust properties such that and m2 kg-1. Hensley & Draine (2020) discuss more recent finding, that could lead to further possible corrections towards larger . A larger value m2 kg-1 come also from the THEMIS dust model (Jones et al. 2013, 2017), which is in agreement with the measured all sky extinction from SDSS quasars (Planck Collaboration et al. 2016).
The tabulated values mentioned above are theoretical (see, e.g., Weingartner & Draine 2001) and an alternative path is to adopt an empirical value of , measured at a reference frequency and then scale it to any other frequency using the power law with index as usual. Studying a sample of 22 local galaxies with known metallicities and available sub-mm data, James et al. (2002) derived m2 kg-1.
Using Herschel observations of local galaxies M 99 and M 100, Eales et al. (2010b) derive a value of m2 kg-1 at 350 m, corresponding to m2 kg-1 adopting a dust emissivity index . From early solar-neighborhood Planck results, a value m2 kg-1 is derived161616Planck Collaboration et al. (2011) measure cm2 for the solar neighborhood. Using the relation (Bianchi et al. 2019; Planck Collaboration et al. 2015b), this leads to m2 kg-1. Here and a dust to hydrogen mass ratio (Draine et al. 2014) were adopted. The quantity is the mass of the the hydrogen atom. It is worth to note the strong dependence of on and : different choices lead to significantly different values of . Typical alternatives to the values mentioned above are, for example, (often found in the literature) and (Jones et al. 2017). See Bianchi et al. (2019) for an in depth description., roughly twice the commonly adopted value by Draine (2003). Recently, Clark et al. (2016) assembled a sample of 22 galaxies from the Herschel Reference Survey (Boselli et al. 2010) and derived a value of m2 kg-1 at 500 m, corresponding to . Significant variations of at sub-galactic scales are shown by Clark et al. (2019).
Such very low values of obtained for external galaxies are nevertheless subject to several caveats related to the derivation method, and thus need to be taken with caution. To mention a few: the sight-lines intercept a range of media, and possibly multiple temperature dust components; the assumptions made about dust-to-metals ratios need solid metallicity measurements and might depend on the adopted calibration; a variable brings further uncertainties. For further discussions, see for example Priestley & Whitworth (2020).
Finally, Clark et al. (2016, 2019) present a thorough compilation of the values of found in the literature to date, and remarkably collect values spanning a range of more that three orders of magnitude (at their reference 500 m wavelength; see the respective Figs. 1 in the above mentioned papers).
With these results in mind, it is clear that a proper comparison of dust masses to literature values must take into account the different assumptions underlying the SED modelling. In order to follow a popular choice in this field, we here adopted the Draine (2003) , applying the correction prescribed by Draine et al. (2014) to dust masses (as derived with both the MBB and DL07 modelling).