Long–Term Variations in Solar Differential Rotation and Sunspot Activity, II: Differential Rotation Around the Maxima and Minima of Solar Cycles 12 – 24
Abstract
Studies of variations in the solar differential rotation are important for understanding the underlying mechanism of solar cycle and other variations of solar activity. We analyzed the sunspot-group daily data that were reported by Greenwich Photoheliogrphic Results (GPR) during the period 1874 – 1976 and Debrecen Photoheliographic Data (DPD) during the period 1977 – 2017. We determined the equatorial rotation rate [] and the latitude gradient [] components of the solar differential rotation by fitting the data in each of the 3-year moving time intervals (3-year MTIs) successively shifted by one year during the period 1874 – 2017 to the standard law of differential rotation. The values of and around the years of maxima and minima of Solar Cycles 12 – 24 are obtained from the 3-year MTIs series of and and studied the long–term cycle-to-cycle modulations in these coefficients. Here we have used the epochs of the maxima and minima of the Solar Cycles 12 – 24 that were recently determined from the revised Version-2 international sunspot-number series. We find that there exits a considerably significant secular decreasing-trend in around the maxima of solar cycles. There exist no secular trends in both and around the minima of solar cycles. The secular trend in around the maxima of solar cycles is also found to be statistically insignificant. We fitted a cosine function to the values of , and also to those of , after removing the corresponding linear trends. The cosine-fits suggest that there exist 54-year (94-year) and 82-year (79-year) periodicities in () around the maxima and minima of solar cycles, respectively. The amplitude of the cosine-profile of () around the minima of solar cycles is about 41 % (65 %) larger than that of () of around the maxima. In addition, the cosine profiles of and suggest a large (up to ) phase difference between the long-term variations of , and also between those of , of around maxima and minima of solar cycles. Implications of all these results are discussed briefly.
keywords:
Sun: Dynamo – Sun: surface magnetism – Sun: activity – Sun: sunspots1 Introduction
Solar dynamo models explain several properties of solar cycle (\opencitebab61; \opencitedg06; \opencitecamer17). The solar differential rotation is an important ingredient in these models. Solar activity vary in many time scales. Therefore, studies of variations in solar differential rotation are important for better understanding the physical mechanism of solar cycle and other variations of solar activity. Variations in the differential rotation of the Sun’s outer layers have been known for several decades. Many authors studied the solar cycle variation and other short- and long–term variations in the differential rotation by using different data and techniques (\opencitehr76; \opencitegh84; \opencitesh85; \opencitejsb85; \opencitebalth86; \opencitekn90; \opencitesnod92; \opencitekhh93; \openciteyk93; \opencitejg95; \opencitemak97; \opencitejj03, 2005, 2011, 2013; \opencitegupta99; \opencitejk99; \opencitekgk02; \opencitebraj06; \openciteju06; \opencitesvand08; \opencitejub09; \opencitecvi10; \openciteli14, \opencitejb16; \openciteos16; \opencitebo17; \openciteruz17; \openciteroudi18). However, so far only the 11-year period torsional oscillation of photospheric layers was discovered by \inlinecitehl80 and \inlinecitelh82 is established. Helioseismic techniques have revealed that the torsional oscillation pattern extends inward up to about one-third thickness of the Sun’s convection zone (\opencitehowe00). Other results to some extent established are: both equatorial rate and latitude gradient of rotation are large at solar minimum than at maximum, and we have a secular decrease of the solar equatorial rotation with secular increase of activity (see \openciteruz17 and the references therein).
jbu05a (hereafter Article-I) analyzed the Greenwich and Solar Optical Observing Network (SOON) sunspot-group data during the period 1874 – 2007 and determined the average values of the coefficients of differential rotation during each of the Solar Cycles 12 – 22 to study the cycle-to-cycle modulation in these coefficients and found the secular decrease (about day-1 cycle-1) of the cycle-to-cycle modulation in the equatorial rotation rate. \inlinecitebalth86, \inlinecitebraj06, and \inlineciteli14 have also studied in detail the cycle-to-cycle variations in the solar differential rotation. In Article-I cosine functions to the values of the coefficients of differential rotation were fitted and we found the existence of a 79-year cycle (Gleissberg cycle) in the latitude gradient of rotation. \inlinecitesuz14 found that a period of about 6–7 solar cycles exits in long-term modulation of the latitude gradient of differential rotation. It should be noted here a number of authors have found changes in the period (60–130-year) of the Gleissberg cycle (\opencitegarc98; \opencitehath99; \openciteroze94; \openciteogurt02; \opencitehath15; \opencitejj17). Recently, \inlinecitejj19 determined cycle-to-cycle variations in the sunspot activity at the minima and the maxima of Solar Cycles 12 – 24 and noticed that there exists a difference in the long-term periodicities of the activity at solar minimum and maximum. The rotation rates of magnetic active regions (sunspot groups, etc.) vary with life times and sizes (areas) of the active regions. Large/long-lived sunspot groups rotate more slowely than small/short-lived sunspot groups (\opencitewar65, 1966; \opencitehgg84; \opencitebalth86). This could have to do with the magnetic structures of large and small sunspot groups anchoring at deep and shallow layers of the solar convection zone, respectively (\opencitejg97; \opencitehi02; \opencitesiva03). The average size of sunspot groups in the minimum of a solar cycle is smaller than that of the sunspot groups in the maximum. Hence, the study of solar differential rotation of the sunspot groups at solar minimum and maximum may be useful for better understanding the physical mechanism of the solar long-term variability. In the present analysis we determined the values of the coefficients of differential rotation in the 3-year MTIs during the period 1874 – 2017. From the obtained time series we determined the values of the coefficients of differential rotation of the sunspot groups around the minima and maxima of Solar Cycles 12 – 24 and separately study the long-term cycle-to-cycle modulations in the coefficients of the differential rotation around the maxima and minima of solar cycles.
In the next section we describe the data and method of analysis. In Section 2 we present results and in Section 3 we present conclusions and discuss upon them briefly.
2 Data and Method of Analysis
Here we have used the daily sunspot-group data reported in GPR during the period April 1874 – December 1976 and DPD during the period January 1977 – June 2017. These data are downloaded from the website fenyi.solarobs.unideb.hu/pub/DPD/. The details about these data can be found in \inlinecitegyr10, \inlinecitebara16, and \inlinecitegyr17. These data contain the date and time of observation (we converted these into date with fractional day, []), heliographic latitude [] and longitude [], corrected whole-spot area, and central meridian distance [CMD], etc. of a sunspot group for each of the days it was observed. Here each disk passage of a recurrent sunspot group is treated as an independent sunspot group and in order to reduce the foreshortening effect (if any), we have not used the data in any day of the sunspot group life-time/disk passage ([], its values are 2, 3,,12 days). We have determined the equatorial rotation rate [] and the latitudinal gradient [] of the solar differential rotation by fitting the data corresponding to a specified time-interval to the standard law of differential rotation:
where is the solar sidereal rotation rate at the latitude , 2, 3,,, and is the Carrington rigid body rotation rate of the Sun. In all our earlier analyzes we have assigned the velocity value to the mean of and . Following the suggestion by \inlineciteok05 here we assigned the velocity value to the (also see \opencitesudar14). The data correspond to day-1 and the latitudinal drift day-1 are excluded. This considerably reduced the uncertainties (standard deviations) in the derived values of and (\opencitewar65, 1966; \opencitejg95). The data corresponding days (non-consecutive days) are also excluded. This further reduced the uncertainties in and . In order to have a better statistics (particularly during solar minimum) first we have fitted Equation 1 to the data in the 3-year MTIs 1874 – 1876, 1875 – 1877,,2015 – 2017 during the period 1874 – 2017. Northern- and southern-hemispheres’ data are combined. The values of and around the years of maxima and minima ( in the 3-year intervals in which the years of maxima and minima are middle years) of the Solar Cycles 12 – 24 are obtained from the 3-year MTIs series of and . We have used the epochs of the maxima and the minima, cycle-lengths, of the Solar Cycles 12 – 24 that were recently determined by \inlinecitepesnell18 using the revised Version-2 international sunspot-number (SN) series.
3 Results
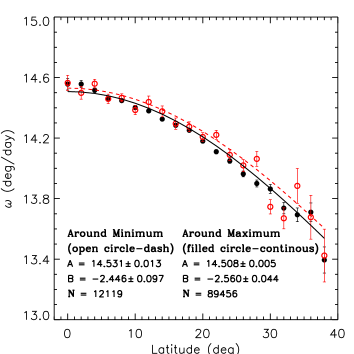
In Table 1, we have given the values of mean sidereal angular velocity (, in degree day-1) and corresponding uncertainty (standard error, ) in different latitude () intervals, determined from the sunspot-group data around the minima ( from the combined data in the intervals 1877–1879, 1889–1891, 1901–1903, 1912–1914, 1922–1924, 1932–1934, 1943–1945, 1953–1955, 1975–1977, 1985–1987, 1995–1997, and 2007–2009) and around the maxima (i.e. from the combined data in the intervals 1882–1884, 1893–1895, 1905–1907, 1916–1918, 1927–1929, 1936–1938, 1946–1948, 1957–1959, 1967–1969, 1978–1980, 1988–1990, 2000–2002, and 2013–2015) of Solar Cycles 12–24. In this table the corresponding number () of the velocity values in each latitude interval is also given. Northern- and southern-hemispheres’ data are folded. In many latitude intervals is considerably large. Hence, the corresponding uncertainties in the values of the mean angular velocities are reasonably small.
| Latitude | Around minimum | Around maximum | |||||
|---|---|---|---|---|---|---|---|
| interval | |||||||
| – | 14.57 | 0.05 | 318 | 14.56 | 0.04 | 550 | |
| – | 14.50 | 0.04 | 473 | 14.56 | 0.02 | 1452 | |
| – | 14.56 | 0.03 | 830 | 14.52 | 0.02 | 3393 | |
| – | 14.46 | 0.03 | 875 | 14.46 | 0.01 | 5412 | |
| – | 14.47 | 0.03 | 1094 | 14.45 | 0.01 | 7627 | |
| – | 14.39 | 0.03 | 805 | 14.40 | 0.01 | 9350 | |
| – | 14.44 | 0.04 | 542 | 14.38 | 0.01 | 10290 | |
| – | 14.38 | 0.04 | 642 | 14.33 | 0.01 | 10136 | |
| – | 14.30 | 0.04 | 608 | 14.28 | 0.01 | 9575 | |
| – | 14.28 | 0.03 | 866 | 14.25 | 0.01 | 8459 | |
| – | 14.21 | 0.03 | 1147 | 14.18 | 0.01 | 6528 | |
| – | 14.22 | 0.03 | 1081 | 14.11 | 0.01 | 5086 | |
| – | 14.09 | 0.04 | 796 | 14.05 | 0.02 | 3914 | |
| – | 14.02 | 0.04 | 700 | 13.96 | 0.02 | 2681 | |
| – | 14.06 | 0.05 | 520 | 13.90 | 0.02 | 1792 | |
| – | 13.75 | 0.05 | 357 | 13.86 | 0.03 | 1224 | |
| – | 13.67 | 0.07 | 212 | 13.74 | 0.04 | 811 | |
| – | 13.88 | 0.12 | 104 | 13.69 | 0.05 | 492 | |
| – | 13.68 | 0.14 | 59 | 13.71 | 0.06 | 321 | |
| – | 13.42 | 0.17 | 37 | 13.39 | 0.09 | 154 | |
Figure 1 shows the mean latitude dependence of the solar sidereal rotation rate [] around the minima and around the maxima of Solar Cycles 12 – 24 determined from the sunspot-group data of these cycles. In this figure we have shown the profiles of the differential rotation deduced from the values of the coefficients and of Equation 1, and also the values of determined by averaging the data into latitude intervals, which are also given in Table 1. Northern- and southern-hemispheres’ data are folded. As can be seen in this figure, as already known ( \opencitebalth86; \opencitekhh93; \opencitegupta99; \opencitejj03; \opencitebraj06; \openciteruz17), the mean angular velocity of the sunspot groups around the minima of the solar cycles is slightly larger than that of the sunspot groups around the maxima in all latitudes (see the dashed and the continuous curves). Around the minima of the solar cycles the mean equatorial velocity is about 0.16 % larger than that around the maxima (this difference is statistically significant on at least 1.9 level, where is standard deviation of around minima). The mean latitude gradient around the maxima is about 4.4 % larger than that around the minima (it is consistent with the fact that dynamo action is strong during maximum and weak during minimum), but this difference is statistically highly insignificant, i.e. only 1.2 level (around the minima the number of data points is about 86 % lower than that of the around the maxima). On the other hand, there exist considerable cycle-to-cycle variations in both and around the maxima as well as those around the minima of Solar Cycles 12 – 24 (see below).
| Cycle | Interval | |||||
| 12 | 3.7 | 1877–1879 | 1878 | 314 | ||
| 13 | 8.3 | 1889–1891 | 1890 | 1188 | ||
| 14 | 4.5 | 1901–1903 | 1902 | 654 | ||
| 15 | 2.5 | 1912–1914 | 1913 | 429 | ||
| 16 | 9.4 | 1922–1924 | 1923 | 928 | ||
| 17 | 5.8 | 1932–1934 | 1933 | 680 | ||
| 18 | 12.9 | 1943–1945 | 1944 | 1346 | ||
| 19 | 5.1 | 1953–1955 | 1954 | 1221 | ||
| 20 | 14.3 | 1963–1965 | 1964 | 1135 | ||
| 21 | 17.8 | 1975–1977 | 1976 | 1288 | ||
| 22 | 13.5 | 1985–1987 | 1986 | 1215 | ||
| 23 | 11.2 | 1995–1997 | 1996 | 1204 | ||
| 24 | 2.2 | 2007–2009 | 2008 | 517 | ||
| 2008–2010 | 2009a | 784 | ||||
| 12 | 124.4 | 1882–1884 | 1883 | 4043 | ||
| 13 | 146.5 | 1893–1895 | 1894 | 5694 | ||
| 14 | 107.1 | 1905–1907 | 1906 | 4037 | ||
| 15 | 175.7 | 1916–1918 | 1917 | 5998 | ||
| 16 | 130.2 | 1927–1929 | 1928 | 5171 | ||
| 17 | 198.6 | 1936–1938 | 1937 | 6870 | ||
| 18 | 218.7 | 1946–1948 | 1947 | 8006 | ||
| 19 | 285.0 | 1957–1959 | 1958 | 10379 | ||
| 20 | 156.6 | 1967–1969 | 1968 | 6367 | ||
| 21 | 232.9 | 1978–1980 | 1979 | 9186 | ||
| 22 | 212.5 | 1988–1990 | 1989 | 7853 | ||
| 23 | 180.3 | 2000–2002 | 2001 | 8849 | ||
| 24 | 116.4 | 2013–2015 | 2014 | 7003 |
.


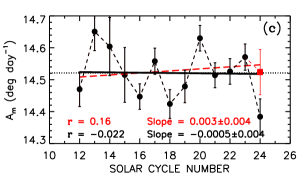
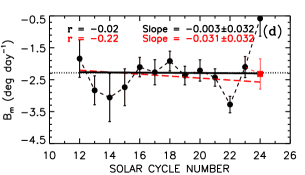
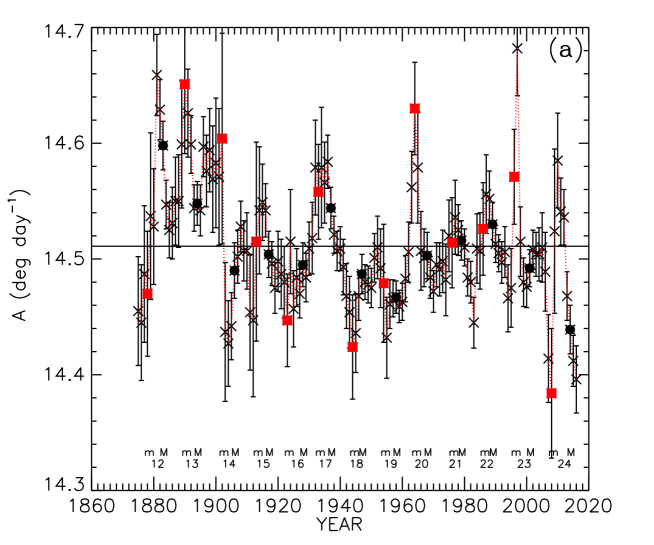
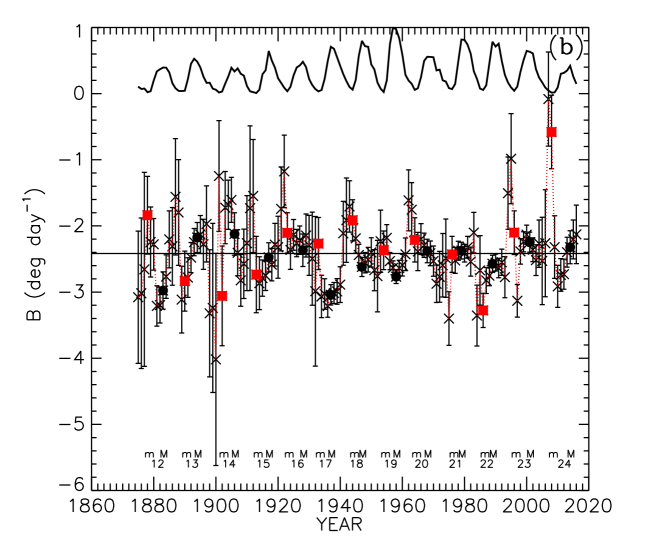
Figure 2 shows variations in and determined from the sunspot group data (northern- and southern-hemispheres’ data are combined) in the 3-year MTIs 1875 – 1877, 1876 – 1878, , 2015 – 2017 during the period 1874 – 2017. In Table 2 we have given the values of and around the maxima and minima of Solar Cycles 12 – 24 obtained from the aforementioned 3-year MTIs. These values are indicated in Figure 2 by the filled-circles and the filled-squares, respectively. We have also shown the values of and obtained from the data in the interval 2008–2010. The reason for this is given below. The description of the yearly variations of and can be found in our earlier papers, \inlinecitejg95 and \inlinecitejk99, and in the paper by \inlineciteruz17. Here we concentrated on cycle-to-cycle modulations in and . \inlineciteruz17 have noted that when a significant peak of equatorial rotation velocity is observed during minimum of activity, the strength of the next maximum is smaller than the previous one. This is not found from Figure 2.
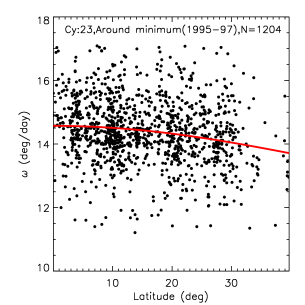
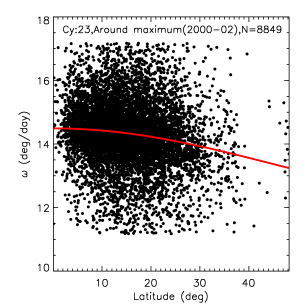
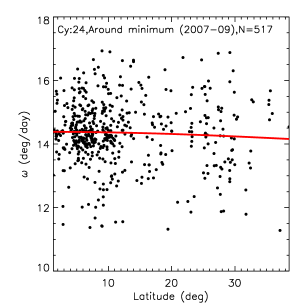
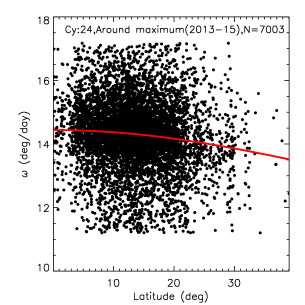
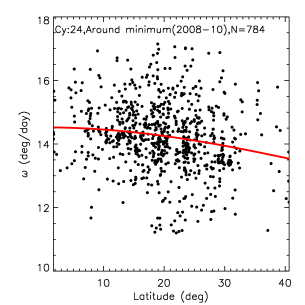
Equation 1 is found to be not fitted well to the data in around minima of cycles. This is, obviously, because of insufficient data caused by large scarcity of sunspots at high latitudes of sunspot belt. As can be seen in Figure 2 around the minimum of Solar Cycle 24 the values of and are abnormally low. In Figure 3 we show the latitude dependence of angular velocity during the 3-year intervals that comprise the epochs of minima and the maxima of Solar Cycles 23 and 24. Northern- and southern-hemispheres’ data are combined. In this figure the continuous curves represent the corresponding profiles of the differential rotation deduced from the values of the coefficients and in Equation 1, which are also given in Table 2. As can be seen in this figure, the coefficients and reasonably well determined, Equation 1 is reasonably well fitted to the data around the maxima of Solar Cycles 23 and 24 and even around the minimum of Solar Cycle 23. The corresponding fit is not good around the minimum of Solar Cycle 24, in the interval 2007–2009, because there is a large scarcity of data in higher latitudes of the sunspot latitude-belt (less overlap of Solar Cycles 23 and 24). Therefore, we have also checked the results by considering tentatively 2009 for minimum epoch of Solar Cycle 24 and in Figure 3 we have also shown the latitude dependence of the velocity in the interval 2008–2010 (middle year is 2009). The fit of Equation 1 to the data of this interval is reasonably good (Note: in the 13-month smoothed monthly mean of the revised SN, 2008.958, around 15 November 2008, is the minimum epoch of Solar Cycle 24.)
Figure 4 shows
the cycle-to-cycle variations in the values of
, , , and ,
the values of and around
the maxima and around the minima of Solar Cycles 12–24
given in Table 2
(the suffixes M and m indicate epochs of sunspot maximum and minimum,
the middle years of the 3-year intervals that comprise these
years, respectively). For the reason given above, besides the values
of and in the interval 2007–2009 that comprises 2008 in its middle,
we have also shown the corresponding values in the interval 2008–2010
that comprises 2009 in its middle.
The linear least-square fit correspond to each of these parameters is
done by taking uncertainty in the parameter,
is used.
In Article-I the existence of a secular decreasing trend was found
in the cycle-to-cycle modulation of determined from the
sunspot group data (over the whole cycle)
of Solar Cycles 12 – 22, but it was not found in the corresponding
modulation in .
As can be seen in Figure 4
there exist no notable secular trends in both and
, whereas
there is a considerably significant secular decreasing-trend in
(the slope is about five times larger than
its standard deviation). The decreasing trend of
is slightly less steeper (slope ) than that of
the average over the whole cycle (slope ) found in
Article-I. There is a secular decreasing trend in
( the secular decreasing trend in the latitudinal gradient around
maxima of solar cycles), but it is not well defined (the slope is only
about 1.5 times of its standard deviation).
We find the following correlations ( represents the
correlation coefficient and the values given within parentheses
are found when 2009 is considered for the minimum epoch of Solar Cycle 24):
() between and ,
() between and ,
() between and ,
between and ,
() between and , and
() between and .
The anticorrelation
between and implies that an increase in the equatorial rotation rate
with an increase in the latitude gradient of rotation, and vise-versa
(it should be noted that is negative).
We find no significant correlation between
sunspot number (either the value of sunspot minimum [] or
of maximum [])
and or (the highest correlation,
, is found between and ).
However, the existence of secular decrease of with secular
increase of solar activity seems to be some extent established
(see \openciteli14; \openciteos16; \openciteruz17,
and the references therein).
The existence of a positive correlation between
determined from the whole-cycle data and length of cycle is known
(\opencitemend99). In Article-I a relatively weak correlation
() was found between and cycle-length
from the data of Solar Cycles 12 – 22 and based on that
a short length was predicted for Cycle 23.
That prediction is incorrect (Cycle 23 is a long cycle).
Here the correlation between
and cycle-length is found highly insignificant.
The following reasonably large correlations () are
found (the values given within parentheses are found when
2009 is considered for the minimum epoch of Solar Cycle 24):
() between and cycle length,
() between and cycle declining time, and
() between and cycle rising time.
Using the value of of Solar Cycle 24 in the linear relationship correspond to the aforementioned highest correlation between and cycle-declining time (determined from the data of Cycles 12 – 23), we obtained years for the declining time of Cycle 24, which suggests that Solar Cycle 24 will end at , within the interval July 2019 – May 2020. This may be close to reality. However, the aforementioned correlations may not strong enough for prediction purpose.
Due to the large equatorial rotation rate there could be a strong Coriolis force at the minimum of a solar cycle, which greatly affects (decreases) the emergence of toroidal magnetic flux at low latitudes (\opencitechg87). Depending on the strength of this effect might persist throughout the corresponding solar cycle. In fact, a reasonable correlation is also exist between and cycle-length. Coriolis forces act more effectively on small magnetic features, that may reduce the rate of emergence of toroidal flux at low latitudes (the effect of magnetic buoyancy force is large on large magnetic structures and plasma drag force is large on small magnetic structures). Hence, there is a reasonably good correlation between and the declining time of the corresponding cycle, suggesting that a large might cause a long declining time. It should be noted that a large absolute value of means a large latitude gradient, more differential rotation (strong dynamo). The existence of a reasonably good correlation between and rising time of a cycle may imply that more differential rotation during the minimum of a cycle might cause the cycle to rise fast. This in turn related to the amount of toroidal magnetic flux production depending on the strength of the differential rotation during the minimum of the cycle. However, the physical relationships of all the aforementioned correlations need investigations.
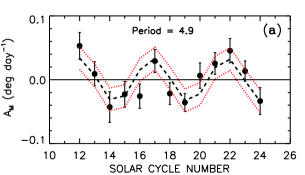
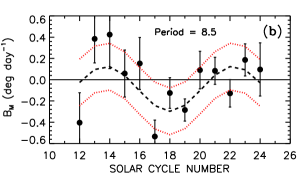
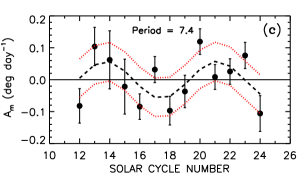
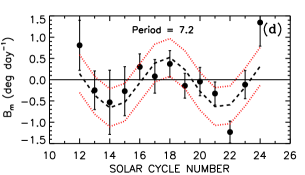
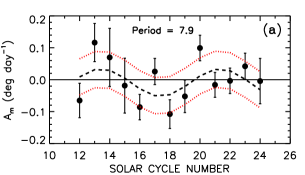
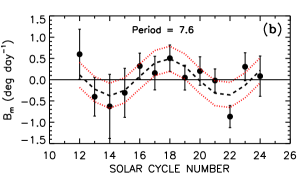
Figure 5 shows the best-fits of cosine functions to the values of , , , and that are given in Table 2, after subtracting the corresponding linear trends (in the cosine-fits is used). The cosine-fit to the data of most of the above parameters is reasonably good. Except in the case of the cosine-fit of , the of the cosine-fit to the data of each of the remaining parameters is reasonably small. In each of these cases, most of the data points are within the one-rmsd level. The obtained periods of , , , and are 4.9, 8.5, 7.4 and 7.2 (in number of solar cycles), -year, -year, -year, and -year, respectively (Note: the average period of a solar cycle is -year; see \opencitepesnell18.) Considerable differences exist in the periodicities of , and also in those of , that correspond to the epochs of maxima and minima of solar cycles. The amplitude ( day-1) of the cosine profile of is about 41 % larger than that ( day-1) of , whereas the amplitude ( day-1) of the cosine profile of is about 65 % larger than that ( day-1) of . The cosine profiles of and suggest the existence of a large (up to 180∘) phase (initial) difference (approximate anticorrelation) between and . The cosine profiles of and also suggest the existence of a large (up to 180∘) phase (initial) difference (approximate anticorrelation) between and . The cosine profiles of and seem to be approximately in phase (a positive correlation). The cosine profile of indicates that in the case around maxima of Solar Cycles 12–24, the equatorial rotation rate is maximum at Cycles 12, 17, and 22, and minimum at Solar Cycles 14, 19, and 24. The cosine profile of indicates that in the case of around minima of Solar Cycles 12–24 the equatorial rotation rate is maximum at Solar Cycles 13/14 and 21, and minimum at Solar Cycles 17/18 and 24. The cosine profile of indicates that in the case around maxima of Solar Cycles 12–24, the latitude gradient of rotation is maximum at Solar Cycle 18 and minimum at Solar Cycles 14 and 22. The cosine profile of indicates that in the case of around minima of Solar Cycles 12–24 the latitude gradient of rotation is maximum at Solar Cycles 14 and 21/22, and minimum at Solar Cycle 18 (it should be noted that and are having negative sign, a large negative value implies more differential rotation).
For the reason given above, we have repeated the calculations of the cosine fits for and by replacing the values of these parameters in interval 2007–2009 with that in interval 2008–2010, by considering the 2009, instead of 2008, for the minimum epoch of Solar Cycle 24. Figure 6a and 6b show the corresponding best-fits of cosine functions, which are more accurate than the corresponding ones shown in Figures 5c and 5b. That is, in the case of the cosine fits of both and that are shown in Figures 6a and 6b the values of are smaller, and in the case of the value of rmsd is also smaller than the corresponding fits shown in Figures 5c and 5d. The cosine fits shown in Figure 6 indicate the periodicities -year and -year for and , respectively, which are slightly longer than those indicated by the corresponding fits shown in Figure 5c and 5d. Except these all the suggestions made above remain the same.
Cent percent anticorrelation between and implies variations in equatorial rotation rate and magnitude of latitude gradient are perfectly in phase. Because of a large difference between the periods of and , there could be a large collapse (catastrophic) in the corresponding phases during Solar Cycles 12 – 24. The relatively less difference between the periods of and and the existence of an anticorrelation between the profiles of these parameters may suggest that around the minimum of a solar cycle the angular momentum transport from higher latitudes to the equator may be more efficient. The cosine profiles of and look to be in phase and in anti-phase during the alternate intervals of about 40 – 50-years (there exist a very weak correlation between and ; see above), causing reduction and improvement of flux emergence in the respective alternate intervals. Since as mentioned above the effect of persists throughout the cycle, there exist an approximate coherence in the cosine profiles of and , which my have a role in the toroidal flux production rate causing variations in the amplitudes of Gleissberg cycles.
4 Conclusions and Discussion
Studies of variations in the solar differential rotation are important for understanding the underlying mechanism of solar cycle and also other variations of solar activity. We analyzed GPR and DPD daily sunspot group data during the period 1874 – 1917 and determined the equatorial rotation rate [] and the latitude gradient [] of the solar differential rotation by fitting the data in each 3-year MTI during the period 1874 – 1917 to the standard law of differential rotation. The values of and around the years of maxima and minima of Solar Cycles 12 – 24 are obtained from the 3-year MTIs series of and and studied the long-term cycle-to-cycle modulations in these coefficients. Here we have used the epochs of the maxima and minima of the Solar Cycles 12 – 24 that were recently determined from the revised Version-2 international sunspot-number (SN) series. We find that there exits a considerably significant secular decreasing-trend in around the maxima of solar cycles. There exist no secular trends in both and around the minima of solar cycles. The secular trend in around the maxima of solar cycles is also found to be statistically insignificant. We fitted a cosine function to the values of , and also to those of , after removing the corresponding linear trends. The cosine-fits suggest that there exist 54-year (94-year) and 82-year (79-year) periodicities in () around the maxima and minima of solar cycles, respectively. The amplitude of the cosine-profile of () around the minima of solar cycles is about 41 % (65 %) larger than that of () of the maxima. In addition, the cosine profiles of and suggest a large (up to ) phase difference between the long-term variations of , and also between those of , around the maxima and minima of solar cycles.
In Article-I the combined Greenwich and SOON sunspot-group data during Solar Cycles 12–23 were analyzed and shown the existence of a -cycle in by fitting a cosine-fit to the cycle-to-cycle modulation of . The similar periodic modulations were also seen in the values of determined from the sunspot-group data of both the northern and the southern hemispheres (\opencitejbu05b). In \inlinecitejbu05b the cycle-to-cycle modulations in whole cycles and determined in Article-I were compared with the modulations found in and determined using the Kodaikanal Observatory (Solar Cycles: 15–21), Mt. Wilson Observatory (Solar Cycles: 16–21), Solar-Observatory Kanzelhöhe (Solar Cycles: 18–21), and National Observatory of Japan (Solar Cycles: 19-21) sunspot data bases and pointed out the differences/similarities in the results and some plausible causes for the differences. \inlinecitesuz14 analyzed the sunspot-group data measured in Mt. Wilson Observatory and their own measurements during Solar Cycles 16–23 and found the existence of a 6–7-cycle in the cycle-to-cycle modulation of (absolute values) determined from the whole-sphere data and also in the modulations of determined from the northern- and southern-hemispheres’ data. The pattern of the modulation of during Solar Cycles 16–23 that is found by \inlinecitesuz14 closely similar to the corresponding portion (from Cycle 16 to Cycle 23) of the modulation (of ) during Solar Cycles 12–23 found in Article-I, as well as to that of around maxima of the cycles in the current analysis. Also, it seems to closely fit to the corresponding portion of the cosine-curve of of whole cycles in Article-I and also to that of around the maxima of the cycles in the present analysis. Overall, all these results seem to strongly confirm the existence of about a 7-cycle modulation in determined from sunspot data. In \inlinecitesuz14 it is found that in Solar Cycle 16 the northern hemisphere value of is significantly smaller than that of the southern-hemisphere and almost monotonic decrease in the magnitude of in both the hemispheres from Solar Cycles-17 to 21. The overall pattern seems to be suggesting the existence of a phase-shift (occurred in Cycle 16) between the northern and southern hemispheres. In \inlinecitejbu05b it is found that except in Cycle 12 the magnitude of the northern-hemisphere is highly significantly larger than that of the southern hemisphere, in each of the remaining cycles the difference between the northern- and southern-hemispheres’ values of is statistically insignificant. That is, no phase difference is found between the cycle-to-cycle modulations in of northern and southern hemispheres. In the present analysis we have not studied the north–south asymmetry of the modulations in and around the maxima and the minima of solar cycles. In \inlinecitesuz14 error bars of values are relatively small. However, surprisingly in the largest Cycle 19 the error bar of seems to be largest. Particularly, the error bar of the northern-hemisphere’s value of of this cycle is much larger than that of the southern hemisphere and in fact, larger than those of both the northern- and southern-hemisphere’s values of the remaining all cycles. In Cycle 19 activity in northern hemisphere was larger that of southern hemisphere ( \opencitetem06; \opencitejj19). The gaps in Greenwich data due to missing days of observations are filled with the data from other observatories. Such an update of Mt. Wilson sunspot-group data may be necessary. \inlinecitesuz14 found that the modulation in determined from the data around the middle years (unequal intervals) of the solar cycles is almost the same as that of determined from the data of whole cycles. The arguments above on the modulation in of whole cycles also apply to the modulation in determined from the data around the middle years of the cycles. The modulations in and around the maxima of cycles found here are also closely similar to those of and determined from the data of the whole cycles shown in Article-I. This could be due to a large portion of the data of a cycle are coming from around the maximum of the cycle, the ratio of the size of a whole-cycle’s data to that of the data around the maximum is considerably small. In many studies of solar cycle-variations of and it has been found that the magnitudes of and are much larger, and larger fluctuations in the yearly variations of and , during the minima of many solar cycles than during the maxima (. \opencitebalth86; \opencitejg95, \opencitejj03). \inlinecitesuz14 found the same in the yearly variations of and also found that if the value of at minimum/maximum of a cycle is large, then the cycle-average value of is large. In spite of we have used here the 3-year intervals, there exist considerably large fluctuations in the values of and around the minima of some cycles (see Figure 2). We find the existence of an anticorrelation between the cycle-to-cycle modulations of around the maxima and the minima of cycles and for the reason mentioned above the modulation in around the maxima is almost the same as that of of the whole cycle. The average value of over all cycles maxima is found slightly larger that of over all cycles minima. However, the amplitude of the cosine-fit of around the minima of cycles is much larger than that of around the maxima.
The 54-year periodicity in around the maxima of solar cycles found here might confirm the 55-year grand cycle of was found by \inlineciteyk93 using National Astronomical Observatory of Japan (NAOJ) sunspot-group data during the period 1948 – 1987. The known 55-year periodicity of sunspot activity ( \opencitetan11; \opencitegao16; \opencitekomit16) may be related to the 54-year period of . The well-known Gleissberg cycle of solar activity may be related to the 94-year period in around maxima of solar cycles and to both the 82-year and the 79-year periods in and , respectively, around minima of solar cycles. That is, causes of the periodicities of solar activity may be have influences of the periodicities in and (also see Article-I; \opencitejb16). However, what causes the variations in and is not known yet, except that there are speculations for the existence of the Sun’s spin–orbit coupling (\opencitewood65; \opencitejuc03; \opencitejj05).
The maximum and minimum epochs of a solar cycle comprise relatively large and small numbers of large sunspot groups, respectively. The magnetic structures of large and small sunspot groups may anchor at relatively deep and shallow layers of the solar convection zone, respectively. Hence, the periodicities in and around the maxima and minima of solar cycles are different and might originate at relatively deep and shallow layers of the solar convection zone, respectively. However, the observed rotation rate of a sunspot group (in general a magnetic tracer) does not need to be the rotation rate of plasma at the anchoring depth of the sunspot group. The difference between the plasma and sunspot-group rotation rates depends upon the effects of the dynamical forces like magnetic buoyancy, Coriolis force, and drag force on the magnetic structure of the sunspot group ( \opencitedh94). Therefore, the cause of the differences in the periodicities of and around the maxima and minima of solar cycles still needs to be established.
5 Acknowledgments
The author thanks the anonymous referee for the critical review and for useful comments and suggestions. The author acknowledges the work of all the people contribute and maintain the GPR and DPD sunspot databases. The sunspot-number data are provided by WDC-SILSO, Royal Observatory of Belgium, Brussels.
6 Conflict of interest
The author declares to have no conflicts of interest.
References
- Babcock (1961) Babcock, H.W.: 1961, Astrophys. J. 133, 572. DOI: 10.1086/14706
- Badalyan and Obridko (2017) Badalyan, O.G., Obridko, V.N.: 2017, Mon. Not. Roy. Astron. Soc. 466, 4535. DOI: 10.1093/mnras/stx134
- Balthasar, Vázquez, and Wöhl (1986) Balthasar, H., Vázquez, M., Wöhl, H.: 1986, Astron. Astrophys. 155, 87. ADS: http://adsabs.harvard.edu/abs/1986A%26A…155…87B
- Baranyi, Győri, Ludmány (2016) Baranyi, T., Győri, L., Ludmány, A.: 2016, Solar Phys. 291, 3081. DOI: 10.1007/s11207-016-0930-1
- Brajša, Ruždjak, and Wöhl (2006) Brajša, R., Ruždjak, D., Wöhl, H.: 2006, Solar Phys. 237, 365. DOI: 10.1007/s11207-006-0076-7
- Cameron, Dikpati, and Brandenburg (2017) Cameron, R.H., Dikpati, M., Brandenburg, A.: 2017 Space Sci. Rev. 210, 367. DOI: 10.1007/s11214-015-0230-3
- Chandra, Vats, and Iyer (2010) Chandra, S., Vats, H.O., Iyer, K.N.: 2010, Mon. Not. Roy. Astron. Soc. 407, 1108. DOI: 10.1111/j.1365-2966.2010.16947.x
- Choudhuri and Gilman (1987) Choudhuri, A.R., Gilman, P.A.: 1987, Astrophys. J., 316, 788. DOI: 10.1086/165243
- Dikpati and Gilman (2006) Dikpati, M., Gilman, P.A.: 2006, Astrophys. J. 649, 498. DOI: 10.1086/506314
- D’Sliva and Howard (1994) D’Silva, S., Howard, R.F.: 1994, Solar Phys. 151, 213. DOI: 10.1007/BF00679072
- Gao (2016) Gao, P.X.: 2016, Astrophys. J., 830, 140. DOI: 10.3847/0004-637X/830/2/140
- Garcia and Mouradin (1998) Garcia, A., Mouradian, Z.: 1998, Solar Phys. 180, 495. DOI: 10.1023/A:1005018712900
- Gilman and Howard (1984) Gilman, P.A., Howard, R.: 1984, Astrophys. J. 283, 385. DOI: 10.1086/162316
- Gupta, Sivaraman, and Howard (1999) Gupta, S.S., Sivaraman, K.R., Howard, R.: 1999, Solar Phys. 188, 225. DOI: 10.1023/A:1005229124554
- Győri, Baranyi, and Ludmány (2010) Győri, L., Baranyi, T., Ludmány, A.: 2010, in Proc. Intern. Astron. Union 6, Sympo. S273, 2011, 403. DOI: 10.1017/s174392131101564X
- Győri, Ludmány, and Baranyi (2017) Győri, L., Ludmány, A., Baranyi, T.: 2017, Mon. Not. Roy. Astron. Soc. 465, 1259. DOI: 10.1093/mnras/stw2667
- Hathaway (2015) Hathaway, D.H.: 2015, Living Rev. Solar Phys. 12, N0.4. DOI:10.1007/lrsp-2015-4
- Hathaway, Wilson, and Reichmann (1999) Hathaway, D.H., Wilson, R.M., Reichmann, E.J.: 1999, J. Geophys. Res. 104, 22375. DOI: 10.1029/1999JA900313
- Hiremath (2002) Hiremath, K.M.: 2002, Astron. Astrophys. 386, 674. DOI: 10.1051/0004-6361:20020276
- Howard (1976) Howard, R.: 1976, Astrophys. J. Lett. 93, L159. DOI: 10.1086/182328
- Howard, Gilman, and Gilman (1984) Howard, R., Gilman, P.I., Gilman, P.A.: 1984, Astrophys. J. 283, 373. DOI: 10.1086/162315
- Howard and LaBonte (1980) Howard, R., LaBonte, B. J.: 1980, Astrophys. J., 239, L33. DOI: 10.1086/183286
- Howe et al. (2000) Howe, R., Christensen-Dalsgaard, J., Hill, F., Komm, R.W., Larsen, R.M., Schou, J., Thompson, M.J., Toomre, J.: 2000, Astrophys. J. 533, L163. DOI: 10.1086/312623
- Javaraiah (2003) Javaraiah, J.: 2003, Solar Phys. 212, 23. DOI: 10.1023/A:1022912430585
- Javaraiah (2005) Javaraiah, J.: 2005, Mon. Not. Roy. Astron. Soc. 362, 1311. DOI: 10.1111/j.1365-2966.2005.09403.x
- Javaraiah (2011) Javaraiah, J.: 2011, Adv. Space Res. 48, 1032. DOI: 10.1016/j.asr.2011.05.004
- Javaraiah (2013) Javaraiah, J.: 2013, Solar Phys., 287, 197. DOI: 10.1007/s11207-013-0345-1
- Javaraiah (2017) Javaraiah, J.: 2017, Solar Phys. 292, 172. DOI: 10.1007/s11207-017-1197-x
- Javaraiah (2019) Javaraiah, J.: 2019, Solar Phys. 294, 64. DOI: 10.1007/s11207-019-442-6
- Javaraiah and Bertello (2016) Javaraiah, J., Bertello, L.: 2016, Solar Phys. 291, 3485. DOI: 10.1007/s11207-016-1003-1
- Javaraiah, Bertello, and Ulrich (2005a) Javaraiah, J., Bertello, L., Ulrich, R.K.: 2005a (Article-I), Solar Phys. 232, 25. DOI: 10.1007/s11207-005-8776-y
- Javaraiah, Bertello, and Ulrich (2005b) Javaraiah, J., Bertello, L., Ulrich, R.K: 2005b, Astrophys. J. 626, 579. DOI: 10.1086/429898.
- Javaraiah and Gokhale (1995) Javaraiah, J., Gokhale, M.H.: 1995, Solar Phys. 158, 173. DOI: 10.10.1007/BF00680841
- Javaraiah and Gokhale (1997b) Javaraiah, J., Gokhale, M.H.: 1997, Astron. Astrophys. 327, 795.
- Javaraiah and Komm (1999) Javaraiah, J., Komm, R.W.: 1999, Solar Phys. 184, 41. DOI: 10.1007/s11207-006-0130-5
- Javaraiah and Ulrich (2006) Javaraiah, J., Ulrich, R.K.: 2006, Solar Phys. 237, 245. DOI: 10.1007/s11207-006-0130-5
- Javaraiah et al. (2009) Javaraiah, J., Ulrich, R.K., Bertello, L., Boyden, J.E.: 2009, Solar Phys. 257, 61. DOI: 10.1007/s11207-009-9342-9
- Juckett (2003) Juckett, D.A.: 2003, Astron. Astrophys. 399, 731. DOI: 10.1051/0004-6361:20021923
- Kambry and Nishikawa (1990) Kambry, M.A., Nishikawa, J.: 1990, Solar Phys. 126, 89. DOI: 10.1007/BF00158300
- Khutsishvili, Gigolashvili, and Kvernadze (2002) Khutsishvili, E.V., Gigolashvili, M.SH., Kvernadze, T.M.: 2002, Solar Phys. 206, 219. DOI: 10.1023/A:1015068629350
- Komitov et al. (2016) Komitov, B., Sello, S., Duchlev, P., Dechev, M., Penev, K., Koleva, K.: 2016, Bulg. Astronomic. J. 25, 78.
- Komm, Howard, and Harvey (1993) Komm, R.W, Howard, R.F., Harvey, J.W.: 1993, Solar Phys., 143, 19. DOI: 10.1007/BF00619094
- LaBonte and Howard (1982) LaBonte, B.J., Howard, R.: 1982, Solar Phys. 75, 161. DOI: 10.1007/BF00153469
- Li et al. (2014) Li, K.J., Feng, W., Shi, X.J., Xie, J.L., Gao, P.X., Liang, H.F: 2014, Solar Phys. 289, 759. DOI: 10.1007/s11207-013-0369-6
- Makarov, Tlatov, and Callebaut (1997) Makarov, V.I., Tlatov, A.G., Callebaut, D.K.: 1997, Solar Phys. 170, 373. DOI: 10.1023/A.1004995826593
- Mendoza (1999) Mendoza, B.: 1999, Solar Phys. 188, 237. DOI: 10.1023/A:1005256728266
- Obridko and Shelting (2016) Obridko, V.N., Shelting, B.D.: 2016, Astron. Lett. 42, 631. DOI: 10.1134/S1063773716080041
- Ogurtsov et al. (2002) Ogurtsov, M.G., Nagovitsyn, Y.A., Kocharov, G.E., Jungner, H.: 2002, Solar Phys. 211, 371. DOI: 10.1023/A:1022411209257
- Olemskoy and Kitchatinov (2005) Olemskoy, S.V., Kitchatinov, L.L.: 2005, Astron. Lett. 31, 706. DOI: 10.1134/1.2075313
- Pesnell (2018) Pesnell, W.D.: 2018, Space Weather 16, 1997. DOI: 10.1029/2018SW002080
- Roudier et al. (2018) Roudier, Th., Švanda, M., Ballot, J., Malherbe, J.M., Rieutord, M.: 2018, Astron. Astrophys. 611, A92. DOI: 10.1051/0004-6361/201732014
- Rozelot (1994) Rozelot, J.P.: 1994, Solar Phys. 149, 149. DOI: 10.1007/BF00645186
- Ruždjak et al. (2017) Ruždjak, D., Brajša, R., Sudar, D., Skokić, I., Poljančić-Beljan, I.: 2017, Solar Phys. 292, 179. DOI 10.1007/s11207-017-1199-8
- Singh and Prabhu (1985) Singh, J., Prabhu, T.P.: 1985, Solar Phys. 97, 203. DOI: 10.1007/BF00152989
- Sivaraman et al. (2003) Sivaraman, K.R., Sivaraman, H., Gupta, S.S., Howard, R.: 2003, Solar Phys. 214, 65. DOI: 10.1023/A:1024075100667
- Snodgrass (1992) Snodgrass, H.B.: 1992, In: Harvey, K.L.(ed.) The Solar Cycle, CS-27, Astron. Soc. Pac., San Francisco, 205.
- Snodgrass and Howard (1985) Snodgrass, H.B., Howard, R.: 1985, Solar Phys. 95, 221. DOI: 10.1007/BF00152399
- Sudar et al. (2014) Sudar, D., Skokć, Ruždjak, D., Brajsa, R., Wöhl, H.: 2014, Mon. Not. Roy. Astron. Soc. 439, 1471. DOI: 10.1093/mnras/stu099
- Suzuki (2014) Suzuki, M.: 2014, Solar Phys. 289, 4021. DOI: 10.1007/s11207-014-0576-9
- Švanda et al. (2008) Švanda, M., Klvǎna, M., Sobotka, M., Bumba, V.: 2008, Astron. Astrophys. 477, 285. DOI: 10.1051/0004-6361:20077718
- Tan (2011) Tan, B.: 2011, Astrophys. Space Sci., 332, 65. DOI: 10.1007/s10509-010-0496-6
- Temmer et al. (2006) Temmer, M., Rybb́ak, J., Bendík, Veronig, A., Vogler, F., Otruba, W., Pötzi, W., Hanslmeier, A.: 2006, Astron. Astrophys. 447, 735. DOI: 10.1051/0004-6361:20054060
- Ward (1965) Ward, F.: 1965, Astrophys. J. 141, 534. DOI: 10.1086/148143
- Ward (1966) Ward, F.: 1966, it Astrophys. J. 145, 416. DOI: 10.1086/148783
- Wood and Wood (1965) Wood, R.M., Wood, K.D.: 1965, Nature 208, 129. DOI: 10.1038/208129a0
- Yoshimura and Kambry (1993) Yoshimura, H., Kambry, M.A.: 1993, Solar Phys., 143, 205. DOI: 10.1007/BF00646482