Ultrasound Diagnosis of COVID-19: Robustness and Explainability
Abstract
Diagnosis of COVID-19 at point of care is vital to the containment of the global pandemic. Point of care ultrasound (POCUS) provides rapid imagery of lungs to detect COVID-19 in patients in a repeatable and cost effective way. Previous work has used public datasets of POCUS videos to train an AI model for diagnosis that obtains high sensitivity. Due to the high stakes application we propose the use of robust and explainable techniques. We demonstrate experimentally that robust models have more stable predictions and offer improved interpretability. A framework of contrastive explanations based on adversarial perturbations is used to explain model predictions that aligns with human visual perception.
Index Terms— Machine Learning, Ultrasound, Visualization
1 Introduction
The Coronavirus disease 2019 (COVID-19) pandemic is the pre-eminent global health crisis of our time. Reverse Transcribed Real-Time PCR (RT-PCR) - a molecular test - is one of the most common and effective detection techniques, though there are concerns about processing time and sensitivity of these tests (Chen et al., 2020; Kanne et al., 2020). Incorporating medical imaging can be a powerful tool in the diagnostic process. In this paper we consider point of Care Ultrasound (POCUS) which has been shown to be a cost effective and sensitive diagnostic tool (Buonsenso et al., 2020). Born et al. Born et al. (2020a) provide an open source database of POCUS imagery and use deep convolutional neural networks (CNN) for automated diagnosis of COVID-19 and bacterial pneumonia 111The dataset and models available at https://github.com/jannisborn/covid19_pocus_ultrasound.. While it has been shown that high diagnostic accuracy is achievable using deep CNNs for frame- and video-based detectors (Born et al., 2020b), the issue of model robustness in this context has not received attention.
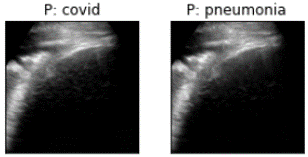
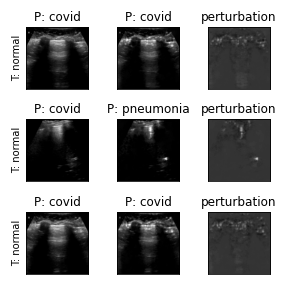
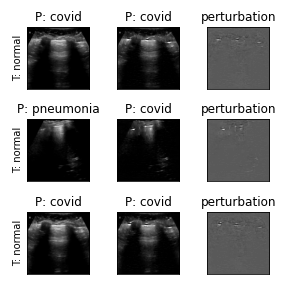
It has been well established that large capacity deep learning models can be fooled by small, carefully chosen, input perturbations known as adversarial attacks (Goodfellow et al., 2015). In the context of computer vision such attacks can be imperceptible to the human eye but still manage to fool the model. Though we do not imagine that medical diagnosis systems will be subjected to such attacks from malicious actors, their existence implies that the model may be learning features which are not medically relevant. This degrades trust from medical practitioners and brings into question the validity of any proposed explanation of the model’s predictions. Figure 1 (a) and (b) shows examples of such perturbations.
The adoption of AI-enabled techniques for augmenting diagnostic decision processes used by clinicians depends on the important issue of trust. Both robustness to imperceptible changes and explainability for justifying model predictions are critical factors in establishing trust. Our preliminary work presented here paves the way for providing insight into how robust deep CNNs make diagnostic decisions using ultrasound imaging modality by visualizing feature changes that lead to different decision boundaries, in addition to providing robustness.
2 Methods
The prevalent way of training neural networks is through the empirical risk minimization (ERM) principle defined as
| (1) |
This yields high accuracy on test sets but leaves the network vulnerable to adversarial attacks. An effective defense against such attacks is adversarial training (AT) Madry et al. (2018) which instead aims to minimize the adversarial risk
| (2) |
The training procedure constructs adversarial attacks, , at given inputs, , that aim to maximize the loss, . The attacks are constrained to be within some , in the sense, of the original image, ensuring that the perturbed image resembles the original. Common choices of constraint are and . Though perturbations can be more noticeable than perturbations, they are generally smoother and so for the purposes of visual explanations we restrict our robustness discussion to the case.
A common method to approximate the maximization is projected gradient descent (PGD) which performs iterative updates of the approximation based on the gradient of the loss. Because of the high number of forward-backward propagations AT can become computationally expensive for large and/or high resolution datasets. There are several regularization methods aimed at obtaining robustness with less computation (Lyu et al., 2015; Moosavi-Dezfooli et al., 2019; Tsiligkaridis and Roberts, 2020). However, since the POCUS dataset is small we use AT to train our robust models.
2.1 Explanations
As noted in (Ilyas et al., 2019), adversarial attacks are not strictly a detriment and can be used to discern concepts that a model has learned. For robust models in particular these features have shown to be better aligned with human perception than their non-robust counterparts. To this end, we consider a framework similar to (Tsiligkaridis and Roberts, 2020). The approach finds pertinent negatives/positives by optimizing over the perturbation variable . Pertinent negatives capture what is missing in the prediction and pertinent positives refer to critical features that are present in the input examples.
We consider two contrastive explanations defined by the optimizations
| (3) |
and
| (4) |
where the losses are locally optimized within an ball of radius to ensure that the perturbation is small.
In the case of correct predictions, are features that can be added in the original image which flip the model’s decision to a nearby class and therefore are pertinent negative features of the image. Whereas are features which contribute to the correct prediction, making them the pertinent positive features. In the case of incorrect predictions the roles are flipped. The are features which can be added or emphasized to make the model more confident in its incorrect prediction; the are the features that are missing for the model to make a correct prediction.
This framework can be used to investigate features a model has learned and to identify trends in failure cases.
3 Results
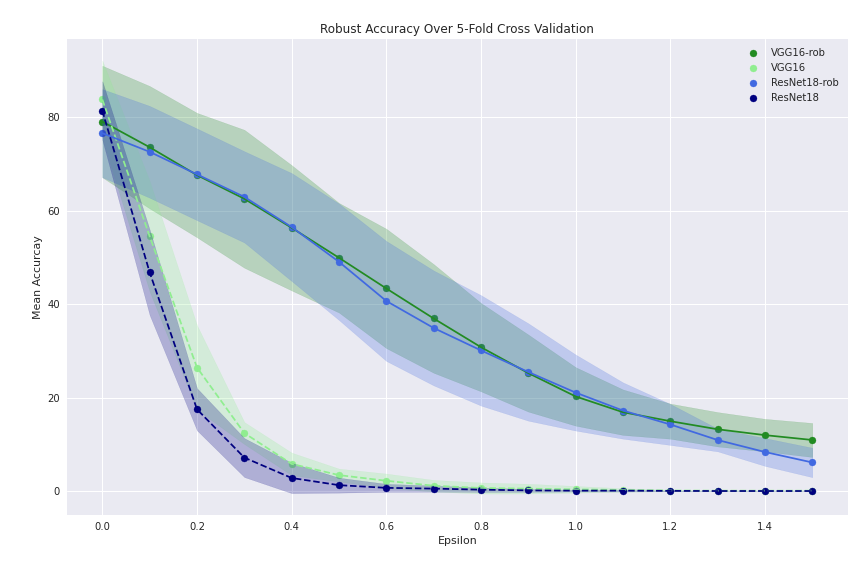
We used lung point-of-care ultrasound (POCUS) imagery gathered by (Born et al., 2020a) to train our network. This is the first publicly available dataset of lung POCUS recordings of COVID-19, bacterial pneumonia, and healthy patients. The dataset consists of 3119 frames from 195 ultrasound videos. A 5-fold cross validation over the videos was performed. We evaluated two deep CNNs on the POCUS dataset VGG16 (Simonyan and Zisserman, 2015) and ResNet18 (He et al., 2015). Models were trained for 51 epochs using an SGD optimizer that had an initial learning rate of which decayed by a factor of 10 every 15 epochs. In this paper, we report results for the best models over the 51 epochs. For standard models (trained with ERM) the best model is defined as the model with highest clean accuracy. For robust models (trained with AT) it is the model with the highest adversarial accuracy.
Performance. Table 1 shows the performance for each outcome task. All models performed well in pneumonia detection and in all tasks VGG16 outperforms its ResNet18 counterpart. For the remaining outcomes the robust models have less sensitivity than their standard counterparts.
Figure 2 shows the overall performance of robust models versus standard models across the 5-fold cross validation for increasingly strong adversarial attacks. We see the standard models perform well in the clean setting (epsilon = 0), achieving mean accuracy above 80% and outperforming their robust counterparts. However, the performance of standard models degrades dramatically as the attack strength increases compared to the robust models, which maintain better performance. This suggests that the standard models have learned brittle features sensitive to idiosyncrasies and/or noise in the training dataset. The robust models lacked such sensitivity, suggesting they learned more medically relevant features. Further, as the attack strength increases the robust models eventually lose performance - which is expected since a model that is robust to very large perturbations may be insensitive to small but medically relevant features in the input.
| Model | Outcome | Acc. | AUROC |
|---|---|---|---|
| ResNet18-rob | covid | 78.076 | 81.326 |
| pneumonia | 93.994 | 95.066 | |
| regular | 81.146 | 81.372 | |
| ResNet18 | covid | 82.616 | 85.746 |
| pneumonia | 93.856 | 95.992 | |
| regular | 86.422 | 87.992 | |
| VGG16-rob | covid | 81.498 | 87.054 |
| pneumonia | 93.568 | 96.952 | |
| regular | 83.122 | 85.114 | |
| VGG16 | covid | 85.992 | 89.646 |
| pneumonia | 95.144 | 97.618 | |
| regular | 86.508 | 88.928 |
Explanations.
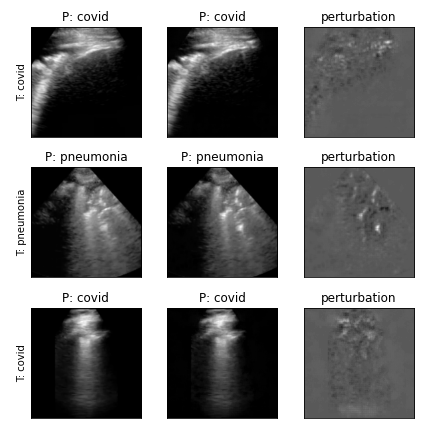
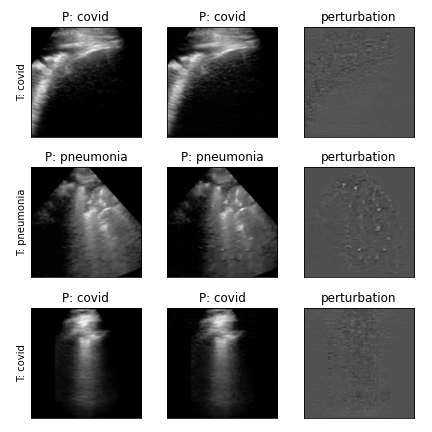


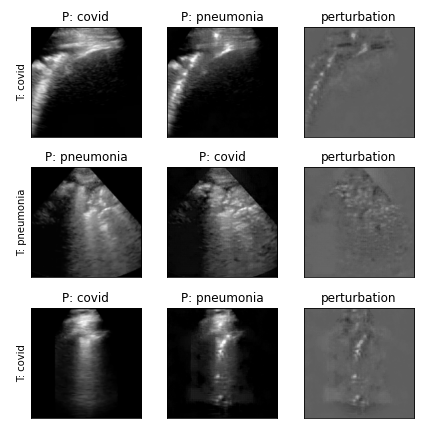

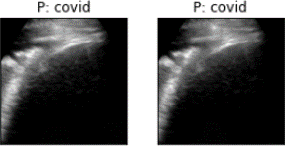
Figures 3 and 4 show and perturbations for robust and standard models. In general, the perturbations of robust models are more focused and targeted than the perturbations for standard models which were diffuse, making their learned features less interpretable. A notable exception is row-2 of Figure 3 where both models seem to focus on the pocket-like features present in many bacterial pneumonia POCUS imagery.
Figure 3 shows the effects of a attack on robust and standard networks for correct predictions and errors. For the pertinent positives of the correct predictions (Figure 3 (a) and (b)) both models emphasize the pockets seen in the pneumonia image but for the other two images the standard model seems to only be focusing on the brighter parts of the image. In comparison, the robust model has picked up on distinct features of the original image.
The pertinent negatives (Figure 3 (c) and (d)) of the robust model appear to de-emphasize certain features of the input. This is particularly interesting since these were images of healthy lungs which the models mistook for pathology. These perturbations allow us to not only identify difficult cases for the models to classify, but to effectively localize the features that fooled the model. Such an insight can be used to identify gaps in training data or flag common failure cases.
Figure 4 shows the effects of a attacks. For the correct predictions (Figure 4 (a) and (c)) these are the pertinent negative features that would cause the network to misclassify. The perturbations for robust models suggest they have learned more relevant features than the standard model. For example, in rows 1 and 3 we see that the pocket-like features are missing from the COVID-19 images that would cause the model to classify them as pneumonia. Whereas in row 2, the perturbation has removed some pockets and fused others together. In contrast, the perturbations for the standard model are less interpretable. Figure 4 (b) and (d) show the pertinent positive features that led the model to misclassify. It is clear that the robust model focuses on the upper region for its predictions while the standard model used more diffuse features.
4 Conclusion and Future Work
In this work we advocate for using robust AI in the safety-critical domain of automated diagnosis. We show that while standard models may outperform robust ones in terms of raw metrics, it comes at the cost of reliability and explainability. Further, we provide a means of using adversarial attacks to discern the features learned by robust models. Future work will include collaborating with hospitals to leverage more ultrasound data - improving accuracy, quality of robust features, and allowing us to focus on discriminating between multiple manifestations of COVID-19 (e.g. B-lines, pleural abnormalities, consolidations). Additionally, we plan to guide our explanation framework based on expert radiologist feedback.
5 Acknowledgements
This material is based upon work supported by the Under Secretary of Defense for Research and Engineering under Air Force Contract No. FA8702-15-D-0001. Any opinions, findings, conclusions or recommendations expressed in this material are those of the author(s) and do not necessarily reflect the views of the Under Secretary of Defense for Research and Engineering.
6 Compliance with Ethical Standards
This research study was conducted retrospectively using human subject data aggregated, processed, and made available in open access by Born et. al. Born et al. (2020a) . Up to date references of data sources and access can be found at : https://github.com/jannisborn/covid19_pocus_ultrasound. Ethical approval was not required as confirmed by the license attached with the open access data.
References
- Born et al. [2020a] Jannis Born, Gabriel Brändle, Manuel Cossio, Marion Disdier, Julie Goulet, Jérémie Roulin, and Nina Wiedemann. Pocovid-net: Automatic detection of covid-19 from a new lung ultrasound imaging dataset (pocus), 2020a.
- Born et al. [2020b] Jannis Born, Nina Wiedemann, Gabriel Brändle, Charlotte Buhre, Bastian Rieck, and Karsten Borgwardt. Accelerating covid-19 differential diagnosis with explainable ultrasound image analysis, 2020b.
- Buonsenso et al. [2020] Danilo Buonsenso, Davide Pata, and Antonio Chiaretti. Covid-19 outbreak: less stethoscope, more ultrasound. The Lancet Respiratory Medicine, 8(5):e27, 2020.
- Chen et al. [2020] Dabiao Chen, Wenxiong Xu, Ziying Lei, Zhanlian Huang, Jing Liu, Zhiliang Gao, and Liang Peng. Recurrence of positive sars-cov-2 rna in covid-19: A case report. International Journal of Infectious Diseases, 2020.
- Goodfellow et al. [2015] Ian J. Goodfellow, Jonathon Shlens, and Christian Szegedy. Explaining and harnessing adversarial examples. In International Conference on Learning Representations, 2015.
- He et al. [2015] Kaiming He, Xiangyu Zhang, Shaoqing Ren, and Jian Sun. Deep residual learning for image recognition, 2015.
- Ilyas et al. [2019] Andrew Ilyas, Shibani Santurkar, Dimitris Tsipras, Logan Engstrom, Brandon Tran, and Aleksander Madry. Adversarial examples are not bugs, they are features, 2019.
- Kanne et al. [2020] Jeffrey P. Kanne, Brent P. Little, Jonathan H. Chung, Brett M. Elicker, and Loren H. Ketai. Essentials for radiologists on covid-19: An update—radiology scientific expert panel. Radiology, 296(2):E113–E114, 2020. doi: 10.1148/radiol.2020200527. URL https://doi.org/10.1148/radiol.2020200527. PMID: 32105562.
- Lyu et al. [2015] Chunchuan Lyu, Kaizhu Huang, and Ha-Ning Liang. A unified gradient regularization family for adversarial examples. In IEEE International Conference on Data Mining (ICDM), 2015.
- Madry et al. [2018] Aleksander Madry, Aleksandar Makelov, Ludwig Schmidt, Dimitris Tsipras, and Adrian Vladu. Towards deep learning models resistant to adversarial attacks. In International Conference on Learning Representations, 2018.
- Moosavi-Dezfooli et al. [2019] Seyed-Mohsen Moosavi-Dezfooli, Jonathan Uesato, Alhussein Fawzi, and Pascal Frossard. Robustness via curvature regularization, and vice versa. In IEEE Conference on Computer Vision and Pattern Recognition, 2019.
- Simonyan and Zisserman [2015] Karen Simonyan and Andrew Zisserman. Very deep convolutional networks for large-scale image recognition, 2015.
- Tsiligkaridis and Roberts [2020] Theodoros Tsiligkaridis and Jay Roberts. Second order optimization for adversarial robustness and interpretability, 2020.