11email: k1.ohnaka@gmail.com 22institutetext: Max-Planck-Institut für Radioastronomie, Auf dem Hügel 69, 53121 Bonn, Germany
Infrared interferometric imaging of the compact dust disk around the AGB star HR3126 with the bipolar Toby Jug Nebula ††thanks: Based on AMBER, GRAVITY, NACO, SPHERE, and VISIR observations made with the Very Large Telescope and Very Large Telescope Interferometer of the European Southern Observatory. Program IDs: 096.D-0482, 098.D-0525, 099.D-0493, and 0102.D-0550. , ††thanks: Based on observations with AKARI, a JAXA project with the participation of ESA. , ††thanks: Herschel is an ESA space observatory with science instruments provided by European-led Principal Investigator consortia and with important participation from NASA.
Abstract
Aims. The asymptotic giant branch (AGB) star HR3126, associated with the arcminute-scale bipolar Toby Jug Nebula, provides a rare opportunity to study the emergence of bipolar structures at the end of the AGB phase. Our goal is to image the central region of HR3126 with high spatial resolution.
Methods. We carried out long-baseline interferometric observations with AMBER and GRAVITY (2–2.45 m) at the Very Large Telescope Interferometer (VLTI) with spectral resolutions of 1500 and 4500, speckle interferometric observations with VLT/NACO (2.24 m), and imaging with SPHERE-ZIMPOL (0.55 m) and VISIR (7.9–19.5 m).
Results. The images reconstructed in the continuum at 2.1–2.29 m from the AMBER+GRAVITY data reveal the central star surrounded by an elliptical ring-like structure with a semimajor and semiminor axis of 5.3 and 3.5 mas, respectively. The ring is interpreted as the inner rim of an equatorial dust disk viewed from an inclination angle of 50°, and its axis is approximately aligned with the arcminute-scale bipolar nebula. The disk is surprisingly compact, with an inner radius of a mere 3.5 (2 au). Our 2-D radiative transfer modeling shows that an optically thick flared disk with silicate grains as large as 4 m can simultaneously reproduce the observed continuum images and the spectral energy distribution. The images reconstructed in the CO first overtone bands reveal elongated extended emission around the central star, suggesting the oblateness of the star’s atmosphere or the presence of a CO gas disk inside the dust cavity. The object is unresolved with SPHERE-ZIMPOL, NACO, and VISIR.
Conclusions. If the disk formed together with the bipolar nebula, the grain growth from sub-micron to a few microns should have taken place over the nebula’s dynamical age of 3900 yrs. The non-detection of a companion in the reconstructed images implies that either its 2.2 m brightness is more than 30 times lower than that of the red giant or it might have been shredded due to binary interaction.
Key Words.:
infrared: stars – techniques: interferometric – stars: imaging – stars: mass-loss – stars: AGB and post-AGB – (Stars:) circumstellar matter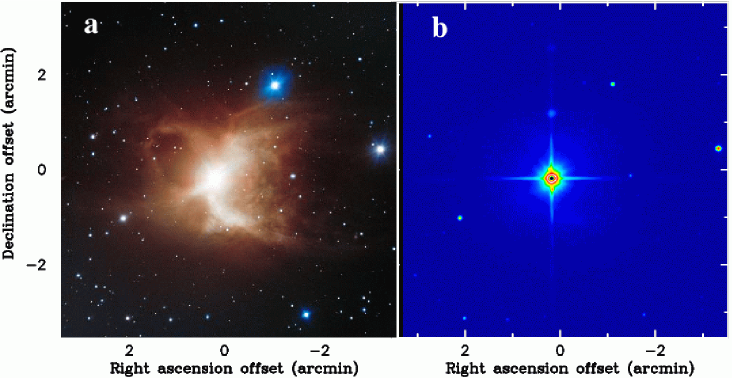
1 Introduction
Intermediate- and low-mass stars often develop bipolar or more complex structures when they evolve from the asymptotic giant branch (AGB) to protoplanetary nebulae (PPNe) and then to planetary nebulae (PNe). While the physical process responsible for this morphological change is not yet well understood, binary interaction is considered to play an important role (e.g., De Marco demarco09 (2009)). Of particular importance is the so-called common-envelope evolution, in which the envelope of one of the stars expands and engulfs its companion. A number of dynamical physical processes that take place during the common-envelope evolution have a significant influence on the fate of the binary system. Despite such importance, it is very challenging to numerically simulate the common-envelope evolution (Ivanova et al. ivanova13 (2013)), and it remains unclear how it gives rise to the emergence of the bipolar, or more complex structures in PPNe and PNe.
Observing objects in transition to PPNe and PNe is a direct approach to improve our understanding of the physical process behind the drastic morphological change. However, it is difficult to find such objects owing to the brevity of the transitional phase. A few rare objects show signatures of bipolar structures already in the AGB phase, for example, WX Psc (Hofmann et al. hofmann01 (2001); Vinkovic et al. vinkovic04 (2004)), IRC+10216 (Men’shchikov et al. menshchikov01 (2001)), V Hya (Sahai et al. sahai09 (2009)), Gru (Doan et al. doan17 (2017)), EP Aqr (Homan et al. homan18 (2018); Hoai et al. hoai19 (2019)), R Aqr (Schmid et al. schmid17 (2017); Melnikov et al. melnikov18 (2018)), L2 Pup (Kervella et al. kervella14 (2014); Ohnaka et al. ohnaka15 (2015)), Frosty Leo (Sahai et al. sahai00 (2000); Lopez et al. lopez01 (2001); Murakawa et al. murakawa08 (2008)), and OH231.8+4.2 (Kastner et al. kastner98 (1998); Bujarrabal et al. bujarrabal02 (2002); Sánchez Contreras et al. sanchez_contreras18 (2018)).
The target of the present paper, HR3126 (V341 Car, HD65750), also exhibits a bipolar structure, as can be seen in the optical image shown in Fig. 1a taken in the ESO Cosmic Gems Programme111https://www.eso.org/public/images/eso1343a. Of particular note is that the central red giant star is associated with a prominent, arcminute-scale bipolar optical reflection nebula (Dachs & Isserstedt dachs73 (1973)). The nebula is cataloged as IC2220 and also called the Toby Jug Nebula. As Fig. 1a shows, the angular diameter of the nebula is as large as 4′, which corresponds to 0.4 pc at a distance of 381 pc (GAIA DR2, gaia18 (2018), see also Sect. 2 for discussion about the distance to HR3126). The central star is an M1-3II/III star (Dachs & Isserstedt dachs73 (1973); Humphreys & Ney humphreys74 (1974); Chiar et al. chiar93 (1993)), an irregular variable with a variability amplitude of (Dachs et al. dachs78 (1978)). In addition, recent deep imaging with an H filter has revealed two sets of very faint bubble-like nebulosities with diameters of 10′ and 15′ (Drudis drudis18 (2018)), both of which are larger than that of the bipolar reflection nebula. These outer nebulosities are suggestive of episodic mass-loss events preceding the formation of the bipolar nebula. In contrast to the prominent appearance in the visible, the nebula is very faint in the near-infrared. As the Two Micron All-Sky Survey (2MASS) image shows (Fig. 1b), the nebula can barely be recognized at 2.2 m, where the interferometric imaging presented in this paper was carried out. The combination of the large-scale bipolar nebula and the central star still in the AGB phase (see Sect. 2) provides an interesting case for studying the formation of PPNe.
In this paper we present milliarcsecond-resolution near-infrared interferometric imaging of the central region of HR3126 using the AMBER (Astronomical Multi-BEam combineR) and GRAVITY instruments at ESO’s Very Large Telescope Interferometer (VLTI). We also present speckle interferometric observations taken with VLT/NACO (Nasmyth Adaptive optics system–COudé near-infrared camera), polarimetric imaging data taken with VLT/SPHERE-ZIMPOL (Spectro-Polarimetric High-contrast Exoplanet REsearch instrument–Zurich IMaging POLarimeter), and mid-infrared imaging data taken with VLT/VISIR (VLT Imager and Spectrometer for the mid-InfraRed). We overview the basic properties of HR3126 collected from the literature in Sect. 2. Then we describe the observations and data reduction in Sect. 3. The results of the interferometric imaging with AMBER and GRAVITY are presented in Sect. 4, together with the results obtained from SPHERE-ZIMPOL, NACO, and VISIR. In Sect. 5, we present the 2-D radiative transfer modeling of the observed data, followed by a discussion in Sect. 6 before closing with the concluding remarks in Sect. 7.
2 Basic properties of HR3126
In this section we discuss the basic properties of HR3126 and its nebula derived from previous observations in the literature. Castilho et al. (castilho00 (2000)) derived an effective temperature () of 3600 K and a surface gravity of = 0.6 from the analysis of visible spectral lines. The relationship between the spectral type and effective temperature presented by van Belle et al. (vanbelle99 (1999)) shows that HR3126’s spectral type of M1–3 corresponds to 3700 K to 3800 K. We adopted an intermediate value of K between the results of Castilho et al. (castilho00 (2000)) and van Belle et al. (vanbelle99 (1999)). The spectral analysis of Castilho et al. (castilho00 (2000)) also shows that HR3126 is moderately metal-poor with [Fe/H] = and enriched in the -process elements Zr and Ba with [Zr/Fe] = 0.9 and [Ba/Fe] = 0.4. These enhancements are similar to those observed in MS-type AGB stars (Smith & Lambert smith85 (1985)), suggesting that HR3126 is probably in the AGB phase. The distance based on the GAIA parallax of mas (GAIA DR2, GAIA Collaboration gaia18 (2018)) is pc. The distance modulus of 8.0 (distance of 398 pc) derived by Reimers (reimers77 (1977)) using the Wilson-Bappu effect of the Ca II K line is in agreement with the GAIA result. We adopted the GAIA distance of 381 pc throughout this paper.
While the arcminute-scale reflection nebula appears to be very faint
in the near-infrared, HR3126 exhibits a high infrared excess longward of
2 m. It is unusual for an early M giant with a small variability
amplitude.
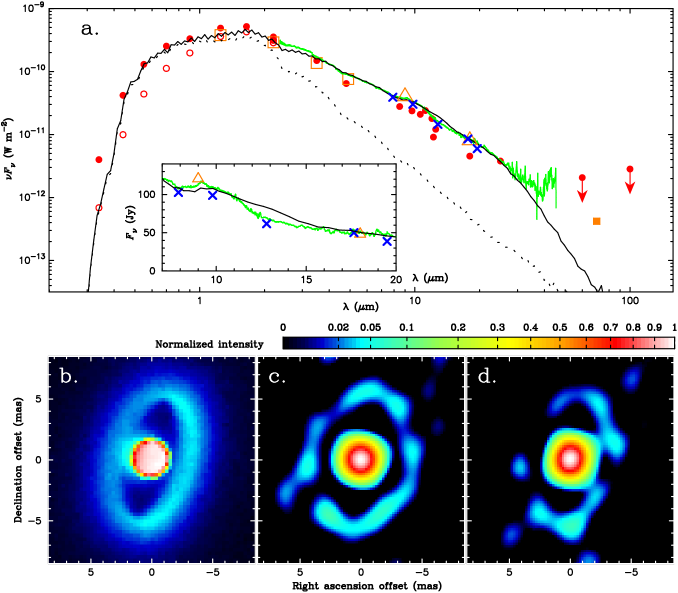
Figure 7a shows the observed spectral energy distribution
(SED) of HR3126 based on (spectro-)photometric data available in the
literature:
photometric data compiled by Chiar et al. (chiar93 (1993), see also references
therein), measurements with the Diffuse InfraRed Background Experiment
(DIRBE) instrument on board the COsmic Background Explorer (COBE)
(Price et al. price10 (2010)),
spectrum taken with the Short Wavelength Spectrometer (SWS) on board the
Infrared Space Observatory (ISO)
(Sloan et al. sloan03 (2003))222Downloaded from
https://users.physics.unc.edu/~gcsloan/library/
swsatlas/atlas.html,
and the - and -band fluxes derived in the present work
(Sect. 4.2).
We also included the 9 m and 18 m fluxes
measured with AKARI (Ishihara et al. ishihara10 (2010)) and
the 70 m flux measured with the Photodetector Array Camera and
Spectrometer (PACS) instrument
(Poglitsch et al. poglitsch10 (2010)) on board the Herschel Space Observatory
(Pilbratt et al. pilbratt10 (2010)),
taken from the Herschel PACS Point Source Catalog
(European Space Agency esa17 (2017)).
The interstellar extinction is estimated to be or
with based on
the 3-D interstellar extinction map published by Lallement et
al. (lallement19 (2019))333https://astro.acri-st.fr/gaia_dev.
However, Dachs & Isserstedt (dachs73 (1973)) note that
the color excess observed toward the central star is
much larger, and therefore, a large fraction of the extinction is
caused within the nebula.
To obtain the SED from the central region of the object,
we de-reddened the (spectro-)photometric
data with (or with ),
using the wavelength dependence of the interstellar extinction derived
by Cardelli et al. (cardelli89 (1989)).
The radiation of the central star is represented by the photospheric model with the parameters closest to those of HR3126 ( = 3750 K, = 0.5, and [Fe/H] = ) taken from the model grid of Castelli & Kurucz (castelli03 (2003))444http://www.oact.inaf.it/castelli/castelli/grids.html. By fitting the photospheric model to the visible and near-infrared wavelength regions of the de-reddened observed SED, we obtained an angular diameter of mas of the central star. This corresponds to a linear radius of (= au) at the distance of 381 pc. The luminosity is derived to be using the linear radius and the effective temperature of K. By combining the linear radius of with the surface gravity of = 0.6, the current mass is estimated to be . The basic parameters of HR3126 are summarized in Table. LABEL:basic_table.
The origin of the bipolar reflection nebula is still controversial. Pesce et al. (pesce88 (1988)) note that the absence of UV emission at 1150–2000 Å in the International Ultraviolet Explorer (IUE) data indicates that the central star is not in an interacting binary such as a symbiotic star. They also report that the Mg II emission at 2800 Å and the UV continuum longward of 2700 Å originate from the chromosphere typical of an early M giant. Based on the analysis of the circumstellar absorption lines in the violet spectrum, Reimers (reimers77 (1977)) derived a current mass-loss rate of yr-1 from the central M giant star with an outflow velocity of 13 km s-1. However, the radio CO line observations by Nyman et al. (nyman93 (1993)) show a faster, approximately bipolar outflow at 35 km s-1 on a spatial scale of the reflection nebula. The dynamical age of the bipolar outflow in the nebula is then estimated to be 3900 yrs based on the linear radius of the nebula (0.2 pc) and the deprojected outflow velocity of 54 km s-1 (see Sect. 4.1).
The nebular mass estimated from dust extinction or scattering in the literature appears to be uncertain. Reimers (reimers77 (1977)) estimated the total nebular mass to be on the order of 1 from the extinction in the nebula. Perkins et al. (perkins81 (1981)) derived much smaller values of a few from their polarization observations of the nebula. On the other hand, a detailed modeling of the aforementioned radio CO data suggests a total nebular mass of 1 (L.-Å. Nyman, priv. comm.). This nebular mass and the dynamical age of 3900 yrs mean a mass-loss rate of yr-1, which is 600–1000 times higher than the current mass-loss rate from the central M giant. Perhaps the nebular material was ejected in a bipolar manner in a high mass-loss event related to the common-envelope evolution, although there is no definitive evidence of a binary companion for HR3126 in the literature. If binary interaction was responsible for the formation of the nebula, it is possible that the duration of the high mass-loss event was much shorter than the dynamical age of 3900 yrs. In this case, the mass-loss rate would be even higher than the yr-1.
The nebular mass of 1 and the current stellar mass of 2 suggest an initial stellar mass of 3 , if we assume that the nebular mass was entirely ejected by the AGB star. This is a lower limit because the amount of mass lost before the formation of the nebula, as revealed by the faint H nebulosities, is not clear. However, as mentioned above, if binary interaction and significant mass transfer were involved in the evolution of HR3126, the material in the nebula may originate not only from the AGB star but also from its companion. In this case, it is impossible to estimate the initial mass of two stars. Comparison of the observationally derived position of HR3126 on the Hertzsprung-Russell diagram with the theoretical evolutionary tracks of Lagarde et al. (lagarde12 (2012)) also suggests an initial mass of 3 . However, given that it is questionable whether we can assume single star evolution for HR3126 or not, this agreement of the initial mass may be merely fortuitous.
3 Observations and data reduction
3.1 Near-infrared interferometric observations with AMBER and GRAVITY
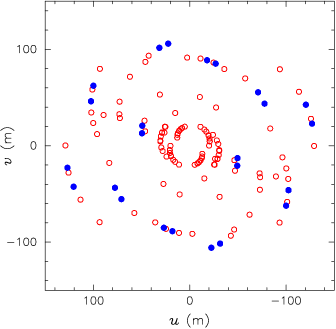
We observed HR3126 with the near-infrared spectro-interferometric instruments AMBER (Petrov et al. petrov07 (2007)) and GRAVITY (GRAVITY Collaboration gravity17 (2017)), as summarized in Table LABEL:obs_vlti_log. Our AMBER observations were carried out in the wavelength region between 2.1 and 2.45 m with a spectral resolution of 1500, using five different Auxiliary Telescope (AT) triplets (Program ID: 098.D-0525, P.I.: K. Ohnaka). As the coverage plotted in Fig. 2 shows, the projected baseline lengths range from 16 m to 129 m. Spectrally dispersed interferograms were recorded with a detector integration time (DIT) of 200 ms, using the VLTI fringe tracker FINITO (Le Bouquin et al. lebouquin08 (2008)). We observed Pyx (G5II/III, uniform-disk diameter = mas, Bourges et al. bourges17 (2017)) for interferometric and spectroscopic calibration. Each AMBER measurement was carried out in a calibrator–science–calibrator sequence.
The AMBER data were reduced with amdlib ver 3.0.8666http://www.jmmc.fr/data_processing_amber.htm (Tatulli et al. tatulli07 (2007); Chelli et al. chelli09 (2009)). The interferometric observables (squared visibility amplitude, differential phase, and closure phase) were extracted by discarding 20% of the frames with the lowest fringe S/N. The use of the fringe tracker FINITO can introduce systematic errors in the absolute visibility calibration, if the fringe tracking performance is significantly different for the science target and the calibrator. To minimize this effect, we computed the standard deviation of the phase measured with FINITO from the VLTI Reflective Memory Network Recorder (RMNrec) data (Le Bouquin et al. lebouquin09 (2009); Mérand et al. merand12 (2012)). We calibrated the data of HR3126 with those of Pyx only when the difference in the FINITO phase standard deviation is within a factor of 1.2. The wavelength calibration was done using the telluric lines identified in the observed spectrum of the calibrator Pyx. The uncertainty in the wavelength calibration is m.
Our GRAVITY observations (Program ID: 0102.D-0550, P.I.: K. Ohnaka) were carried out in the band (1.99–2.45 m) with a spectral resolution of 4500 in the combined polarization mode. HR3126 was observed in the single-field mode, using the most extended A0-G1-J2-J3 AT quadruplet, which provided projected baseline lengths from 51 m to 129 m. GRAVITY is always operated with its own fringe tracker. We observed Car (A7Ib, uniform-disk diameter = mas, Bourges et al. bourges17 (2017)) as the calibrator. Two data sets were taken on 2018 December 19 (UTC) in a calibrator–science–calibrator–science–calibrator sequence. The obtained data were reduced with the GRAVITY pipeline ver. 1.1.2777https://www.eso.org/sci/software/pipelines/gravity/. Each data set of HR3126 was calibrated with three data sets of the calibrator. The wavelength calibration was done using the telluric lines identified in the observed spectrum of the calibrator as in the case of the AMBER data.
The wavelength ranges covered with AMBER and GRAVITY include the CO first overtone bands. To reconstruct images in the CO bands by combining the AMBER and GRAVITY data, it is necessary to have interferometric data obtained with approximately the same spectral resolution. Because the difference in the spectral resolution between the AMBER and GRAVITY data is a factor of three, we spectrally binned the raw GRAVITY data (both the science target and the calibrator) with a running box car filter to match the spectral resolution of the AMBER data. The spectrally binned data were reduced with the GRAVITY pipeline and calibrated in the same manner as the original data.
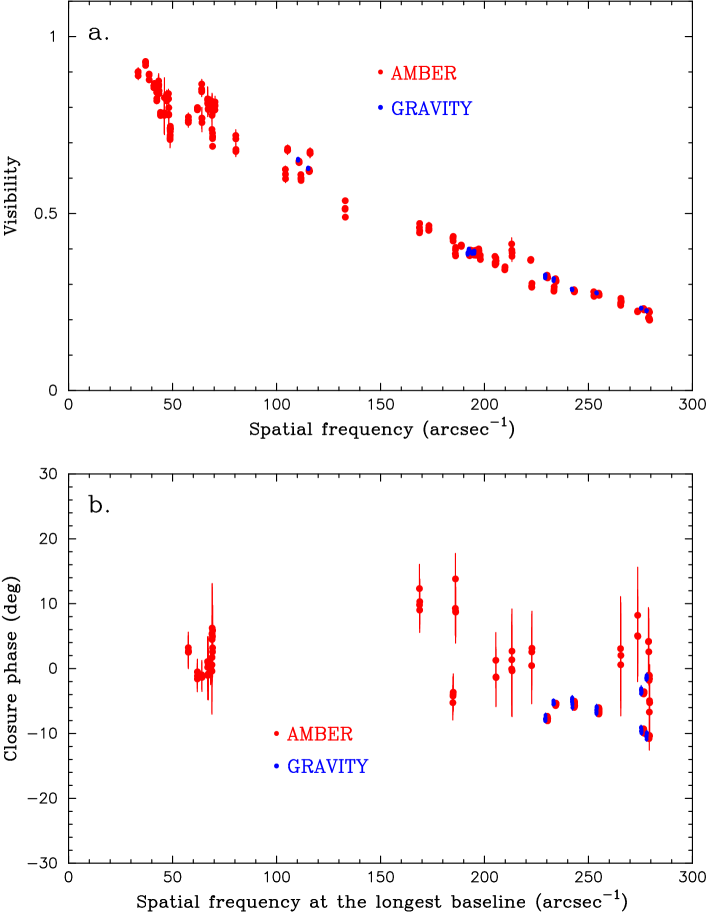
Several AMBER data points were taken at approximately the same points but several months apart. Similarly, there are a few data points taken with AMBER and GRAVITY at nearly the same points taken 1.8 years apart (see Fig. 9). These data show no significant time variations. The consistency between the AMBER and GRAVITY data shows that the calibration of both data is reliable. These results justify the reconstruction of images combining all AMBER and GRAVITY data.
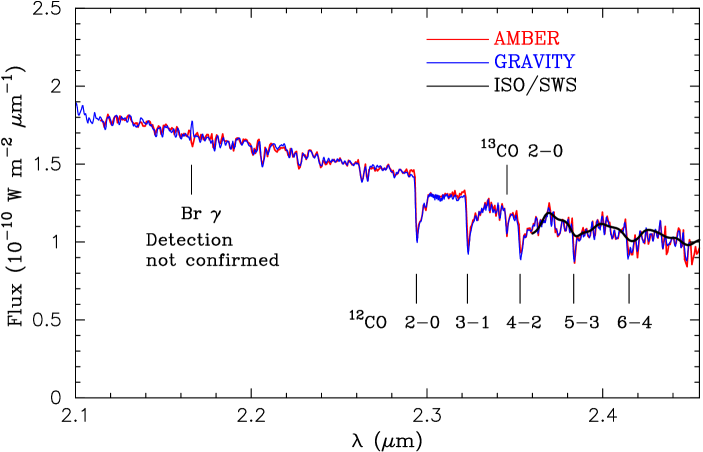
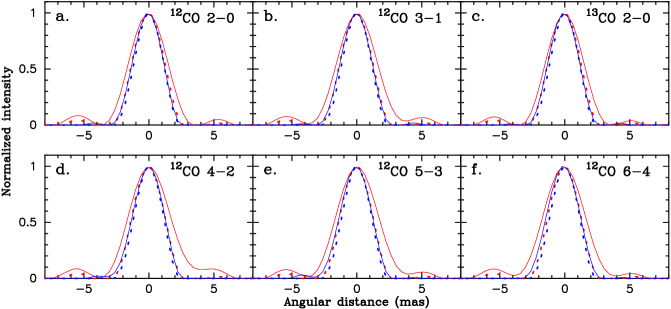
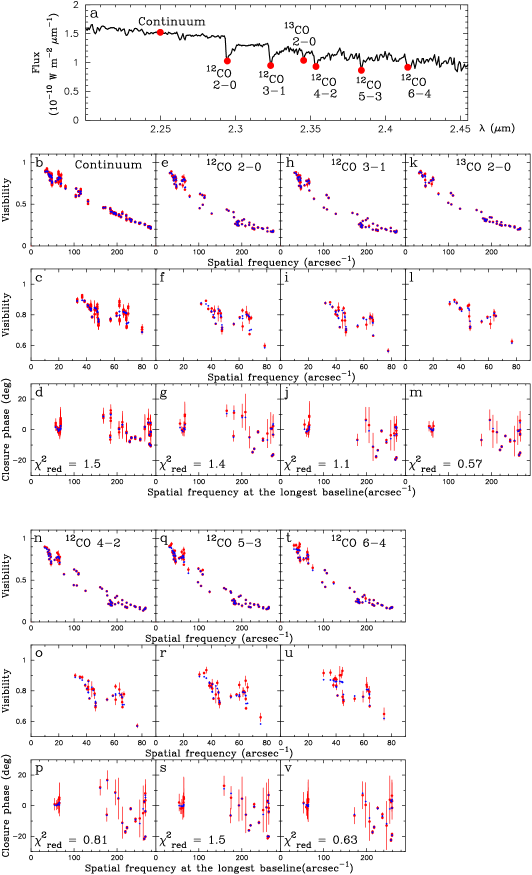
The spectroscopic calibration to remove the telluric lines and instrumental effects was carried out as described in Appendix A.2. Figure 3 shows the spectroscopically calibrated spectra of HR3126 obtained from the AMBER and GRAVITY data (these latter data were convolved to the AMBER’s spectral resolution as mentioned above). Both spectra agree very well, demonstrating the reliability of our spectroscopic calibration method. The 12CO first overtone bands from = 2 – 0 to 6 – 4 as well as the 13CO = 2 – 0 band can be identified. We note that the AMBER spectrum shows very weak absorption at the wavelength of the Br line, while the GRAVITY spectrum shows weak emission. This is because the proxy stars used to approximate the calibrators’ spectra (see Appendix A.2) show the Br line in absorption, and the slight difference between the proxy stars and the calibrators actually observed leads to the weak, residual absorption or emission. The present data set an upper limit of 5% of the continuum on the absorption or emission of the Br line but do not allow us to draw a definitive conclusion about the presence of the Br line in HR3126. However, even if it is absent, it is not unexpected for an early M giant. We also confirmed that no signature of the Br line is seen in the visibility amplitude, closure phase, and differential phase (even in the original GRAVITY data with the spectral resolution of 4500).
3.2 Single-dish observations with VLT/SPHERE-ZIMPOL, NACO, and VISIR
We carried out complementary single-dish high spatial resolution observations of HR3126 at 0.55, 2.24, and 7.9–19.5 m, using the VLT instruments SPHERE-ZIMPOL (Beuzit et al. beuzit08 (2008); Thalmann et al. thalmann08 (2008)), NACO (Lenzen et al. lenzen03 (2003); Rousset et al. rousset03 (2003)), and VISIR (Lagage et al. lagage04 (2004)), respectively (Program IDs: 096.D-0482 and 099.D-0493, P.I.: K. Ohnaka). The goal of these single-dish observations is to examine the possible presence of a component larger than the field of view of the VLTI/AMBER and GRAVITY observations (250 mas). The SPHERE-ZIMPOL instrument was used to take nearly diffraction-limited polarimetric images at 0.55 m with a spatial resolution of 25 mas and a field of view was 2″ 2″. We also carried out speckle interferometric observations with NACO at 2.24 m, which falls onto the continuum region in the spectral windows of the AMBER and GRAVITY observations. These NACO data provided the visibility amplitude and closure phase with a spatial resolution of 64 mas and a field of view of 3.5″3.5″. Our VISIR observations were made at 7.9, 9.8, 12.8, 17.7, and 19.5 m with spatial resolutions of 04–06 and a field of view of 38″ 38″. The details of these VLT single-dish observations and data reduction are described in Appendix B.
4 Results
4.1 AMBER+GRAVITY near-infrared interferometric imaging
We reconstructed images from the AMBER and GRAVITY data (squared visibility
amplitude and closure phase), using
MiRA ver 0.0.9888https://cral-perso.univ-lyon1.fr/labo/perso/eric.thiebaut
/?Software/MiRA (Thiébaut thiebaut08 (2008)).
We employed two different regularization schemes: pixel intensity quadratic
regularization
(e.g., Eq. 44 of Thiébaut thiebaut08 (2008),
Eq. 7 of Hofmann et al. hofmann14 (2014),
also called Tikhonov regularization) and the pixel difference quadratic
regularization
(Eq. 46 of Thiébaut thiebaut08 (2008), Eq. 9 of
Hofmann et al. hofmann14 (2014), also called total squared variation
in Event Horizon Telescope Collaboration et al. eht19 (2019)).
In the case of the pixel intensity quadratic regularization, a flat
prior was used, while no prior was used for the pixel difference quadratic
regularization.
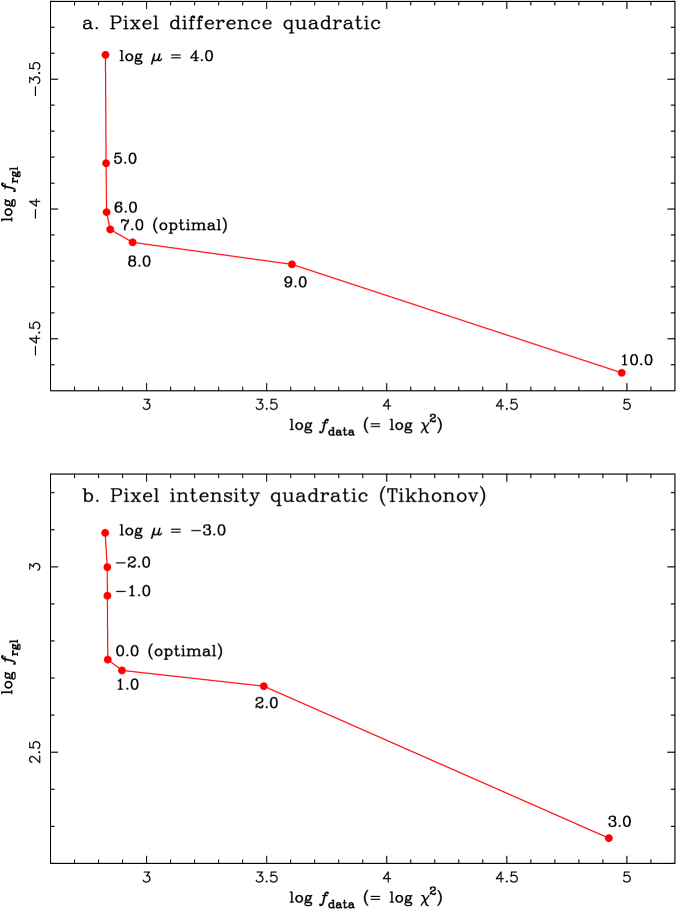
The optimal value of the hyper-parameter ,
which represents the weight of the regularization term, was determined
with the L-curve method (Hansen hansen92 (1992)). The L-curves obtained
with two regularizations for the reconstruction of the continuum images
are shown in Fig. 10.
We checked the L-curve separately for the continuum and each CO band head
and confirmed that the best value for the continuum is also optimal
for the reconstruction of the CO band images.
The reconstruction was started from a point source with each regularization. The images reconstructed with two different regularizations turned out to be similar. Therefore, we only present below the images reconstructed with the pixel difference quadratic regularization. The images reconstructed with the pixel intensity quadratic regularization are shown in Fig. 11.
The output of MiRA is unconvolved images that minimize the cost function consisting of the data term (i.e., goodness of the fit to the interferometric measurements) and the regularization term. In addition to these unconvolved images, we present below the images convolved with the beam size of = 1.8 mas ( is the maximum baseline), as is often presented in the literature (e.g., Kraus et al. kraus10 (2010)). We note that MiRA searches for a solution by comparing the Fourier transform of unconvolved images with measured interferometric observables, and therefore, the convolution with the above beam size does not affect the image reconstruction process. The reconstructed images were flux-calibrated so that the flux integrated over the entire image matches the photometrically calibrated flux at the corresponding wavelength, using the spectrum obtained in Sect. 3.1.
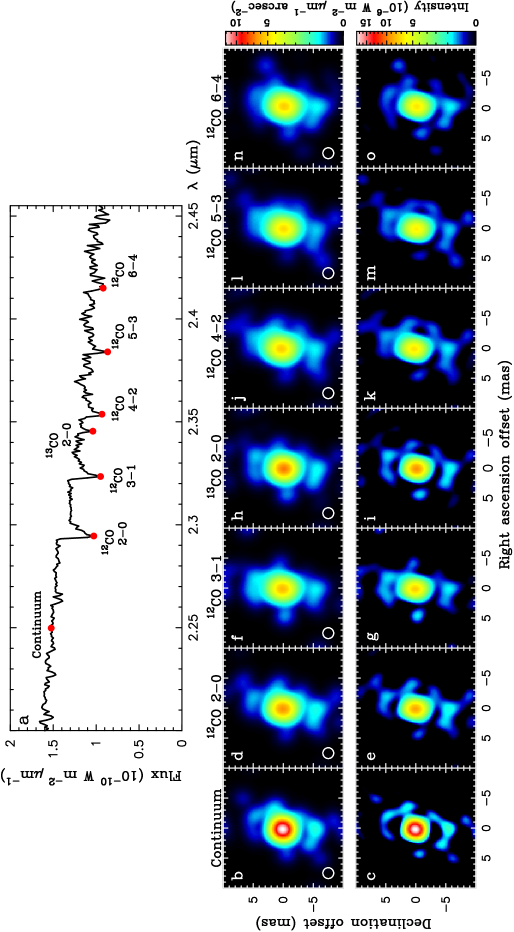
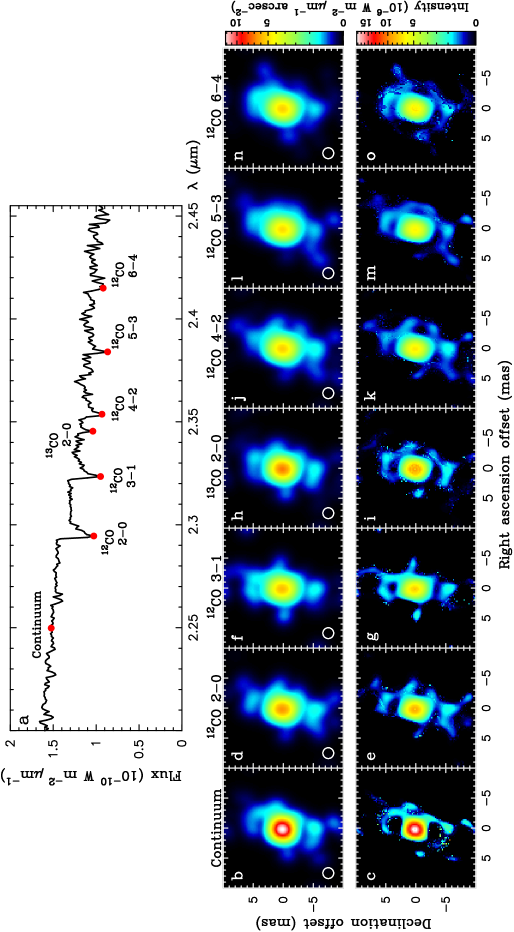
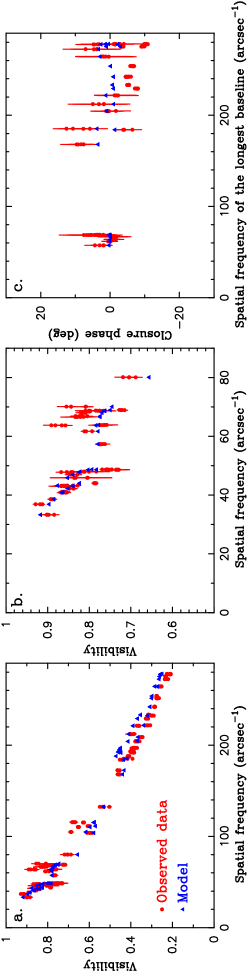
Figure 4 shows the images reconstructed at seven different wavelengths in the continuum as well as in the CO band heads. Comparison of the observed visibilities and closure phases with those from the reconstructed images is shown in Fig. 12. We show both the unconvolved images and the images convolved with = 1.8 mas, as mentioned above. The images reconstructed in the continuum (Figs. 4b and 4c) reveal strong central emission and an elliptical ring-like structure, whose eastern side is incomplete. The semimajor and semiminor axes of the ring are 5.3 mas and 3.5 mas, respectively.
The elliptical ring is interpreted as the inner rim of an equatorial dust disk. If we assume that the (deprojected) disk’s inner rim is circular, the observed ratio of the major and minor axes suggests an inclination angle of 50° (i.e., we are looking at the central star at 50° away from pole-on). The position angle of the ring’s minor axis is 77°, which means that the disk’s symmetry axis is approximately aligned with the arcminute-scale bipolar nebula shown in Fig. 1a. The outflow velocity of the bipolar nebula of 35 km s-1 (Nyman et al. nyman93 (1993)) translates into a deprojected velocity of 54 km s-1 with the inclination angle of 50°. This deprojected outflow velocity and the angular radius of the bipolar nebula of 0.2 pc give the dynamical age of 3900 yrs as mentioned in Sect. 2.
We interpret the central emission as the central star. The emission appears to be smooth (see also Fig. 5), not showing the edge of the stellar limb. This is simply because our AMBER+GRAVITY measurements sample only the first visibility lobe of the central star component and therefore do not allow us to reconstruct the edge of the stellar disk. As described in Sect. 2, the angular radius of the central star is estimated to be 1.5 mas (or 0.57 au). Therefore, the disk is surprisingly compact—in spite of the arcminute-scale bipolar nebula—with the inner rim being located at a mere 3.5 (= 2 au) from the central star.
Figure 4 also shows the images reconstructed in the CO band heads of the = 2 – 0, 3 – 1, 4 – 2, 5 – 3, 6 – 4 transitions as well as in the 13CO 2 – 0 band head. The CO band head images show the inner rim of the equatorial disk and the central emission as found in the continuum image described above. The intensity of the disk’s inner rim in the CO band head images is approximately the same as in the continuum image. This is expected because the dust opacity changes little across the CO band heads. The peak intensity of the central emission in the CO band head images is lower than in the continuum image. This can be attributed to the CO absorption due to the central star’s atmosphere.
The central emission seen in all CO band head images is more extended in the N-S direction than in the continuum image. This can be clearly seen in Fig. 5, which shows the 1-D intensity profiles at two orthogonal position angles of 170° and 80° derived from the unconvolved images. The 1-D intensity profiles at the position angle of 170° at all CO band heads (solid red lines) are more extended than that in the continuum (dotted red lines). The 1-D profiles at the position angle of 80° only show small differences between the CO band heads (solid blue lines) and the continuum (dotted blue lines). This suggests that either the central star’s atmosphere is more extended in the equatorial plane or the CO gas emission from the equatorial plane inside the dust cavity makes the central emission appear to be elongated. The former scenario is possible if there is an undetected companion close to the star. Unfortunately, the presence of a companion is neither confirmed nor excluded for HR3126, owing to the lack of monitoring measurements of the radial velocity (see discussion in Sect. 6.2). The two-epoch measurements by Andersen et al. (andersen85 (1985)) detected no significant radial velocity variation, although it may simply be a coincidence. At the moment, we cannot distinguish two scenarios.
4.2 VLT single-dish imaging and interferometric observations
HR3126 is unresolved in all our single-dish observations with SPHERE-ZIMPOL, NACO, and VISIR. It is not surprising that the compact dust disk of mas imaged with AMBER and GRAVITY is not resolved even with the 25 mas resolution of SPHERE-ZIMPOL. However, our goal of these single-dish observations was to examine the possible presence of an extended component. The result that HR3126 is unresolved with these instruments suggests the absence of an extended component that would have been resolved out with AMBER and GRAVITY. The arcminute-scale bipolar nebula is not seen in the SPHERE-ZIMPOL data, probably because its surface brightness is very low (Dachs & Isserstedt dachs73 (1973); Dachs et al. dachs78 (1978)). Details of the results of our VLT single-dish observations are presented in Appendix D.
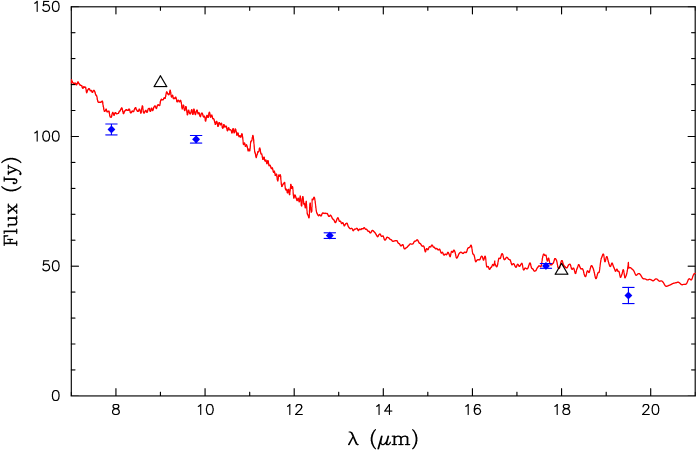
Figure 6 shows the - and -band fluxes measured with VISIR (values are listed in Table LABEL:res_visir_table), together with the ISO/SWS spectrum (Sloan et al. sloan03 (2003)) and AKARI data (Ishihara et al. ishihara10 (2010)). The 15-radius aperture used to derive the fluxes from the VISIR data is much smaller than the field of view of the ISO/SWS data, 14″ (20–27)″, and the beam size of the AKARI data, 9″ (Ishihara et al. ishihara10 (2010)). Nevertheless, the VISIR fluxes are only slightly lower than or equal to the ISO/SWS spectrum and AKARI fluxes. Therefore, most of the mid-infrared emission from 7.9 to 19.5 m is concentrated in the region unresolved with VISIR, smaller than the full width at half maximum (FWHM) of 06 (or half width at half maximum of 03) of the observed images. This angular size translates into a linear radius of 110 au or 200 .
We note that the mid-infrared spectrum of HR3126 only shows a weak, broad feature centered at 9–10 m, in marked contrast to the prominent silicate peak at 9.8 m often seen in oxygen-rich AGB stars. As we show in Sect. 5, the observed weak feature can be explained by the predominance of large grains.
| Filter | Flux | FWHM | PSF FWHM | |
|---|---|---|---|---|
| (m) | (Jy) | (″) | (″) | |
| J7.9 | 7.9 | 0.53 | 0.61 | |
| SIV_1 | 9.8 | 0.46 | 0.48 | |
| NeII | 12.8 | 0.47 | 0.41 | |
| Q1 | 17.65 | 0.56 | 0.54 | |
| Q3 | 19.50 | 0.59 | 0.57 |
5 2-D dust radiative transfer modeling
5.1 Modeling of the SED
We carried out 2-D radiative transfer modeling of the AMBER+GRAVITY image in the continuum and the observed SED to derive the physical properties of the dust disk, using the Monte-Carlo multi-dimensional radiative transfer code mcsim_mpi (Ohnaka et al. ohnaka06 (2006); ohnaka16 (2016)). The absorption of photons and the calculation of the dust temperature are treated with the method of Bjorkman & Wood (bjorkman01 (2001)). The scattering of photons by dust grains is incorporated by using the scattering matrix (special Mueller matrix). The radiation of the central star is represented by the model of Castelli & Kurucz (castelli03 (2003)) with = 3750 K, = 0.5, and [Fe/H] = , as described in Sect. 2. We adopted the disk geometry described as
where and are the radial distance from the star and the height from the equatorial plane, respectively, and is the radial distance in the equatorial plane. The parameters and are the radius of the inner rim of the disk and its height at the inner rim, respectively. The angular radius of the star of 1.5 mas and the observed semimajor axis of 5.3 mas of the inner rim suggest that the inner radius is 3.5 . We tentatively set the disk outer radius to be 500 . The free parameters to define the physical properties of our disk model are the optical depth in the radial direction in the equatorial plane (), the height of the disk at its inner rim (), the radial density exponent (), and , which characterizes the flaring of the disk. In addition, we need two parameters to specify the inclination angle () and the position angle of the disk in the plane of the sky (PA). It is also necessary to specify the grain properties. We adopted the optical properties of the astronomical silicate dust presented by Ossenkopf et al. (ossenkopf92 (1992)), assuming homogeneous spherical grains. The grain radius is the last free parameter of our modeling.
We need the bulk density of silicate to calculate the dust mass density and the total dust mass of the disk. Bulk densities from 3.0 to 3.7 g cm-3 are adopted in the literature (e.g., Bouwman et al. bouwman01 (2001); Suh suh02 (2002)). We adopted the 3.5 g cm-3 from Draine (draine03 (2003)).
The search for the best-fit model was carried out in the following manner. The computation of the model images is more time-consuming than that of SEDs. Therefore, we first calculated SEDs for a grid of models with the parameter ranges (, , , , , and ) listed in Table LABEL:modeltable. The disk’s position angle in the plane of the sky does not affect the model SEDs, which is why it was not changed at this step. We selected the models that fit the observed SED by visual inspection. We did not use the reduced for the following reason. While only discrete photometric data are available from the visible to the near-infrared, the ISO/SWS spectrum covers continuously from 2.4 to 45 m. Therefore, a model that fits very well to the ISO/SWS spectrum but fails to reproduce the visible and near-infrared photometric data may still show a good value, which is misleading.
The comparison between the model and observed SEDs shows that grains as large as 4 m can fairly reproduce the broad silicate feature in the mid-infrared without a prominent peak at 9.8 m often seen in oxygen-rich AGB stars. As shown in Fig. 7a (inset), the silicate feature predicted with 4 m grains is blunt as seen in the observed spectrum. The model predicts the feature to be too broad, failing to reproduce the spectrum between 11.5 and 15 m. This may be due to the possible presence of smaller grains shielded by the optically thick 4 m grains as mentioned below. We found that grain sizes in the range of m can fairly reproduce the observed blunt silicate feature. The grain size larger (or smaller) than this range leads to a silicate feature too featureless (or too prominent) compared to the observed spectrum.
Another constraint on the grain size is provided by the dust temperature at the inner rim of 3.5 . Our models show that the inner rim dust temperature reaches 1740 K with a grain size of 0.1 m even for = 1, and the temperature is even higher for optically thicker cases. With a grain size of 0.5 m, the dust temperature at the inner rim is 1650 K for = 1, which may be marginally acceptable, given the uncertainties in the dust sublimation temperature (for example, Hillen et al. hillen14 (2014) derived an inner rim temperature of 1600 K for the disk around the post-AGB star 89 Her). Grains larger than 0.5 m can survive at 3.5 due to their high albedo in the visible and near-infrared. The grain size of 4 m suggested from the mid-infrared spectrum is consistent with this grain size range constrained by the inner rim dust temperature.
For the models selected based on the SED, we re-computed the models with many more photon packages to obtain model images of sufficient quality. We computed the visibility amplitude and closure phase at the observed points from the model images and compared them with the observed data. In this comparison, we changed the disk’s position angle in the plane of the sky (PA) as a free parameter for each model and selected the best-fit model by eye. We opted not to use the reduced value for the following reason. Some models fit very well to the interferometric observables in a certain range of the spatial frequency (e.g., the visibility amplitude at spatial frequencies higher than 100 arcsec-1), while the fit is poor in other regions of the spatial frequency. Nevertheless, if the fit to the former region is very good, the reduced value can be low, despite the poor fit in other regions. We selected models that fit the observed visibilities and closure phases as homogeneously as possible across the observed spatial frequency range.
5.2 Modeling of the SED and interferometric data
Figure 7 shows a comparison of the image and SED of the best-fit model with those observed. Comparison of the visibility and closure phase is shown in Fig. 14. From the best-fit model image, we also generated simulated interferometric data with noise similar to the AMBER+GRAVITY measurements at the same points as the observed data. Then we carried out image reconstruction from the simulated data with the same set-up as for the real data using both regularizations. The model image reconstructed in this fashion is shown in Fig. 7c (only the image reconstructed with the pixel difference quadratic regularization is shown because two regularizations resulted in similar images). The best-fit model is characterized by = 3.0, = 0.5 , = 2.5, = 5, and the grain size of 4 m, as summarized in Table LABEL:modeltable.
The observed SED and image are reasonably reproduced by the model from the visible to 30 m. The 60 m and 100 m fluxes measured with IRAS (data points with the arrows in Fig. 7a) are significantly higher than predicted by the model. This is attributed to the background cirrus not physically associated with HR3126, as Chiar et al. (chiar93 (1993)) note. However, the model also underestimates the 70 m Herschel/PACS flux. The 70 m Herschel image in the Herschel data archive shows that most of the 70 m flux originates from the equatorial region and the nebula extending to a radius of 1′ ( ), much larger than the outer radius of our models (500 ). Because we focus on the modeling of the inner region of the equatorial disk, it is beyond the scope of the present paper to model the entire disk and nebula, where the disk geometry and grains properties may be different from the inner disk modeled here.
The value of = 2.5 means that the disk is strongly flared, while its density falls off steeply in the radial direction as suggested by = 5. However, because we adopted the above flared disk density distribution for simplicity, other disk geometries may be possible. This point should be further investigated by high spatial resolution thermal-infrared imaging with VLTI/MATISSE (Lopez et al. lopez14 (2014)), which allows us to probe the region farther out than imaged with AMBER and GRAVITY.
The best-fit inclination angle is derived to be 55° (i.e., the disk is seen at 55° from pole-on), and the position angle of the minor axis of the projected inner rim is 75°, roughly aligned to the axis of the bipolar nebula. The dust temperature reaches 1590 K at the inner boundary, which is acceptable for a dust sublimation temperature. The eastern side of the inner rim is fainter than the western side, as seen in the reconstructed image (Fig. 4). This is because the irradiated inner wall is directly seen on the western side (far side of the inner rim), while it is hidden from the observer on the eastern side (near side of the inner rim). The uncertainties in the disk parameters were estimated by changing them around the best-fit model with steps smaller than the grid in Table LABEL:modeltable. The estimated uncertainties are (), (), (), and (). The inclination angle and the position angle of the disk projected onto the sky are constrained with an uncertainty of °. As described above, the uncertainty in the grain size is m, but as we discuss below, the presence of smaller grains cannot be excluded. Because of the steep radial density gradient, the uncertainty in the outer radius does not affect the results.
We also estimated the pressure scale height at the inner rim expected in hydrostatic equilibrium, which is written as
where , , , and represent the dust temperature at the inner rim, the mean molecular weight, the proton mass, and the current stellar mass, respectively (e.g., Dullemond et al. dullemond01 (2001)). The inner rim dust temperature and the radius were set to 1590 K and 2 au (3.5 ), respectively, as described above. The stellar mass is . The mean molecular weight was estimated as follows. The dust mass density of the best-fit model at the inner rim in the equatorial plane is g cm-3 with the adopted bulk density of 3.5 g cm-3. Adopting gas-to-dust ratios of 100–200, the gas density is estimated to be (5.8–11.6) g cm-3. Then, assuming chemical equilibrium, we calculated the partial pressure of various molecular and atomic species. The mean molecular weight is derived to be 2.2 for the above gas density range. The pressure scale height at the inner rim is estimated to be , which is in fair agreement with the derived from the 2-D radiative transfer modeling.
5.3 Inner rim dust temperature from spectral fitting
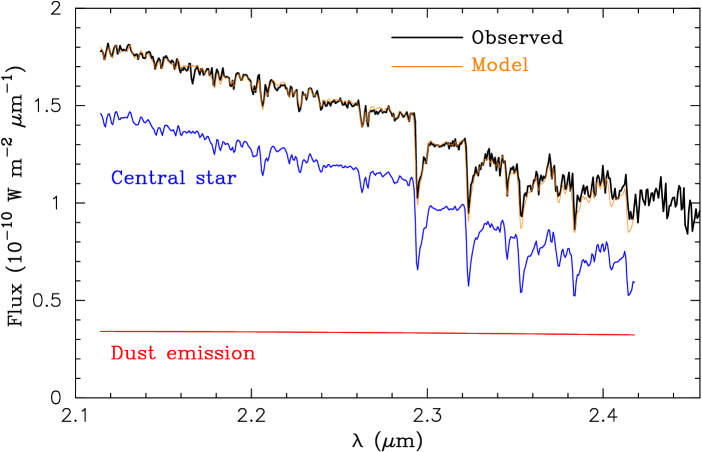
We estimated the inner rim dust temperature by fitting the observed spectrum with the stellar spectrum and the blackbody radiation from the inner rim, independent of the radiative transfer modeling. As a proxy of the central star of HR3126, we used the spectrum of the M2II star HD23475 obtained with the Infrared Telescope Facility (IRTF) presented by Rayner et al. (rayner09 (2009))999http://irtfweb.ifa.hawaii.edu/~spex/IRTF_Spectral_Library/index.html because its spectral type and luminosity class are similar to those of HR3126. The spectrum of HD23475 originally taken with a spectral resolution of 2000 was convolved down to match the spectral resolution of 1500 of the observed spectrum of HR3126 shown in Fig. 3.
The predicted spectrum () can be written as the weighted sum of the flux of the central star (, IRTF spectrum of HD23475) and the blackbody radiation from dust (, is the dust temperature)
where is a reference wavelength at which the flux of the model spectrum is matched to the observed flux, and and represent the fraction of the stellar flux and dust emission at , respectively (). We set to 2.25 m and derived to be 0.78 from the reconstructed image in the 2.25 m continuum. The dust temperature is the only parameter, and it changes not only the slope of the continuum emission but also the depth of the CO bands of the summed spectrum. By changing from 1000 to 2000 K, we found that the observed spectrum is fitted with K (Fig.8). This temperature range is in broad agreement with the inner rim dust temperature of 1590 K derived from the above 2-D radiative transfer modeling.
| Parameter | Range | Best-fit value |
|---|---|---|
| : inner radius () | fixed | 3.5 (= 2 au) |
| : outer radius () | fixed | 500 (= 285 au) |
| (optical depth at 0.55 m) | 0.5, 1.0, 2.0, 3.0, … 7.0 | |
| : disk height at () | 0.125, 0.25, 0.5, 0.75, … , 1.5 | |
| (= au) | ||
| : flaring parameter | 0.5, 1.0, 1.5, …, 3.5 | |
| : radial density exponent | 2, 3, 4, …, 7 | |
| : grain radius (m) | 0.1, 0.5, 1.0, 3.0, 4.0, 5.0, 6.0 | |
| : inclination (°) | 30, 35, 40, … , 80 | |
| PA: position angle (°) | 60, 65, 70, … , 100 | |
| (Symmetry axis of the disk projected onto the plane of the sky) | ||
| Disk dust mass () | — | |
| Disk total mass () | — | |
| (gas-to-dust ratio = 200) | ||
6 Discussion
6.1 Properties of the equatorial disk
Our radiative transfer modeling shows the presence of grains as large as 4 m at only 3.5 from the central star. To see whether the grains can exist in a stable manner in the disk, we estimate the ratio of the radiation pressure to the gravitational acceleration , where and denote the acceleration due to the radiation pressure and the gravitational acceleration, respectively. The ratio is given by
where , , , , and are the luminosity of the central star, its mass, the flux-mean opacity, the grain radius, and the bulk density of dust grains, respectively (Yamamura et al. yamamura00 (2000)). We obtained from the extinction coefficients of the 4 m grain and the spectrum of the central star used in our radiative transfer modeling. Inserting = 2500 , = 2.2 , = 4.0 m, and = 3.5 g cm-3 results in = 102. The value of for the gas-dust-mixture is diluted by the gas-to-dust ratio , that is, . While a gas-to-dust ratio of 100 is often assumed in the literature, higher gas-to-dust ratios of 200–500 are also found or adopted in Galactic sources (e.g., Ramstedt et al. ramstedt08 (2008); Olofsson et al. olofsson19 (2019)). With = 100–200 adopted in the present work, is estimated to be 0.5–1.0. Therefore, as far as the bulk density of 3.5 g cm-3 is assumed, the large 4-m grains can exist in the dust disk in a stable manner, not blown away by the radiation pressure from the central star. If the bulk density of 3 g cm-3 and the low gas-to-dust ratio of 100 are adopted, is 1.2, which indicates that the disk is expanding. In this case, the disk material should be replenished by the stellar wind from the central M giant. However, its current mass-loss rate is low, yr-1 (Sect. 2), which implies an optically thin stellar wind (e.g., Heras & Hony heras05 (2005)). Given the difficulty in sustaining the optically thick disk with the optically thin stellar wind, the expanding disk scenario is not favorable. However, we need high spatial resolution kinematic study of the disk to confirm this argument.
We found that exceeds 1 for a grain radius of 1 m even with the rather high gas-to-dust ratio of 500. Therefore, grains smaller than 1 m should be blown away by the radiation pressure and therefore should be absent in the disk. However, it is possible that the small grains might exist in the disk if they are shielded from the central star’s radiation by the optically thick inner rim. High spatial resolution data in the mid-infrared would be useful to prove or disprove this possibility.
Recent visible and near-infrared polarimetric observations show that grains that form in the stellar winds of oxygen-rich AGB stars are 0.1–0.4 m (Norris et al. norris12 (2012); Khouri et al. khouri16 (2016), khouri20 (2020); Ohnaka et al. ohnaka16 (2016), ohnaka17 (2017); Adam & Ohnaka adam19 (2019)). If the disk formed together with the bipolar nebula due to binary interaction, the grains must have grown from a few m to 4 m on a time scale of the nebula’s dynamical age of 3900 yrs. The disk’s dust mass is estimated to be , which translates into a total disk mass of (2.6–5.2) with the gas-to-dust ratios of 100–200. The total disk mass is three orders of magnitude smaller than the nebula’s mass of 1 (L.-Å. Nyman, priv. comm.). However, as mentioned above, our model underestimates the 70 m Herschel/PACS flux, suggesting the presence of cold dust in the outer region of the disk. Therefore, the above disk mass is a lower limit, and at the moment we cannot draw a definitive conclusion about the fraction of mass that formed the disk.
6.2 Possibility of a companion
As mentioned in Sect. 4.1, the presence of a companion is neither confirmed nor disproved for HR3126 in the literature. It is possible that a companion was shredded into an accretion disk around the primary star as Nordhaus & Blackmann (nordhaus06 (2006)) postulate as one of the common-envelope evolution scenarios. The bipolar nebula might have formed as a consequence of the violent mass ejection associated with the disruption of the companion. On the other hand, if the companion was not shredded, and the envelope (of the primary star) was not entirely ejected, it is possible that the matter falls back and form a circumbinary disk (e.g., Ivanova et al. ivanova13 (2013)). In this case, the companion is likely to exist within the dust cavity.
We attempted to set a constraint on the separation between the red giant and a putative companion in the following manner. Artymowicz & Lubow (artymowicz94 (1994)) show that the ratio of the tidally truncated inner radius of the circumbinary disk to the binary semimajor axis is 1.7 for mass ratios between 0.05 and 0.5 in the case of circular orbits. The ratio can be larger in the case of eccentric orbits. The ratio of 1.7 translates into a binary separation of 2.1 (1.2 au) for the radius of HR3126’s inner rim of 3.5 (2 au). The binary separation cannot be greater than 2.1 because the tidal truncation radius would be larger than the observed inner rim radius. The binary separation can be smaller than 2.1 , in which case the inner rim radius is determined by dust sublimation. The binary separation of (1.2 au) is very small, given that non-Mira-type K and M giants possess a dense molecular atmosphere extending out to 2 (e.g., Ohnaka ohnaka13 (2013); Ohnaka & Morales Marín ohnaka18 (2018); Ohnaka et al. ohnaka19 (2019)). A binary companion orbiting through the dense outer atmosphere of the red giant would experience considerable friction, which might make the companion spiral in to the primary red giant. Therefore, the presence of a companion is disfavored, although we cannot yet entirely exclude its presence.
If a companion is nevertheless present, it is likely to be a main-sequence star less massive than the red giant. If we assume that the red giant’s initial mass is 3 (Sect. 2), and the main-sequence companion is less massive than 2 , the luminosity of the companion should be lower than 20 based on the theoretical evolutionary tracks of Lagarde et al. (lagarde12 (2012)). This means that the companion’s luminosity is more than 100 times lower than that of the red giant. The dynamic range of the reconstructed images is estimated to be 30 from the reconstruction noise. The non-detection of a companion in the reconstructed images implies that its 2.2 m brightness is more than 30 times lower than that of the red giant. Therefore, it is not surprising that a putative companion more than 100 times less luminous than the red giant was not detected in the AMBER+GRAVITY images.
If we assume the aforementioned binary separation of 1.2 au, the orbital velocity of the red giant and the period are estimated to be 8 km s-1 (or 4 km s-1) and 0.9 yr (or 0.9 yr) for a 0.5 (or 0.2 ) companion. While these values seem to show that radial velocity monitoring is feasible to set constraints on the mass and separation of the companion, a problem is wavelength shifts of spectral lines caused by pulsation and/or convection of the red giant. Lebzelter et al. (lebzelter02 (2002)) show that the velocity variation amplitude in semiregular and irregular variable M giants is 3–4 km s-1. Therefore, a companion less massive than 0.2 would be difficult to confirm by radial velocity monitoring.
6.3 Comparison with other red giants associated with optical bipolar nebulae
As mentioned in Sect. 1, the number of red giants associated with bipolar nebulae is very limited. Particularly, non-interacting systems (interacting systems include, for example, symbiotic stars) with red giants and optical bipolar nebulae are rare. Frosty Leo and OH231.8+4.2 are well-studied among such objects. Both objects have red giant stars at their center and exhibit prominent optical bipolar nebulae whose spatial extent is comparable to that of the Toby Jug Nebula (0.4 pc, from the tip of the one lobe to the tip of the other). The central star of Frosty Leo is a red giant with an effective temperature of 3750 K (Robinson et al. robinson92 (1992)), and the bipolar nebula has an angular extent of 04 (Sahai et al. sahai00 (2000)), which corresponds to 0.4 pc at a distance of 3 kpc (Mauron et al. mauron89 (1989); Robinson et al. robinson92 (1992)). The central star of OH231.8+4.2 is an M9 Mira star (Cohen cohen81 (1981); Kastner et al. kastner92 (1992), kastner98 (1998)), and its bipolar nebula has an extension of 0.4 pc along its symmetry axis (Bujarrabal et al. bujarrabal02 (2002)).
However, the inner rim of the equatorial dust disk of both objects is much larger than that of HR3126. Murakawa et al. (murakawa08 (2008)) derived the inner radius to be 5200 (1000 au) for Frosty Leo. Matsuura et al. (matsuura06 (2006)) estimate the inner radius of OH231+4.2 to be 40–50 au, which translate into 19–24 with = 2.1 au (Sánchez Contreras et al. sanchez_contreras18 (2018)). A possible explanation is the expansion of the disks. In fact, (sub)millimeter molecular line observations show the presence of slowly expanding disks in Frosty Leo and OH231.8+4.2 (Castro-Carrizo et al. castro-carrizo05 (2005); Sánchez Contreras et al. sanchez_contreras18 (2018)). However, it is also possible that the disk inner rim radius is determined by the past binary interaction.
An optical bipolar nebula has recently been imaged toward the second closest AGB star L2 Pup (Kervella et al. kervella15 (2015)). The central red giant of L2 Pup is very similar to HR3126 in terms of the effective temperature and the linear radius. However, the optical bipolar nebula of L2 Pup is seen only up to 15 au, much smaller than the 0.2 pc of HR3126. The dust disk of L2 Pup has an inner radius of 6 au (10 using the stellar radius of 123 derived by Kervella et al. kervella14 (2014)), significantly larger than the 2 au (3.5 ) of HR3126. The grain size also significantly differs between two objects: 0.1–0.3 m in L2 Pup (Kervella et al. kervella14 (2014); kervella15 (2015)) and 4 m in HR3126.
Binary interaction is considered to be the key in the formation of the bipolar outflow and disks in these four objects (HR3126, OH231.8+4.2, Frosty Leo, and L2 Pup). In fact, a binary companion is detected in OH213.8+4.2 and L2 Pup (Sánchez Contreras et al. sanchez_contreras04 (2004); Kervella et al. kervella15 (2015)), while no companion has been confirmed in HR3126 and Frosty Leo. It is very likely that the differences in the properties of the bipolar nebula and equatorial disk among four objects result from the differences in the properties of their companion and the history of the interaction. While it is not possible to disentangle the binary interaction history of HR3126 from the present observations alone, further high-resolution observations of this object will be useful for better understanding the role of binary interaction in the formation of the bipolar outflow and the equatorial disk. It should be noted that while the central star of OH231.8+4.2, Frosty Leo, and L2 Pup is partially or completely obscured by the equatorial dust disk, HR3126 allows us to directly observe the central region close to the star. Therefore, further high spatial resolution observations of this target will provide information about the formation mechanism of the bipolar nebula and the equatorial disk, complementary to the above three objects.
7 Conclusion
Using the VLTI instruments AMBER and GRAVITY, we imaged the central region of the Toby Jug Nebula (reflection nebula IC2220), which is an arcminute-scale bipolar outflow emanating from the AGB star HR3126. The images reconstructed in the continuum at 2.2 m reveal the inner rim of the equatorial dust disk, whose axis is approximately aligned with the axis of the optical bipolar nebula. The images reconstructed in the CO first overtone bands show that the emission from inside the dust cavity is elongated in the N-S direction. This indicates the oblateness of the central star’s atmosphere in the equatorial plane or the presence of CO gas in the disk inside the dust cavity.
Our single-dish VLT observations with SPHERE-ZIMPOL, NACO, and VISIR show that HR3126 is unresolved at 0.55, 2.24, and 7.9–19.5 m at the resolutions of 25 mas, 64 mas, and 04–06, respectively. These results suggest the absence of an extended component larger than the field of view of AMBER and GRAVITY of 250 mas.
The observed SED and interferometric image of the resolved disk in the continuum can be explained by an optically thick flared disk model with an inner rim radius of 3.5 (= 2 au), consisting of silicate grains as large as 4 m. Such large grains are likely to exist in a stable manner, not blown away by radiation pressure. Also, the derived grain size is much larger than the 0.1–0.4 m found in cool oxygen-rich AGB stars, suggesting efficient grain growth on a time scale of the nebula’s dynamical age of 3900 yrs. The total disk mass estimated from our modeling is with a gas-to-dust ratio of 200. However, this is a lower limit, given the presence of cold dust in the outer region of the disk, not included in our modeling. High spatial resolution observations in the thermal infrared and in the (sub)mm domain with VLTI/MATISSE and ALMA are valuable for probing the region farther out than imaged with AMBER and GRAVITY.
The non-detection of a companion in the reconstructed images suggests that its 2.2 m brightness is more than 30 times lower than that of the red giant or it might have been shredded due to binary interaction responsible for the formation of the bipolar nebula and the disk.
Acknowledgements.
We thank the ESO Paranal team for supporting our VLT and VLTI observations. We are also grateful to Lars-Åke Nyman for fruitful discussions about the modeling of their radio data. K.O. acknowledges the support of the Agencia Nacional de Investigación y Desarrollo (ANID) through the FONDECYT Regular grant 1180066. This research made use of the SIMBAD database, operated at the CDS, Strasbourg, France. This publication makes use of data products from the Two Micron All Sky Survey, which is a joint project of the University of Massachusetts and the Infrared Processing and Analysis Center/California Institute of Technology, funded by the National Aeronautics and Space Administration and the National Science Foundation.References
- (1) Adam, C., & Ohnaka, K. 2019, A&A, 628, A132
- (2) Andersen, J., Nordström, B., Ardeberg, A., et al. 1985, A&AS, 59, 15
- (3) Artymowicz, P., & Lubow, S. H. 1994, ApJ, 421, 651
- (4) Beuzit, J.-L., Feldt, M., Dohlen, K., et al. 2008, SPIE Proc., 7014, 18
- (5) Bjorkman, J., & Wood, K. 2001, ApJ, 554, 615
- (6) Bourges, L., Mella, G., Lafrasse, S., et al. 2017, JMMC Stellar Diameters Catalogue Version 2
- (7) Bouwman, J., Meeus, G., de Koter, A., et al. 2001, A&A, 375, 950
- (8) Bujarrabal, V., Alcolea, J., Sánchez Contreras, C., & Sahai, R. 2002, A&A, 389, 271
- (9) Cardelli, J. A., Clayton, G. C., & Mathis, J. S. 1989, ApJ, 345, 245
- (10) Castelli, F., & Kurucz, R. 2003, IAU Symp. 210, p.A20
- (11) Castilho, B. V., Gregorio-Hetem, J., Spite, F., Barbuy, B., & Spite, M. 2000, A&A, 364, 674
- (12) Castro-Carrizo, A., Bujarrabal, V., Sánchez Contreras, C., Sahai, R., & Alcolea, J. 2005, A&A, 431, 979
- (13) Chelli, A., Hernandez Utrera, O., & Duvert, G. 2009, A&A, 502, 705
- (14) Chiar, J. E., Whittet, D. C. B., Aitken, D. K., et al. 1993, ApJ, 409, 404
- (15) Cohen, M. 1981, PASP, 93, 288
- (16) Dachs, J., & Isserstedt, J. 1973, A&A, 23, 241
- (17) Dachs, J., & Isserstedt, J., & Rahe, J. 1978, A&A, 63, 353
- (18) De Marco, O. 2009, PASP, 121, 316
- (19) Doan, L., Ramstedt, S., Vlemmings, W. H. T., et al. 2017, A&A, 605, A28
- (20) Draine, B. T. 2003, ARA&A, 41, 241
- (21) Drudis, J. 2018, RNAAS, 2, 41
- (22) Dullemond, C. P., Dominik, C., & Natta, A. 2001, ApJ, 560, 957
- (23) European Space Agency, 2017, Herschel PACS Point Source Catalogue, Version 1.0. https://doi.org/10.5270/esa-rw7rbo7
- (24) Event Horizon Telescope Collaboration et al. 2019, ApJ, 875, L4
- (25) Gaia Collaboration, Brown, A. G. A., Vallenari, A., et al. 2018, A&A, 616, A1
- (26) GRAVITY Collaboration, Abuter, R., Accardo, M., et al. 2017, A&A, 602, A94
- (27) Hansen, P. C. 1992, SIAM Rev., 34, 561
- (28) Heras, A. M., & Hony, S. 2005, A&A, 439, 171
- (29) Hillen, M., Menu, J., Van Winckel, H., et al. 2014, A&A, 568, A12
- (30) Hoai, D. T., Nhung, P. T., Tuan-Anh, P., et al. 2019, MNRAS, 484, 1865
- (31) Hofmann, K. H., & Weigelt, G. 1986, A&A, 167, L15
- (32) Hofmann, K.-H., Balega, Y., Blöcker, T., & Weigelt, G. 2001, A&A, 379, 529
- (33) Hofmann, K.-H., Weigelt, G., & Schertl, D. 2014, A&A, 565, A48
- (34) Homan, W., Richards, A., Decin, L., de Koter, A., & Kervella, P. 2018, A&A, 616, A34
- (35) Humphreys, R. M., & Ney, E. P. 1974, A&A, 30, 159
- (36) Ishihara, D., Onaka, T., Kataza, H., et al. 2010, A&A, 514, A1
- (37) Ivanova, N. Justham, S., Chen, X., et al. 2013, A&ARv, 21, 59
- (38) Kastner, J. H., Weintraub, D. A., Zuckerman, B., et al. 1992, ApJ, 398, 552
- (39) Kastner, J. H., Weintraub, D. A., Merrill, K. M., & Gatley, I. 1998, AJ, 116, 1412
- (40) Kervella, P., Montargès, M., Ridgway, S. T., et al. 2014, A&A, 564, A88
- (41) Kervella, P., Montargès, M., Lagadec, E., et al. 2015, A&A, 578, A77
- (42) Khouri, T., Maercker, M., Waters, L. B. F. M., et al. 2016, A&A, 591, A70
- (43) Khouri, T., Vlemmings, W. H. T., Paladini, C., et al. 2020, A&A, 635, A200
- (44) Kraus, S., Hofmann, K.-H., Menten, K. M., et al. 2012, Nature, 466, 339
- (45) Lagage, P. O., Pel, J. W., Authier, M., et al. 2004, The Messenger, 117, p.12
- (46) Lagarde, N., Decressin, T., Charbonnel, C., et al. 2012, A&A, 543, A108
- (47) Lallement, R., Babusiaux, C., Vergely, J. L., et al. 2019, A&A, 625, A135
- (48) Le Bouquin, J.-B., Abuter, R., Bauvir, B., et al. 2008, SPIE Proc., 7013, 18
- (49) Le Bouquin, J.-B., Abuter, R., Haguenauer, P., et al. 2009, A&A, 493, 747
- (50) Lebzelter, T., & Hinkle, K. H. 2002, A&A, 393, 563
- (51) Lenzen, R., Hartung, M., Brandner, W., et al. 2003, SPIE Proc., 4841, 944
- (52) Lohmann, A. W., Weigelt, G., & Wirnitzer, B. 1983, Appl. Opt., 22, 4028
- (53) Lopez, B., Tuthill, P. G., Danchi, W. C., Monnier, J. D., & Niccolini, G. 2001, A&A, 377, 90
- (54) Lopez, B., Lagarde, S., Jaffe, W., et al. 2014, The Messenger, 157, 5
- (55) Matsuura, M., Chesneau, O., Zijlstra, A. A., et al. 2006, ApJ, 646, L123
- (56) Mauron, N., Le Borgue, J.-F., & Picquette, M. 1989, A&A, 218, 213
- (57) Melnikov, S., Stute, M., & Eislöffel, J. 2018, A&A, 612, A77
- (58) Men’shchikov, A. B., Balega, Y., Blöcker, T., Osterbart, R., & Weigelt, G. 2001, A&A, 368, 497
- (59) Mérand, A., Patru, F., Berger, J.-P., Percheron, I., & Poupar, S. 2012, SPIE Proc., 8445, Optical and Infrared Interferometry III, 84451K
- (60) Murakawa, K., Ohnaka, K., Driebe, T., et al. 2008, A&A, 489, 195
- (61) Nordhaus, J., & Blackman, E. G. 2006, MNRAS, 370, 2004
- (62) Norris, B., Tuthill, P. G., Ireland, M. J., et al. 2012, Nature, 484, 220
- (63) Nyman, L.-Å, Olofsson, H., Rogers, C., Heske, A., & Sahai, R. 1993, Mass Loss on the AGB and Beyond, Second ESO/CTIO Workshop on Mass loss on the AGB and beyond, ed. H. E. Schwarz, p.451
- (64) Ohnaka, K. 2013, A&A, 553, A3
- (65) Ohnaka, K., Driebe, T., Hofmann, K.-H., et al. 2006, A&A, 445, 1015
- (66) Ohnaka, K., Schertl, D., Hofmann, K.-H., & Weigelt, G. 2015, A&A, 581, A127
- (67) Ohnaka, K., Weigelt, G., & Hofmann, K.-H. 2016, A&A, 589, A91
- (68) Ohnaka, K., Weigelt, G., & Hofmann, K.-H. 2017, A&A, 597, A20
- (69) Ohnaka, K., & Morales Marín, C. A. L. 2018, A&A 620, A23
- (70) Ohnaka, K., Weigelt, G., & Hofmann, K.-H. 2019, ApJ, 883, 89
- (71) Olofsson, H., Khouri, T., Maercker, M., et al. 2019, A&A, 623, A153
- (72) Ossenkopf, V., Henning, Th., & Mathis, J. S. 1992, A&A, 261, 567
- (73) Park, S., Lee, J.-E., Kang, W., et al. 2018, ApJS, 238, 29
- (74) Perkins, H. G., King, D. J., & Scarrott, S. M. 1981, MNRAS, 196, 403
- (75) Pesce, J. E., Stencel, R. E., Doggett, J., et al. 1988, A Decade of UV Astronomy with the IUE Satellite, Vol. 1, p.253
- (76) Petrov, R. G., Malbet, F., Weigelt, G., et al. 2007, A&A, 464, 1
- (77) Pilbratt, G. L., Riedinger, J. R., Passvogel, T., et al. 2010, A&A, 518, L1
- (78) Poglitsch, A., Waelkens, C., Geis, N., et al. 2010, A&A, 518, L2
- (79) Price, S. D., Smith, B., Kuchar, T. A., Mizuno, D. R., & Kraemer, K. E. 2010, ApJS, 190, 203
- (80) Ramstedt, S., Schöier, F. L., Olofsson, H., & Lundgren, A. A. 2008, A&A, 487, 645
- (81) Rayner, J. T., Cushing, M., & Vacca, W. D. 2009, ApJS, 185, 289
- (82) Reimers, D. 1977, A&A, 54, 485
- (83) Robinson, G., Smith, R. G., & Hyland, A. R. 1992, MNRAS, 256, 437
- (84) Rousset, G., Lacombe, F., Puget, P., et al. 2003, SPIE Proc., 4839, 140
- (85) Sahai, R., Bujarrabal, V., Castro-Carrizo, A., & Zijlstra, A. 2000, A&A, 360, L9
- (86) Sahai, R., Sugerman, B. E., & Hinkle, K. 2009, ApJ, 699, 1015
- (87) Sánchez Contreras, C., Gil de Paz, A., & Sahai, R. 2004, ApJ, 616, 519
- (88) Sánchez Contreras, C., Alcolea, J., Bujarrabal, V., et al. 2018, A&A, 618, A164
- (89) Schmid, H. M., Bazzon, A., Milli, J., et al. 2017, A&A, 602, A53
- (90) Skrutskie, M. F., Cutri, R. M., Stiening, R., et al. 2006, AJ, 131, 1163
- (91) Sloan, G. C., Kraemer, K. E., Price, S. D., Shipman, R. F. 2003, ApJS, 147, 379
- (92) Smith, V. V., & Lambert, D. L. 1985, ApJ, 294, 326
- (93) Suh, K.-W. 2002, MNRAS, 332, 513
- (94) Tatulli, E., Millour, F., Chelli, A., et al. 2007, A&A, 464, 29
- (95) Thalmann, C., Schmid, H. M., Boccaletti, A., et al. 2008, SPIE Proc., 7014, 70143F
- (96) Thiébaut, E. 2008, SPIE Proc., 7013, 70131I
- (97) van Belle, G. T., Lane, B., F., Thompson, R. R., et al. 1999, AJ, 117, 521
- (98) Vinkovic, D., Blöcker, T., Hofmann, K.-H., Elitzur, M., & Weigelt, G. 2004, MNRAS, 352, 852
- (99) Weigelt, G. 1977, Opt. Commun., 21, 55
- (100) Yamamura, I., Dominik, C., de Jong, T., Waters, L. B. F. M., & Molster, F. J. 2000, A&A, 363, 629
Appendix A VLTI/AMBER and GRAVITY observations
A.1 Comparison of the AMBER and GRAVITY data
Figure 9 shows a comparison of the visibilities and closure phases measured with AMBER and GRAVITY. The consistency of the AMBER and GRAVITY data means no significant time variation and the reliability of the data calibration.
A.2 Spectroscopic calibration of the AMBER and GRAVITY spectra
We carried out the spectroscopic calibration to remove the telluric lines and instrumental effects as , where and denote the true and observed spectra of the science target (HR3126) or the calibrator ( Pyx or Car), respectively. Because the true spectrum of Pyx or Car is not available in the literature, we used the high-resolution () spectrum of HD219477 and HD6130 obtained by Park et al. (park18 (2018))101010http://starformation.khu.ac.kr/IGRINS_spectral_library as their proxies because their spectral types of G5II/III (HD219477) and F0II (HD6130) are the same or close to those of Pyx and Car. The spectra of these proxy stars were convolved to match the spectral resolution of 1500 and used for the spectroscopic calibration described above. The absolute flux calibration (i.e., photometric calibration) of the spectra of HR3126 derived from the AMBER and GRAVITY data was done using the ISO/SWS spectrum (Sloan et al. sloan03 (2003)). The AMBER and GRAVITY spectra were scaled to match the ISO/SWS spectrum in the overlapping wavelength region between 2.36 and 2.45 m.
Appendix B VLT single-dish observations
B.1 Visible polarimetric imaging with SPHERE-ZIMPOL
VLT/SPHERE is an instrument for high spatial resolution and high contrast imaging from 0.55 to 2.32 m, equipped with an extreme adaptive optics (AO) system (Beuzit et al. beuzit08 (2008)). We used the ZIMPOL module (Thalmann et al. thalmann08 (2008)) for nearly diffraction-limited visible polarimetric imaging of the central region of HR3126. Our SPHERE-ZIMPOL observations (Program ID: 096.D-0482) took place on 2016 March 15 (UTC) in P2 mode, which keeps the field orientation fixed. The SPHERE-ZIMPOL instrument allows us to use two different or same filters for its two cameras. We use the filter V (central wavelength = 554 nm, FWHM = 80.6 nm) for both cameras. The field of view was 2″ 2″ with a pixel scale of 3.628 mas. The K3/4III star HD 65273 ( = 5.6) was observed as a point spread function (PSF) reference star. Given its estimated -band angular diameter of 1.35 mas (Bourges et al. bourges17 (2017)), it is entirely unresolved with the spatial resolution of SPHERE-ZIMPOL. For each of HR3126 and the PSF reference star, we took exposures for each of the Stokes , , , and components, with NDIT frames contained in each exposure. The summary of our SPHERE-ZIMPOL observations is given in Table LABEL:obs_sphere_log. HR3126 was also observed on another three nights, 2015 November 20, 2015 November 27, and 2016 January 30. However, the PSF reference data taken on 2015 November 20 show pronounced instrumental artifacts. The data taken on the remaining two nights were classified as “C” by ESO, which means that the data quality is not guaranteed. Therefore, we discarded these data.
The data were reduced with the SPHERE pipeline ver. 0.38.0-9111111http://www.eso.org/sci/software/pipelines/sphere in the same manner as in our previous works (Ohnaka et al. ohnaka16 (2016), ohnaka17 (2017); Adam & Ohnaka adam19 (2019)). The data taken with two cameras of the ZIMPOL module were averaged. The V-filter Strehl ratios both for HR3126 and the PSF reference star, which are listed in Table LABEL:obs_sphere_log, were estimated from the -band Strehl ratios recorded in the GENSPARTA FITS files using the Maréchal approximation as described in Adam & Ohnaka (adam19 (2019)). The V-filter Strehl ratios for HR3126 and the PSF reference star are 0.39 and 0.31, respectively.
B.2 Near-infrared speckle interferometry with NACO
We carried out speckle interferometric observations of HR3126 with the VLT/NACO instrument. We used the fast read-out of the instrument in no-AO mode (i.e., adaptive optics was turned off), which allowed us to extract interferometric data at baselines shorter than 8 m from a large number of short exposures.
Our NACO speckle observations of HR3126 (Program ID: 099.D-0493) occurred on 2017 April 10–11, using the IB2.24 filter centered at 2.24 m with a FWHM of 0.06 m. We used the S27 camera with a pixel scale of 27 mas, applying the hardware windowing with 512514 pixels with DIT = 150 ms. As a calibrator, we observed Vol (K2III, angular diameter = 2.88 mas, Bourges et al. bourges17 (2017)), which appears to be a point source with the spatial resolution of NACO at 2.24 m. A summary of our NACO observations is given in Table LABEL:obs_naco_log.
We reduced the NACO data with the bispectrum speckle interferometry method to extract the 2-D visibility and the bispectrum (Weigelt weigelt77 (1977); Lohmann et al. lohmann83 (1983); Hofmann & Weigelt hofmann86 (1986)). While the entire field of view on the detector was 14″14″, the interferometric observables were extracted from a field of view of 3.5″3.5″ centered around the target. We discarded the data at baselines between 7 and 8 m (telescope’s diameter) because of the poor quality. The spatial resolution corresponding to the maximum baseline of 7 m is 64 mas.
B.3 Mid-infrared imaging with VISIR
Using the VISIR instrument (Lagage et al. lagage04 (2004)), we obtained mid-infrared imaging data of HR3126 in the and bands (Program ID: 096.D-0482). As summarized in Table LABEL:obs_visir_log, HR3126 was observed with three filters in the band and two filters in the band: J7.9 (central wavelength = 7.72 m, FWHM = 0.56 m), SIV_1 ( = 9.81 m, FWHM = 0.19 m), NeII ( = 12.8 m, FWHM = 0.2 m), Q1 ( = 17.65 m, FWHM = 0.83 m), and Q3 ( = 19.50 m, FWHM = 0.40 m). We observed Canopus ( Car, A9II) with the same filters as a PSF reference star and also for flux calibration. The pixel scale and field of view of our VISIR data are 45 mas and 38″ 38″, respectively. The observations were carried out with chopping and nodding to subtract the sky background, with the chopping and nodding angles both set to 7″.
We removed the sky background by subtracting the chopped and nodded images. The resulting sky-subtracted images were then recentered and co-added. From these recentered and co-added images, we further removed the residual of the sky background not entirely removed in the first step by subtracting the average pixel values in the areas sufficiently far away from the objects.
For the flux calibration of the HR3126 data, we first computed
the flux of the calibrator Canopus with each filter, using its
ISO/SWS spectrum (Sloan et al. sloan03 (2003)) and the transmission
function of each filter121212Available at https://www.eso.org/sci/facilities/paranal/instruments/
visir/inst.html.
With the images of Canopus flux-calibrated with the resulting fluxes, we
measured the flux of HR3126 with each filter within an aperture radius of
15.
The uncertainty in the flux was estimated by computing the fluxes from
the data (both science and calibrator data) split into each nodding cycle.
The measured fluxes of HR3126 are listed in Table LABEL:res_visir_table.
Appendix C Image reconstruction from AMBER and GRAVITY data
The L-curves derived with the pixel difference quadratic and pixel intensity quadratic regularizations are shown in Fig. 10.
We show in Fig. 11 the images reconstructed with the pixel intensity quadratic regularization.
Figure 12 shows a comparison of the measured interferometric observables (visibility and closure phase) and those from the images reconstructed with the pixel difference quadratic regularization.
Appendix D Results of VLT single-dish observations
D.1 SPHERE-ZIMPOL visible polarimetric imaging
We derived the FWHMs of the azimuthally averaged radial intensity profiles of HR3126 and the PSF reference star HD 65273 to see if HR3126 is more extended than the PSF reference. As listed in Table LABEL:obs_sphere_log, the image of the PSF reference star is slightly broader than that of HR3126 owing to the slightly lower AO performance on the PSF reference star. This can be seen in the lower Strehl ratio of the PSF reference data compared to the HR3126 data. Therefore, HR3126 is unresolved at 0.55 m with the spatial resolution of 25 mas of our ZIMPOL observations (FWHM of the PSF reference star’s image). We found no significant polarimetric signals in the polarized intensity map and the polarization degree map either.
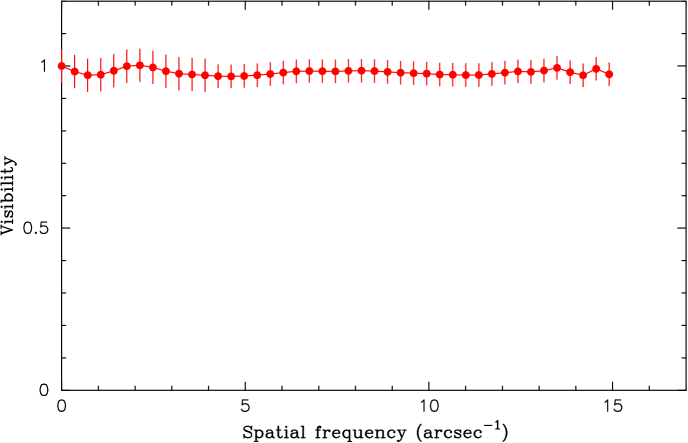
D.2 NACO 2.24 m speckle interferometry
Figure 13 shows the azimuthally averaged visibility of HR3126 extracted from our NACO speckle interferometric data taken at 2.24 m. The visibility is unity within the measurement errors up to the spatial frequency of 15 arcsec-1 that corresponds to the baseline of 7 m. The measured closure phase is also approximately zero within the covered spatial frequencies. Therefore, HR3126 is unresolved with our NACO speckle interferometric observations with the spatial resolution of 64 mas.
D.3 VISIR mid-infrared imaging
As in the analysis of the SPHERE-ZIMPOL data above, we obtained the FWHMs of the azimuthally averaged radial intensity profiles of HR3126 and the PSF reference Canopus. The results are listed in Table LABEL:res_visir_table. The FWHMs of HR3126 are nearly the same as those of Canopus, showing that HR3126 is unresolved from 7.9 to 19.5 m with spatial resolutions of 04–06. The FWHMs of Canopus with the J7.9 and SIV_1 filters are slightly larger than those of HR3126 due to variations in the atmospheric conditions.
Appendix E Comparison of the interferometric observables between the AMBER+GRAVITY data and the radiative transfer model of the dust disk.
Figure 14 shows a comparison of the measured interferometric observables (visibility and closure phase) and those predicted by the best-fit dust disk model.
Appendix F Log of observations with VLTI/AMBER+GRAVITY, VLT/NACO, SPHERE-ZIMPOL, and VISIR
Logs of our observations with VLTI/AMBER and GRAVITY, SPHERE-ZIMPOL, VLT/NACO, and VISIR are given in Tables. LABEL:obs_vlti_log, LABEL:obs_sphere_log, LABEL:obs_naco_log, and LABEL:obs_visir_log, respectively.
| # | Config. | PA | Seeing | ||||
| year/month/day UTC | (m) | (°) | (″) | (ms) | (sec) | ||
| AMBER | |||||||
| 1 | 2016/11/14 07:14:50 | A0-C1-D0 | 19.98/20.45/31.99 | 90/14/51 | 0.49 | 4.4 | |
| 2 | 2016/11/14 08:15:41 | A0-C1-D0 | 21.23/20.01/31.88 | 102/24/64 | 0.90 | 2.9 | |
| 3 | 2016/11/14 08:18:55 | A0-C1-D0 | 21.29/19.98/31.86 | 103/24/65 | 0.98 | 2.6 | |
| 4 | 2016/12/19 07:13:06 | A0-C1-D0 | 22.19/19.08/31.08 | 118/35/80 | 0.72 | 8.2 | |
| 5 | 2017/02/24 02:53:50 | A0-C1-D0 | 22.23/19.00/30.95 | 119/36/81 | 0.77 | 8.4 | |
| 6 | 2017/02/24 03:49:19 | A0-C1-D0 | 22.54/17.97/29.71 | 130/44/93 | 0.62 | 11.6 | |
| 7 | 2017/02/25 02:04:25 | A0-C1-D0 | 21.75/19.64/31.60 | 109/29/71 | 0.69 | 10.2 | |
| 8 | 2017/02/25 05:17:03 | A0-C1-D0 | 22.59/15.59/26.77 | 150/59/114 | 0.68 | 6.2 | |
| 9 | 2017/03/11 03:24:17 | A0-C1-D0 | 22.61/17.19/28.73 | 137/48/100 | 0.36 | 18.9 | |
| 10 | 2016/11/19 07:06:47 | D0-G2-J3 | 37.20/61.51/98.57 | 24/30/27 | 0.69 | 2.6 | |
| 11 | 2016/12/22 06:11:28 | D0-K0-J3 | 95.04/48.06/94.96 | 70//40 | 0.75 | 3.8 | |
| 12 | 2017/04/24 00:36:01 | D0-K0-J3 | 85.71/51.60/80.46 | 101//65 | 0.75 | 3.1 | |
| 13 | 2017/04/24 23:44:45 | D0-G2-J3 | 32.65/53.85/86.29 | 52/61/57 | 0.46 | 5.8 | |
| 14 | 2017/04/25 00:46:51 | D0-G2-J3 | 29.73/48.92/78.40 | 62/71/68 | 0.51 | 5.6 | |
| 15 | 2017/03/07 03:53:43 | A0-G1-J3 | 90.50/102.8/103.3 | 140/24/76 | 0.60 | 8.3 | |
| 16 | 2017/03/15 00:52:27 | A0-J2-J3 | 129.0/87.11/122.9 | 89//49 | 0.60 | 8.9 | |
| 17 | 2017/03/15 01:49:58 | A0-J2-J3 | 128.9/89.59/117.2 | 102//59 | 0.48 | 12.3 | |
| 18 | 2017/03/15 02:56:02 | A0-J2-J3 | 126.4/91.15/107.8 | 116//71 | 0.45 | 9.5 | |
| 19 | 2017/03/15 03:51:00 | A0-J2-J3 | 122.9/91.48/97.89 | 129/1/82 | 0.55 | 6.1 | |
| GRAVITY | |||||||
| 20 | 2018/12/19 07:19:10 | A0-G1-J2-J3 | 89.30/108.25/117.82/ | 162/// | 0.78 | 5.0 | |
| 53.48/128.99/89.08 | // | ||||||
| 21 | 2018/12/19 08:01:22 | A0-G1-J2-J3 | 90.53/106.37/112.36/ | 169/// | 0.49 | 7.0 | |
| 51.21/127.80/90.05 | // | ||||||
| # | Object | Seeing | Strehl () | Strehl () | FWHM () | |||
| (UTC) | (″) | (ms) | (sec) | (mas) | ||||
| 2016 March 15 (UTC) | ||||||||
| 1 | HR3126 | 00:58:50 | 0.89 | 3.9 | 0.90 | 0.39 | 22.6 | |
| 2 | HD65273 | 01:42:17 | 0.75 | 3.9 | 0.88 | 0.31 | 25.1 | |
| # | Object | Seeing | |||
| (UTC) | (″) | (ms) | (ms) | ||
| 2017 April 10 (UTC) | |||||
| 1 | HR3126 | 23:48:16 | 1.09 | 5.8 | |
| 2 | HR3126 | 23:57:38 | 1.15 | 5.6 | |
| 2017 April 11 (UTC) | |||||
| 3 | HR3126 | 00:15:26 | 0.81 | 6.2 | |
| 4 | HR3126 | 00:29:17 | 0.76 | 6.6 | |
| 5 | HR3126 | 00:48:32 | 0.67 | 7.1 | |
| 6 | Vol | 00:57:02 | 0.66 | 6.9 | |
| 7 | HR3126 | 01:03:36 | 0.70 | 6.1 | |
| 8 | Vol | 01:10:38 | 0.66 | 6.9 | |
| 9 | HR3126 | 01:17:01 | 0.79 | 5.4 | |
| 10 | Vol | 01:23:58 | 1.20 | 3.5 | |
| # | Object | Filter | Seeing | PWV | |||
| (UTC) | (″) | (mm) | (sec) | ||||
| 2015 November 1 (UTC) | |||||||
| 1 | Canopus | 07:15:07 | Q1 | 1.1 | 1.6 | 575.189 | 5 |
| 2 | Canopus | 07:28:27 | Q3 | 1.1 | 1.7 | 618.839 | 5 |
| 3 | HR3126 | 07:49:09 | Q1 | 1.3 | 1.7 | 575.189 | 5 |
| 4 | HR3126 | 08:01:57 | Q3 | 1.4 | 1.7 | 618.839 | 5 |
| 5 | Canopus | 08:22:53 | J7.9 | 1.3 | 1.8 | 502.750 | 2 |
| 6 | Canopus | 08:32:39 | SIV_1 | 1.1 | 1.8 | 472.894 | 2 |
| 7 | HR3126 | 08:49:23 | J7.9 | 1.2 | 1.8 | 509.134 | 2 |
| 8 | HR3126 | 08:59:55 | SIV_1 | 1.2 | 1.8 | 472.894 | 2 |
| 2015 November 2 (UTC) | |||||||
| 9 | Canopus | 06:15:15 | NeII | 1.1 | 2.8 | 480.016 | 2 |
| 10 | HR3126 | 06:29:24 | NeII | 1.2 | 2.9 | 480.016 | 2 |