Distances to PHANGS Galaxies: New Tip of the Red Giant Branch Measurements and Adopted Distances
Abstract
PHANGS-HST is an ultraviolet-optical imaging survey of 38 spiral galaxies within 20 Mpc. Combined with the PHANGS-ALMA, PHANGS-MUSE surveys and other multiwavelength data, the dataset will provide an unprecedented look into the connections between young stars, H ii regions, and cold molecular gas in these nearby star-forming galaxies. Accurate distances are needed to transform measured observables into physical parameters (e.g., brightness to luminosity, angular to physical sizes of molecular clouds, star clusters and associations). PHANGS-HST has obtained parallel ACS imaging of the galaxy halos in the F606W and F814W bands. Where possible, we use these parallel fields to derive tip of the red giant branch (TRGB) distances to these galaxies. In this paper, we present TRGB distances for 11 galaxies from 4 to 15 Mpc, based on the first year of PHANGS-HST observations. Five of these represent the first published TRGB distance measurements (IC 5332, NGC 2835, NGC 4298, NGC 4321, and NGC 4328), and eight of which are the best available distances to these targets. We also provide a compilation of distances for the 118 galaxies in the full PHANGS sample, which have been adopted for the first PHANGS-ALMA public data release.
keywords:
galaxies: fundamental parameters – galaxies: stellar content – distance scale1 Introduction
The observed velocity of a galaxy consists of two components. The first is its recessional velocity due to the expansion of the universe, i.e., the Hubble flow. This portion of the observed velocity is simply given by the Hubble constant times its distance (). The second component of the observed velocity is due to gravitational interactions with other objects, which is referred to as a galaxy’s peculiar velocity (). Taken together, the observed velocity of a galaxy is given by
| (1) |
In the nearby universe (i.e., within a few tens of Mpc), the peculiar velocity can be a substantial component of the observed velocity. This means distances based solely on the recessional velocity are subject to large systematic errors. This issue necessitates the use of redshift-independent distances, such as those based on standard candles and rulers, for study of galaxies in the nearby Universe.
In this paper, we present a curated set of redshift-independent distances for galaxies in the PHANGS111www.phangs.org (Physics at High Angular Resolution in Nearby Galaxies) sample (A. K. Leroy et al, in preparation). The distances presented in this paper are a combination of new tip of the red giant branch (TRGB) measurements based on Hubble Space Telescope (HST) imaging obtained by the PHANGS-HST survey (J.C. Lee et al., in preparation) in its first year of observations (which began in 2019 April) and best available distances compiled from the literature.
The goal of the PHANGS programme is to elucidate the physics that control the multi-scale process of star formation in galaxies. The effort is built around PHANGS-ALMA (P.I. E. Schinnerer; A. K. Leroy et al. in preparation), an ALMA survey of =74 galaxies that includes all southern ( < Dec < ), face-on, massive, star-forming galaxies at distances (< 20 Mpc) where ALMA can resolve the molecular interstellar medium into individual molecular clouds (50–150 pc). This sample was observed via a Cycle 5 Large Programme (PI: E Schinnerer), and several smaller programs in Cycles 2-6. Extensions of the programme to additional galaxies that expand the covered parameter space are ongoing, and bring the current sample observed by ALMA to 89. In addition, the broader PHANGS collaboration has studied a number of other nearby targets, including some northern (beyond the reach of ALMA) and edge-on targets. In total, PHANGS currently includes 118 targets of interest, and it is for this greater sample of galaxies that we provide “best-available” distances adopted for PHANGS analysis in this paper.
Distances to the PHANGS galaxies are essential to the main science goals of the PHANGS collaboration. Nearly every derived parameter depends on the adopted distance, and robust distances are required for the basic transformation of angular size and brightness into physical sizes and absolute luminosities. Inaccurate distances will bias other quantities of interest, including star cluster and molecular cloud mass functions, luminosity functions, and dynamical mass-to-light ratios. Distances are also needed as inputs for producing ALMA products at specified physical (e.g., 60 pc, 150 pc) resolutions, which are vital for consistent galaxy-to-galaxy comparisons.
In this paper, we use parallel imaging from PHANGS-HST to derive TRGB estimates to 11 galaxies, and also provide a careful literature compilation of best distances for the full PHANGS sample of interest (N=118). Prior to this work, accurate distances, based on standard candles, were available for 45% of the full PHANGS sample of 118 galaxies. To this we add the first TRGB distance measurements for 5 galaxies, and additional TRGB measurements for 6 galaxies based on our HST parallel observations. Eight of these new TRGB measurements represent the best available distances for these targets. In Section 2 we describe the parallel PHANGS-HST observations used in this work. In Section 3, we describe the TRGB methodology for measuring distances from our parallel imaging, and then present our results. We present our selection of literature distances in Section 4, and end with a brief summary and future outlook in Section 5.
2 PHANGS-HST Observations
A subset of the overall PHANGS sample best suited for joint HST-ALMA studies of resolved young stellar populations and clouds (=38) were targeted by the Cycle 26 PHANGS-HST Treasury Programme (PI: J.C. Lee, programme GO-15654). The PHANGS-HST sample was selected to be
-
•
Relatively face-on (), to minimise source blending and projected dust attenuation.
-
•
Avoid the Galactic plane (), to minimise the effects of Milky Way reddening and foreground stars.
-
•
Have sufficient star formation activity(star formation rates ) to ensure widespread CO detections for joint analysis of clusters/associations and clouds.
-
•
Nearby ( 17 Mpc) to ensure high levels of spatial resolution (though in this paper we find several of the PHANGS-HST targets to likely lie beyond this initial criterion).
The combination of ALMA observations with those from HST and MUSE (E. Emsellem et al., in preparation) allows PHANGS to chart, for the first time, the connections between cold (molecular) gas and young stars on the fundamental scales of molecular clouds, young star clusters, and H ii regions, over a broad range of galactic environments in the nearby Universe (Sun et al., 2018; Utomo et al., 2018; Schinnerer et al., 2019; Kreckel et al., 2019; Chevance et al., 2020).
The primary goal of the PHANGS-HST observations (to be fully described in J.C. Lee, in preparation) was to obtain UV-optical imaging of the resolved stellar populations within the star-forming disk. However, the observations also provide an incidental opportunity to observe the galaxy halo with the Advanced Camera for Surveys Wide Field Channel (ACS/WFC) in “parallel" mode. Our observations were designed so that ACS imaging in the F606W (a “wide" -band) and F814W (approximately -band) filters accompanies each corresponding PHANGS-HST “primary" observation with the Wide Field Camera 3 Ultraviolet/Visible (WFC3/UVIS) channel.
For the range of distances and angular sizes of the spiral galaxies in the PHANGS-HST sample, the ACS field-of-view generally falls on the halo of the target galaxy when WFC3 is centered on the galaxy itself, though there is a range of potential outcomes. For galaxies with relatively large angular sizes, the parallel observations may include portions of the outer disk. For galaxies with much smaller sizes, the parallels may lie too far to detect any sizeable halo population, which limits the usefulness of the field for TRGB analysis. Given that the science requirements of PHANGS-HST constrain the placement of the primary pointings, optimizing placement of the parallel fields, as would be pursued by a focused TRGB programme, is secondary, and is limited by the fixed focal plane and spatial offset of the two cameras of HST.
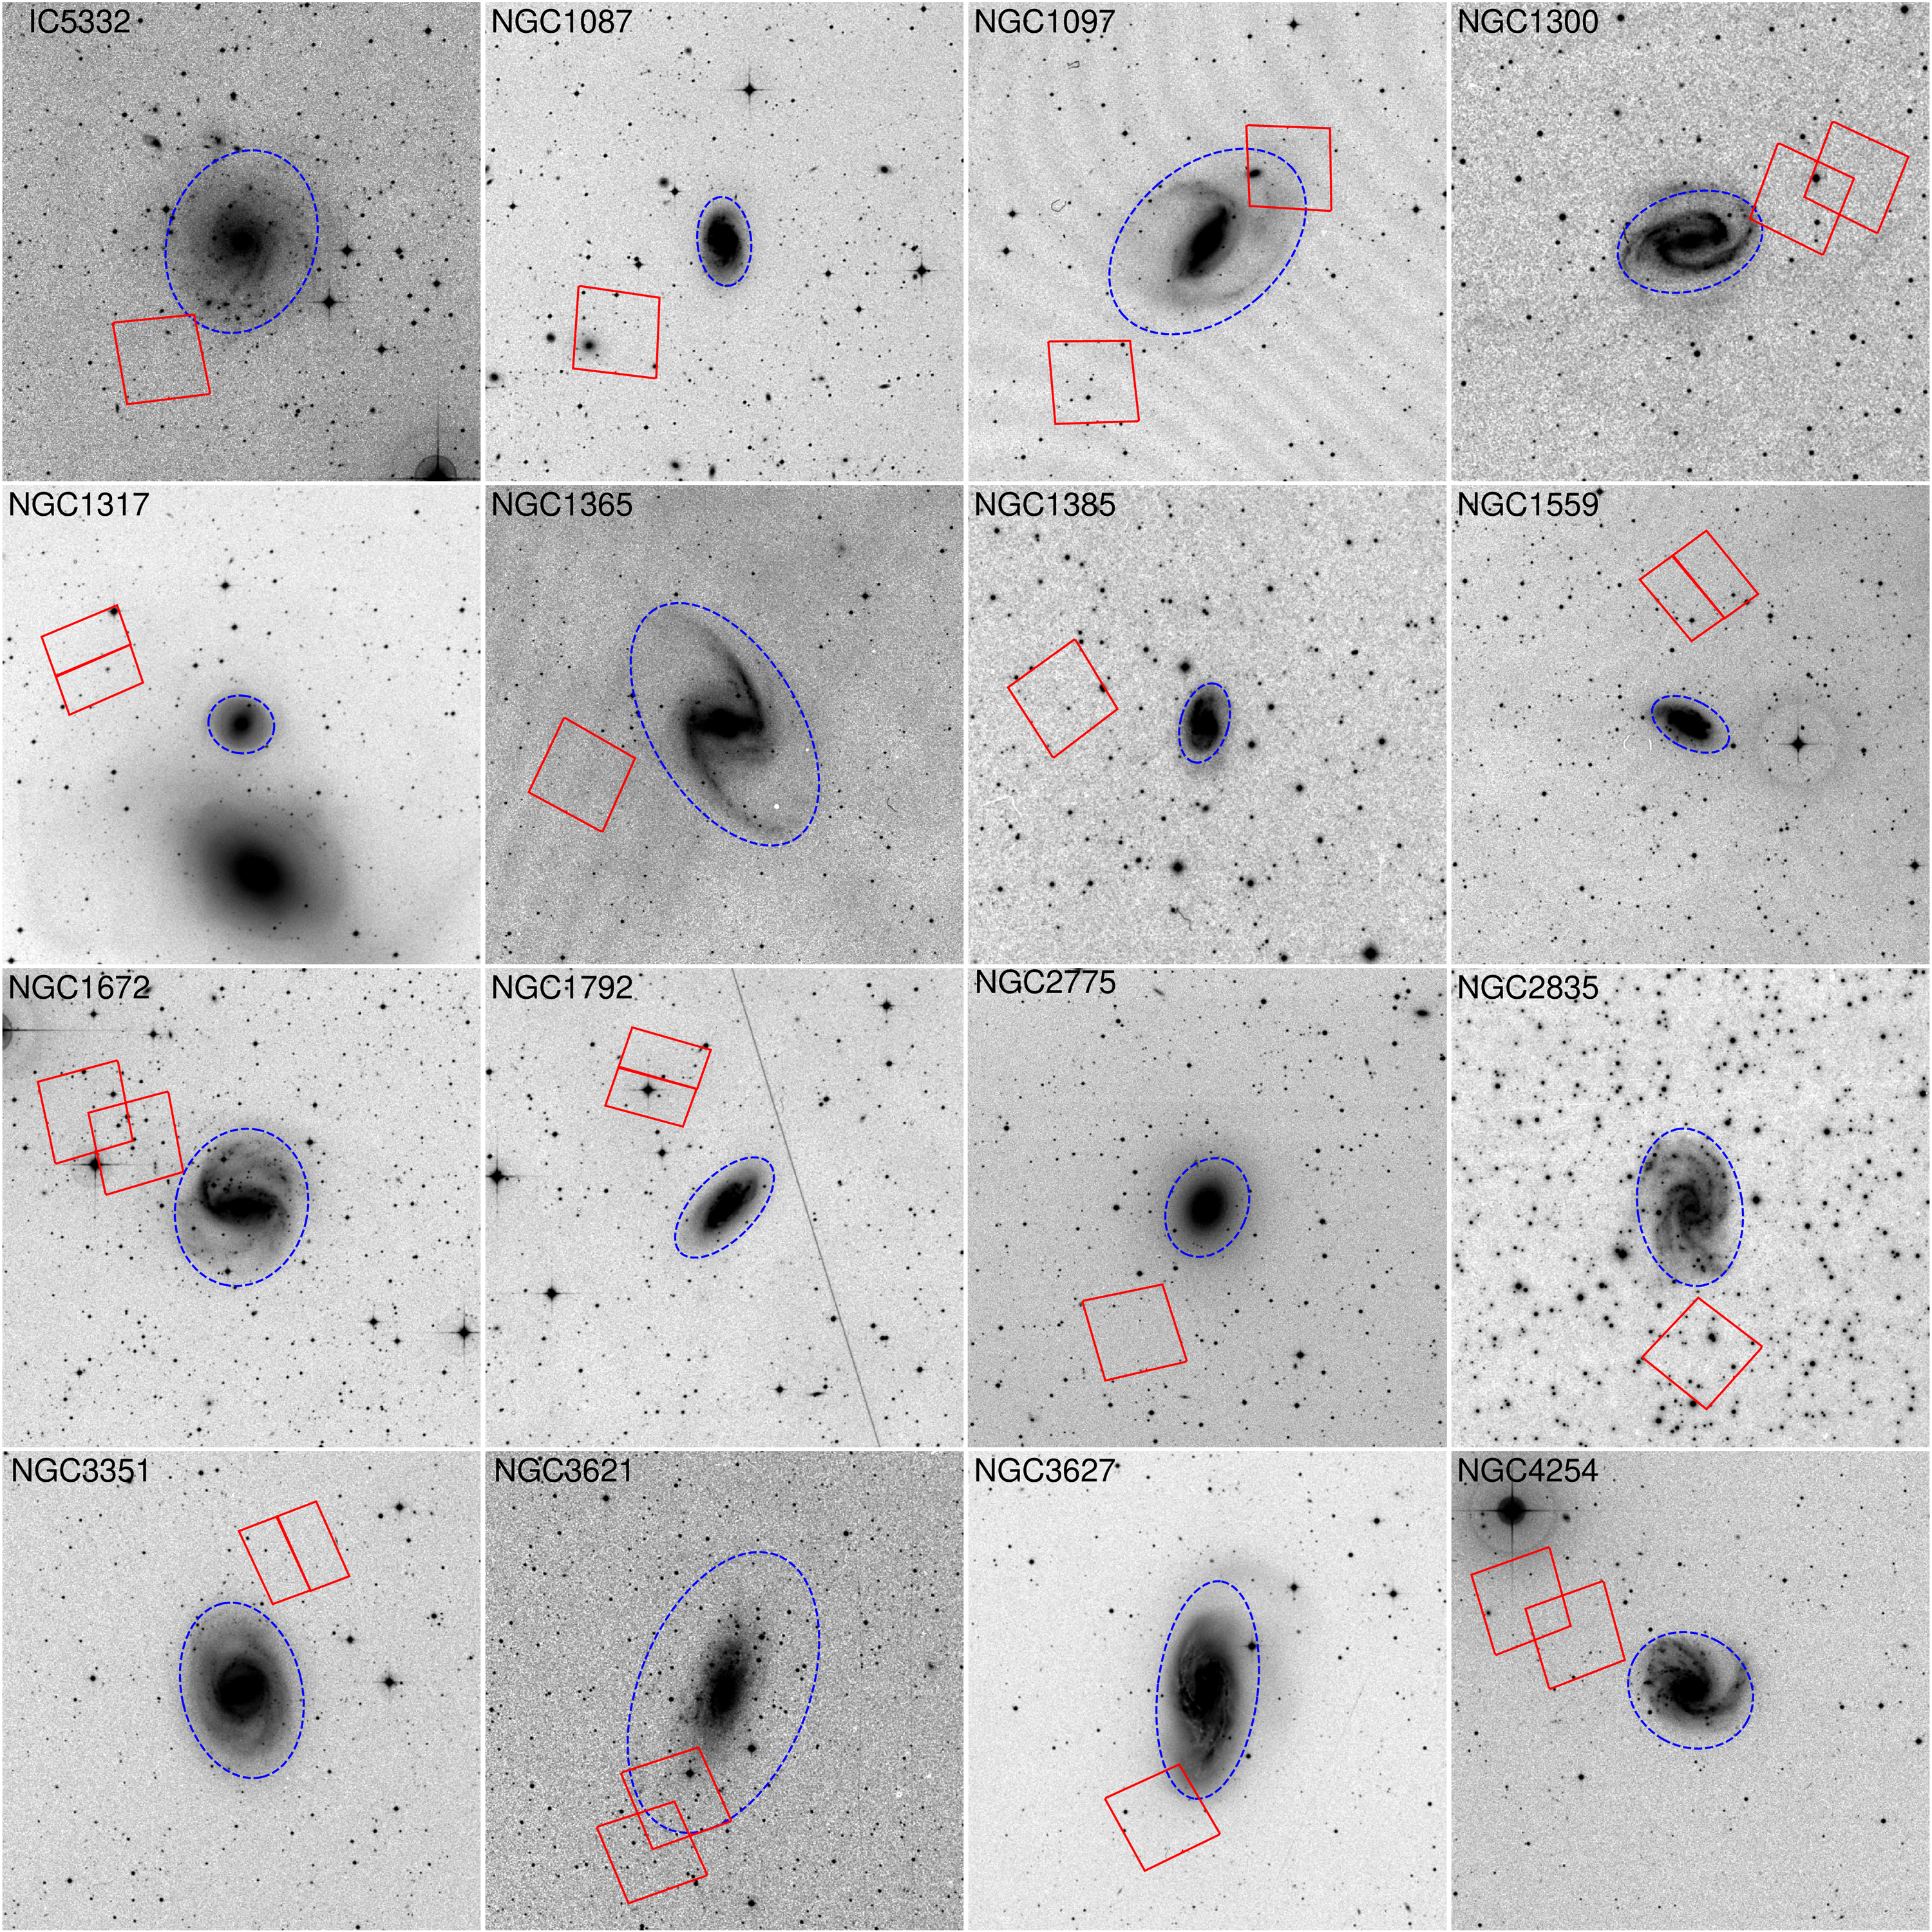
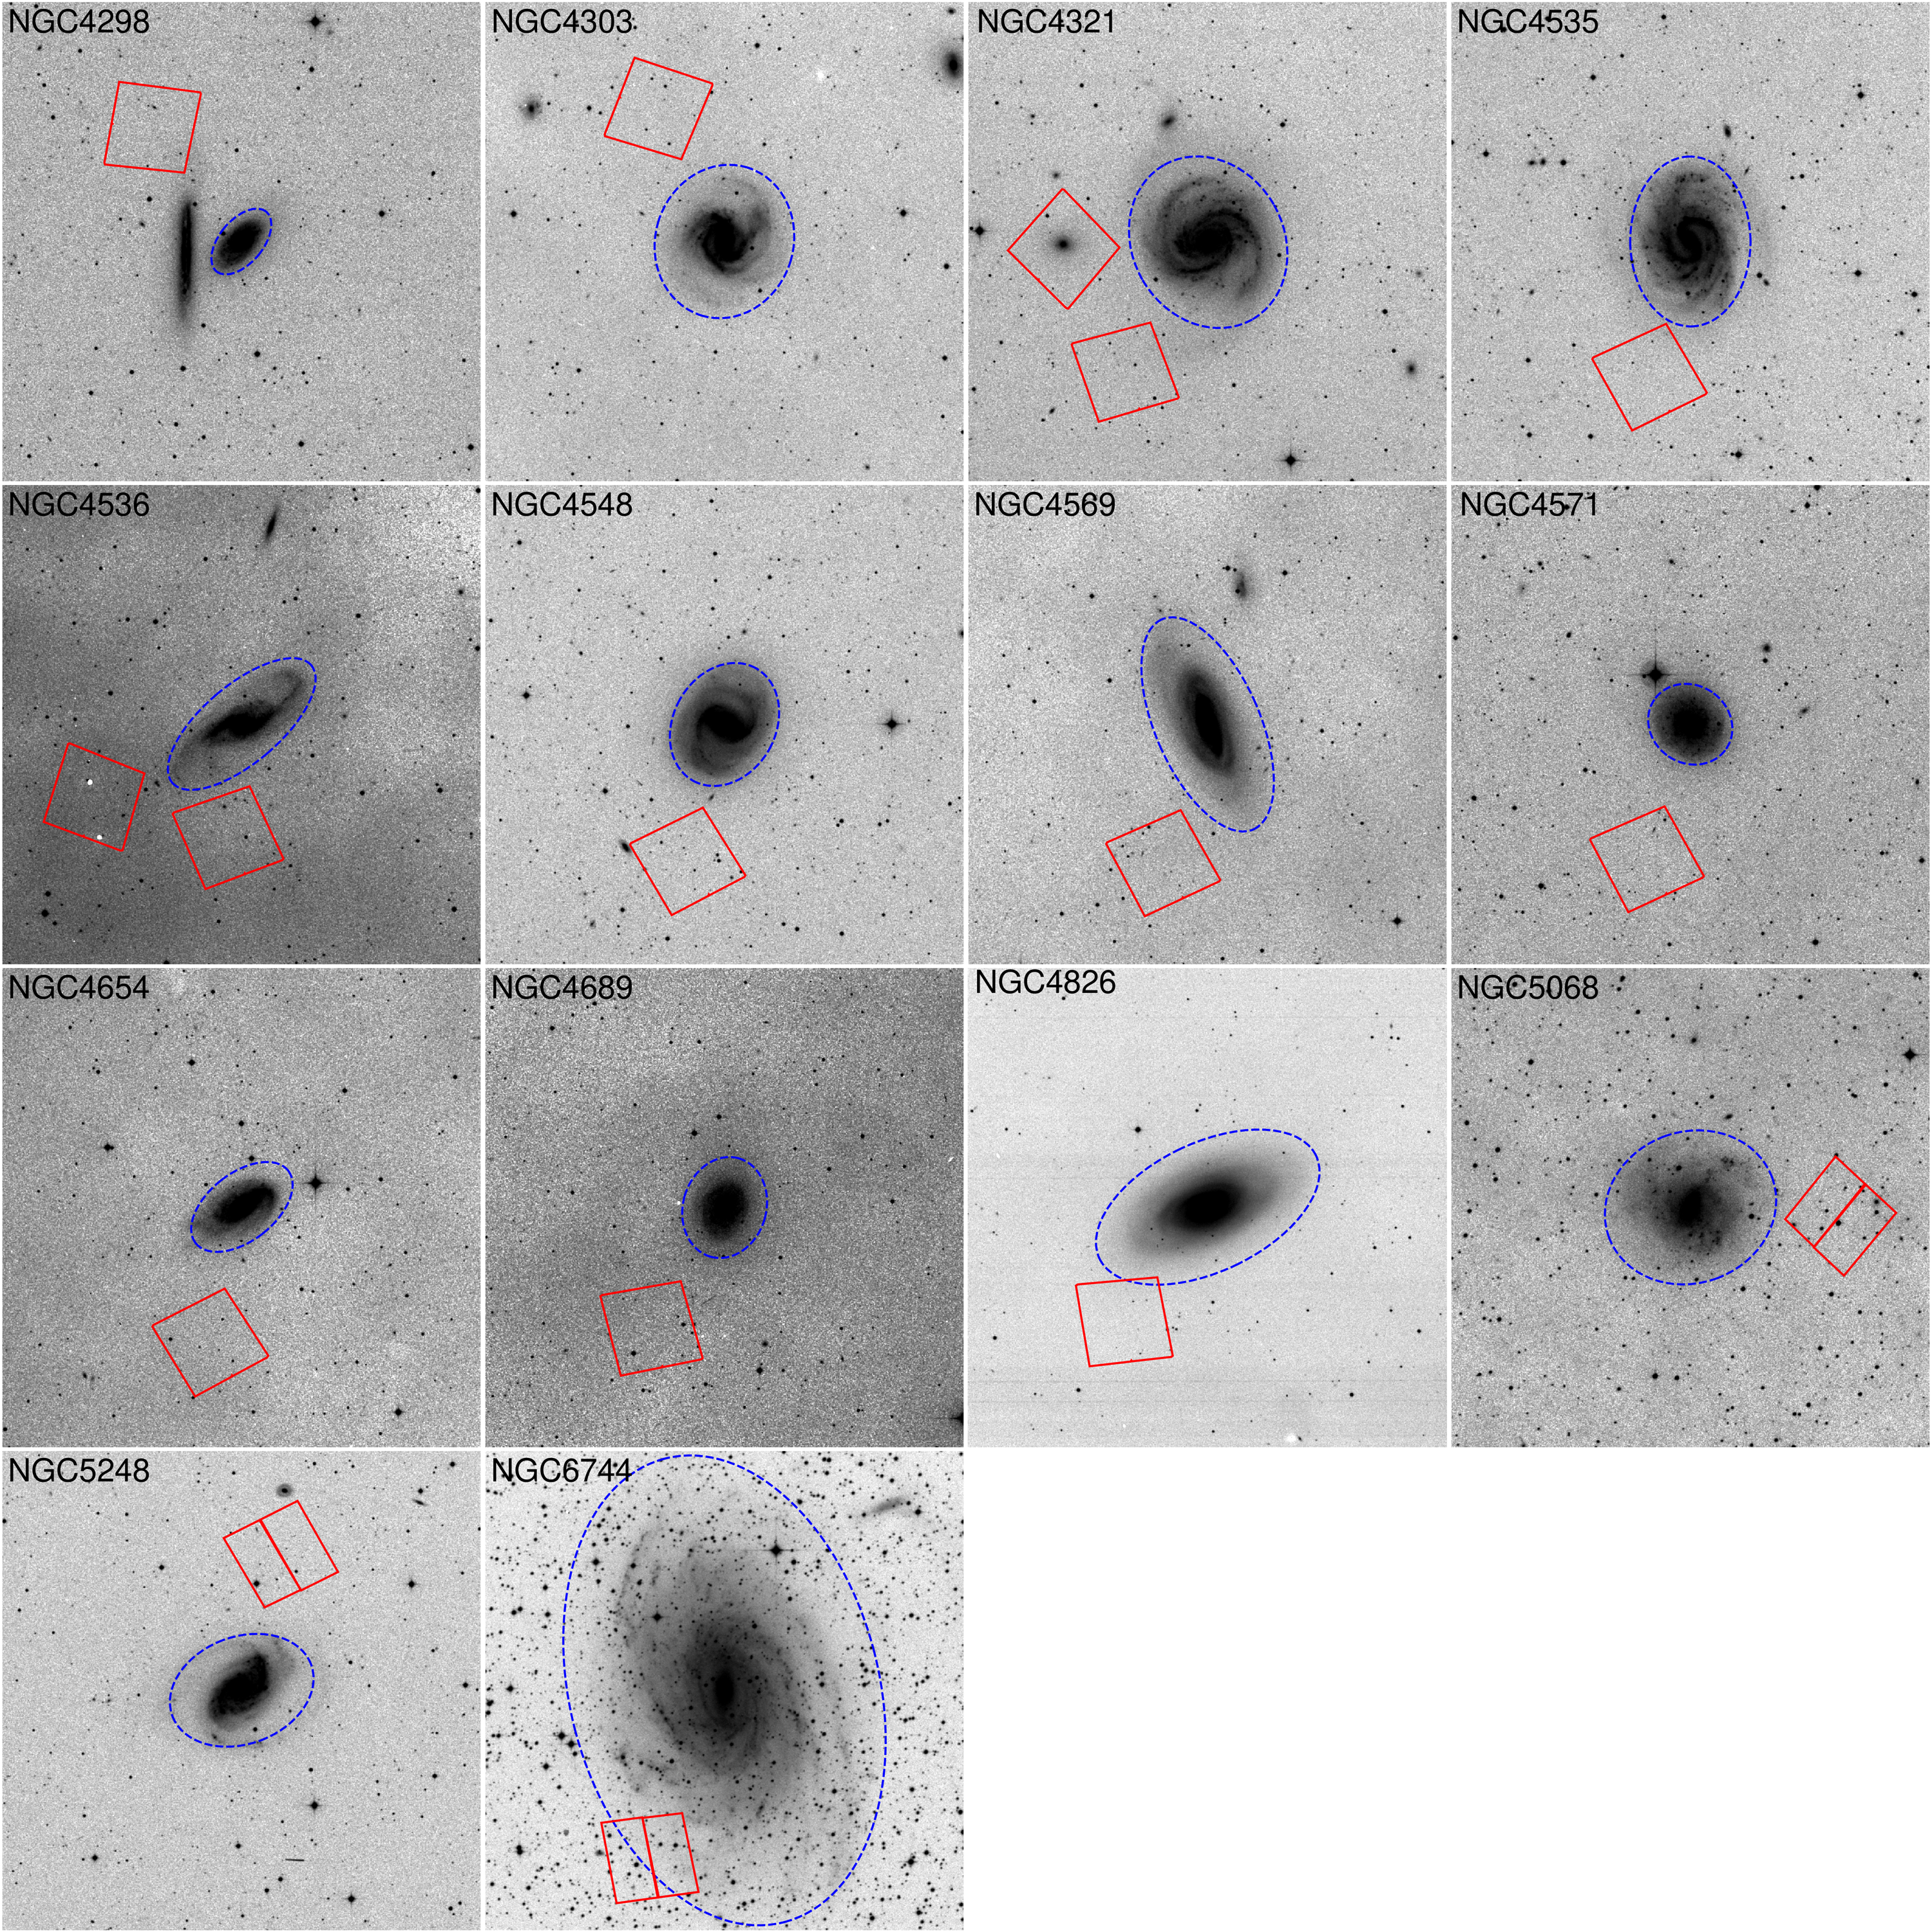
Figures 8 and 9 illustrate the positioning of the ACS field-of-view on each galaxy. Orientation (ORIENT) constraints were imposed, when possible, to prevent the parallel observation from sampling the galaxy disk, nearby galaxy neighbours, and/or extremely bright foreground stars. For some targets with large angular sizes for which it would be impossible to entirely avoid a large disk, we placed the parallels along the major axis to aid in disentangling the disk and halo. In several cases, such orient constraints needed to be lifted or considerably relaxed to enable enough guide stars to be acquired with the Fine Guidance Sensors.
The 5-band primary observations with WFC3/UVIS were sequenced in each orbit to optimize exposure time in the parallel observations without impacting the primary observations. Each pointing of the telescope spanned 2 or 3 orbits, depending on whether archival observations of the inner galaxy (targeted by ALMA) were available from prior HST programmes which matched the PHANGS-HST science requirements. For pointings spanning a two-orbit duration, the total exposure times in the ACS parallel V and I images are about 2100 s each, whilst for the three-orbit pointings they are about 3500 s and 3200 s, respectively. Exposure times for each pointing are provided in Table 1.
PHANGS-HST observations began in 2019 April and are expected to continue until 2021 May. The analyses presented in this paper are based on the first year of observations through 2020 July, and include 37 pointings in 30 galaxies. We will present the TRGB analysis based on parallel observations of the remaining 7 pointings (in six galaxies) in a future paper. All of these remaining pointings are observations which have been executed but failed, due to guide star acquisition issues, and are scheduled to be re-observed.
3 Tip of the Red Giant Branch Measurements
Low-mass stars (2 ascending the red giant branch (RGB) eventually reach a state when helium begins to fuse in the degenerate core via the triple- process. At the end of this runaway process, the star rearranges itself, becomes less luminous, and appears on the horizontal branch. The maximum degenerate core mass is a constant, resulting in stars at the TRGB sharing the same maximum luminosity, modulo a colour-dependent term. This colour-dependence is largely the result of the effects of line-blanketing (dependent on metallicity), and to a lesser extent, age. In the best case scenarios, distances can be measured with the TRGB to accuracies of 5.
The standardizable candle nature of the TRGB has made it a powerful tool for determining extragalactic distances (Lee et al., 1993; Madore & Freedman, 1995; Beaton et al., 2018), and its popularity in the literature has been steadily increasing (Tollerud et al., 2016; McQuinn et al., 2017; Karachentsev et al., 2018; Anand et al., 2018b; Danieli et al., 2020). At present, the CMDs/TRGB catalog on the Extragalactic Distance Database222edd.ifa.hawaii.edu (EDD) hosts colour-magnitude diagrams and TRGB distances to nearly 500 galaxies (Jacobs et al., 2009).
3.1 Methodology
There are two main techniques used in the literature to determine the location of the TRGB in a colour-magnitude diagram (CMD). Both involve constructing a luminosity function for stars above and below the TRGB, namely asymptotic giant branch (AGB) and RGB stars, respectively. The first popular method (Sakai et al., 2000; Crnojević et al., 2014; Müller et al., 2018; Van Dyk et al., 2019) uses an edge detection algorithm (often a Sobel filter) to highlight the point of greatest discontinuity, which corresponds to the sharp change in the luminosity function occurring at the TRGB. The luminosity function may first be smoothed to suppress false edges arising from noise (Beaton et al., 2019).
The second method commonly found in the literature involves fitting the luminosity function of the RGB and AGB population, typically with a broken-power law (Méndez et al., 2002; Makarov et al., 2006; McQuinn et al., 2016). This method allows for the straightforward incorporation of results from artificial star experiments to account for photometric errors, incompleteness, and bias. Due to this benefit, we use this latter technique for our analysis, with the specific methodology described in detail by Makarov et al. (2006), and with updates provided by Wu et al. (2014). This overall procedure is the same as the one previously described in Jacobs et al. (2009). In the rest of this subsection, we briefly summarise our methodology.
We obtain the individual charge transfer efficiency (CTE)-corrected *.flc frames from the Mikulski Archive for Space Telescopes333https://mast.stsci.edu/. We perform PSF photometry on these individual exposures with DOLPHOT (Dolphin, 2000, 2016), which uses Tiny Tim PSFs (Krist, 1993) and includes aperture corrections based on measurements of bright, isolated stars in each frame. We use the drizzled F814W (*.drc) image as the reference frame for the alignment of the individual (*.flc ) images. In some instances the relative astrometry between individual frames is not good enough for DOLPHOT to obtain successful alignments between all the frames. For these cases, we first run the images through STScI’s tweakreg package until a satisfactory alignment (typical root-mean-square, rms, uncertainty of ) is reached. Note that we do not pay attention to absolute astrometry, but only relative astrometry.
DOLPHOT outputs photometry for each individual exposure, as well as a set of photometry for the combination of individual *.flc exposures. For our work, we use this combined photometry after applying a series of quality cuts for parameters including signal-to-noise ratio (SNR), crowding, and sharpness. For this paper, we use quality cuts adopted from McQuinn et al. (2017), except we increase the baseline total SNR cutoff in F606W from 2 to 5. For a few of our more distant targets (e.g., NGC 4321), we lower the SNR cutoff in F606W from 5 back to 2, and the F814W cutoff from 5 to 4, in order to increase the depth of the CMD below the TRGB. The specific crowding cuts adopted select for stars with , and for sharpness with .
We also use DOLPHOT to perform artificial star experiments for each of the target fields. For each field, we insert and attempt to recover 100,000 artificial stars spanning the full range of magnitudes and colours seen in the measured photometry. These results allow us to quantify the true levels of error, completeness, and photometric bias present in the observed photometry. This is especially important, as it has been shown that DOLPHOT systematically underestimates its reported errors (Williams et al., 2014).
We proceed to fit a broken-power law to the luminosity function of the AGB and RGB populations, with the break denoting the location of the TRGB. The physical basis for this parameterization is the abrupt change in the observed luminosity function brought upon by stars undergoing the helium flash once they reach the TRGB. The results of the artificial stars are incorporated here by convolving the luminosity function with the completeness, error, and bias, as described in detail by Makarov et al. (2006) and Wu et al. (2014). For some galaxies, we use the blue upper-main sequence stars as a proxy for all young stars to remove parts of the field before we perform our analysis. This is to reduce contamination from regions with large amounts of Population I stars, including red supergiants whose sharp feature lies on the blue edge of the RGB (see the galaxies presented in Anand et al. (2019a, b) for detailed examples). To further reduce contaminant stars in our sample, we limit the F606WF814W of stars used in our fits– these ranges are shown in Figures 1–4 as the break between the red horizontal lines.
With the observed quantities in hand, we turn to the calibration for the TRGB obtained by Rizzi et al. (2007). In addition to a zero-point TRGB calibration (anchored to a geometric calibration of the horizontal branch provided by Carretta et al. (2000)), they provide a colour calibration for both WFPC2 and ACS flight filter systems for HST. Combined together and in our choice of filters, these take the form of:
| (2) |
We calculate the (F606W-F814W) term by taking the median color of stars within 0.05 mag below the measured TRGB, with the associated uncertainty determined via 1000 bootstrap resampling trials (as laid out in Wu et al. 2014). Before applying this calibration, the observed magnitude and colour of the TRGB are corrected for foreground extinction (Schlafly & Finkbeiner, 2011). We do not account for any potential reddening intrinsic to the halos of these galaxies, though we note that previous studies (Ménard et al., 2010) have shown this effect to be quite small (0.01 mag, Yuan et al. 2019). Data taken in additional filters (e.g. near-infrared passbands with WFC3) could be used to determine the exact reddening to the TRGB stars themselves, as recently outlined by Madore & Freedman (2020).
The effects of line blanketing are minimised in the F814W filter for RGB stars, hence its use here and elsewhere in the literature. Over typical F606WF814W colours seen in galaxy halos, the absolute magnitude of the TRGB varies by 0.1 mag. In bluer or redder bands, the effects can change the absolute magnitude by over one magnitude, increasing the dependence on the quality of the underlying calibration, and heightening the potential of systematic errors. The final errors on our reported distances combine in quadrature the statistical uncertainties in the measured quantities (including the dust maps, Schlafly & Finkbeiner 2011) with an adopted 0.07 mag systematic uncertainty (Rizzi et al., 2007; McQuinn et al., 2017) in the underlying absolute calibration. We note that there are several other calibrations available for the absolute magnitude of the TRGB (Jang & Lee, 2017; Freedman et al., 2019; Yuan et al., 2019; Jang et al., 2020), which differ from our adopted calibration (and from each other) at the 0-5 level (depending on the underlying metallicity and age of the RGB). At present, the source of the disagreement is under debate. We adopt the Rizzi et al. (2007) calibration to retain consistency with the Extragalactic Distance Database, and reserve further discussion for future planned work on the matter.
The underlying photometry and complete list of derived parameters for the galaxies presented here are publicly available under the CMDs/TRGB catalog of EDD (Jacobs et al., 2009). This procedure has been developed and matured with many years of work, and TRGB distances from the CMDs/TRGB catalog have served as key components for many results including the definition of our home supercluster Laniakea (Tully et al., 2014), the realization of the effects of the neighbouring Local Void on the motions of nearby galaxies (Tully et al., 2008; Rizzi et al., 2017; Anand et al., 2019b), and the determination of the extragalactic distance scale and the Hubble constant from the larger Cosmicflows programme (Tully et al., 2013, 2016; Kourkchi et al., 2020b).
3.2 Range of Distances
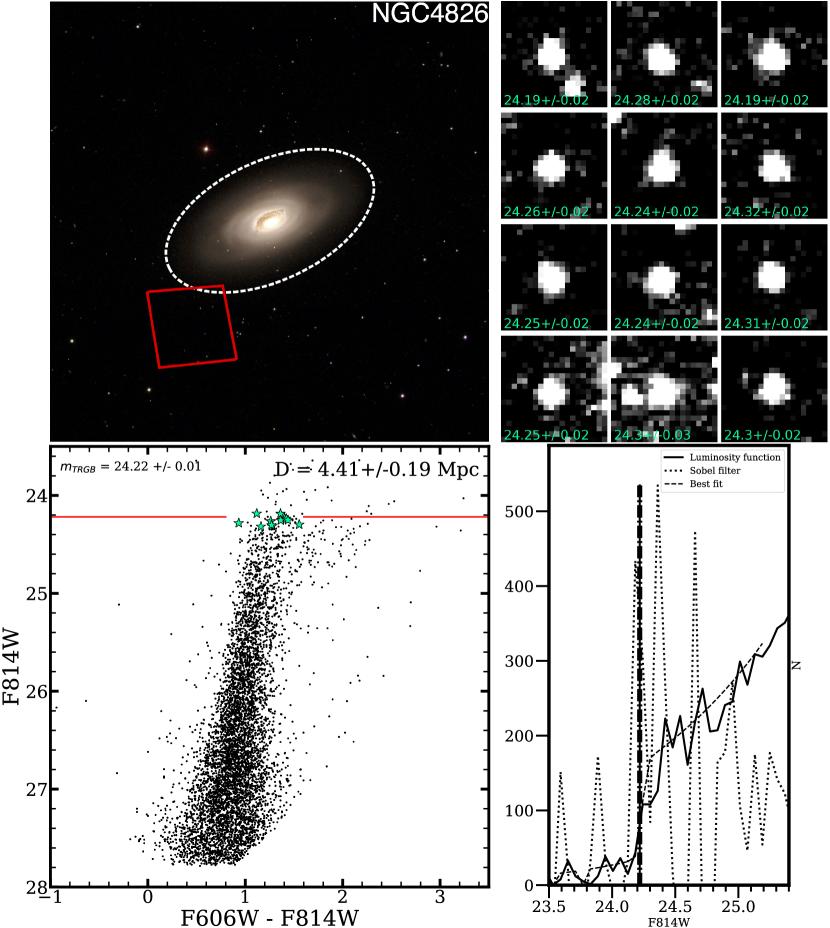
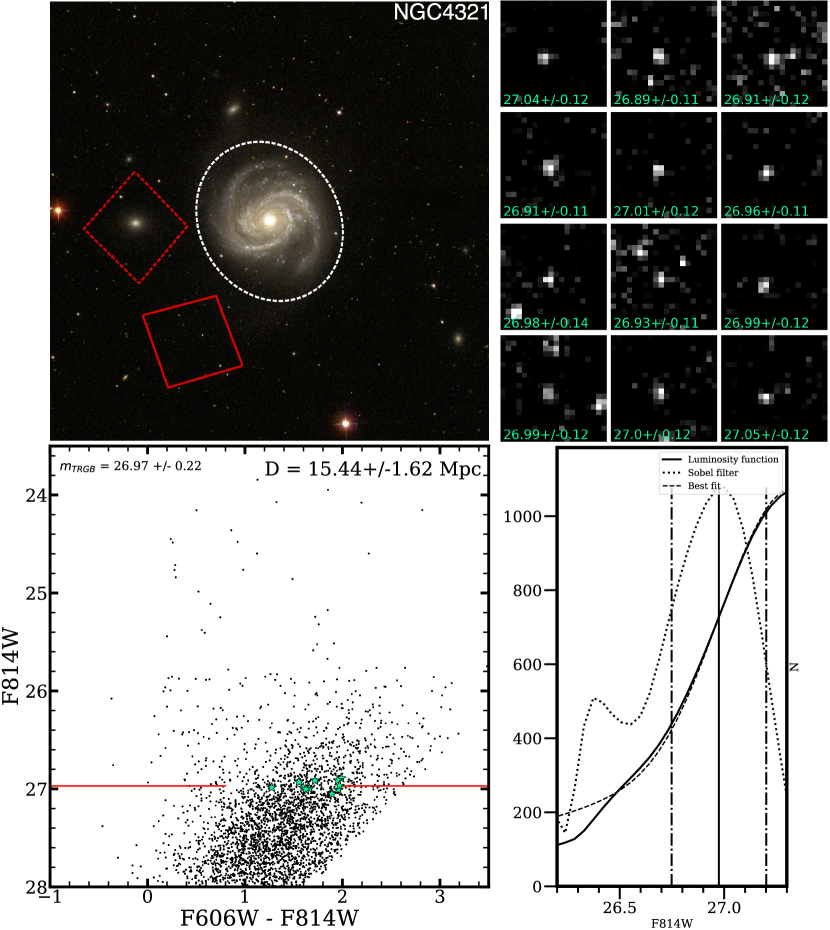
In Figures 1 and 2, we highlight the data for the closest (NGC 4826, =4.4 Mpc) and furthest (NGC 4321, =15.4 Mpc) PHANGS-HST targets for which we are successfully able to derive TRGB distances. In the top-left panels of these two figures, we show our HST parallel imaging (red) overlaid on gri footprints from the Sloan Digital Sky Survey (SDSS, York et al. 2000), with from RC3 (de Vaucouleurs et al., 1991) shown in dashed blue. Our main purpose in showing these figures is to draw attention to the quality of the data at these two extremes. At the near end, the stars are bright, well-resolved, and unambiguous. At the far end, we are approaching the limits of what can be achieved given the depth of the data, and the uncertainties involved become large.
In the top-right panels, we show F814W cutouts of a selection of a dozen stars within 0.1 mag of the measured TRGB, along with their DOLPHOT measured F814W magnitudes and errors. We note that as shown by previous studies (Williams et al., 2014), the error measurements from DOLPHOT are systematically underestimated. We emphasize that this does not affect our results. As previously discussed, the photometric errors that propagate into our final results are determined by the injection and recovery of artificial stars, which give proper estimates for photometric error.
The stars shown in the top-right panels are highlighted in green on the CMDs, along with the measured TRGB in the bottom-left panels. In the bottom-right panels, we show the observed luminosity function of stars, along with our best-fit from which we determine (with uncertainties indicated by the dotted-dashed lines). For purposes of comparison, we also provide the results of a Sobel filter (with a kernel of [2, 0, 2]) on the same observed luminosity function. For the case of NGC 4826, the Sobel filter measurement is rather noisy (i.e., several peaks) due to the sparseness of the upper RGB, whereas our luminosity function fit is clean. For NGC 4321, both methods measure the same value of to within 0.02 mag.
3.3 Measurements
We now present the results of our TRGB analysis. Six of the galaxies for which we measure results already have existing TRGB distances in the literature. However, given the multi-orbit depth of the PHANGS parallel data, in four of these cases our measurements are improvements upon the existing work. In all of these cases, our new measurements agree very well with the existing literature measurements (typically within 2). We also present the first TRGB measurements for five galaxies, four of which represent the most precise distances to these galaxies to date.
3.3.1 Galaxies with Existing TRGB Measurements
-
•
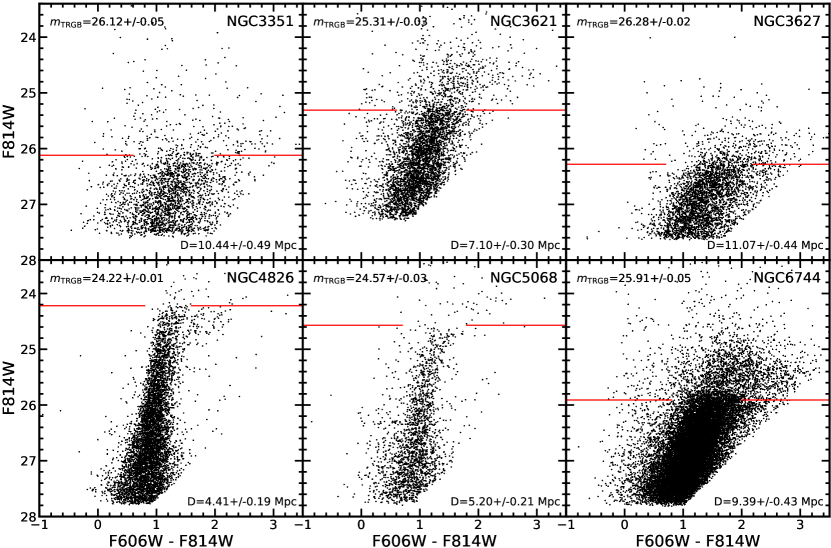
NGC 3351 (M95) is a member of the Leo I group of galaxies, which includes the brighter NGC 3368 (M96) and NGC 3379 (M105). The CMDs/TRGB catalog’s present TRGB measurement of = 9.96 0.33 Mpc for NGC 3351 was obtained from older, HST Wide Field and Planetary Camera 2 (WFPC2) observations of the galaxy’s outer disk (GO-8584, PI: R. Kennicutt). The new PHANGS-HST parallel data, whilst less contaminated with Pop I stars, has a sparser upper RGB—we measure = 26.12 0.05 mag. The relative sparseness may inflate the measured distance to the target, which we find to be = 10.44 0.49 Mpc. Due to the better population statistics in the archival data, we adopt the existing CMDs/TRGB catalog distance ( = 9.96 0.33 Mpc) to this galaxy, which is very close to the Cepheid determination of = 10.05 0.42 Mpc (Freedman et al., 2001).
-
•
NGC 3621 is an isolated spiral galaxy and member of the Leo Spur, a filamentary structure whose members have, on average, relatively high negative peculiar velocities towards us. This observed effect is due to the expansion of the Local Void pushing galaxies residing in the Local Sheet (including the Milky Way) down towards the Leo Spur, which then imprints the negative peculiar velocities onto members of the Leo Spur (Karachentsev et al., 2015; Anand et al., 2019b). The existing CMDs/TRGB catalog measurement for NGC 3621 of 6.65 0.18 Mpc was obtained from data taken by GO-9492 (PI: F. Bresolin), with observations in the F555W and F814W bands. The usage of the F555W is less optimal, due to many of the higher metallicity (redder) RGB stars being pushed off to the right of the observable CMD.
PHANGS-HST provides two parallel fields, which are both deeper than other existing data. Both fields cover part of the outer disk, which we isolate to reduce contamination from Pop I stars. From the two fields (only the outermost one is shown in Figure 3), we find = 25.31 0.03 and = 25.27 0.02 mag, which result in = 7.10 0.30 Mpc and = 7.02 0.28 Mpc, respectively. The results from these two fields agree very well, and we take an average of these two measurements with a conservative error estimate ( Mpc 0.28 Mpc) as the adopted distance to this galaxy.
-
•
NGC 3627 is the brightest member of a group colloquially known as the Leo Triplet, though there are fifteen likely group members (Kourkchi & Tully, 2017). There are several existing HST observations that allow for the determination of a TRGB distance to this target, due to its nature as a host to SN1989B, a type Ia supernova. The most ideal data is from the Carnegie-Chicago Hubble Programme (CCHP, GO-13691, PI: W. Freedman). The CCHP group, with their distinct methodology, has determined a distance to NGC 3627 of 11.06 0.30 Mpc (Hoyt et al., 2019; Freedman et al., 2019). The existing determination on the CMDs/TRGB catalog from this same CCHP field is 11.32 0.48 Mpc, implying the two measurements are consistent to within 2 of each other, though 8 offset from the Cepheid determination of Freedman et al. (2001) ( = 10.05 0.37 Mpc).
The PHANGS-HST field partially overlaps with the southern edge of the main disk, introducing some contamination from Pop I stars. We select the outer 30 of the observed field for our analysis. Within this region, we find = 26.28 0.02 mag, from which we determine a distance of 11.07 0.44 Mpc. We choose to adopt the existing CMDs/TRGB catalog distance over the new PHANGS-HST determination due to the greater number of detected stars in the selected regions of the field in the former, though we note that the difference between the adopted measurement and the PHANGS-HST determination is quite small (2).
-
•
NGC 4826, also known as the Black Eye galaxy due to its prominent dust lanes, is the closest PHANGS-HST target with a previously determined TRGB distance of = 4.40 0.18 Mpc on the CMDs/TRGB catalog (from GO-10905, PI: R. Tully). The PHANGS-HST data samples a region of the galaxy where there are two distinct RGBs. This includes a low-metallicity population within the halo of the galaxy, as well as a high-metallicity population from the outer disk. There is evidence of a Type-III anti-truncation component (Kang et al., 2020), and this new parallel field will allow us to trace this component at further galactocentric radii (to be presented in a later work).
For our TRGB analysis, we select the lower metallicity red giant population by limiting the analysis to the far half of the field. We find = 24.22 0.01 mag. From this, we determine = 4.41 0.19 Mpc, which is nearly identical to the existing determination on the CMDs/TRGB catalog. We note that our measurement of the TRGB is consistent within the small uncertainties with the recent determination of Kang et al. (2020), who measure = 24.21 0.03 mag from archival HST data. We adopt the new PHANGS-HST TRGB determination for the distance to this galaxy.
-
•
NGC 5068 is an isolated flocculent spiral, and the second-nearest PHANGS-HST target, with the existing CMDs/TRGB catalog measurement situating it at = 5.16 Mpc 0.19 Mpc. The PHANGS-HST field is nicely placed in the outer halo, from which we measure = 24.57 0.03 mag. This equates to a distance of = 5.20 Mpc 0.21 Mpc. We choose to adopt the new PHANGS-HST measurement for the distance to NGC 5068, although the two measurements are within less than of each other.
-
•
NGC 6744 is a Milky-Way like spiral and the brightest member of its group. The CMDs/TRGB catalog measurement from data taken by SNAP-12546 (PI: R. Tully) shows = 9.50 0.63 Mpc. The PHANGS-HST parallel is deeper, and when limited to regions with fewer Pop I stars, provides a higher confidence measurement of = 25.91 0.05 mag, resulting in a distance of = 9.39 0.43 Mpc. We adopt the new PHANGS distance measurement for NGC 6744.
3.3.2 Galaxies with First-Ever TRGB Measurements
We now turn to galaxies which do not have prior TRGB measurements. Based on distance measures from other methods, these targets are on average further than those described in the previous subsection.
-
•
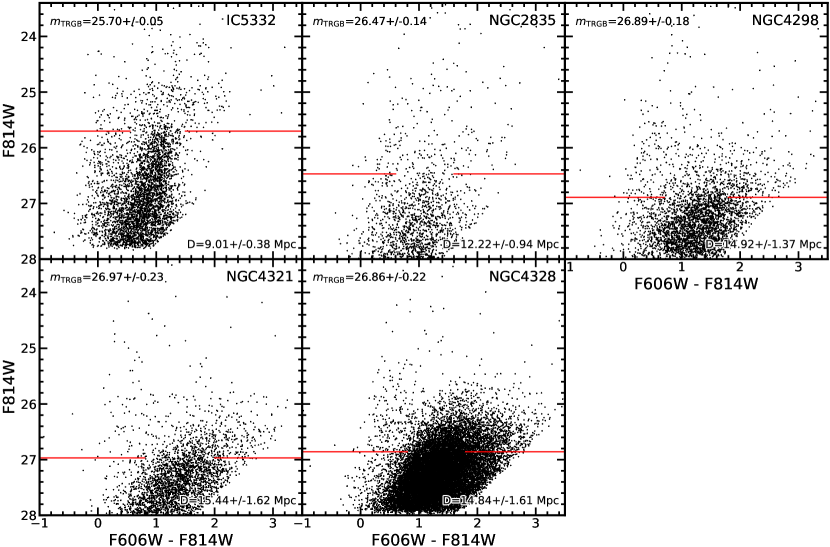
IC 5332 is a face-on spiral galaxy in the Sculptor constellation, but lying beyond the Sculptor group of galaxies. There was previously no reliable distance to this galaxy, with estimates relying on a tenuous group linkage with NGC 7713, or based on its recessional velocity. Our PHANGS-HST parallel is well-placed, with only a small portion of the field experiencing contamination from a young star cluster (which we remove). Based on this data, we measure = 25.70 0.05 mag, which gives us = 9.01 0.38 Mpc.
-
•
NGC 2835 is the brightest member of a small galaxy group in the southern hemisphere. Most previous distances were based on the Tully-Fisher (TF) relation (Tully & Fisher, 1977), though with a nearly factor of 3 spread in the reported values. The numerical action method (NAM, Shaya et al. 2017) distance (see Section 4 for more details) to this target is 12.38 1.86 Mpc, which in the absence of a TRGB measurement represented the best distance estimate to this target. The PHANGS-HST parallel imaging for NGC 2835 lies far enough out into the halo of the galaxy that we do not need to trim the field for analysis due to the lack of a substantial population of young stars. From the entire field, we determine = 26.47 0.14 mag, which results in our adopted distance of = 12.22 0.94 Mpc.
-
•
NGC 4298 is a spiral galaxy that is a member of the Virgo Cluster. Previous best distance estimates relied on the TF relation, and measurements from Cosmicflows-3 found = 13.0 3.0 Mpc. The PHANGS-HST parallel field lies in the combined halo of NGC 4298 and NGC 4302, a neighbouring edge-on spiral galaxy. The 21-cm HI maps for two galaxies show strong evidence for a bridge connecting the two galaxies (Zschaechner et al., 2015), though optical signatures of interaction are not obvious. We link the two galaxies together, and assume that they lie at the same distance. We use the stars in this parallel field to measure = 26.89 0.18 mag, providing us with a new distance of = 14.92 1.37 Mpc.
-
•
NGC 4321 (M100) is a large spiral galaxy located within the Virgo Cluster. Its location within Virgo, as well as the fact that it has been host to seven observed supernovae (including SN2006X, a type Ia) makes it an extremely important target for which to have an accurate distance. PHANGS-HST has two parallel fields for this target, one of which lies right on top of the nearby dwarf galaxy NGC 4328, which we discuss separately. The other parallel is relatively well-placed, and we use the outer portion of this field to determine = 26.97 0.23 mag. From this, we derive = 15.44 1.62 Mpc. Given the relatively large uncertainty in our distance, we adopt the Cepheid distance of = 15.21 0.49 Mpc (Freedman et al., 2001) to this galaxy, though we note that our own determination is very close to this value.
-
•
NGC 4328 is a dwarf galaxy that lies 6′ away from NGC 4321. Unlike NGC 4321’s other satellite (NGC 4323), it is not clearly connected to NGC 4321, and thus could be physically unrelated. One of the two parallel fields for NGC 4321 fully covers this dwarf galaxy, and we are able to use the entire field (which lacks young stars) to measure = 26.86 0.22 mag. From this we find = 14.84 1.61 Mpc. With this distance, we confirm that NGC 4328 is likely a satellite of NGC 4321. Note that NGC 4328 is not a member of the PHANGS sample, and is included here only because one of the two parallels for NGC 4321 falls directly onto this satellite.
3.3.3 Galaxies with Marginal/Null Results
For the remainder of the PHANGS-HST sample, we are unable to determine a robust TRGB distance from the parallel data. The lack of results stems from the underlying data being too sparse (i.e., at too large a galactocentric radius), too shallow for the likely distance to the galaxy, or a combination of both. Here we briefly describe the marginal or null results from our data.
-
•
NGC 1317444Tied to measurements of its larger, interacting neighbour, NGC 1316., NGC 1365, and NGC 4536 all have precise measurements of the TRGB (Jacobs et al., 2009) obtained with much deeper HST data (GO-13691, PI: W. Freedman) than available from PHANGS-HST. Similarly, NGC 1559, NGC 4535, NGC 4548, and NGC 4654555Tied to measurements of its likely interacting neighbour, NGC 4639. have precise distance measurements from Cepheid (Freedman et al., 2001) or Mira (Huang et al., 2020) variables. These galaxies are all found to lie beyond 16 Mpc, which is beyond what is obtainable with the dataset presented in this paper.
-
•
The remainder of the PHANGS-HST targets have too few resolved stars in their targeted fields, and/or do not reach a sufficient depth below the TRGB, and are thus not suitable for our purposes. These targets are NGC 1087, NGC 1097, NGC 1300, NGC 1385, NGC 1672, NGC 1792, NGC 2775, NGC 4254, NGC 4303, NGC 4569, NGC 4571, NGC 4689, and NGC 5248. Some of these galaxies (e.g., NGC 1087) have angular sizes small enough that their parallel fields simply lie too far out into the halo to be useful. For other targets (e.g., NGC 1300), the parallels fall at an appropriate galactocentric radius, but the galaxies are likely just too distant to detect enough RGB stars with the data.
4 Literature Distances
4.1 Distance Selections
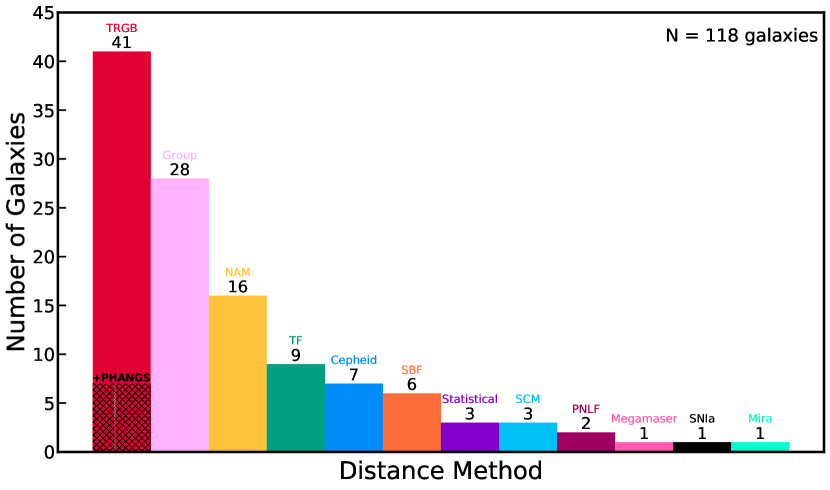
The PHANGS-HST galaxies make up a small but important subset (39/118) of the full PHANGS sample. To obtain distances to the the larger sample, as well as the remainder of the PHANGS-HST galaxies, we carefully combed through the available literature, a task aided by galaxy databases such as EDD and the NASA/IPAC Extragalactic Database (NED)666http://ned.ipac.caltech.edu/. A summary figure with a histogram of our selected distances is presented in Figure 5.77712-color colorblind friendly palette modified from “Designing for Color Blindness”.
Due to the varying quality of individual measurements, we choose to not implement a strict hierarchy for the selection of distances. For instance, we rejected a couple of our TRGB measurements (NGC 1097 and NGC 1792) due to the possibility that they were actually measuring the onset of the AGB instead (see Anand et al. (2019a) for more details). In other cases, TF distances to galaxies with low inclinations (i.e., close to face-on) are often subject to large errors. Nearly every method of determining distances is subject to similar pitfalls, which necessitates a careful selection of the adopted distances.
We prioritise measurements from different distance techniques based on relative accuracy as has been demonstrated throughout the literature. Our first preference is for distances obtained from either the TRGB or Cepheid variables (Leavitt & Pickering, 1912). Both of these techniques have been used extensively to find distances to nearby galaxies (Freedman et al., 2001; McConnachie et al., 2005; Jacobs et al., 2009; Riess et al., 2016; Freedman et al., 2019), and their overall accuracies (including systematic uncertainties) are 4–10 (based on quality of data, etc.). All of the archival TRGB measurements and errors are taken from the CMDs/TRGB Catalog of EDD (Jacobs et al., 2009), with the errors standardised to include a 0.07 mag systematic error term added in quadrature to the measured statistical error (Rizzi et al., 2007; McQuinn et al., 2017). In this work, we have employed the same methodology as the TRGB measurements from the CMDs/TRGB catalog on EDD, hence minimizing internal systematic differences between the archival (=33) and new PHANGS-HST (=8) TRGB measurements. All but one (Pierce et al., 1994) of the Cepheid variable measurements (=7) are obtained from work done by the HST Key Project (Freedman et al., 2001)—we choose to adopt their metallicity-corrected values and reported errors.
In the absence of highly accurate distances from either Cepheids or the TRGB, we turn to our next set of distance indicators. These include the standardizable candle method (SCM) for Type II supernovae (Nugent et al., 2006; Polshaw et al., 2015), surface brightness fluctuations (SBF, Tonry & Schneider 1988), the planetary nebula luminosity function (PNLF, Ciardullo et al. 1989; Feldmeier et al. 1997), and the TF relation. As with the Cepheid and TRGB measurements, we aim to draw distances from larger, homogenised samples to minimise competing systematic errors. There are only 3 adopted distance measurements from the SCM, each from different sources. For these, we adopt the reported errors for each measurement. The PNLF distances (=2) are obtained from MUSE observations of PHANGS galaxies (F. Scheuermann et al., in preparation), and we adopt a preliminary error on each measurement of 10. All but one (Karachentsev et al., 2004) of the TF distances (=9) are obtained from measurements from the Cosmicflows-3 programme (Tully et al., 2016), and the SBF distances (=6) are from a single large SBF programme (Tonry et al., 2001), obtained through the Cosmicflows-3 catalog on EDD. For the TF and SBF distances, we adopt the error values as reported in Cosmicflows-3.
Finally, for galaxies without distance measurements from any of the above methods, we turn to distances from galaxy groups and numerical modeling of their orbits. For determining distances via galaxy groups (=28), we use two different methods. The majority of group distances are obtained from the Kourkchi-Tully group catalog (Kourkchi & Tully, 2017), which provides a robust catalog of galaxy groups within 3,500 km s-1, or Mpc. The catalog includes distances to groups, as well as errors on the group distance measurement. To estimate our uncertainties for these group distances to individual galaxies, we take the error in the group distance and multiply by the square root of the number of galaxies in the group with measured distances. This allows us to account for the varying physical sizes of different galaxy groups, since galaxies residing in physically larger groups will have larger uncertainties associated with their individual distances. In a few other cases, we tie PHANGS galaxy distances to individual galaxies with high-quality distances (e.g., from TRGB measurements). For instance, our adopted distance to NGC 1317 is a TRGB distance from a very deep HST pointing (Hatt et al., 2018) of the halo of its likely interacting companion, NGC 1316. In these instances, we simply adopt the reported error on the original distance.
The last major distance indicator we use involves the usage of a numerical action methods (NAM) model (Shaya et al., 2017). NAM is a non-linear model that attempts to reconstruct the 3-D orbits of galaxies from to the present day. The present iteration of NAM provides such information for nearly 1400 halos within 38 Mpc (which are embedded within a tidal field extending out to 100 Mpc). Kourkchi et al. (2020a) provides a smoothed velocity field derived from NAM, as well as an online distance-velocity calculator888http://edd.ifa.hawaii.edu/NAMcalculator/ to obtain either a distance or velocity given one of the two quantities, as well as a position on the sky. As much as possible, we avoid using NAM in heavily crowded galaxy environments due to the chaotic nature of the underlying velocity field and its poor correlation with distance. The most extreme example of this is in the Virgo Cluster, as galaxies in such a rich environment are heavily decoupled from the Hubble flow. For the galaxies with reported NAM distances (=16), we report an uncertainty of 15 on the distance. For three galaxies where the TF measurements are less precise but similar to NAM, we choose to adopt a weighted average (referred to as “statistical”).
It is possible to directly compare galaxies with existing distance measurements from other methods, and the predicted value given by NAM. Figure 5 in Shaya et al. (2017) shows a comparison of NAM distances and Hubble flow distances for 286 halos with high-quality distance measurements—NAM provides better distance estimates in most cases. However, given that these 286 distances served as inputs for NAM, an independent test of the reliability of NAM can only be performed in cases for which the distance to a galaxy was not used as an input. Our new PHANGS-HST TRGB measurements provide two key new distances which can be used for this purpose. For instance, NAM predicts a distance to IC 5332 of 8.18 Mpc, with a nominal error of 15 (1.23 Mpc). In this paper, we find the first accurate distance to this galaxy with a TRGB measurement of 9.01 0.41 Mpc, or only 9 higher than the value predicted by NAM. In the case of NGC 2835, NAM predicts a value of 12.38 Mpc, whereas our measured TRGB distance is 12.22 0.94 Mpc, a difference of only 1. These two cases, whilst limited, illustrate the predictive power of NAM to determine distances in cases where there are no other suitable measurements.
In addition to the above methods, we note the selection of three additional distance measurement techniques, each of which was adopted for a single target.
-
•
NGC 1559 has a recently published distance obtained from a newly derived period-luminosity relation for Mira variables (Huang et al., 2020). We adopt their distance of = 19.44 0.44 Mpc.
-
•
NGC 4258 is host to a water megamaser which allows the determination of a geometrical distance to the galaxy. We adopt the recent, highly-precise distance of = 7.58 0.11 Mpc (Reid et al., 2019).
-
•
NGC 4579 is host to a type Ia supernova (SN 1989M), but has no corresponding Cepheid or TRGB distance. The lack of Cepheid distance is likely due to the fact that this is an older supernova with a somewhat poorly sampled light curve. Here we adopt a distance of = 21 2 Mpc derived from observations of the SN 1989M (Ruiz-Lapuente, 1996).
4.2 Compilation
Our list of selected distances can be seen in Table LABEL:tab:distance-table. Along with the PHANGS designation for the galaxy, we also provide the PGC number for each target (Makarov et al., 2014), which allows for easier tracking between galaxy databases such as EDD and HyperLeda999http://leda.univ-lyon1.fr/. For each galaxy, we specify whether it is one of the PHANGS-HST galaxies. Along with the adopted distance, we specify the distance error, distance method, and all references (original determination and any subsequent catalogs) from which the distance was obtained. For cases where the error is Gaussian on the distance modulus (), we simply provide the larger error value as the reported error bar.
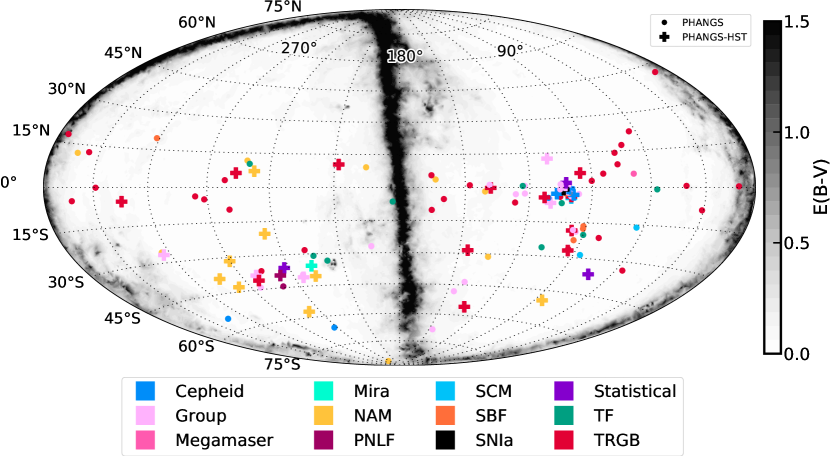
We show in Figure 6 (inspired by figure 12 from Kourkchi & Tully 2017) the distribution of the entire PHANGS sample on the sky in supergalactic coordinates. Foreground extinction from Schlafly & Finkbeiner (2011) is plotted in grey-scale, highlighting the location of the Galactic plane in these coordinates. Three different subsets of galaxies (archival ALMA, PHANGS-ALMA, or PHANGS-ALMA+HST) are denoted with different symbols, and galaxies are colour-coded by the final method used for selected distance. It can be seen from this plot that galaxies within this distance range are not uniformly distributed throughout the sky. The dearth of galaxies towards the north supergalactic pole corresponds to the location of the Local Void (Anand et al., 2018a; Tully et al., 2019). Two main clusters of galaxies are also seen. One is loosely centered near , and the other near . These correspond to the Fornax and Virgo clusters, respectively.
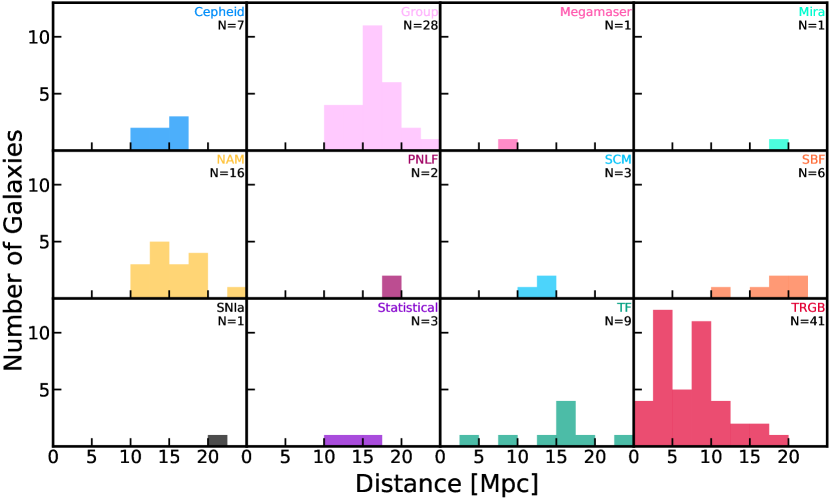
We show in Figure 5 a histogram of the adopted distances to galaxies in the PHANGS sample, and in Figure 7 histograms for each individual distance method to highlight their distance distributions. A few general observations can be drawn from these figures and our sample:
-
•
The distance to nearly every PHANGS galaxy within 10 Mpc has been measured with the TRGB, highlighting our increasingly complete understanding of galaxy distances within the Local Volume. At present, most galaxies thought to lie within 10 Mpc without TRGB distances are small dwarfs, observations for many of which are currently being obtained and analyzed (Karachentsev et al., 2020) through a HST Cycle 27 Snapshot programme (SNAP-15922, PI: R. Tully). One key exception here is the Circinus Galaxy (ESO 097G13), which is likely very nearby (4 Mpc) and potentially crucial to the evolution of the Local Group (McCall, 2014; Neuzil et al., 2020). Unfortunatey, the galaxy is heavily obscured (the circle closest to the galactic plane in Figure 6) and would benefit from near-infrared observations with WFC3/IR to secure a robust TRGB distance.
-
•
Distances obtained from observations of Cepheid variables as part of the Hubble Key Project (Freedman et al., 2001) are still the best distances for many galaxies at intermediate (10–16 Mpc) distances, highlighting the long-lasting impact of this work.
-
•
With the increasing completeness of standard candle-based distances (e.g., Cepheid, TRGB) in the nearby universe, the reliance on less accurate techniques (e.g., SBF, TF) has decreased. Instead, these techniques are becoming increasingly popular (Cantiello et al., 2018; Kourkchi et al., 2020b) at much larger distances (out to 200 Mpc) and with much greater efficiency (many thousands of galaxies). This level of performance is simply not feasible for Cepheids/TRGB, which require much deeper, targeted observations with HST (or future facilities).
-
•
Distance estimates from NAM are valuable for many galaxies beyond 10 Mpc, especially since some of these targets lack any velocity-independent distance. In instances for which there are only measurements from less precise methods (e.g., TF), NAM results provide an important reference point for cross-check.
5 Summary
We have successfully measured TRGB distances to 11 galaxies from the PHANGS-HST survey, from to 15 Mpc, using imaging observations taken in parallel mode with ACS in the V and I bands (F606W, F814W). Five of these represent the first published TRGB distance measurements (Figure 4), and eight are the best available distances to the targets (Table LABEL:tab:distance-table).
Our analyses are based on the first year of observations through 2020 July, and include 37 ACS pointings in 30 galaxies. Lack of TRGB measurement is due to the sparseness of the imaging (i.e., pointing at too large a galactocentric radius), insufficient depth of the 2-3 orbit observations given the likely distance to the galaxy, or a combination of both. Results based on the remaining seven parallel fields (in six galaxies) will be presented in a short follow-up paper after the completion of the programme, which is anticipated in mid-2021. These parallel observations represent a valuable augmentation of the main PHANGS-HST science programme with no negative impact on the primary goals of the survey, and have provided a set of accurate distances without requiring a separate allocation of time on HST. We recommend that future HST programmes observing the disks of nearby galaxies to comparable or greater depths implement parallel halo observations for similar use.
In addition to the newly determined TRGB distances, we provide a compilation of the best available distances for the full sample of 118 PHANGS galaxies (Table LABEL:tab:distance-table). These are the distances adopted by the first public PHANGS-ALMA data release (version 1.6). Updates will be made as improved distances become available, and will coincide with future public ALMA data releases (A. K. Leroy et al., in preparation).
We note that only about half of the PHANGS galaxies currently have distance measurements from highly reliable methods (e.g., Cepheids, TRGB), and that the majority of the remaining targets likely lie beyond 15 Mpc (Figure 7). To obtain reliable distances to that large of a sample of galaxies with current facilities would require significant HST time. For instance, accurate (5%) TRGB observations for galaxies at 20 Mpc require substantial time investments with HST, such as the case for the type Ia supernova host NGC 1316 (16 orbits, Hatt et al. 2018). It is unlikely that such expensive HST observations for the sole purpose of distance determination would be approved for every PHANGS galaxy expected to lie at the far edge of our sample.
Instead, future facilities such as the James Webb Space Telescope (JWST) will allow for much more efficient observations of the TRGB, due to a combination of its larger aperture and the brighter absolute magnitude of the TRGB in the near-infrared (Wu et al., 2014; Beaton et al., 2018; McQuinn et al., 2019; Durbin et al., 2020). Similar strategies to the PHANGS-HST survey which employ observations of the disk in primary instrument and the halo in parallel can be applied to JWST. Ideally, the role of WFC3 is replaced with the Mid-Infrared Instrument (MIRI) to obtain longer wavelength observations of the star-forming disk, and the job of observing halo stars would be accomplished with the Near Infrared Camera (NIRCam), instead of ACS.
Acknowledgements
This work was carried out as part of the PHANGS collaboration. Based on observations made with the NASA/ESA Hubble Space Telescope, obtained from the data archive at the Space Telescope Science Institute. STScI is operated by the Association of Universities for Research in Astronomy, Inc. under NASA contract NAS 5-26555. Support for Programme number 15654 was provided through a grant from the STScI under NASA contract NAS5-26555. We thank the anonymous referee for their useful comments which helped improve this manuscript.
G.A. acknowledges support from the IPAC Visiting Graduate Fellowship programme and from an award from the Space Telescope Science Institute in support of programme SNAP-15922. The work of AKL is partially supported by the National Science Foundation under Grants No. 1615105, 1615109, and 1653300. ES acknowledges funding from the European Research Council (ERC) under the European Union’s Horizon 2020 research and innovation programme (grant agreement No. 694343). K.K. and F.S. gratefully acknowledge funding from the German Research Foundation (DFG) in the form of an Emmy Noether Research Group (grant number KR4598/2-1, PI Kreckel). ER acknowledges the support of the Natural Sciences and Engineering Research Council of Canada (NSERC), funding reference number RGPIN-2017-03987. FS gratefully acknowledges funding from the German Research Foundation (DFG) Emmy Noether Research Group (grant number KR4598/2-1, PI Kreckel). FB acknowledges funding from the European Union’s Horizon 2020 research and innovation programme (grant agreement No 726384/EMPIRE). MB acknowledges FONDECYT regular grant 1170618. RSK and SCOG acknowledge financial support from the German Research Foundation (DFG) via the Collaborative Research Center (SFB 881, Project-ID 138713538) ’The Milky Way System’ (subprojects A1, B1, B2, and B8). He also thanks for funding from the Heidelberg Cluster of Excellence STRUCTURES in the framework of Germany’s Excellence Strategy (grant EXC-2181/1 - 390900948) and for funding from the European Research Council via the ERC Synergy Grant ECOGAL (grant 855130). JMDK gratefully acknowledges funding from the Deutsche Forschungsgemeinschaft (DFG, German Research Foundation) through an Emmy Noether Research Group (grant number KR4801/1-1) and the DFG Sachbeihilfe (grant number KR4801/2-1), as well as from the European Research Council (ERC) under the European Union’s Horizon 2020 research and innovation programme via the ERC Starting Grant MUSTANG (grant agreement number 714907). PSB acknowledges financial support from grant PID2019-107427GB-C31 from the Spanish Ministry of Economy and Competitiveness (MINECO). MQ acknowledges support from the research project PID2019-106027GA-C44 from the Spanish Ministerio de Ciencia e Innovación. TGW acknowledges funding from the European Research Council (ERC) under the European Union’s Horizon 2020 research and innovation programme (grant agreement No. 694343).
This research has made use of the NASA/IPAC Extragalactic Database (NED) which is operated by the Jet Propulsion Laboratory, California Institute of Technology, under contract with the National Aeronautics and Space Administration. This research has made use of the NASA/IPAC Infrared Science Archive, which is funded by the National Aeronautics and Space Administration and operated by the California Institute of Technology.
Data Availability
The data underlying this article are available at the Mikulski Archive for Space Telescopes at https://archive.stsci.edu/hst/search_retrieve.html under proposal GO-15654. The photometry and list of derived parameters for the TRGB analysis are available under the CMDs/TRGB catalog of the Extragalactic Distance Database at edd.ifa.hawaii.edu.
References
- Anand et al. (2018a) Anand G. S., Rizzi L., Tully R. B., 2018a, AJ, 156, 105
- Anand et al. (2018b) Anand G. S., Tully R. B., Karachentsev I. D., Makarov D. I., Makarova L., Rizzi L., Shaya E. J., 2018b, ApJ, 861, L6
- Anand et al. (2019a) Anand G. S., Tully R. B., Rizzi L., Karachentsev I. D., 2019a, ApJ, 872, L4
- Anand et al. (2019b) Anand G. S., Tully R. B., Rizzi L., Shaya E. J., Karachentsev I. D., 2019b, ApJ, 880, 52
- Barbarino et al. (2015) Barbarino C., et al., 2015, MNRAS, 448, 2312
- Beaton et al. (2018) Beaton R. L., et al., 2018, Space Sci. Rev., 214, 113
- Beaton et al. (2019) Beaton R. L., et al., 2019, ApJ, 885, 141
- Cantiello et al. (2018) Cantiello M., et al., 2018, ApJ, 854, L31
- Carretta et al. (2000) Carretta E., Gratton R. G., Clementini G., Fusi Pecci F., 2000, ApJ, 533, 215
- Chevance et al. (2020) Chevance M., et al., 2020, MNRAS, 493, 2872
- Ciardullo et al. (1989) Ciardullo R., Jacoby G. H., Ford H. C., Neill J. D., 1989, ApJ, 339, 53
- Crnojević et al. (2014) Crnojević D., et al., 2014, ApJ, 795, L35
- Danieli et al. (2020) Danieli S., van Dokkum P., Abraham R., Conroy C., Dolphin A. E., Romanowsky A. J., 2020, ApJ, 895, L4
- Dolphin (2000) Dolphin A. E., 2000, PASP, 112, 1383
- Dolphin (2016) Dolphin A., 2016, DOLPHOT: Stellar photometry (ascl:1608.013)
- Durbin et al. (2020) Durbin M. J., Beaton R. L., Dalcanton J. J., Williams B. F., Boyer M. L., 2020, ApJ, 898, 57
- Feldmeier et al. (1997) Feldmeier J. J., Ciardullo R., Jacoby G. H., 1997, ApJ, 479, 231
- Freedman et al. (2001) Freedman W. L., et al., 2001, ApJ, 553, 47
- Freedman et al. (2019) Freedman W. L., et al., 2019, ApJ, 882, 34
- Hatt et al. (2018) Hatt D., et al., 2018, ApJ, 866, 145
- Hoyt et al. (2019) Hoyt T. J., et al., 2019, ApJ, 882, 150
- Huang et al. (2020) Huang C. D., et al., 2020, ApJ, 889, 5
- Jacobs et al. (2009) Jacobs B. A., Rizzi L., Tully R. B., Shaya E. J., Makarov D. I., Makarova L., 2009, AJ, 138, 332
- Jang & Lee (2017) Jang I. S., Lee M. G., 2017, ApJ, 835, 28
- Jang et al. (2020) Jang I. S., et al., 2020, arXiv e-prints, p. arXiv:2008.04181
- Kang et al. (2020) Kang J., Kim Y. J., Lee M. G., Jang I. S., 2020, ApJ, 897, 106
- Karachentsev et al. (2004) Karachentsev I. D., Karachentseva V. E., Huchtmeier W. K., Makarov D. I., 2004, AJ, 127, 2031
- Karachentsev et al. (2015) Karachentsev I. D., Tully R. B., Makarova L. N., Makarov D. I., Rizzi L., 2015, ApJ, 805, 144
- Karachentsev et al. (2018) Karachentsev I. D., Makarova L. N., Tully R. B., Rizzi L., Shaya E. J., 2018, ApJ, 858, 62
- Karachentsev et al. (2020) Karachentsev I. D., Makarova L. N., Brent Tully R., Anand G. S., Rizzi L., Shaya E. J., Afanasiev V. L., 2020, A&A, 638, A111
- Kourkchi & Tully (2017) Kourkchi E., Tully R. B., 2017, ApJ, 843, 16
- Kourkchi et al. (2020a) Kourkchi E., Courtois H. M., Graziani R., Hoffman Y., Pomarède D., Shaya E. J., Tully R. B., 2020a, AJ, 159, 67
- Kourkchi et al. (2020b) Kourkchi E., Tully R. B., Anand G. S., Courtois H. M., Dupuy A., Neill J. D., Rizzi L., Seibert M., 2020b, ApJ, 896, 3
- Kreckel et al. (2019) Kreckel K., et al., 2019, ApJ, 887, 80
- Krist (1993) Krist J., 1993, in Hanisch R. J., Brissenden R. J. V., Barnes J., eds, Astronomical Society of the Pacific Conference Series Vol. 52, Astronomical Data Analysis Software and Systems II. p. 536
- Leavitt & Pickering (1912) Leavitt H. S., Pickering E. C., 1912, Harvard College Observatory Circular, 173, 1
- Lee et al. (1993) Lee M. G., Freedman W. L., Madore B. F., 1993, ApJ, 417, 553
- Leonard et al. (2003) Leonard D. C., Kanbur S. M., Ngeow C. C., Tanvir N. R., 2003, ApJ, 594, 247
- Madore & Freedman (1995) Madore B. F., Freedman W. L., 1995, AJ, 109, 1645
- Madore & Freedman (2020) Madore B. F., Freedman W. L., 2020, AJ, 160, 170
- Makarov et al. (2006) Makarov D., Makarova L., Rizzi L., Tully R. B., Dolphin A. E., Sakai S., Shaya E. J., 2006, AJ, 132, 2729
- Makarov et al. (2014) Makarov D., Prugniel P., Terekhova N., Courtois H., Vauglin I., 2014, A&A, 570, A13
- McCall (2014) McCall M. L., 2014, MNRAS, 440, 405
- McConnachie et al. (2005) McConnachie A. W., Irwin M. J., Ferguson A. M. N., Ibata R. A., Lewis G. F., Tanvir N., 2005, MNRAS, 356, 979
- McQuinn et al. (2016) McQuinn K. B. W., Skillman E. D., Dolphin A. E., Berg D., Kennicutt R., 2016, ApJ, 826, 21
- McQuinn et al. (2017) McQuinn K. B. W., Skillman E. D., Dolphin A. E., Berg D., Kennicutt R., 2017, AJ, 154, 51
- McQuinn et al. (2019) McQuinn K. B. W., Boyer M., Skillman E. D., Dolphin A. E., 2019, ApJ, 880, 63
- Ménard et al. (2010) Ménard B., Scranton R., Fukugita M., Richards G., 2010, MNRAS, 405, 1025
- Méndez et al. (2002) Méndez B., Davis M., Moustakas J., Newman J., Madore B. F., Freedman W. L., 2002, AJ, 124, 213
- Müller et al. (2018) Müller O., Rejkuba M., Jerjen H., 2018, A&A, 615, A96
- Neuzil et al. (2020) Neuzil M. K., Mansfield P., Kravtsov A. V., 2020, MNRAS, 494, 2600
- Nugent et al. (2006) Nugent P., et al., 2006, ApJ, 645, 841
- Olivares E. et al. (2010) Olivares E. F., et al., 2010, ApJ, 715, 833
- Pierce et al. (1994) Pierce M. J., Welch D. L., McClure R. D., van den Bergh S., Racine R., Stetson P. B., 1994, Nature, 371, 385
- Polshaw et al. (2015) Polshaw J., et al., 2015, A&A, 580, L15
- Reid et al. (2019) Reid M. J., Pesce D. W., Riess A. G., 2019, ApJ, 886, L27
- Riess et al. (2016) Riess A. G., et al., 2016, ApJ, 826, 56
- Rizzi et al. (2007) Rizzi L., Tully R. B., Makarov D., Makarova L., Dolphin A. E., Sakai S., Shaya E. J., 2007, ApJ, 661, 815
- Rizzi et al. (2017) Rizzi L., Tully R. B., Shaya E. J., Kourkchi E., Karachentsev I. D., 2017, ApJ, 835, 78
- Ruiz-Lapuente (1996) Ruiz-Lapuente P., 1996, ApJ, 465, L83
- Sakai et al. (2000) Sakai S., Zaritsky D., Kennicutt Robert C. J., 2000, AJ, 119, 1197
- Schinnerer et al. (2019) Schinnerer E., et al., 2019, ApJ, 887, 49
- Schlafly & Finkbeiner (2011) Schlafly E. F., Finkbeiner D. P., 2011, ApJ, 737, 103
- Shaya et al. (2017) Shaya E. J., Tully R. B., Hoffman Y., Pomarède D., 2017, ApJ, 850, 207
- Sun et al. (2018) Sun J., et al., 2018, ApJ, 860, 172
- Tollerud et al. (2016) Tollerud E. J., Geha M. C., Grcevich J., Putman M. E., Weisz D. R., Dolphin A. E., 2016, ApJ, 827, 89
- Tonry & Schneider (1988) Tonry J., Schneider D. P., 1988, AJ, 96, 807
- Tonry et al. (2001) Tonry J. L., Dressler A., Blakeslee J. P., Ajhar E. A., Fletcher A. B., Luppino G. A., Metzger M. R., Moore C. B., 2001, ApJ, 546, 681
- Tully & Fisher (1977) Tully R. B., Fisher J. R., 1977, A&A, 54, 661
- Tully et al. (2008) Tully R. B., Shaya E. J., Karachentsev I. D., Courtois H. M., Kocevski D. D., Rizzi L., Peel A., 2008, ApJ, 676, 184
- Tully et al. (2013) Tully R. B., et al., 2013, AJ, 146, 86
- Tully et al. (2014) Tully R. B., Courtois H., Hoffman Y., Pomarède D., 2014, Nature, 513, 71
- Tully et al. (2016) Tully R. B., Courtois H. M., Sorce J. G., 2016, AJ, 152, 50
- Tully et al. (2019) Tully R. B., Pomarède D., Graziani R., Courtois H. M., Hoffman Y., Shaya E. J., 2019, ApJ, 880, 24
- Utomo et al. (2018) Utomo D., et al., 2018, ApJ, 861, L18
- Van Dyk et al. (2019) Van Dyk S. D., et al., 2019, ApJ, 875, 136
- Williams et al. (2014) Williams B. F., et al., 2014, ApJS, 215, 9
- Wu et al. (2014) Wu P.-F., Tully R. B., Rizzi L., Dolphin A. E., Jacobs B. A., Karachentsev I. D., 2014, AJ, 148, 7
- York et al. (2000) York D. G., et al., 2000, AJ, 120, 1579
- Yuan et al. (2019) Yuan W., Riess A. G., Macri L. M., Casertano S., Scolnic D. M., 2019, ApJ, 886, 61
- Zschaechner et al. (2015) Zschaechner L. K., Rand R. J., Walterbos R., 2015, ApJ, 799, 61
- de Vaucouleurs et al. (1991) de Vaucouleurs G., de Vaucouleurs A., Corwin Herold G. J., Buta R. J., Paturel G., Fouque P., 1991, Third Reference Catalogue of Bright Galaxies
1IPAC, California Institute of Technology, Pasadena, CA 91125, USA
2Institute for Astronomy, University of Hawaii, 2680 Woodlawn Drive, Honolulu, HI 96822, USA
3Department of Astronomy, The Ohio State University,
4055 McPherson Laboratory, 140 West 18th Ave, Columbus, OH 43210, USA
4Department of Physics, University of Alberta, 4-183 CCIS, Edmonton, Alberta, T6G 2E1, Canada
5Max Planck Institut für Astronomie, Königstuhl 17, Heidelberg D-69117, Germany
6Astronomisches Rechen-Institut, Zentrum für Astronomie der Universität Heidelberg, Mönchhofstraße 12-14, 69120 Heidelberg, Germany
7W.M. Keck Observatory, 65-1120 Mamalahoa Highway, Kamuela, HI 96743, USA
8Department of Physics and Astronomy, The Johns Hopkins University, Baltimore, MD 21218, USA
9Argelander-Institut für Astronomie, Universität Bonn, Auf dem Hügel 71, 53121 Bonn, Germany
10Observatories of the Carnegie Institution for Science, Pasadena, CA, USA
11Departamento de Astronomía, Universidad de Chile, Santiago, Chile
12Centro de Astronomía (CITEVA), Universidad de Antofagasta, Avenida Angamos 601, Antofagasta 1270300, Chile
13Department of Physics Astronomy, The University of Toledo, Toledo, OH 43606, USA
14Department of Physics and Astronomy, University of Wyoming, Laramie, WY, USA
15European Southern Observatory, Karl-Schwarzschild Straße 2, D-85748 Garching bei München, Germany
16Univ Lyon, Univ Lyon, ENS de Lyon, CNRS, Centre de Recherche Astrophysique de Lyon UMR5574, F-69230 Saint-Genis-Laval, France
17Universität Heidelberg, Zentrum für Astronomie, Institut für Theoretische Astrophysik, Albert-Ueberle-Str. 2, 69120 Heidelberg, Germany
18Research School of Astronomy and Astrophysics, Australian National University, Weston Creek, ACT 2611, Australia
19International Centre for Radio Astronomy Research, The University of Western Australia, 35 Stirling Hwy, 6009 Crawley, WA, Australia
20Universität Heidelberg, Interdisziplinäres Zentrum für Wissenschaftliches Rechnen, Im Neuenheimer Feld 205, 69120 Heidelberg, Germany
21Astronomisches Rechen-Institut, Zentrum für Astronomie der Universität Heidelberg, Mönchhofstraße 12-14, 69120 Heidelberg, Germany
22Observatorio Astronómico Nacional (IGN), C/Alfonso XII 3, Madrid E-28014, Spain
23Facultad de CC Físicas, Universidad Complutense de Madrid, 28040, Madrid, Spain
24Max-Planck-Institut für Extraterrestrische Physik, Giessenbachstraße 1, D-85748 Garching bei München, Germany
25Space Telescope Science Institute, 3700 San Martin Drive, Baltimore, MD 21218, USA
Appendix A Exposure Times, Footprints, and Distances
| Target | F606W [s] | F814W [s] |
|---|---|---|
| IC 5332 | 3554 | 3215 |
| NGC 1087 | 3536 | 3206 |
| NGC 1097 (F1) | 2051 | 2109 |
| NGC 1097 (F2) | 2051 | 2063 |
| NGC 1300 (F1) | 2017 | 2111 |
| NGC 1300 (F2) | 2053 | 2111 |
| NGC 1317 | 3554 | 3215 |
| NGC 1365 | 3556 | 3213 |
| NGC 1385 | 3558 | 3217 |
| NGC 1559 | 2070 | 2140 |
| NGC 1672 (F1) | 3063 | 3775 |
| NGC 1672 (F2) | 3063 | 3775 |
| NGC 1792 | 3554 | 3215 |
| NGC 2775 | 3544 | 3210 |
| NGC 2835 | 3558 | 3217 |
| NGC 3351 | 3554 | 3215 |
| NGC 3621 (F1) | 2051 | 2109 |
| NGC 3621 (F2) | 2051 | 2109 |
| NGC 3627 | 3554 | 3215 |
| NGC 4254 (F1) | 3397 | 3348 |
| NGC 4254 (F2) | 3554 | 3215 |
| NGC 4298 | 3419 | 3350 |
| NGC 4303 | 3536 | 3206 |
| NGC 4321 (F1) | 3558 | 3217 |
| NGC 4321 (F2) | 3558 | 3217 |
| NGC 4535 | 3554 | 3210 |
| NGC 4536 (F1) | 3536 | 3206 |
| NGC 4536 (F2) | 3531 | 3211 |
| NGC 4548 | 3554 | 3215 |
| NGC 4569 | 3554 | 3215 |
| NGC 4571 | 3554 | 3215 |
| NGC 4654 | 3554 | 3215 |
| NGC 4689 | 3554 | 3215 |
| NGC 4826 | 3558 | 3217 |
| NGC 5068 | 3558 | 3217 |
| NGC 5248 | 3554 | 3210 |
| NGC 6744 | 3616 | 3246 |
| Galaxy | PGC Number | PHANGS-HST | Distance [Mpc] | Error [Mpc] | Method | Reference |
| ESO 097-013 | 50779 | 4.20 | 0.77 | TF | 1 | |
| IC 10 | 1305 | 0.79 | 0.05 | TRGB | 2 | |
| IC 342 | 13826 | 3.45 | 0.13 | TRGB | 2 | |
| IC 1954 | 13090 | Y | 12.8 | 2.05 | NAM+TF | 3+4+5 |
| IC 1993 | 13840 | 18.09 | 2.71 | Group | 6 | |
| IC 5273 | 70184 | 14.18 | 2.13 | NAM | 4+5 | |
| IC 5332 | 71775 | Y | 9.01 | 0.41 | TRGB | This Work |
| NGC 224 | 2557 | 0.82 | 0.05 | TRGB | 2 | |
| NGC 247 | 2758 | 3.71 | 0.13 | TRGB | 2 | |
| NGC 253 | 2789 | 3.70 | 0.12 | TRGB | 2 | |
| NGC 278 | 3051 | 11.50 | 1.73 | NAM | 4+5 | |
| NGC 300 | 3238 | 2.09 | 0.09 | TRGB | 2 | |
| NGC 598 | 5818 | 0.94 | 0.04 | TRGB | 2 | |
| NGC 628 | 5974 | Y* | 9.84 | 0.63 | TRGB | 2 |
| NGC 685 | 6581 | Y | 19.94 | 2.99 | NAM | 4+5 |
| NGC 891 | 9031 | 9.97 | 0.45 | TRGB | 2 | |
| NGC 1068 | 10266 | 13.97 | 2.10 | NAM | 4+5 | |
| NGC 1087 | 10496 | Y | 15.85 | 2.24 | Group | 6 |
| NGC 1097 | 10488 | Y | 13.58 | 2.04 | NAM | 4+5 |
| NGC 1291 | 12209 | 9.08 | 0.52 | TRGB | 2 | |
| NGC 1300 | 12412 | Y | 18.99 | 2.85 | NAM | 4+5 |
| NGC 1313 | 12286 | 4.32 | 0.17 | TRGB | 2 | |
| NGC 1317 | 12653 | Y | 19.11 | 0.84 | Group | 2 |
| NGC 1326 | 12709 | 18.34 | 1.83 | Group | 6 | |
| NGC 1365 | 13179 | Y | 19.57 | 0.78 | TRGB | 2 |
| NGC 1385 | 13368 | Y | 17.22 | 2.58 | NAM | 4+5 |
| NGC 1433 | 13586 | Y* | 18.63 | 1.86 | PNLF | 7 |
| NGC 1511 | 14236 | 15.28 | 2.26 | TF | 3 | |
| NGC 1512 | 14391 | 18.83 | 1.88 | PNLF | 7 | |
| NGC 1546 | 14723 | 17.69 | 2.00 | Group | 6 | |
| NGC 1559 | 14814 | Y | 19.44 | 0.44 | Mira | 8 |
| NGC 1566 | 14897 | Y* | 17.69 | 2.00 | Group | 6 |
| NGC 1637 | 15821 | 11.70 | 1.0 | Cepheid | 9 | |
| NGC 1672 | 15941 | Y | 19.40 | 2.91 | NAM | 4+5 |
| NGC 1792 | 16709 | Y | 16.20 | 2.43 | NAM | 4+5 |
| NGC 1809 | 16599 | 19.95 | 5.63 | TF | 3 | |
| NGC 2090 | 17819 | 11.75 | 0.84 | Cepheid | 10 | |
| NGC 2283 | 19562 | 13.68 | 2.05 | NAM | 4+5 | |
| NGC 2403 | 21396 | 3.19 | 0.13 | TRGB | 2 | |
| NGC 2566 | 23303 | 23.44 | 3.52 | Group | 6 | |
| NGC 2683 | 24930 | 9.81 | 0.43 | TRGB | 2 | |
| NGC 2775 | 25861 | Y | 23.15 | 3.47 | NAM | 4+5 |
| NGC 2835 | 26259 | Y | 12.22 | 0.94 | TRGB | This Work |
| NGC 2903 | 27077 | Y | 10.0 | 2.5 | NAM+TF | 3+4+5 |
| NGC 2997 | 27978 | 14.06 | 2.81 | Group | 6 | |
| NGC 3031 | 28630 | 3.69 | 0.21 | TRGB | 2 | |
| NGC 3059 | 28298 | 20.23 | 4.05 | Group | 6 | |
| NGC 3137 | 29530 | 16.37 | 2.32 | Group | 6 | |
| NGC 3184 | 30087 | 12.58 | 1.74 | SCM | 11 | |
| NGC 3239 | 30560 | 10.86 | 1.05 | SCM | 12 | |
| NGC 3344 | 31968 | 9.83 | 1.27 | TRGB | 2 | |
| NGC 3351 | 32007 | Y | 9.96 | 0.33 | TRGB | 2 |
| NGC 3368 | 32192 | 11.21 | 0.49 | TRGB | 2 | |
| NGC 3489 | 33160 | 11.86 | 1.62 | SBF | 3+13 | |
| NGC 3507 | 33390 | 23.55 | 4.0 | TF | 3 | |
| NGC 3511 | 33385 | 13.94 | 2.09 | NAM | 4+5 | |
| NGC 3521 | 33550 | 13.24 | 1.97 | TF | 3 | |
| NGC 3556 | 34030 | 9.55 | 1.41 | TF | 3 | |
| NGC 3596 | 34298 | 11.3 | 1.1 | Group | 2 | |
| NGC 3599 | 34326 | 19.86 | 2.73 | SBF | 3+13 | |
| NGC 3621 | 34554 | Y | 7.06 | 0.28 | TRGB | This Work |
| NGC 3623 | 34612 | 11.3 | 1.1 | Group | 2 | |
| NGC 3626 | 34684 | 20.05 | 2.34 | SBF | 3+13 | |
| NGC 3627 | 34695 | Y | 11.32 | 0.48 | TRGB | 2 |
| NGC 3628 | 34697 | 11.3 | 1.1 | Group | 2 | |
| NGC 4207 | 39206 | 15.78 | 2.33 | TF | 3 | |
| NGC 4254 | 39578 | Y | 13.1 | 2.8 | SCM | 14 |
| NGC 4258 | 39600 | 7.58 | 0.11 | Megamaser | 15 | |
| NGC 4293 | 39907 | 15.76 | 2.36 | Group | 6 | |
| NGC 4298 | 39950 | Y | 14.92 | 1.37 | TRGB | This Work |
| NGC 4302 | 39974 | 14.92 | 1.37 | Group | This Work | |
| NGC 4303 | 40001 | Y | 16.99 | 3.04 | Group | 6 |
| NGC 4321 | 40153 | Y | 15.21 | 0.49 | Cepheid | 10 |
| NGC 4328* | 40209 | 14.84 | 1.61 | TRGB | This Work | |
| NGC 4424 | 40809 | 16.20 | 0.70 | TRGB | 2 | |
| NGC 4457 | 41101 | 15.1 | 2.3 | Group | 3+13 | |
| NGC 4459 | 41104 | 15.85 | 2.18 | SBF | 3+13 | |
| NGC 4476 | 41255 | 17.54 | 2.42 | SBF | 3+13 | |
| NGC 4477 | 41260 | 15.76 | 2.36 | Group | 6 | |
| NGC 4496A | 41471 | 14.86 | 1.06 | Cepheid | 10 | |
| NGC 4535 | 41812 | Y | 15.77 | 0.37 | Cepheid | 10 |
| NGC 4536 | 41823 | Y | 16.25 | 1.13 | TRGB | 2 |
| NGC 4540 | 41876 | 15.76 | 2.36 | Group | 6 | |
| NGC 4548 | 41934 | Y | 16.22 | 0.38 | Cepheid | 10 |
| NGC 4565 | 42038 | 12.06 | 0.43 | TRGB | 2 | |
| NGC 4569 | 42089 | Y | 15.76 | 2.36 | Group | 6 |
| NGC 4571 | 42100 | Y | 14.9 | 1.2 | Cepheid | 16 |
| NGC 4579 | 42168 | Y* | 21.0 | 2 | SNIa | 17 |
| NGC 4594 | 42407 | 9.33 | 0.47 | TRGB | 2 | |
| NGC 4596 | 42401 | 15.76 | 2.36 | Group | 6 | |
| NGC 4631 | 42637 | 7.34 | 0.27 | TRGB | 2 | |
| NGC 4654 | 42857 | Y | 21.98 | 1.16 | Group | 10 |
| NGC 4689 | 43186 | Y | 15.0 | 2.25 | NAM+TF | 3+4+5 |
| NGC 4694 | 43241 | 15.76 | 2.36 | Group | 6 | |
| NGC 4731 | 43507 | 13.28 | 2.12 | Group | 6 | |
| NGC 4736 | 43495 | 4.41 | 0.16 | TRGB | 2 | |
| NGC 4781 | 43902 | 11.31 | 1.18 | Group | 6 | |
| NGC 4826 | 44182 | Y | 4.41 | 0.19 | TRGB | This Work |
| NGC 4941 | 45165 | 15.0 | 5.00 | Group | 6 | |
| NGC 4945 | 45279 | 3.47 | 0.12 | TRGB | 2 | |
| NGC 4951 | 45246 | 15.0 | 4.20 | TF | 3 | |
| NGC 5042 | 46126 | 16.78 | 2.52 | NAM | 4+5 | |
| NGC 5055 | 46153 | 9.02 | 0.33 | TRGB | 2 | |
| NGC 5068 | 46400 | Y | 5.20 | 0.21 | TRGB | This Work |
| NGC 5128 | 46957 | 3.69 | 0.13 | TRGB | 2 | |
| NGC 5134 | 46938 | 19.92 | 2.67 | Group | 6 | |
| NGC 5194 | 47404 | 8.56 | 0.28 | TRGB | 2 | |
| NGC 5236 | 48082 | 4.89 | 0.18 | TRGB | 2 | |
| NGC 5248 | 48130 | Y | 14.87 | 1.34 | Group | 6 |
| NGC 5457 | 50063 | 6.65 | 0.27 | TRGB | 2 | |
| NGC 5530 | 51106 | 12.27 | 1.84 | NAM | 4+5 | |
| NGC 5643 | 51969 | 12.68 | 0.53 | TRGB | 2 | |
| NGC 6300 | 60001 | 11.58 | 1.74 | NAM | 4+5 | |
| NGC 6744 | 62836 | Y | 9.39 | 0.43 | TRGB | This Work |
| NGC 6946 | 65001 | 7.34 | 0.68 | TRGB | 2 | |
| NGC 7456 | 70304 | 15.70 | 2.33 | TF | 3 | |
| NGC 7496 | 70588 | Y | 18.72 | 2.81 | NAM | 4+5 |
| NGC 7743 | 72263 | 20.32 | 2.80 | SBF | 3+13 | |
| NGC 7793 | 73049 | 3.62 | 0.15 | TRGB | 2 |