pnasresearcharticle \leadauthorMarsland \significancestatementUnderstanding the origins and mechanisms underlying autoimmune diseases represents a major conceptual problem in immunology. It is now clear that regulatory T cells (Tregs) play an important role in suppressing autoimmune responses, but we lack an algorithmic understanding of how they function. Here we present a simple mathematical model that organizes known biology and suggests that Tregs implement a sophisticated optimization algorithm to prevent autoimmune responses. We propose novel experimental tests of these ideas and discuss implications of our results for autoimmune diseases. \authorcontributionsRM, AM and PM conceptualized the problem, RM, OH and PM performed analytic calculation, RM and OH performed simulations, RM and PM analyzed the results and wrote the manuscript. \authordeclarationThe authors declare no competing interest. \correspondingauthor1To whom correspondence should be addressed. marsland@bu.edu, pankajm@bu.edu
Tregs self-organize into a "computing ecosystem" and implement a sophisticated optimization algorithm for mediating immune response
Abstract
Regulatory T cells (Tregs) play a crucial role in mediating immune response. Yet an algorithmic understanding of the role of Tregs in adaptive immunity remains lacking. Here, we present a biophysically realistic model of Treg mediated self-tolerance in which Tregs bind to self-antigens and locally inhibit the proliferation of nearby activated T cells. By exploiting a duality between ecological dynamics and constrained optimization, we show that Tregs tile the potential antigen space while simultaneously minimizing the overlap between Treg activation profiles. We find that for sufficiently high Treg diversity, Treg mediated self-tolerance is robust to fluctuations in self-antigen concentrations but lowering the Treg diversity results in a sharp transition – related to the Gardner transition in perceptrons – to a regime where changes in self-antigen concentrations can result in an auto-immune response. We propose a novel experimental test of this transition in immune-deficient mice and discuss potential implications for autoimmune diseases.
keywords:
Adaptive immunity Tregs optimization ecology biophysicsThis manuscript was compiled on
The adaptive immune system of humans and other mammals solves a challenging computational problem with amazing reliability. Using only the information contained in the binding affinities between certain macromolecules, the system must distinguish potentially pathogenic cells from its own cells, in order to eliminate the former without harming the latter. While understanding how the immune system accomplishes this feat is fascinating even from a purely theoretical point of view, this problem also has many urgent practical implications since an increasing number of autoimmune diseases and allergies are thought to stem from an inability to accurately distinguish self and foreign antigens (1).
An important step forward in the effort to understand adaptive immunity came with the discovery of regulatory T cells (Tregs) (2, 3). Like all T cell phenotypes, Tregs express T cell receptors (TCR’s) on their surface, which bind to antigen peptides displayed on the surface of other cells via the major histocompatibility complex (MHC). But unlike in conventional T cells, TCR binding and activation in Tregs have the effect of suppressing T cell proliferation and cytokine production. This Treg-mediated suppression of self-activation complements negative selection in the thymus against self-reactive T cell lineages. In fact, it has been experimentally shown that even after undergoing negative selection in the thymus, T cells can raise a full immune response against native tissues if Tregs are artificially removed from the immune system (2). For all these reasons, Tregs are thought to play a critical role preventing autoimmune responses.
The problem of distinguishing self from non-self is made even harder by the requirement that the immune system must be able to reliably respond to even small amounts of foreign antigen but be robust to potentially large fluctuations in the concentrations of self-antigens. Specifically, even in the absence of foreign antigens, the immune system needs to tolerate fluctuations in the relative abundances of self-antigens, as development, circadian cycles and other natural variations in biological activities lead to very different protein expression patterns even in healthy cells.
In this paper, we propose a simple dynamical model for the interactions between conventional T cells, Tregs and antigens, which captures the essential aspects of known Treg biology. We then use this minimal model to understand how the immune system can achieve the stringent requirements described above, while simultaneously providing an algorithmic interpretation for Treg-mediated adaptive immunity. This work builds on a longstanding tradition of ecological modeling in theoretical immunology (4, 5, 6), and to our knowledge is the first application of this approach to Treg dynamics. Finally, we note that for notational brevity, in this manuscript we will always use T cells to mean conventional T cells (non-regulatory T cells).
Model Development
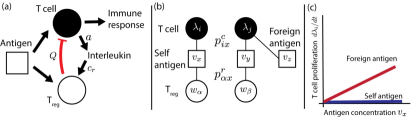
We now present a minimal model for Treg-mediated self-tolerance. As shown in Figure 1, our model has three basic components: conventional T cells, Tregs, and antigens. Upon binding an antigen, T cells enter an active state in which they begin to proliferate and to release various interleukin signaling molecules. These interleukins stimulate other immune cells, including Tregs which in turn suppress T cell proliferation (Figure 1(a)). It is known that the activation of a sufficiently large number of T cells triggers a immune response, a process likely mediated through a quorum sensing mechanism (7). We do not explicitly include this last process in the minimal model presented in the main text. Instead, we focus on the initial phase of the response and ask whether T cells will begin to proliferate in response to a foreign ligand or a change in the concentration of self ligands. We assume that sufficient proliferation will result in immune response through the processes downstream of the signaling pathways we study here. In SI Appendix (Section I), we show that the minimal model presented in the main text can be derived from a more biologically realistic mechanistic model that includes additional components.
A typical human immune system has been estimated to contain about distinct lineages of conventional T cells and a similar number of Treg lineages, each carrying a different TCR, specific to a different set of antigens (8). Labeling each T cell lineage by () and each Treg lineage by (), we can encode this diversity in the cross-reactivity functions and , which quantify the strength of interaction of conventional T cells and Tregs with possible antigens , respectively. At the most basic level, the index simply represents a unique amino acid sequence that could be displayed on the cell surface. But since T cells are known to respond to antigens in a tissue-specific manner (9), can more abstractly be thought of indexing possible tissue-antigen pairs (see SI for more details). For brevity, we will often refer to these antigen-tissue pairs by the shorthand antigen. One can visualize the cross-reactivity functions as an interaction network, with nodes corresponding to T cells, Tregs, and antigens, and edges representing the interaction strengths (see Figure 1(b) for a particularly simple example).
Our aim is to use these cross-reactivity functions to model the dynamics of the number of cells of conventional T cell lineage and the number of cells of Treg lineage . In general, these abundances will depend on antigen concentrations. We will use to denote the abundance of antigen . We will assume that the time scales on which self-antigen concentrations change is much slower than the Treg/T cell dynamics, so these will be treated as fixed quantities when we analyze T cell and Treg dynamics or find possible steady-states of T cell and Treg abundances. It turns out that this assumption is not essential to our main results, as shown in Supplementary Figure S3, because the independence of growth rates from in the emergent tiling phase implies that the same solution exists regardless of the the variations in antigen levels.
In our minimal dynamical model, T cells of lineage can be activated at a rate proportional to the cross-reactivity functions times the antigen concentration . When activated, T cells proliferate at a rate . As shown in Figure 1(b), T cell proliferation is suppressed by Tregs. Experiments indicate that Treg-mediated suppression of T cell proliferation is highly localized (10, 11). This is incorporated in our model by an antigen specific suppression level that is proportional to the abundance of Tregs activated by antigen , with a constant of proportionality . With these assumptions, conventional T cell abundances can be described using the differential equation
| (1) |
where the first term gives the abundance of T cells activated by each tissue-specific antigen , and the second term is the growth rate of activated cells.
Experiments also indicate that T cell activation stimulates proliferation of nearby Tregs (3). One potential mechanism for this interaction is the local production of interleukin signals by activated T cells. Tregs are known to be particularly sensitive to interleukin levels and to rapidly take up interleukin from their environment (12). We denote the local interleukin concentration in the vicinity of cells displaying a particular tissue-specific antigen concentration by ILx. The change in number of Tregs from lineage , , can be written as the product of the abundance of Tregs bound to a tissue-specific antigen (given by ) and an interleukin-dependent local proliferation rate (with proportionality constant ). We also assume that the in absence of interleukin Tregs die at a rate . These Treg dynamics can be summarized in the differential equation
| (2) |
In the SI Appendix (Section I) we show that Eq. 1 and Eq. 2 can be derived from a realistic mechanistic model in the limit where interleukin dynamics are assumed to be fast compared to T cell and Treg proliferation.
Surprisingly, we can rewrite these dynamics in a slightly different way that makes no explicit reference to antigens. The central objects in this formulation are the “overlap kernels” – which measure the similarity between the activation profiles of a T cell from lineage and a Treg from lineage – and – which measures the overlap between Tregs from lineages and – with
| (3) |
Notice that these overlaps depend on the cross-reactivity functions as well as the antigen concentrations. In SI Appendix (, we describe an approximation that is exact in the “emergent tiling” regime discussed below, which allows the dynamics of Eq. 1 and Eq. 2 to be written entirely in terms of the overlaps:
| (4) |
with , and . Surprisingly the explicit dependence on antigens has completely disappeared from Eq. 4. Instead, all information about antigen concentrations appears only through the overlap kernels. This is similar to the “kernel trick” in Machine Learning where all information about overlaps in a feature space can be encoded in a kernel function (13).
These new equations also naturally lend themselves to an ecological interpretation in terms of Consumer Resource Models and generalized Lotka-Volterra models. We can view T cells as exponentially growing “resources”, with growth rate , that are consumed by Tregs, with the consumption rate depending on the “resource utilization function” . Notice that the Treg dynamics in Eq. 4 take the form of a Lotka-Volterra equation. Tregs grow at a rate that depends how many resources they consume but also compete with other Tregs. The strength of competition depends on the overlap kernel . Ecologically, can be thought of as the“niche-overlap” between Tregs in antigen space. The mechanistic origins of this competition can be traced to the fact that higher niche-overlaps mean Tregs are more likely to be colocalize and hence more likely to compete for interleukins produced by T cells at a given tissue/antigen (see Fig. 1).
Results
We now analyze the implications of these dynamics in greater detail. Our analysis exploits the ecological interpretation described above by making use of our recently discovered mapping between ecological dynamics and constrained optimization (14, 15, 16). This allows us to naturally give an algorithmic interpretation of the computations performed by Tregs and identify a novel phase transition in the behavior of Treg mediated self-tolerance as a function of Treg diversity.
Tregs minimize "niche-overlap" in antigen space
If Treg and conventional T cell dynamics are fast compared to the the rate at which antigen concentrations change, we can focus on analyzing the steady-state abundances of Tregs and T cells. In this case, we can set the left hand side of equations in Eq. 4 equal to zero and the resulting steady-state equations have a natural interpretation in terms of constrained optimization. In SI Appendix (Section II), we show that the steady states of the dynamical equations Eq. 4 are equivalent to the solutions of the following the constrained optimization problem:
| (5) |
The T cell concentrations play the role of generalized Lagrange multipliers in the Karush-Kuhn-Tucker (KKT) conditions that enforce the inequality constraints above.
This optimization problem has a very beautiful biological interpretation. To see this, note that the is a measure of the similarity between Tregs. Thus, this optimization tells us that Treg populations self organize to minimize overlaps in the activation profile of Tregs. However, when performing this optimization, one must ensure that no T cell lineage can be activated in the absence of foreign ligands to prevent undesirable autoimmune responses. This last condition is represented in the inequality constraint which simply states that Treg must be able to suppress the proliferation of any T cell lineage . Equivalently, from an ecological perspective, this means that Tregs must be able to cover the potential space of activated T cells while simultaneously minimizing niche overlap between Tregs. This is analogous to niche partitioning and species packing in ecological systems (17, 18), with Treg lineages playing the roles of species and T cells playing the role of resources.
Emergent tiling is required for robust self-tolerance
The previous results relied on the overlap kernel formulation of our model. We now reanalyze these dynamics from the perspective of antigens. As discussed in the introduction, an important property of an effective immune system is that it must reliably respond to foreign antigens but also be robust to fluctuations in the concentrations of self-antigens. One simple, but biophysically unrealistic, way of achieving this robustness is depicted in Figure 1(b). The figure depicts a simple “whitelist” scenario for Treg-mediated self-tolerance, with a specialized Treg for each self-antigen and all Tregs having the same binding affinity. In such a scenario, the sums over in Eqs. (1-2) are unnecessary, since each equation contains only one term. Setting then yields uniform equilibrium Treg coverage and a uniform interleukin profile over all antigens that interact with a surviving T cell and Treg. As can be immediately seen from the equations, these conditions guarantee that proliferation rates and remain zero for all choices of the antigen concentrations . A direct consequence of this is that Treg-mediated self tolerance is robust against fluctuations in the antigen abundances. Nonetheless, if a foreign antigen is introduced that does not interact with any of the Tregs, T cells that bind to the new antigen will still proliferate at the original rate since there is no specialized Treg to inhibit their growth.
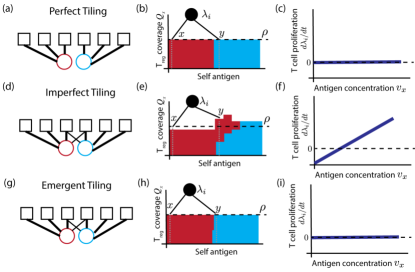
Real immune systems, however, cannot achieve this one-to-one correspondence between self-antigens and Tregs because of biophysical constraints stemming from the nature of TCR-peptide interactions (19). Figure 2 illustrates three other possible scenarios of response to fluctuations in self-antigen concentrations (Fig. 2(a-c)). In the first scenario, each Treg binds with equal strength to a different set of non-overlapping antigens. These sets perfectly tile the set of self-antigens, covering all of them without gaps or overlaps. Since each antigen interacts with only one Treg (though Tregs will generically interact with multiple antigens), a set of Treg abundances can still easily be found for which the proliferation rate vanishes everywhere. However, just as in the original whitelist example, this scenario can only achieved by requiring a biophysically implausible fine tuning of TCR-peptide binding. In the absence of such fine tuning, the system becomes sensitive to fluctuations in self-antigen abundances since generically the Treg coverage of antigen space will be uneven (Fig. 2(d-f)).
These examples suggest that the only biophysically plausible way for the immune system to achieve robustness to fluctuations in self-antigens while maintaining sensitivity to foreign antigens is to tune the relative abundances of the Tregs and T cells to produce uniform coverage and a uniform interleukin profile, with and at every antigen , despite the biophysically unavoidable overlaps between the Treg cross-reactivity functions (Fig. 2(d-f)). We call such a tilling of the antigen space an “emergent tiling.” Note that emergent tiling is generically impossible in the simple cross-reactivity network sketched here, with many antigens and only two Tregs, and the schematic is only meant to convey the idea of uniform coverage in the presence of overlaps. We now proceed to investigate the conditions for emergent tiling without fine-tuning in more complex networks.
Emergent tiling is possible above a threshold level of Treg diversity
Inserting the full expressions for and from Eqs. 1-2 into the conditions for uniform coverage discussed above (, ), we find that sufficient conditions for a stable emergent tiling solution can be written as
| (6) |
where as before runs over Treg lineages, over T cell lineages, and over possible self antigens. Note that we have used the first condition to simplify the expression for in the second. When a solution to these equations exists, it also solves the optimization problem stated in Eqs. 5 above, but this is not immediately clear from the formulation in terms of overlaps. In SI Appendix (Section II), we perform a series of duality transformations to rewrite the optimization problem in such a way that Eqs. 6 naturally arise. In general, whether these conditions can be satisfied will depend on the dimensionality of the space we are working in (i.e. the number of Tregs , the number of T cells , the number of tissue specific antigens , and the structure of the cross-reactivity function).
The question of whether the Treg dynamics achieve emergent tiling is thus reduced to the question of whether the equations in Eq. 6 have solutions. We begin by investigating the simplest kind of cross-reactivity function, where the entries of the matrix and are independently drawn from a Bernoulli distribution. ( As we discuss below, real cross-reactivity functions are much more complicated than this but it is helpful theoretically to start with this simple model to gain intuition. This problem has been considered in various contexts including the theory of perceptrons (a simple model of statistical learning) and more recently in the context of ecology (20, 21, 22). In fact, it is possible to show that in high dimensions when a solution generically exists if there are at least twice as many T cell and Treg lineages as types of antigens: and and no solution exists if the opposite is true. These two regimes are separated by a phase transition known as the Gardner transition in the statistical physics literature (20, 23, 22). We give a brief overview of this relation in SI Appendix (Section IIID).
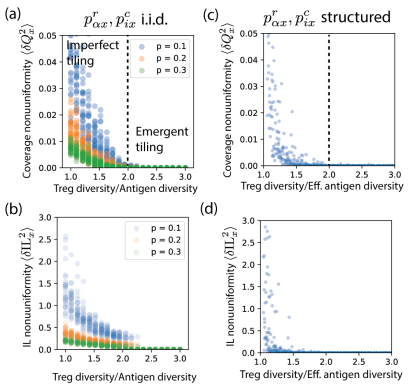
In Figure 3(a)-(b), we plot the equilibrium deviations from uniform Treg coverage and from uniform interleukin concentration as a function of the ratio , for randomly generated cross-reactivity functions with antigens, with sampled from Bernoulli distributions with three different probabilities of interaction. To make these plots, we solved the corresponding constrained optimization problem (Eq. 5) using standard numerical techniques for convex optimization (see SI Appendix Section IV). We see that in all cases, the nonuniformity vanishes near the predicted transition point .
To determine the number of Treg lineages needed to achieve emergent tiling, we must estimate the number of distinct self-antigens . The maximum number of cleavage points for creating a peptide for display on the MHC is the total number of codons () in the coding regions of the human genome. Since some of these peptides are redundant, and only a fraction can be successfully cleaved and loaded onto MHC’s, a conservative upper bound would have 10 percent of the possible cleavage sites result in displayed peptides, yielding . This number is the same order of magnitude as the observed Treg diversity, which has been estimated at (8). It is therefore not implausible that in real immune systems.
However, biologically realistic cross-reactivity functions differ significantly from the i.i.d cases described above since antigens with similar shapes bind to similar sets of receptors. Receptor affinities in TRegs and conventional T cells are shaped through a complex process of positive and negative selection in the Thymus. For example, experiments suggest that Tregs may in fact have higher affinity for self antigens than conventional T cells (24). In general, quantitatively understanding cross-reactivity functions in different cell types is an important open problem. In light of this incredible and unknown complexity, we sought to ask if the intuition above also holds for slightly more biologically realistic scenarios. To do so, we used a toy-models for cross-reactivity based on antigen low-dimensional shape spaces that have been extensively used in the statistical physics literature to model TCR repertoires (25). Fig. 3(c)-(d) shows numerical simulations of a one-dimensional shape space with antigens. Each of Tregs and conventional T cells binds to a group of similar antigens, with , where the center of the group or is randomly chosen for each Treg and T cell , and the width is the same for all lineages in a given simulation run (see SI Appendix for details). Since the antigens are now “correlated”, instead of the absolute number of antigens it is useful do define an effective antigen dimension . We define as the effective rank of the cross-reactivity matrix , that is, the number of singular values that exceed a cutoff threshold . The effective number of antigens decreases from to 97 as varies from 10 to 100. When we plot the nonuniformity and as a function of , we see a very similar pattern to the i.i.d. case, with reliable emergent tiling for . As a further check on our model, we also ran simulations when the cross-reactivities are drawn from a five-dimensional shape space (see SI Appendix Section IV, Fig. S4 and Fig. S5). Once again, we found that an emergent tiling phase when . We also ran simulations to check what happens when we allow the “antigen concentrations” to vary in time. SI Appendix, Fig. S3 show simulations from our full model when is allowed to rapidly oscillate in time. Somewhat surprisingly, we find that the dynamics still self-organizes into an emergent tiling phase despite the fact that Treg and Tcell abundances no-longer reach a steady-state. Collectively, these results suggest that the existence of the emergent tiling phase is a robust feature of this class of models. Finally, we note that for more biologically realistic choices of the cross-reactivity matrices while the exact ratio of Treg to antigen diversity at which the transition to the emergent tiling phase occurs may change, general arguments from statistical mechanics suggest that such a phase will exist even in these more complex settings.
Proposed experimental test of emergent tiling transition
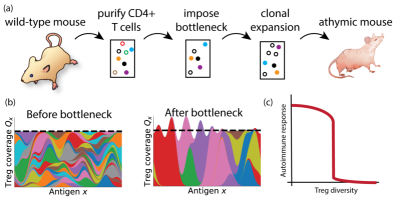
A key prediction of our previous analysis is that lowering the Treg diversity results in a sharp transition to a regime where changes in self-antigen concentrations can result in an auto-immune response (see Fig. 3). We now propose an experimental test of this prediction by repurposing a classical immunological experimental design previously used to discover Treg function (see Fig. 4). In the original experiments T cells (including both Tregs and conventional T cells) were transferred from the spleen and/or lymph nodes of a mouse with a functioning thymus to another mouse from a strain (“athymic nude”) homozygous for a mutation that renders it congenitally incapable of producing any kind of T cell (2, 10). If all the T cells are transferred together, the recipient mouse remains healthy. But if the Tregs are eliminated from the population, with only the conventional T cells injected into the recipient, severe autoimmune syndromes result in multiple organs.
In the decades since these original studies were carried out, new techniques have been developed that make it possible to modulate and assess the impact of Treg repertoire diversity. First of all, it was shown that Tregs can undergo clonal expansion in vitro after co-culture with dendritic cells (26). Specific Treg clones can be expanded using known receptor-antigen pairs, or all the Tregs can be expanded together, nonspecifically, by loading the dendritic cells with antibodies against CD3, one of the components of the TCR, which effectively acts like a universal antigen. Secondly, repertoire diversity can be directly measured with high-throughput sequencing of the TCR genes (8, 27, 28).
These two techniques together allow one to envision experiments with Treg ecology analogous to existing methods in microbial ecology (29). In particular, one could reduce the Treg repertoire diversity by imposing a population bottleneck. Clonal expansion could then be applied to bring the total cell count back to the original level, before injecting the cells into the recipient organism. Receptor sequencing of the post-expansion cells makes it possible to quantify the final Treg diversity, and calibrate the bottleneck to achieve a range of diversity levels.
Our theory predicts that emergent tiling is required for robust self-tolerance, and that emergent tiling is only possible if the Treg diversity exceeds a certain threshold, which is larger than the bare minimum level required to simply cover all the self-antigens. If the diversity is reduced to sufficiently low levels, the Treg populations can only achieve imperfect tiling, and conventional T cell proliferation can be induced by natural fluctuations in self-antigen concentrations. Measures of autoimmune activity, such as concentrations of antibodies against self-peptides from various organs (10), should therefore show a strong negative correlation with the number of distinct Treg clones injected into the athymic mouse, with a sharp Treg diversity threshold below which there is an autoimmune response.
Comparison with Existing Data
Our model also makes several qualitative predictions that can be compared with existing experimental observations. First of all, we predict that autoimmune disorders can be caused by genetic mutations that significantly restrict the Treg TCR repertoire but otherwise leave the immune system intact. This prediction has been confirmed in non-obese diabetic (NOD) mice, a standard animal model for type I diabetes (30). These mice spontaneously develop an autoimmune disorder whereby the immune system destroys the insulin-producing cells in the pancreas. An assay of thymic TCR repertoires from these mice revealed that the diversity of insertions/deletions in one subfamily of -chain V domains was between 5 and 8 times smaller for Tregs than for conventional T cells, while the diversity levels of the two lineages were similar (within a factor of 2) for wild-type (C57BL/6) mice. Furthermore, the NOD mice only expressed between five and eight of the 49 functional -chain J domains in the mouse genome, as compared to more than 20 in each of the wild-type mice, resulting in a further repertoire restriction. This data suggests that the genetic defects of the NOD mice lead to excessively stringent thymic selection criteria for commitment to the Treg lineage, resulting in a Treg repertoire size below the threshold for emergent tiling.
The relationship between Treg diversity and self-tolerance has also been tested using transgenic mice engineered to eliminate all variation in the TCR chain (31). In a similar setup to the one proposed above, a strain of mice that is congenitally deficient in Tregs (due to deletion of the Treg interleukin receptor) is injected with Tregs purified from either a wild-type mouse or one of the low-TCR-diversity transgenic mice. While the Tregs from the wild-type mouse reliably prevented autoimmune pathologies, most of the grafts from the low-diversity transgenic mice resulted in some autoimmune symptoms. The low-diversity Treg injection was sufficient, however, to keep five out of 16 mice healthy for the duration of the experiment. This suggests that the constricted Treg repertoire of the transgenic mice may have been sufficient to provide full coverage of self-antigens but too small to achieve emergent tiling. Our model predicts that diversity levels in this range can provide some short-term protection against autoimmunity, especially in a highly controlled laboratory setting, but that this protection is easily lost due to changes in relative antigen abundances .
In this same series of Treg transfer experiments, the authors also explored some features of the Treg population dynamics. By quantifying the frequencies of individual V2 CD3 sequences before injection into the host and at several time points afterwards, they showed that the relative population sizes of Treg clones changed dramatically over the course of three months (31). Many of the dominant clones at the end of the experiment were extremely rare at the beginning, while initially dominant clones were nearly driven to extinction. This repertoire reshaping agrees with the predictions of our model, where the high interleukin levels in Treg-deficient mice lead to rapid proliferation of the exogenous Tregs, with the proliferation rates of different clones highly dependent on the distribution of displayed self-antigens within the host.
Finally, our model makes predictions about the results of injecting exogenous Tregs into an animal whose own Treg populations are already established. If the recipient has high enough Treg diversity to achieve emergent tiling, the uniform interleukin profile barely meets the minimum level required for proliferation. This means that no new Tregs will be able to proliferate, regardless of their binding specificity. If the recipient is not in the emergent tiling phase, however, some of the local interleukin levels will be sufficient to support net proliferation, and novel Tregs specific for the corresponding antigens will be able to invade. This prediction is consistent with experiments on TCR transgenic mice with Treg diversity reduced to about half the level of the wild-type (32). When Tregs from wild-type mice were injected into these transgenic mice, they proliferated and eventually made up more than 20% of the overall Treg population in the recipient. But when Tregs from the transgenic mice were injected into the wild-type, no proliferation was observed.
All these qualitative observations admit of many possible explanations, but together they demonstrate the power of our model for providing a single underlying biologically realistic mechanism that is parsimonious with a wide range of experimental data on Treg function.
Discussion
In this work, we have constructed a minimal model of Treg-mediated self-tolerance that is consistent with known biological and experimental facts. Specifically, our model reflects the empirical observation that Tregs suppress the proliferation of conventional T cells via a highly local mechanism (11, 10), which depends on the binding specificity of the Treg TCR (33, 34). This feature of the biology makes the overlap between binding profiles of Tregs and conventional T cells a crucial quantity in the analysis of Treg function. Our model also accounts for the dependence of Treg proliferation on local concentrations of interleukins generated by activated conventional T cells (3, 12). It has long been recognized that this stimulatory effect of conventional T cells on Tregs completes a homeostatic feedback loop (see Fig. 2 of (3)). But the fact that interleukin is internalized and degraded after binding to a Treg’s interleukin receptor (12) allows us to formulate a more specific hypothesis: that Treg population dynamics can be modeled using classical resource competition theory, with local interleukin pools acting as scarce limiting resources. This analogy highlights the role of the overlap between Treg binding profiles as a second crucial quantity, and enables us to analyze the Treg behavior in terms of the ecological concepts of species packing and niche partitioning (17).
We have shown that the resulting immune dynamics have a natural interpretation in terms of optimization. We also find that for sufficiently high Treg diversities, this simple dynamics allows Tregs to self-organize into a state that allows the immune system to retain sensitivity to foreign ligands while simultaneously being robust to fluctuations in the concentrations of self antigens.
The high Treg diversity required for emergent tiling helps explain the otherwise surprising fact that Tregs contain a similar number of distinct TCR’s as conventional T cells, even though the Tregs only need to interact with peptides from the human genome, while the conventional T cells must cover all possible pathogens (8). Even though a much smaller number of Treg lineages would be sufficient to cover all the self-antigens, emergent tiling in our simple models requires , with in the human immune system.
This theory raises a number of further questions, which we do not address here. The first concerns the specific requirements for maintaining pathogen sensitivity. While the repertoire of conventional T cells in an ideal immune system should cover all possible foreign antigens, the repertoire of Tregs must have some gaps in coverage in order to leave the system free to respond to at least some subset of foreign antigens. It has been observed that high-affinity antigen binding is associated with commitment to the Treg phenotype, suggesting a difference in positive and/or negative selection thresholds between Tregs and other phenotypes (3, 35, 36). This seems to be a natural way of achieving this difference in coverage, and understanding the details of how this might be achieved is an important area of future research. Doing so will require us to move beyond the simple shape space models for cross-reactivity used in this work and consider more biophysically realistic models for antigen-TCR binding.
Another interesting question is about the acquisition of tolerance to foreign peptides. The immune system is tolerant to many things that are not presented in the thymus when the Tregs are generated, such as peptides from various foods, and commensal microbes (37). Tolerance can also be acquired later in life. There is evidence that Tregs can be generated from other T cell lineages in the periphery, and not just in the thymus (37, 3). This raises the possibility that the Treg repertoire may be adaptively repopulated on a slow timescale with new lineages that interact with such non-self peptides.
Our theoretical framework allows us to generate hypotheses about causes of natural autoimmune disorders. One robust observation that has yet to be explained is the de novo onset of autoimmune syndromes in people with persistent viral infections (38). A possible reason for this is that the characteristics of a persistent infection somehow do not allow for adaptation via generation of new Tregs that specifically bind to the viral antigen, and so existing Treg populations end up clonally expanding to inhibit the responding conventional T cells with which they share a partial overlap. Since the conventional T cells can proliferate on binding to viral antigen without local Treg-mediated suppression, larger populations of partially overlapping Tregs are required to maintain a global net proliferation rate of zero. But this process naturally breaks the emergent tiling needed for robustness, and thus could produce increased sensitivity to fluctuations in self-antigen levels. In the future, it will be interesting to further explore this scenario to better understand if it can increase our understanding of autoimmune diseases.
Please see SI Appendix for detailed Materials and Methods. Briefly, we constructed a detailed, biologically realistic model for the immune dynamics of Tregs, conventional T cells, and interleukins. Our model relied of experimentally supported biological assumptions that we outline in detail in the SI. We then derived the minimal model in Eq. 1 and Eq. 2 presented in the main text by assuming interleukin dynamics were fast compared to T cell and Treg proliferation rates and that interleukin consumption of Tregs is much larger than those of conventional T cells. By exploiting the ecological interpretation of this minimal model, we derived a dual representation of this model in terms of optimization (Eq. 5). We then used Eq. 5 to derive sufficient conditions for emergent tiling using a series of duality transformations. To check these analytic results, we performed numerical simulations of both the dynamical models and corresponding optimization problems. All code in the accompanying github repository https://github.com/Emergent-Behaviors-in-Biology/immune-svm.
We are extremely grateful to Arup Chakraborty for many useful conversations and suggestions on this work, and to Rustom Antia for advice and encouragement in the early phases of the project. This work was funded by a Simons Investigator in MMLS award and NIH NIGMS R35GM119461 grant to PM.
References
- (1) L Wang, FS Wang, ME Gershwin, Human autoimmune diseases: a comprehensive update. \JournalTitleJournal of Internal Medicine 278, 369–395 (2015).
- (2) S Sakaguchi, K Fukuma, K Kuribayashi, T Masuda, Organ-specific autoimmune diseases induced in mice by elimination of T cell subset. I. Evidence for the active participation of T cells in natural self-tolerance; deficit of a T cell subset as a possible cause of autoimmune disease. \JournalTitleThe Journal of Experimental Medicine 161, 72–87 (1985).
- (3) S Sakaguchi, T Yamaguchi, T Nomura, M Ono, Regulatory T cells and immune tolerance. \JournalTitleCell 133, 775–787 (2008).
- (4) RJ De Boer, AS Perelson, T cell repertoires and competitive exclusion. \JournalTitleJournal of Theoretical Biology 169, 375–390 (1994).
- (5) SA Levin, B Grenfell, A Hastings, AS Perelson, Mathematical and computational challenges in population biology and ecosystems science. \JournalTitleScience 275, 334–343 (1997).
- (6) A Mayer, V Balasubramanian, T Mora, AM Walczak, How a well-adapted immune system is organized. \JournalTitleProceedings of the National Academy of Sciences 112, 5950–5955 (2015).
- (7) TC Butler, M Kardar, AK Chakraborty, Quorum sensing allows T cells to discriminate between self and nonself. \JournalTitleProceedings of the National Academy of Sciences 110, 11833–11838 (2013).
- (8) N Fazilleau, H Bachelez, ML Gougeon, M Viguier, Cutting edge: size and diversity of CD4+ CD25high Foxp3+ regulatory T cell repertoire in humans: evidence for similarities and partial overlapping with CD4+ CD25- T cells. \JournalTitleThe Journal of Immunology 179, 3412–3416 (2007).
- (9) DJ Campbell, CH Kim, EC Butcher, Chemokines in the systemic organization of immunity. \JournalTitleImmunological Reviews 195, 58–71 (2003).
- (10) S Sakaguchi, N Sakaguchi, M Asano, M Itoh, M Toda, Immunologic self-tolerance maintained by activated T cells expressing IL-2 receptor alpha-chains (CD25). Breakdown of a single mechanism of self-tolerance causes various autoimmune diseases. \JournalTitleThe Journal of Immunology 155, 1151–1164 (1995).
- (11) T Takahashi, et al., Immunologic self-tolerance maintained by CD25+ CD4+ naturally anergic and suppressive T cells: induction of autoimmune disease by breaking their anergic/suppressive state. \JournalTitleInternational Immunology 10, 1969–1980 (1998).
- (12) TR Malek, The biology of interleukin-2. \JournalTitleAnnu. Rev. Immunol. 26, 453–479 (2008).
- (13) CM Bishop, Pattern Recognition and Machine Learning. (Springer), (2006).
- (14) P Mehta, W Cui, CH Wang, R Marsland III, Constrained optimization as ecological dynamics with applications to random quadratic programming in high dimensions. \JournalTitlePhysical Review E 99, 052111 (2019).
- (15) OL Howell, W Cui, RM III, P Mehta, Machine learning as ecology. \JournalTitleJournal of Physics A: Mathematical and Theoretical in press (2020).
- (16) RM III, W Cui, P Mehta, The minimum environmental perturbation principle: A new perspective on niche theory. \JournalTitleThe American Naturalist in press (2020).
- (17) R MacArthur, Species packing, and what competition minimizes. \JournalTitleProceedings of the National Academy of Sciences 64, 1369 (1969).
- (18) R MacArthur, Species Packing and Competitive Equilibrium for Many Species. \JournalTitleTheoretical Population Biology 1, 1 (1970).
- (19) AK Sewell, Why must T cells be cross-reactive? \JournalTitleNature Reviews Immunology 12, 669–677 (2012).
- (20) E Gardner, The space of interactions in neural network models. \JournalTitleJournal of physics A: Mathematical and general 21, 257 (1988).
- (21) H Nishimori, Statistical Physics of Spin Glasses and Information Processing. (Oxford University Press, New York, NY), (2001).
- (22) S Landmann, A Engel, Systems of random linear equations and the phase transition in MacArthur’s resource-competition model. \JournalTitleEurophysics Letters 124, 18004 (2018).
- (23) E Gardner, Maximum storage capacity in neural networks. \JournalTitleEPL (Europhysics Letters) 4, 481 (1987).
- (24) CS Hsieh, HM Lee, CWJ Lio, Selection of regulatory t cells in the thymus. \JournalTitleNature Reviews Immunology 12, 157–167 (2012).
- (25) G Altan-Bonnet, T Mora, AM Walczak, Quantitative immunology for physicists. \JournalTitlePhysics Reports 849, 1–83 (2020).
- (26) S Yamazaki, et al., Direct expansion of functional CD25+ CD4+ regulatory T cells by antigen-processing dendritic cells. \JournalTitleThe Journal of Experimental Medicine 198, 235–247 (2003).
- (27) AM Sherwood, et al., Deep Sequencing of the Human TCR and TCR Repertoires Suggests that TCR Rearranges After and T Cell Commitment. \JournalTitleScience Translational Medicine 3, 90ra61 (2011).
- (28) A Six, et al., The past, present, and future of immune repertoire biology – the rise of next-generation repertoire analysis. \JournalTitleFrontiers in Immunology 4, 413 (2013).
- (29) R Tecon, et al., Bridging the holistic-reductionist divide in microbial ecology. \JournalTitlemSystems 4 (2019).
- (30) C Ferreira, et al., Non-obese diabetic mice select a low-diversity repertoire of natural regulatory t cells. \JournalTitleProceedings of the National Academy of Sciences 106, 8320–8325 (2009).
- (31) D Adeegbe, T Matsutani, J Yang, NH Altman, TR Malek, Cd4+ cd25+ foxp3+ t regulatory cells with limited tcr diversity in control of autoimmunity. \JournalTitleThe journal of immunology 184, 56–66 (2010).
- (32) L Föhse, et al., High tcr diversity ensures optimal function andhomeostasis of foxp3+ regulatory tcells. \JournalTitleEuropean journal of immunology 41, 3101–3113 (2011).
- (33) S Hori, M Haury, A Coutinho, J Demengeot, Specificity requirements for selection and effector functions of cd25+ 4+ regulatory t cells in anti-myelin basic protein t cell receptor transgenic mice. \JournalTitleProceedings of the National Academy of Sciences 99, 8213–8218 (2002).
- (34) D Olivares-Villagómez, AK Wensky, Y Wang, JJ Lafaille, Repertoire requirements of cd4+ t cells that prevent spontaneous autoimmune encephalomyelitis. \JournalTitleThe Journal of Immunology 164, 5499–5507 (2000).
- (35) A Košmrlj, AK Jha, ES Huseby, M Kardar, AK Chakraborty, How the thymus designs antigen-specific and self-tolerant t cell receptor sequences. \JournalTitleProceedings of the National Academy of Sciences 105, 16671–16676 (2008).
- (36) A Košmrlj, AK Chakraborty, M Kardar, EI Shakhnovich, Thymic selection of t-cell receptors as an extreme value problem. \JournalTitlePhysical review letters 103, 068103 (2009).
- (37) JL Coombes, et al., A functionally specialized population of mucosal CD103+ DCs induces Foxp3+ regulatory T cells via a TGF-–and retinoic acid–dependent mechanism. \JournalTitleThe Journal of Experimental Medicine 204, 1757–1764 (2007).
- (38) S Kivity, N Agmon-Levin, M Blank, Y Shoenfeld, Infections and autoimmunity–friends or foes? \JournalTitleTrends in Immunology 30, 409–414 (2009).