The Ophiuchus DIsc Survey Employing ALMA (ODISEA)–III: the evolution of substructures in massive discs at 3-5 au resolution
Abstract
We present 1.3 mm continuum ALMA long-baseline observations at 3-5 au resolution of 10 of the brightest discs from the Ophiuchus DIsc Survey Employing ALMA (ODISEA) project. We identify a total of 26 narrow rings and gaps distributed in 8 sources and 3 discs with small dust cavities (r 10 au). We find that two discs around embedded protostars lack the clear gaps and rings that are ubiquitous in more evolved sources with Class II SEDs. Our sample includes 5 objects with previously known large dust cavities (r 20 au). We find that the 1.3 mm radial profiles of these objects are in good agreement with those produced by numerical simulations of dust evolution and planet-disc interactions, which predict the accumulation of mm-sized grains at the edges of planet-induced cavities. Our long-baseline observations resulted in the largest sample of discs observed at 3-5 au resolution in any given star-forming region (15 objects when combined with Ophiuchus objects in the DSHARP Large Program) and allow for a demographic study of the brightest of the discs in Ophiuchus (i.e. the most likely formation sites of giant planets in the cloud). We use this unique sample to propose an evolutionary sequence and discuss a scenario in which the substructures observed in massive protoplanetary discs are mainly the result of planet formation and dust evolution. If this scenario is correct, the detailed study of disc substructures might provide a window to investigate a population of planets that remains mostly undetectable by other techniques.
keywords:
protoplanetary discs — circumstellarmatter — stars:pre-main-sequence — submillimetre: planetary systems — techniques: interferometric1 Introduction
Understanding how the diverse populations of protoplanetary discs in young stellar regions results in the range of exoplanet types and architectures found in the Galaxy is one of the major goals of planet-formation theory. This is an extremely challenging task due in part to the limited observational constraints available. The Atacama Large Millimeter/submillimeter Array (ALMA) is providing truly transformational images of protoplanetary discs with unprecedented sensitivity and resolution (Andrews 2020). However, millimeter wavelength images reveal the locations of small dust grains but provide little information on the presence of larger particles, beyond centimeter scales. Gas giant planets are mostly made of hydrogen and helium, which ALMA cannot directly observe; therefore, the information on the gas content relies on the observations of less abundant molecules, such as CO and its isotopologues, that are subjected to uncertain depletion processes in the gas-phase (e.g., Miotello et al. 2016). Planets might be detectable by ALMA, although indirectly, by the effects they have on the gas and/or dust in the disc. When planets become massive enough, they can carve gaps (e.g., Rice et al. 2006; Zhu et al. 2012; Pinilla et al. 2012) and disturb the dynamics of the gas (Teague et al. 2018; Pinte et al. 2019; Casassus & Pérez 2019). The minimum gap-opening mass depends on the viscosity and scale-height of the disc (Crida et al. 2006; Duffell & MacFadyen 2013), but mini-Neptune-mass (Pérez et al. 2019) or even Earth-mass planets (Rosotti et al. 2016; Dong & Fung 2017) could produce detectable gaps. Gaps consistent with fully-formed planets have been imaged by ALMA in discs with estimated ages ranging from 1 Myr (HL Tau and Elias 2-24; ALMA Partnership et al. 2015; Cieza et al. 2017) to 10 Myr (TW Hydra; Andrews et al. 2016). However, the origin of these gaps still remains to be established and several alternative explanations have been proposed, including the effect of snow-lines on the dust/gas evolution of different volatiles (Zhang et al. 2015), magneto-hydrodynamic effects (Flock et al. 2015), secular gravitational instability (e.g., Youdin 2011; Takahashi & Inutsuka 2014), and viscous ring-instabilities (Dullemond & Penzlin 2018). Each one of the proposed mechanisms has their merits and shortcomings, and it is possible that different mechanisms operate together or dominate in different objects or in the same object at at different times. For a recent review on disc (sub)structures, see Andrews (2020). Substructures are also expected to be ubiquitous in protoplanetary discs from a theoretical point of view. Without substructures to halt the migration of mm-size grains at large radii, dust particles should migrate toward the innermost part of the disc in timescales shorter than 0.1 Myr (e.g., Brauer et al. 2007), which is inconsistent with the observations showing significant mm emission at large radii (10 au) at much older ages. Understanding the origin and evolution of substructures in protoplanetary discs and their implications for planet formation is currently one the main challenges in the field. To better understand the incidence and properties of disc substructures in any given molecular cloud, here we present 1.3 mm/230 GHz continuum ALMA long-baseline observations at 3-5 au resolution of the 10 brightest targets of the "Ophiuchus DIsc Survey Employing ALMA" (ODISEA) project (Cieza et al. 2019) that were not included in "The disc Substructures at High Angular Resolution Project" (DSHARP) ALMA Cycle-4 Large Program (Andrews et al. 2018). Our new observations result in the largest sample of disc images at 3-5 au resolution in any star-forming region observed so far at mm wavelengths (15 objects when combined with the brightest Ophiuchus objects in DSHARP). In Section 2, we discuss the sample selection, the long-baseline observations, and the data reduction. In Section 3, we characterize the observed substructures, including gaps, rings, inner discs, and cavities. In Section 4, we discuss individual objects and use the full sample of 15 bright Ophiuchus discs observed at high-resolution to construct a tentative evolutionary sequence in which the observed substructures are mostly driven by dust evolution and the formation of giant planets. We also discuss possible connections between the substructures observed in primordial discs and those seen in more evolved debris disc systems. A summary of our results and conclusions is presented in Section 5.
2 Sample selection, observations and data reduction
2.1 Sample Selection
All our long-baseline ALMA Cycle-6 targets were selected from the original “Ophiuchus Disc Survey Employing ALMA” (ODISEA) sample (Cieza et al. 2019; Williams et al. 2019). ODISEA started as a Band-6 (1.3mm/225 GHz) continuum and CO line imaging survey in ALMA Cycles 4 and 5 (PIDs = 2016.1.00545.S; 2017.1.00007.S), aiming to study both the gas and dust components of the entire population of discs identified by the Spitzer Legacy Project “Cores to Discs" (Evans et al. 2009) in the Ophiuchus star-forming region. With almost 300 Spitzer-identified Young Stellar Object (YSOs) candidates, Ophiuchus contains the largest disc population of all nearby (d 200 pc) star-forming regions. Ophiuchus is also a particularly interesting region to study disc evolution because it presents objects in a wide range of evolutionary stages, from Class I to Class III (see Sec. 2.2 for a detailed discussion on YSO classification). Some of the main results of ODISEA so far are that most protoplanetary discs in Ophiuchus have much lower dust masses (median mass Class II sources 1 M⊕; Williams et al. 2019) and smaller dust disc radii (r 15 au; Cieza et al. 2019) than previously thought, and that visual binaries (a 10-200 au) mostly affect the upper end in the size and mass distributions, leaving typical discs largely unaffected (Zurlo et al. 2020a).
| Name | c2d designation | SED Class | Gaia Ra | Gaia Dec | Gaia Dist. | Gaia | Gaia | F1.3mm | Project | ||
|---|---|---|---|---|---|---|---|---|---|---|---|
| (SSTc2d J+) | (deg) | (deg) | (pc) | (mas y-1) | (mas y-1) | (mJy) | |||||
| (1) | (2) | (3) | (4) | (5) | (6) | (7) | (8) | (9) | (10) | (11) | |
| ISO-Oph 54 | 162640.5-242714 | 0.45 | I | … | … | … | … | … | 97 | ODISEA | |
| WLY 2-63 | 163135.6-240129 | 0.14 | FS | … | … | … | … | … | 335 | ODISEA | |
| ISO-Oph 37 | 162623.6-242439 | -0.01 | FS | … | … | … | … | … | 139 | ODISEA | |
| ISO-Oph 17 | 162610.3-242054 | -0.46 | II/Full | … | … | … | … | … | 173 | ODISEA | |
| EM* SR4 | 162556.1-242048 | -0.60 | II/PTD | 246.4839894 | -24.3468477 | 1342.0 | -7.48 | -26.61 | 70 | DSHARP | |
| DoAr 44 | 163133.4-242737 | -0.61 | II/PTD | 247.8894038 | -24.4604259 | 1461.0 | -6.10 | -24.21 | 85 | ODISEA | |
| Elias 2-27 | 162645.0-242308 | -0.64 | II/Full | 246.6875951 | -24.3856199 | 11615 | -8.21 | -27.28 | 313 | DSHARP | |
| Elias 2-24 | 162624.1-241613 | -0.71 | II/Full | 246.6003316 | -24.2705088 | 1363.0 | -8.83 | -24.20 | 361 | DSHARP | |
| Elias 2-20 | 162618.9-242820 | -0.73 | II/Full | 246.5786169 | -24.4722560 | 1385.0 | -8.99 | -27.34 | 96 | DSHARP | |
| WSB 82 | 163945.4-240204 | -0.73 | II/Full | 249.9393177 | -24.0345083 | 1552.4 | -6.04 | -22.28 | 191 | ODISEA | |
| ISO-Oph 2 | 162538.1-242236 | -0.79 | II/PTD | 246.4088384 | -24.3768303 | 1449.5 | -5.50 | -25.18 | 72 | ODISEA | |
| ISO-Oph 196 | 162816.5-243658 | -0.80 | II/Full | 247.0687710 | -24.616238 | 1372.4 | -7.14 | -25.83 | 98 | ODISEA | |
| EM* SR 24S | 162658.5-244537 | -0.92 | II/PTD | 246.7437779 | -24.7603309 | 1154.5 | 3.50 | -31.82 | 180 | ODISEA | |
| DoAr 25 | 162623.7-244314 | -1.12 | II/Full | 246.5986758 | -24.7206373 | 1383.0 | -7.83 | -26.29 | 239 | DSHARP | |
| RX J1633.9-2442 | 163355.6-244205 | -1.22 | II/TD | 248.4817058 | -24.7014913 | 1411.4 | -4.89 | -23.37 | 80 | ODISEA |
(4): SED classes as defined in Sec. 2.2. (7): a distance of 140 pc is adopted for all targets without a Gaia distance. (10): fluxes from Cieza et al. (2019).
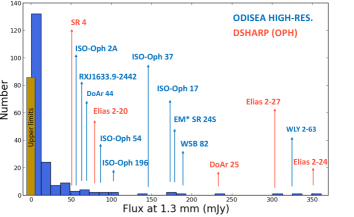
Fig. 1 shows the histogram of 1.3 mm fluxes of all ODISEA objects. The median flux in the distribution is only 2 mJy, but there is a long tail of bright discs extending to 350 mJy. In particular, there are 16 objects brighter than 70 mJy. Five of them (SR4, Elias 2-20, DoAr 25 and Elias 2-27 and Elias 2-24) are part of the DSHARP ALMA Cycle-4 program (Andrews et al. 2018) and were already observed at 5 au resolution. One additional source (ISO-Oph 167) is a binary system with two compact discs that were barely resolved by our 0.2′′ resolution observations (ODISEA 105 target shown in Fig 5 in Cieza et al. 2019) and was excluded from our long-baseline observations. We note that archival ALMA Band-6 data of this system at 0.1′′ (14 au) resolution (PID = 2016.1.001042.S) indicate that the primary and secondary sources are only 0.14′′ and 0.2′′ in size (FWHM) and the discs lack any clear substructures, but we otherwise exclude ISO-Oph 167 from the rest of the paper as it lacks data at 3-5 au resolution.
The other 10 ODISEA objects brighter than 70 mJy that are not part of DSHARP constitute the “ODISEA long-baseline sample". The DSHARP project observed a total of 20 discs in several star forming regions, but their sample was restricted to Class II sources and also excluded “transition” discs with known dust cavities. When discussing the demographics of massive discs in Ophiuchus (Sec. 4), we focus on the properties of a flux-limited sample (with the exception of ISO-Oph 167 noted above) and refer to the “Ophiuchus long-baseline sample", which is the combination of the 10 objects in the “ODISEA long-baseline sample" and the 5 Ophiuchus objects in DSHARP listed above. The 15 objects in the “Ophiuchus long-baseline sample" are listed in Table 1.
2.2 Spectral Energy Distributions
Since the advent of space-based mid-IR photometry with IRAS and ISO, YSOs have been classified based on the slope () of the spectral energy distribution (SED) between 2 and 20 m (Lada 1987). Several classifications schemes exists, but we adopt the following definitions from Williams & Cieza (2011):
-
Class I : +0.3
-
Flat Spectrum (FS): +0.3 -0.3
-
Class II: -0.3 -1.6
-
Class III: -1.6
These IR SED classes are well correlated with evolutionary stages, where Class I sources typically are very young ( 0.5 Myr, Evans et al. 2009) protostars still embedded in their natal envelopes and Class II sources are mostly optically revealed YSOs with significant mid-IR emission arising from their discs. Flat Spectrum sources are intermediate cases between the two. However, we note that foreground extinction and disc inclination can change the SED of a YSO, rendering the SED classification an imperfect indicator of evolutionary stage.
YSO surveys have shown a large diversity of IR SEDs and the need for expanding the original classification scheme (Espaillat et al. 2014). In particular, Class II objects with identical values might show very different SED morphologies at intermediate wavelengths in between 2 and 20 m. Since such a diversity is clearly present in our small sample of Class II targets, we further classify them as follows:
-
Full discs: SED between 2 - 24 m remains completely within the quartiles defined for Class II sources by Ribas et al. (2017).
-
Pre-transition discs (PTD): Class II sources with significant IR excess at 4.5 m ([3.6]-[4.5] 0.25) from an inner disc, but with a mid-IR SED falling below the the quartiles defined for Class II sources, indicating the presence of a large gap.
-
Transition discs (TD): Class II sources without significant IR excess at 4.5 m (i.e. [3.6]-[4.5] 0.25, Cieza et al. 2010), indicating depleted inner dust discs.
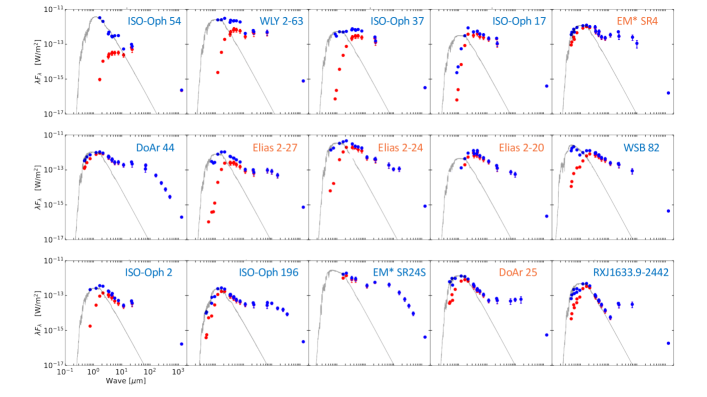
The values taken from Evans et al. (2009) and the SED classifications (as discussed above) are also listed in Table 1. While these classifications are purely observational, they do provide relevant information regarding the evolutionary status of the systems (see Sec. 4.2.4). We note that there are no Class III sources in the ODISEA long-baseline sample, implying that massive and large/cold discs with very weak mid-IR excesses are rare. The SEDs of the 15 objects in the Ophiuchus long-baseline sample (from the optical to the mm) are shown in Fig. 2. The SED include data from Gaia (Gaia Collaboration et al. 2018), Pan-STARRS (Chambers et al. 2016), 2MASS (Cutri et al. 2003), WISE (Wright et al. 2010), Spitzer (Evans et al. 2009), Herschel (Rebollido et al. 2015; Ribas et al. 2017) and ALMA (Cieza et al. 2019). The SEDs include the observed and extinction-corrected fluxes with extinctions calculated as discussed in Section 3.1.
| Name | Execution Block | N. Ant. | Date | ToS | Avg. Elev. | Mean PWV | Baselines |
|---|---|---|---|---|---|---|---|
| (sec) | (deg) | (mm) | (m) | ||||
| (1) | (2) | (3) | (4) | (5) | (6) | (7) | (8) |
| ISO-Oph 54 | uid://A002/Xdeb725/X96a0 | 41 | 2019-07-12 | 3183 | 51.7 | 1.2 | 111.2-12644.7 |
| WLY 2-63 | uid://A002/Xde0eb4/Xf81 | 48 | 2019-06-24 | 3058 | 62.6 | 0.4 | 83.1-16196.3 |
| ISO-Oph 37 | uid://A002/Xde9c3e/Xd1f | 44 | 2019-07-08 | 3223 | 69.4 | 1.2 | 149.1-13894.4 |
| ISO-Oph 17 | uid://A002/Xddc5da/Xf88 | 44 | 2019-06-19 | 3069 | 55.9 | 1.1 | 83.1-16196.3 |
| DoAr 44 | uid://A002/Xdeb725/Xc94 | 44 | 2019-07-11 | 3258 | 65.4 | 1.5 | 111.2-12644.7 |
| DoAr 44 | uid://A002/Xdeb725/X9dd5 | 43 | 2019-07-13 | 3256 | 78.9 | 1.1 | 111.2-12644.7 |
| WSB 82 | uid://A002/Xdd3de2/X1c59 | 45 | 2019-06-05 | 3162 | 79.1 | 1.0 | 83.1-15238.4 |
| ISO-Oph 2 | uid://A002/Xdd7b18/X8be5 | 45 | 2019-06-12 | 2119 | 68.5 | 1.2 | 83.1-16196.3 |
| ISO-Oph 2 | uid://A002/Xdde745/Xa12 | 46 | 2019-06-21 | 3089 | 72.4 | 0.9 | 83.1-16196.3 |
| ISO-Oph 196 | uid://A002/Xdeb725/Xf1e | 44 | 2019-07-11 | 3204 | 52.3 | 1.4 | 111.2-12644.7 |
| SR 24S | uid://A002/Xdeb725/X98e1 | 43 | 2019-07-12 | 3199 | 64.5 | 1.2 | 111.2-12644.7 |
| RXJ1633.9-2442 | uid://A002/Xde0eb4/Xd43 | 48 | 2019-06-24 | 3142 | 75.1 | 0.4 | 83.1-16196.3 |
(5) Time on Source. (7) Mean Precipitable Water Vapour.
2.3 Observations
The ODISEA long-baseline targets were observed during ALMA Cycle 6 under program 2018.1.00028.S, in Band-6 (1.3 mm/230 GHz) and with maximum baselines ranging from 12.6 to 16.2 km. Most of the objects were observed in only one epoch, but ISO-Oph 2 and DoAr 44 were observed in two different epochs. The observing log of the ODISEA long-baseline observations, including total number of antennas, date, total time on source (ToS), target average elevation, mean precipitable water vapor column (PWV) in the atmosphere, and minimum and maximum baseline lengths is shown in Table 2.
With a continuum bandwidth of 7.5 GHz, the correlator setup was chosen to maximize continuum sensitivity. Three spectral windows overlap the continuum frequency from the Cycle 4 ODISEA observations (see Sec. 2.1) at 217, 219, and 233 GHz and were configured in Time Division Mode, with spectral resolution of 43 km s-1. A fourth spectral window was centered in the 12CO J = 2-1 line (230.538 GHz) with a modest resolution of 1.5 km s-1, but the 12CO data are not discussed in this paper.
| Name | rms | Res.ANG | Res.PHY | MRS | Peak Flux | Total Flux | |
|---|---|---|---|---|---|---|---|
| (mJy/beam) | (mas mas) | (au au) | (arcsec) | (mJy/beam) | (mJy) | ||
| (1) | (2) | (3) | (4) | (5) | (6) | (7) | |
| ISO-Oph 54 | 2.9x10⁻² | 38 58 | 5.3 8.1 | 0.6 | 1.0 | 61 | |
| WLY 2-63 | 1.8x10⁻² | 21 22 | 2.9 3.1 | 0.4 | 4.1 | 288 | |
| ISO-Oph 37 | 2.9x10⁻² | 24 27 | 3.4 3.8 | 0.5 | 4.4 | 116 | |
| ISO-Oph 17 | 2.7x10⁻² | 23 25 | 3.2 3.5 | 0.3 | 3.4 | 164 | |
| DoAr 44 | 2.6x10⁻² | 25 34 | 3.6 5.0 | 0.6 | 0.4 | 60 | |
| WSB 82 | 2.7x10⁻² | 24 31 | 3.7 4.8 | 0.4 | 0.6 | 171 | |
| ISO-Oph 2 | 1.7x10⁻² | 21 30 | 3.0 4.3 | 0.3 | 0.2 | 63 | |
| ISO-Oph 196 | 3.2x10⁻² | 22 45 | 3.0 6.2 | 0.5 | 1.9 | 90 | |
| EM* SR24S | 2.7x10⁻² | 33 37 | 3.8 4.3 | 0.6 | 1.3 | 182 | |
| RXJ1633.9-2442 | 2.1x10⁻² | 20 21 | 2.8 3.0 | 0.4 | 0.4 | 71 |
(5) Maximum Recoverable Scale. (7) the total flux for WSB 82 corresponds to the data set combining the 0.03′′ resolution data with previous 0.2′′ resolution observations.
2.4 Data reduction
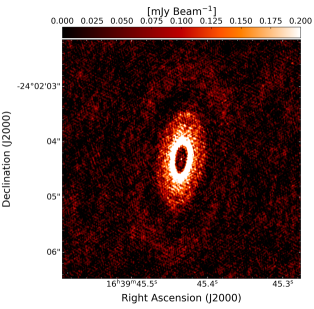
In general, the ODISEA long-baseline data sets were processed by themselves because, in oder to maximize the observing efficiency, no short-baseline observations were taken as part of the Cycle-6 program. We have also produced images combining the long-baseline data with the snapshot ODISEA observations at 0.2′′ resolution from Cycle-4 (PID = 2016.1.00545.S). However, we find that this degrades the resolution and does not improve the image quality or provides additional results. The only exception is WSB 82, for which the combined data shows an additional ring in the outer disc, extending up to 360 au from the star (see Sec. 3.2).
The long-baseline data was calibrated by ALMA staff using the ALMA Calibration Pipeline in CASA version 5.4.0-70. The standard visibility calibration procedure includes Water Vapor Radiometer, system temperature and antenna position correction, in addition to bandpass, phase, and amplitude calibration.
The continuum imaging was performed using the TCLEAN task in CASA v.5.6.1 (McMullin et al. 2007), with Briggs weighting and robust parameter of 0.5. The resulting images have synthesized beams ranging tom of 0.02′′ 0.02′′ to 0.04′′ 0.06′′, centered at 225 GHz. Manual masks around each source were defined during the CLEANing process. Two iterations of phase-only self-calibration were conducted on each source (and each epoch). The self-calibration improved the peak signal-to-noise ratio of the final images by 10 to 30.
The properties of the images (continuum rms, angular and physical resolution, maximum recoverable scale, peak flux and total flux) are listed in Table 3. We find that the total flux recovered by the long-baseline observations are typically lower but within 15 of the fluxes measured for the objects from the previous ODISEA data at 0.2′′ resolution (Table 1). The differences in flux are only slightly above the calibration uncertainties and indicate that the long-baseline observations recover most of the flux. Even though some of the discs are larger than the maximum recoverable angular scale of the long-baseline observations, their flux distributions are far from smooth across the disc and little emission is filtered out. The exception is the Class I source ISO-Oph 54, which is 50 brighter in the low-resolution data, probably due to contamination from envelope emission.
| Name | SpT | Ref. | Teff | AV | L⋆ | M⋆ | Age | Project | |
|---|---|---|---|---|---|---|---|---|---|
| (M⊙yr-1) | (K) | (mag) | (L⊙) | (M⊙) | (Myr) | ||||
| (1) | (2) | (3) | (4) | (5) | (6) | (7) | (8) | (9) | (10) |
| ISO-Oph 54 | … | … | … | 3300 | 53 | 1.7 | … | 0.5 | ODISEA |
| WLY 2-63 | … | … | … | 4200 | 28 | 3.8 | … | 1.0 | ODISEA |
| ISO-Oph 37 | … | … | … | 3900 | 20 | 0.8 | … | 1.0 | ODISEA |
| ISO-Oph 17 | M0 | … | 1 | 3800 | 8.4 | 0.2 | 0.5 | 2.0 | ODISEA |
| EM* SR4 | K7 | 10-6.9 | 2 | 4100 | 1.3 | 1.2 | 0.7 | 1.0 | DSHARP |
| DoAr 44 | K2 | 10-8.2 | 3 | 4760 | 0.9 | 1.8 | 1.4 | 2.0 | ODISEA |
| Elias 2-27 | M0 | 10-7.2 | 2 | 3800 | 15 | 0.9 | 0.5 | 1.0 | DSHARP |
| Elias 2-24 | K5 | 10-6.4 | 2 | 4200 | 8.7 | 6.0 | 0.8 | 1.0 | DSHARP |
| Elias 2-20 | M0 | 10-6.9 | 2 | 3800 | 14 | 2.2 | 0.5 | 1.0 | DSHARP |
| WSB 82 | K0 | … | 4 | 5000 | 5.0 | 5.1 | 1.5 | 2.0 | ODISEA |
| ISO-Oph 2A | M0 | 10-8.7 | 5 | 3800 | 9.0 | 0.7 | 0.5 | 1.0 | ODISEA |
| ISO-Oph 196 | M5 | 10-8.9 | 3 | 2900 | 3.1 | 0.2 | 0.2 | 1.0 | ODISEA |
| EM* SR 24S | K2 | 10-7.2 | 6 | 4800 | 3.3 | 2.0 | 1.4 | 2.0 | ODISEA |
| DoAr 25 | K5 | 10-8.3 | 2 | 4200 | 2.7 | 1.0 | 0.9 | 2.0 | DSHARP |
| RX J1633.9-2442 | K5 | 10-10 | 7 | 4200 | 2.5 | 1.0 | 0.8 | 2.0 | ODISEA |
(4): Reference for spectral types and accretion rates: 1 = Ricci et al. (2010); 2 = Andrews et al. (2018) 3 = Manara et al. (2014); 4 Ruiz-Rodriguez et al., in prep; 5 = Gatti et al. (2006); 6 = Natta et al. (2006); 7 = Cieza et al. (2012). (10): All stellar properties for DSHARP objects are taken from Andrews et al. (2018).
3 Results
3.1 Stellar properties
For Class II sources, we adopt the spectral types listed in Table 4 and the temperature scale from Pecaut & Mamajek (2013). We derive the luminosities by applying the bolometric corrections from (Allard et al. 2012), appropriate for the given effective temperature, to the extinction-corrected values in the J-band. The AV values were calculated using the extinction law from Fitzpatrick (1999), including the NIR empirical corrections by Indebetouw et al. (2005). We adopt the AV that provides the best match between the extinction-corrected optical SED and the corresponding model photospheres from Allard et al. (2012). The resulting AV and luminosities are also listed in Table 4. The 3 most embedded sources in the sample (ISO-Oph 54, WLY 2-63, and ISO-Oph 37) do not have optical spectral types in the literature, but we adopt the effective temperatures and luminosities derived by Doppmann et al. (2005) based on high-resolution near-IR spectroscopy. For these objects, we estimate the extinction by dereddening the near-IR colors to match the expected photospheric color for the given effective temperature. This approach results in AV values ranging from 20 to 53 mag, confirming that these targets are deeply embedded objects.
For Class II sources, we estimate stellar masses and ages by comparing the effective temperatures and luminosities to the predictions of the BT-Settl evolutionary models from Allard et al. (2012). Since the photospheric temperatures and luminosities of the embedded sources are very uncertain, we adopt ages for them based on the statistical duration of each stage provided by Evans et al. (2009): 1 Myr for Flat Spectrum sources and 0.5 Myr for Class I sources. The masses and ages of low-mass pre-main-sequence stars are model-dependent and notoriously difficult to derive (Baraffe et al. 2002; Soderblom et al. 2014). While the relative values reported in Table 4 are most robust, the absolute masses and ages should be interpreted with prudence.
For completeness, in Table 4 we also include the stellar properties of the DSHARP objects that are part of the “Ophiuchus long-baseline sample" (as defined in Sec. 2.1). For these DSHARP objects, we adopt the stellar properties (measured and derived) listed by Andrews et al. (2018). The derived properties (AV, L⋆, M⋆, and age) are in good agreement with the values obtained by our own procedures, within the uncertainties discussed above.
3.2 ALMA continuum images
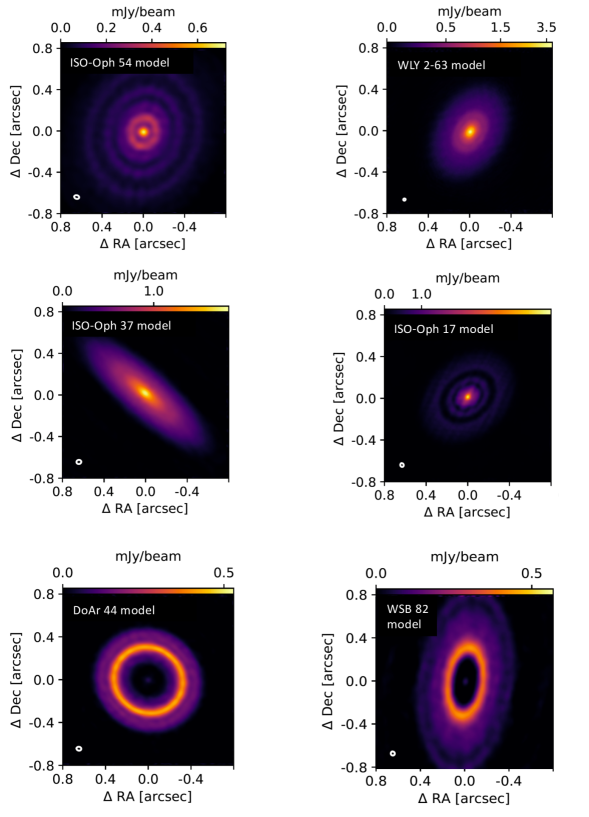
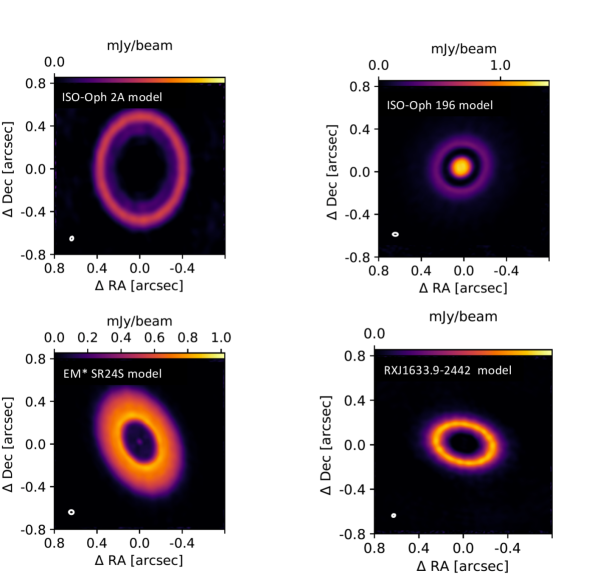
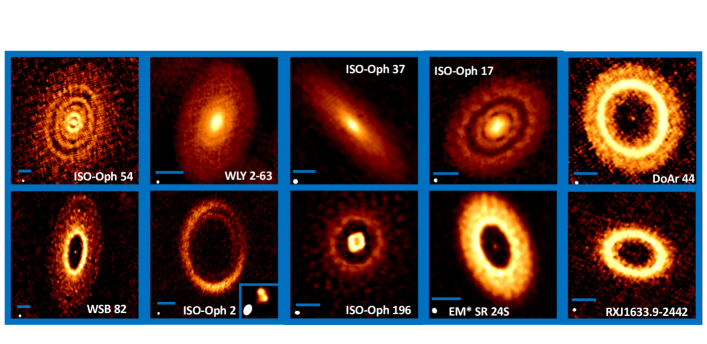
In Fig. 3, we show all images from the ODISEA long-baseline data. These images display a stunning diversity of substructures, including: concentric gaps and rings (ISO-Oph 54, ISO-Oph 17, ISO-Oph 196), axisymmetric rings (RXJ1633.9-2442), rings with azimuthal asymmetries (ISO-Oph 2), disc with large cavities with bright inner edges and unresolved inner discs (DoAr 44, WSB 82, EM* SR24S), and discs with bright cores and mostly featureless outer discs (WLY 2-63, ISO-Oph 37). ISO-Oph 2 is a 240 au separation binary system in which we detect the discs around both components. As discussed in the previous section, the only object that exhibits additional features when the long-baseline data is combined with the previous ODISEA observations at 0.2′′ resolution is WSB 82. An image produced with the combined data sets is shown in Figure 4. The feature is faint, but an additional outer ring can be seen extending from 1.2 (190 au) to 2.3′′ (360 au). This outer ring is also detectable in the 0.2′′ resolution images alone (Cieza et al. 2019).
| Name | Radisc | Decdisc | R90% | Mdust | ||
| (deg) | (deg) | (deg) | (deg) | (au) | (M⊕) | |
| (1) | (2) | (3) | (4) | (5) | (6) | (7) |
| ISO-Oph 54 | 246.6686071 | -24.45417917 | 32.50.4 | 1602.5 | 119 | 56 |
| WLY 2-63 | 247.8985657 | -24.02500088 | 46.21.2 | 1495.0 | 67 | 194 |
| ISO-Oph 37 | 246.5982233 | -24.41112958 | 72.40.2 | 490.6 | 91 | 81 |
| ISO-Oph 17 | 246.5430326 | -24.34870389 | 42.40.7 | 1310.7 | 63 | 100 |
| DoAr 44 | 247.8893970 | -24.46045289 | 21.80.9 | 602.7 | 60 | 54 |
| WSB 82 | 249.9393110 | -24.03453309 | 61.20.5 | 1731.0 | 256 | 136 |
| ISO-Oph 2A | 246.4088324 | -24.37685830 | 37.60.8 | 0.41.4 | 72 | 44 |
| ISO-Oph 196 | 247.0687631 | -24.61626712 | 22.31.4 | 1327.1 | 69 | 54 |
| EM* SR 24S | 246.7437652 | -24.76022836 | 47.33.1 | 281.2 | 58 | 70 |
| RX J1633.9-2442 | 248.4817004 | -24.70151736 | 47.91.1 | 771.4 | 53 | 47 |
(2) and (3) coordinates of the disc centers used to produce the radial profiles shown in Fig. 5.
3.3 Basic disc properties
In Table 5, we list the positions (Radisc and Decdisc) of the centers of the discs, together with their Position Angles () and inclinations (). Following Isella et al. (2019), the Radisc and Decdisc values were obtained by minimizing the imaginary part of the continuum visibilities, which in turn minimizes the asymmetry of the continuum emission relative to the phase center. After fixing the Radisc and Decdisc values, the and were calculated by minimizing the dispersion of the deprojected visibilities on circular annuli in the Fourier space. The Radisc and Decdisc values are consistent with the positions and proper motions from Gaia listed in Table 1. In Table 5, we also list the radii of the discs containing 90 of the flux which we call R90%. These values were calculated by measuring the flux in concentric ellipses with aspect ratios corresponding to the inclination of each disc. Finally, we calculate the dust mass of the discs as in the first paper of the ODISEA series Cieza et al. (2019):
| (1) |
This equation assumes a 1.3 mm dust opacity, , of 2.3 cm2 g-1, and a dust temperature of 20 K. The adopted opacity value is taken from Beckwith et al. (1990) and is still widely used in the field (Williams & Cieza 2011). However, dust opacities at mm wavelengths depend on grain size distribution, composition, and structure and still remain highly uncertain. See Birnstiel et al. (2018) for a recent discussion. We adopt the 1.3 mm fluxes from the low-resolution ODISEA data listed in Table 1 as the long-baseline flux is subjected to higher calibration uncertainties and potential flux losses by the incomplete sampling of the plane. For objects without distances from Gaia, we adopt 140 pc, which is very close to the mean Gaia distance obtained by Cánovas et al. (2019) for Ophiuchus members (139 pc).
| Target | Gap/Ring | ro | Depth | Width |
|---|---|---|---|---|
| (au) | (au) | |||
| (1) | (2) | (3) | (4) | (5) |
| ISO-Oph 54 | D-12 | 12 4 | 0.390.02 | 10 3 |
| ISO-Oph 54 | B-21 | 21 5 | - | 9 3 |
| ISO-Oph 54 | D-32 | 32 7 | 0.90.05 | 113 |
| ISO-Oph 54 | B-38 | 38 8 | - | 7 3 |
| ISO-Oph 54 | D-48 | 48 10 | 0.350.01 | 103 |
| ISO-Oph 54 | B-58 | 58 12 | - | 113 |
| ISO-Oph 54 | D-72 | 72 15 | 0.240.01 | 174 |
| ISO-Oph 54 | B-88 | 88 18 | - | 164 |
| ISO-Oph 17 | D-20 | 20 4 | 0.490.02 | 18 4 |
| ISO-Oph 17 | B-25 | 25 5 | - | 7 2 |
| ISO-Oph 17 | D-37 | 37 8 | 0.14 0.01 | 123 |
| ISO-Oph 17 | B-47 | 47 9 | - | 20 4 |
| DoAr 44 | B-47 | 47 2 | - | 132 |
| WSB 82 | B-50 | 50 2 | - | 26 2 |
| WSB 82 | D-114 | 114 3 | 0.7 0.02 | 522 |
| WSB 82 | B-123 | 123 3 | - | 252 |
| WSB 82 | D-186 | 186 4 | 0.2 0.05 | 103 2 |
| WSB 82 | B-269 | 269 5 | - | 782 |
| ISO-Oph 2A | B-49 | 49 4 | - | 11 2 |
| ISO-Oph 2A | D-58 | 57 4 | 0.030.005 | 7 2 |
| ISO-Oph 2A | B-69 | 69 5 | - | 132 |
| ISO-Oph 196 | B-8 | 8 2 | - | 8 2 |
| ISO-Oph 196 | D-18 | 18 2 | 0.040.005 | 16 2 |
| ISO-Oph 196 | B-34 | 34 2 | - | 16 2 |
| EM* SR 24S | B-30 | 30 2 | - | 302 |
| RXJ1633.9-2442 | B-36 | 36 1 | - | 181 |
(2) Gaps are labeled with he prefix "D" (dark/local minimum) followed by the location in au. Similarly, rings are labeled with a prefix "B" (bright/local maximum). (3) The location of the local maximum or minimum. (4) Gap depths are defined from the ratio of the local maxima and local minima in gap-ring pairs, /. ( 5) Measured at the mean intensity between these adjacent pairs of gaps and rings, 0.5 ( + ). For rings adjacent to a cavity, the width of the ring is measured at 50 of the peak intensity.
| Large dust cavities | ||||||
|---|---|---|---|---|---|---|
| (r 20 au) | ||||||
| Target | RCav.10% | RCav.50% | RCav.90% | RCav | FCB | Mdust,CB |
| (au) | (au) | (au) | (au) | (mJy) | (M⊕) | |
| (1) | (2) | (3) | (4) | (5) | (6) | (7) |
| DoAr44 | 26 2 | 41 2 | 45 2 | 47 2 | 6 10-2 | 4 10-2 |
| WSB 82 | 33 2 | 41 2 | 47 2 | 50 2 | 2 10-1 | 1 10-1 |
| ISO-Oph 2A | 45 3 | 46 3 | 48 4 | 49 4 | 2 10-2 | 1 10-2 |
| EM* SR24S | 18 2 | 24 2 | 27 2 | 30 2 | 2 10-1 | 8 10-2 |
| RXJ1633.9-2442 | 16 1 | 24 1 | 27 1 | 36 1 | 4 10-2 | 2 10-2 |
| Small dust cavities | ||||||
| (r 10 au) | ||||||
| Target | RCav. | |||||
| (au) | ||||||
| (8) | ||||||
| ISO-Oph 54 | 2.5 2.5 | |||||
| ISO-Oph 2B | 2.2 2 | |||||
| ISO-Oph 196 | 8.5 2 |
| Target | Inflection point | rinflec. |
|---|---|---|
| (au) | ||
| (1) | (2) | (3) |
| ISO-Oph-54 | I-102 | 102 21 |
| WLY 2-63 | I-21 | 21 4 |
| WLY 2-63 | I-38 | 38 8 |
| ISO-Oph 37 | I-14 | 14 3 |
| ISO-Oph 17 | I-6 | 6 2 |
| DoAr 44 | I-39 | 39 2 |
| DoAr 44 | I-58 | 58 2 |
| WSB 82 | I-80 | 80 2 |
| ISO-Oph 196 | I-23 | 23 2 |
| ISO-Oph 196 | I-65 | 65 2 |
| ISO-Oph 196 | I-82 | 82 3 |
| EM* SR 24S | I-37 | 37 2 |
| RXJ1633.9-2442 | I-23 | 23 1 |
| RXJ1633.9-2442 | I-62 | 62 2 |
(2) Inflection points are labeled with the prefix "I" followed by their location in au.
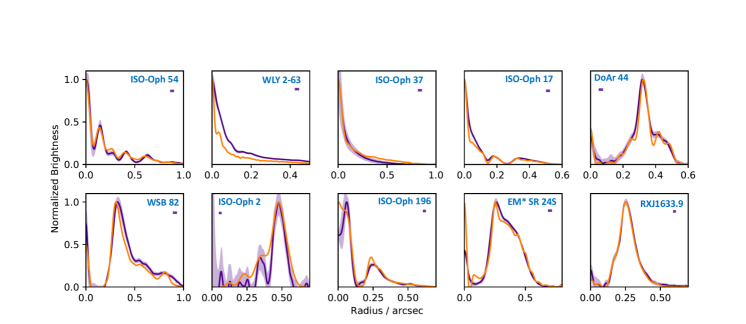
3.4 Substructures from radial profiles
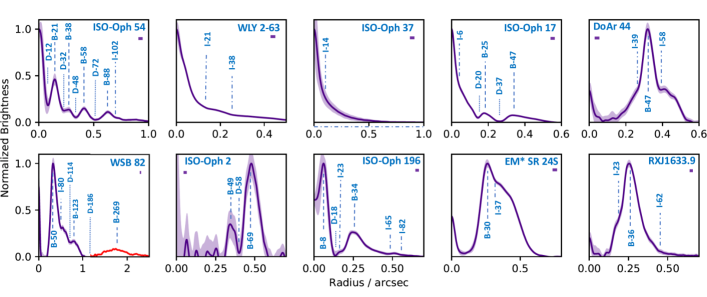
Using the disc centers and inclinations listed in Table 5, we deproject the discs to an inclination of 0.0 deg. The resulting deprojected radial brightness profiles are shown in Fig. 5, including the 3- errors in the mean calculated as 3rms / , where N is the number of beams in the corresponding ellipse. Following Huang et al. (2018), for highly inclined systems (ISO-Oph 37 and WSB 82), we only use the azimuthal angles within 20 deg of the semi-major axis orientation in the reprojected coordinates because the substructures are less well resolved along the minor axes. We use these deprojected radial profiles to identify and characterize substructures, including gaps, rings, cavities, and inflection points, as discussed in the following subsection.
3.4.1 Gaps and rings
Gaps and rings are the most common substructures that have been identified in protoplanetary discs observed at 5 au resolution in the continuum at (sub)millimeter wavelengths (Andrews et al. 2018). We find that these structures are also present in 8 of of our 10 targets. Following Huang et al. (2018), we label these features with a prefix "B" (“Bright" for rings) or "D" (“Dark" for gaps) followed by a number that indicates their location in au. We take a conservative approach and only identify gaps and rings that manifest themselves as clear local minima () or local maxima () in the intensity profile and leave the identification of more subtle features for future work. For WSB 82, we derive the radial profile beyond 1.0′′ from the image that combines the long-baseline data with the observations at 0.2′′ resolution. Gap and rings are labeled in Fig. 5 and listed in Table 6. The table also includes a measurement of the depths of the gaps and the widths of the gaps and rings. Also following Huang et al. (2018), the depths of the gaps are defined from the ratio of the local maxima and local minima in gap-ring pairs, /. Similarly, the widths of the gaps and the rings are measured at the mean intensity between these adjacent pairs of gaps and rings, 0.5 ( + ). For rings adjacent to a cavity, we measure the width of the ring at 50 of the peak intensity. The large cavities seen in EM* SR24 S, DoAr 44, and WSB 82 could also be considered to be wide gaps because they also have unresolved inner discs within the cavities. However, we treat them in a different way because inner cavities represent a distinct type of substructure: discs with cavities have an off-center absolute maximum.
3.4.2 Discs with large (r 20 au) dust inner cavities
Five objects in our sample (ISO-Oph 2, EM* SR 24S, DoAr 44, RX-J1633.9-2442, and WSB 82) have well resolved cavities. Cavity radii at millimeter wavelengths are typically measured from the star to the location of the absolute maximum in the radial profile, a measurement that we label in Table 7. We find that cavities show radial profiles with different steepness/sharpness (see Fig. 5). In order to quantify the sharpness of these cavities, in Table 7 we also report the radii at which the profiles reach 10%, 50 and 90 of the peak flux (, , and , respectively). For DoAr 44, WSB 82, and EM* SR 24S, Table 7 also includes the fluxes of their central beams and the corresponding dust masses for their inner discs. These masses have been calculated using the same temperature (20 K) and opacities (2.3 cm2 g-1) as in Cieza et al. (2019), but we warn the reader that this might overestimate the dust mass in a warm inner disc and that the real dust masses can be lower by factors of T/20K. Alternatively, the mass of the inner disc could be underestimated if the emission is optically thick. For ISO-Oph 2 and RX J1633.9-2442, we list the 3- upper limits in the fluxes at the center of the cavities and in the corresponding dust masses.
3.4.3 Small (r 10 au) dust inner cavities
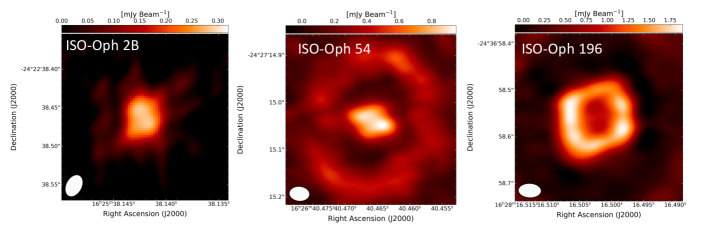
While the five objects discussed above have dust cavities with radii larger than 20 au, three additional targets in our sample have discs with much smaller inner dust cavities, which are not so obvious in the images shown in Figure 3. These targets are ISO-Oph 54, the secondary object in ISO-Oph 2, and ISO-Oph 196 (see Figure 6). The ODISEA long-baseline data for ISO-Oph 2 system have already been analyzed by González-Ruilova et al. (2020). The small disc around ISO-Oph 2B has a cavity with a radius, , of only 2.2 au based on the location of a null in the deprojected visibility profile (Hughes et al. 2007).
The deprojected visibility profile for ISO-Oph 2B can be approximated as a simple Bessel function because the disc seems to be a single ring in the image plane. However, the ISO-Oph 54 and ISO-Oph 196 discs are much more complex in the image plane (they have multiple concentric rings of different radii and widths) and thus also have more complex visibility profiles. Therefore, we estimate the sizes of their cavities (also listed in Table 7) as half the distance between the intensity peaks seen in the image plane.
3.4.4 Inflection points
In addition to the rings, gaps, and cavities discussed above, we also identify changes in the slopes of the radial profiles that are abrupt but do not constitute a local minimum. We call them "inflection points" and label them in Figure 5 with the "I" prefix following their location in au. The location of these inflection points are listed in Table 8. Like with the gaps and rings, we only list the most conspicuous inflection points identified by inspection of the radial profiles. These inflection points in the brightness profiles could have different origins, including unresolved gaps (Huang et al. 2018), changes in the optical depths at snow lines (Cieza et al. 2016), or the accumulation of dust at planet-induced pressure bumps (see Pinilla et al. (2019) and Section 4.2.2).
3.5 Caveats and uncertainties
The substructures observed at 1.3 mm and listed in Tables 6, 7, and 8 are the result of exploratory work at unprecedented resolution for the given targets. However, we emphasize that the characterization of these substructures is subject to important caveats and uncertainties. First, the (sub)mm continuum observations are mostly sensitive to dust grains with sizes that are similar to the observing wavelength and that the grain size population is a complex function of radius due to dust evolution (e.g., growth, migration, and accumulation). Therefore, the location and shape of the features are highly dependent on the wavelength observed. Second, all the features are convolved with the synthesized ALMA beam, which can make deep and narrow features look wider and shallower than they really are. Third, the sizes and locations of the features all scale with the distance to the objects, which have uncertainties ranging from 1 for targets with accurate Gaia parallaxes to 20 for objects without such information. Based on the above, the errors in the values in au reported in Tables 6, 7, and 8 correspond to the errors introduced by the uncertainties in the distance and half the beam size added in quadrature. Similarly, the errors in the depths of the gaps are calculated by propagating the 1- errors in the radial profiles at and to the / ratio.
Besides the more physical limitations noted above, we also make some methodological assumptions that might have small impacts on the tabulated results. Namely, we assume that all features in a given disc have the same center, position, angle and inclination. This is likely to be the case on most features, but this assumption should be tested in the detail study of individual discs and features. We stress, however, that none of our main conclusions (see Sec. 5) are dependent on these assumptions or affected by the uncertainties previously mentioned.
In order investigate how the properties of the substructures we derive depend on the data processing, in Appendix A we use the python module Frankenstein (frank, Jennings et al. 2020) to produce model images (Figs. 11 and 12) and a new set of radial profiles. Frank recovers axisymmetric disc structures at sub-beam resolution by fitting the visibilities directly, creating a model and a radial brightness profile of the model using a Gaussian process. We find that frank recovers the gaps and rings we list in Table 6, but since it avoids the resolution loss from the beam convolution used by CLEAN, some of the features identified by frank are deeper and narrower (Fig. 13). Frank also identifies several additional local minima and local maxima. Some of them might be real gaps and rings that are not resolved in the CLEANed images, but they should be taken with caution and considered on a case-by-case basis. Since the Frank models assume azimuthal symmetry, the models necessarily fail to identify the azimuthal structures present in the ISO-Oph 2A disc. Frank also fails to reproduce the cavity we find in the CLEANed images of ISO-Oph 196, but it finds an infection point close to the center of the disc instead. Further tests on the object reveal that the morphology of the inner disc is dependent on the details of the CLEANing process. Some of the CLEANed images show a cavity while others resemble more a faint inner disc and a narrow gap. This suggests that the inner disc has low signal-to-noise structures close to the resolution of the observations and further investigation is needed.
4 Discussion
4.1 Individual objects
In this section, we review the main properties of each of the ODISEA long-baseline targets and summarize the main substructures revealed by the observations at 3-5 au resolution.
4.1.1 ISO-Oph 54
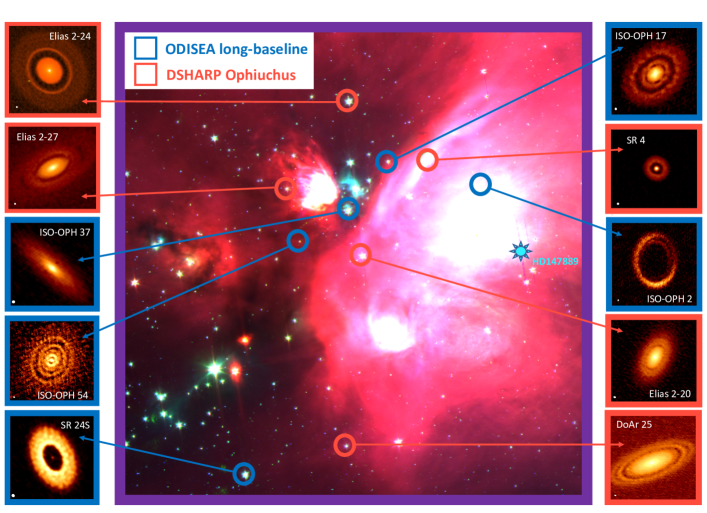
ISO-Oph 54 (also known as Oph Emb 22 or GY 91) is a Class I protostar with effective temperature of 3300 K and an stellar luminosity of 1.7 L⊙ (Doppmann et al. 2005) located in the L1688 stellar cluster (Lynds 1962; Padgett et al. 2008) of the Ophiuchus molecular cloud (see Fig. 7). The source is deeply embedded in a 0.06 M⊙ envelope and has a bolometric temperature of 370 K (Enoch et al. 2009). From previous ALMA observations at 0.05′′ and 0.13′′ resolution (at 3 mm and 870 m, respectively) three gaps were previously identified at 10 au, 40 au, and 70 au (Sheehan & Eisner 2018).
With an value of 0.45, ISO-Oph 54 is the most embedded source of the ODISEA long-baseline sample based on its IR SED. We find that the object has an inner dust cavity 2.5 au in radius (see Fig. 6). The outer edge of this cavity constitute one of the five rings (local maxima) with peaks at 2.5 au, 21 au, 38 au, 58 au, and 88 au (Fig. 5). We also identify 4 clear local minima in the brightness profiles (gaps) at 12 au, 32 au, 48 au, and 72. The first and last of these gaps roughly correspond to those identified by Sheehan & Eisner (2018), but our observations resolve the gap they report at 40 au into the 2 gaps and a ring (D32, B38, and D48). In addition to these local extremes, the brightness profile of ISO-Oph 54 shows an inflection point at 102 au. ISO-Oph 54 is a clear demonstration that very young sources (age 0.5 Myr) still embedded in their natal envelopes can already show a rich variety of substructures.
4.1.2 WLY 2-63
WLY 2-63 (also known as Oph Emb 17 or IRS 63) is a Flat Spectrum source located in the L1709 region (Lynds 1962; Padgett et al. 2008) of the Ophiuchus cloud. The system has a bolometric temperature of 327 K and is deeply embedded in a 0.07 M⊙ envelope falling at an accretion rate of 1.210-7 M yr-1 (Kristensen et al., 2012; Brinch Jørgensen, 2013). Based on high-resolution near-IR spectroscopy, Doppmann et al. (2005) estimate an effective temperature of 4200 K and a luminosity of 3.8 L⊙ for the central object. With a 1.3 mm flux of 335 mJy, WLY 2-63 is the brightest of the ODISEA long-baseline targets. No clear substructures are seen at 0.2′′ resolution (Cieza et al. 2019), but the long-baseline image of the system (Fig. 3) resembles three "concentric discs". The deprojected brightness profile (Fig. 5) shows that the inner most region is much brighter than the rest of the disc and shows two inflection points at 21 and 38 au, corresponding the the boundaries of the "concentric discs" seen in the image. Segura-Cox et al. (2020), recently presented a detailed analysis of the WLY 2-63 disc using ALMA high-resolution data very similar to ours. They showed the two shallow gaps are revealed at the location of the inflection points when a smooth disc model is subtracted from the data. They also find that the temperature of the disc at the location of the outer gap/inflection point is consistent with the CO snowline.
4.1.3 ISO-Oph 37
ISO-Oph 37 (also known as GY 21) is protostar with a Flat Spectrum IR SED, an effective temperature of 3900 K and a luminosity of 0.8 L⊙ (Doppmann et al. 2005). It is located in the L1688 cluster. We find that the disc around ISO-Oph 37 is highly inclined (i 72 deg) but the disc is large (R90% = 91 au) and very well resolved along the major axis. Still, the radial profile shows no substructures, except for an inflection point at 31 au. As with WLY 63, it would be interesting to investigate the temperature structure of the disc and the potential connection of this inflection point to a snow line. WLY 63 and ISO-Oph 37 are rare examples of large and massive discs without clear gaps and rings at 3-5 au resolution and is worth noting that both are very young ( 1 Myr) embedded (Flat Spectrum) sources based on their IR SEDs.
4.1.4 ISO-Oph 17
ISO-Oph 17 (also known as GSS 26) is a Class II source also located in the L1688 cluster of the Ophiuchus molecular cloud. It shows a "full" SED (without any indication of large gaps or inner hole). As such, it is the typical target included in the DSHARP sample. As most objects in DSHARP, ISO-Oph 17 shows concentric gaps and rings, with clear local minima at 20 au and 37 au and the corresponding local maxima at 25 and 47 au. To our knowledge, these gaps and rings have not been reported thus far; however, the D-37 gap was previously noted as an inflection point based on the 0.2′′ resolution ODISEA data (see object 30 in Cieza et al. 2019).
4.1.5 DoAr 44
DoAr 44 (also known as WSB 72 and HBC 268) is located in the L1689 region of the Ophiuchus cloud (Lynds 1962; Padgett et al. 2008) and has a pre-transition disc IR SED. The large cavity in the system has been imaged before both in the submillimeter (van der Marel et al. 2016) and in the near-IR (Casassus et al. 2018) using Differential Polarized Imaging (DPI). The DPI observations shows shadows in the outer disc that are likely to be produced by a highly inclined inner disc. Our long-baseline observations detect this inner disc, which remains unresolved at 4 au resolution and has an estimated mass of 0.04 M⊕. DoAr 44 exhibits the shallowest cavity edge in the sample with = 26 au and = 47 au, a narrow peak extending from an inflection point at 39 au to another inflection point at 58 au, followed by a narrow shoulder. The combination of these features results in a peculiar 1.3 mm image (see Fig. 3) with a "ring-within-a-ring" morphology.
4.1.6 WSB 82
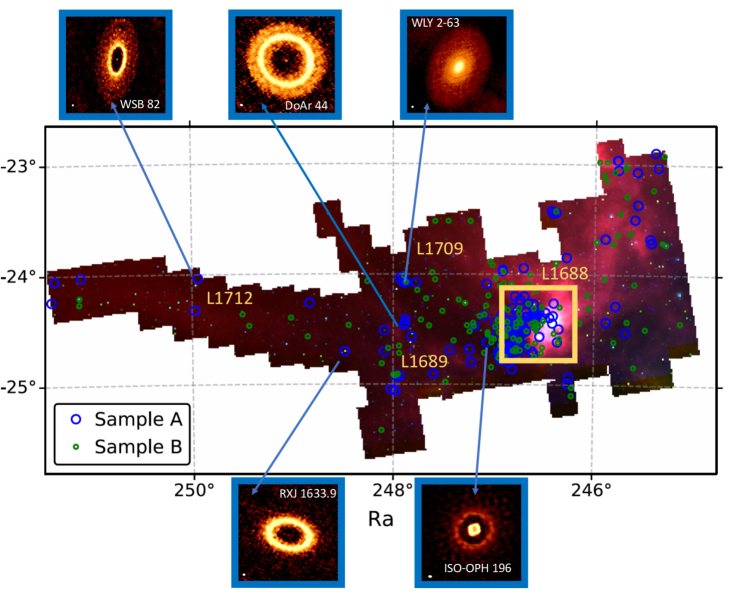
WSB 82 (also known as IRAS 16367-2356) is a relatively isolated source located in the L1712 region, in eastern part of the Ophiuchus molecular cloud (see Fig. 8). With a spectral type of K0, WSB 82 is the hottest star in the ODISEA long-baseline sample. Using ALMA, Cox et al. (2017) imaged the cavity of WSB 82 for the first time and identified a gap at 150 au. Our observations reveal an unresolved inner disc with a mass of 0.1 M⊕, a narrow ring at the edge of the cavity, followed by an inflection point (I-80 au) and a narrow shoulder behind this inflection point. Unlike DoAr 44, WSB 82 has an extended outer disc with two pairs of gaps and rings. The local minima are located at 114 and 186 au, with the corresponding local maxima at 123 and 269 au. The gap identified by Cox et al. (2017) at 150 au corresponds to D-186. The difference in location is partially due to the difference in adopted distance (137 vs 155 pc). WSB 82 also has, by far, the largest disc in the sample (R = 256 au).
4.1.7 ISO-Oph 2
ISO-Oph 2 is a wide separation (240 au) binary system in the western edge of the L1688 star-forming cluster (Lynds 1962; Padgett et al. 2008). The primary is M0 star (Gatti et al. 2006), while the secondary is at the brown dwarf limit (González-Ruilova et al. 2020). The system shows a pre-transition disc SED, although it is unclear whether the near-IR excess arises from the primary or the secondary disc. The dust cavity around the primary was resolved for the first time by the ODISEA observations at 0.2′′ resolution (Cieza et al. 2019).
With a flux of 72 mJy at 1.3 mm, ISO-Oph 2A is the faintest disc of the ODISEA long-baseline targets. The system holds several records within the Ophiuchus molecular cloud. Its primary disc has the largest dust cavity in Ophiuchus (Cieza et al. 2019), while the secondary is the lowest-mass object (0.08 M) with a resolved transition disc, which in turn features the smallest dust cavity resolved thus far in the cloud (r 2.2 au). The primary disc shows two closely-packed narrow rings with strong azimuthal brightness asymmetries. As shown in Figure 7, the brightest part of the outer ring is in the direction of HD 147889, a binary system composed of a B2IV-B3IV pair, which is the brightest UV source in the cluster (Casassus et al. 2008) and might play a role in the asymmetric illumination of the rings around ISO-Oph 2A. Furthermore, the ISO-Oph 2 system shows a bridge of gas connecting the primary and the secondary discs, which could be an indication that the secondary has recently flown by the primary. For a detailed discussion of this extraordinary system, see González-Ruilova et al. (2020).
4.1.8 ISO-Oph 196
ISO-Oph 196 (also known as WLY 1-58 or WSB 60) is located in the outer edge of the L1688 cluster, in the direction of the L1689 region. ISO-Oph 196 has a Class II SED, and with an M5 spectral type (Manara et al. 2014), it is the coolest star in the sample. Based on ALMA observations at 0.15′′ resolution, a gap was recently reported extending from from 11 au to 32 au (Francis & van der Marel 2020). Our long-baseline observations reveal an inner dust cavity 8.5 au in radius, a deep gap at 18 au (consistent with the values mentioned above), followed by a ring that is centered at 34 au and has a width of 16 au. We also identify inflection points at 23 au, 65 au, and 82 au. We note that the inner dust cavity is subject to the specific caveats discussed at the end of Sect. 3.5.
4.1.9 EM* SR 24S
EM* SR 24S or SR 24S is part of a hierarchical triple system, where SR 24S is a single star and SR24N is a binary system. The separation between SR 24S and SR 24N is 5.2” (Reipurth & Zinnecker 1993). Both discs were resolved in the scattered light infrared images that show that the primary disc and secondary discs are connected by a spiral arm pattern (Mayama et al. 2010). However, ALMA observations at multiple wavelengths for the SR24 system do not reveal any dust emission in SR24N disc, while the SR24S disc shows a ring-like structure peaking at 0.32” (Pinilla et al. 2017; Pinilla et al. 2019). The multi-wavelength analysis from ALMA observations of the ring of SR 24S supports the scenario of a planet carving a gap and forming the observed cavity and ring-like structure. These observations also revealed an inner disc, which is likely dominated by dust thermal emission instead of free–free emission. The existence of such an inner disc puts an upper limit to the potential planet(s) embedded in this disc of around 5 MJUP (Pinilla et al. 2019). CO emission has been detected in both systems (SR 24N and SR 24S, Andrews & Williams 2005; Pinilla et al. 2017). Our long-baseline observations of SR 24S resolve the ring-like morphology of the outer disc into several components: a sharp inner edge ( = 24 au, = 27 au), a relatively narrow peak at 30 au, followed by an inflection point at 37 au, and a disc "shoulder" or "plateau" extending to R90% = 58 au. We also detect an unresolved inner disc with an estimated mass of 0.08 M⊕.
4.1.10 RX J1633.9-2442
RX J1633.9-2442 is young stellar object with a K5 spectral type. It was classified by Cieza et al. (2010) as a "giant planet-forming disc" based on its transition disc SED, low but detectable accretion rate (10-10 M⊙/yr), and high disc mass (10 MJUP assuming a gas to dust mass ratio of 100). Its dust cavity was first resolved by observation with the Submillimeter Array, from which Cieza et al. (2012) estimated the radius of the cavity to be 25 au. Our ALMA long-baseline observations show that the outer disc is particularly narrow, with RCav.50%=24, RCav. = 36 au and R90% = 53 au. The radial brightness profile is very noisy close to the star, but no inner disc is detected with an upper limit of 0.02 M⊕ for the central beam. This non-detection is consistent with the lack of near-IR excess in the SED (see Fig. 2). Deep aperture masking observations in the near-IR rule out the presence of companions more massive than 6 MJUP at distances larger than 3 au from the star (Cieza et al. 2012), which suggests that the cavity and the ring-like morphology of the outer disc are due to the dynamical interactions with a planet rather than a brown dwarf or low-mass star.
4.2 The origin and evolution of substructures in massive discs
4.2.1 The possible origins of gaps and rings
Since the first ALMA long baseline observations revealed a stunning sequence of gaps and rings seen in continuum emission in the borderline Class I/II object HL Tau (ALMA Partnership et al. 2015), and the subsequent DSHARP survey revealing that these are common (Andrews et al. 2018), there has been much speculation about their origin. No shortage of mechanisms have been proposed to explain them. Since dust grains emitting at mm-wavelengths likely undergo relatively fast radial drift (Weidenschilling 1977), axisymmetric dust rings can in principle be created by any mechanism that creates local pressure maxima (i.e. dust traps) in the disc. Examples of proposed mechanisms include condensation fronts (Zhang et al. 2015), self-induced dust traps (Gonzalez et al. 2015), magnetic dead zones (Flock et al. 2015) and secular dust instabilities (Takahashi & Inutsuka 2014; Lorén-Aguilar & Bate 2015). Some of these mechanisms, such as condensation fronts (Zhang et al. 2015), are unlikely to occur in most cases as the rings do not precisely align with the required temperature profile (Huang et al. 2018; Long et al. 2018), although uncertanties remain due to the unkowns in the disc temperature. Other mechanism require the change of the dust properties to change their local opacity, e..g as sintering might be able to do and explain the brightness variations (Okuzumi et al. 2016).
Part of the initial confusion arose because of the axisymmetry of the observed rings and gaps, since the expectation from planet-induced structures was that non-axisymmetric structures should be present (e.g. de Val-Borro et al. 2006). Dipierro et al. (2015) showed that this discrepancy can be resolved because the dust disc is much thinner than the gas disc (e.g. / for the dust disc in HL Tau; see Pinte et al. 2016) and relatively decoupled. Multiple gaps can also arise from a single planet (Dong et al. 2017). The low aspect ratio implies that even low mass planets can carve detectable dust gaps (e.g. super-Earths in TW Hya; Dong et al. 2018; Mentiplay et al. 2019), since the mass threshold required for dust gap opening scales as (/)3 (Dipierro & Laibe 2017). However, such low mass planets would not be expected to carve corresponding gaps in the gas (Dong et al. 2015; Dipierro et al. 2016). More recently, Pinte et al. (2018) found strong evidence in favour of an embedded planet in the HD163296 disc, in the form of localised deviations from non-Keplerian motion seen in CO channel maps, consistent with signatures from planet-disc interaction predicted by Perez et al. (2015). Subsequent to this, Pinte et al. (2019) detected a similar localised velocity ‘kink’ in the transition disc around HD97048, providing direct kinematic evidence for a planet with a mass of 2–3 times that of Jupiter being responsible for carving the dust gap.
Most recently, Pinte et al. (2020) found tentative evidence for localised deviations from Keplerian motion in 8 of the 18 discs observed in the DSHARP survey, with the strongest evidence in favour of planets being that all of the candidate planets lie either in a dust gap or at the tip of a spiral arm seen in continuum emission. So while the dust has not yet settled on the mechanism behind gap and ring formation, the balance of evidence is tipping in favour of planets being responsible for at least a fraction of the observed rings and gaps. The planet hypothesis was already explored in detail for the DSHARP survey by Zhang et al. (2018).
The absence of deep rings and gaps in WLY 2-63 and ISO-Oph 37 is also intriguing, suggesting that these discs either have not yet formed planets, or that any planets are not yet sufficiently massive to carve deep gaps in the disc. High optical depths might also play a role in the lack of clear substructures. If the continuum optical depth is sufficiently high, even significant drops in surface density could remain undetected. However, for most sources, this is only likely to occur in the inner disc (Huang et al. 2018). Even in the case of the massive disc around WLY 2-63, the optical depth at 1.3 mm is estimated to approach unity outward of 25 au (Segura-Cox et al. 2020). Another possibility is that the mm-emitting dust may be well coupled to the gas in these discs and therefore not yet settled to the mid-plane. By contrast, the gap depths in ISO-Oph 54, ISO-Oph 17 and ISO-Oph 196 suggest the presence of sufficiently massive planets that kinematic follow-up may be able to reveal their presence within these gaps. ISO-Oph 196 appears similar, in terms of the size and location of the gap, to DS Tau for which predictions have been made suggesting that the kinematic detection of the planet with ALMA is possible (Veronesi et al. 2020).
Besides condensation fronts and planet-disc interaction, there are still other alternatives for the formation of rings and gaps, such as radial variations of disc viscosity which are expected from non-ideal MHD simulations (Uribe et al. 2011; Flock et al. 2012; Flock et al. 2015) and disc winds (Suriano et al. 2017, 2018, 2019; Riols & Lesur 2019; Riols et al. 2020). The observational predictions from such models are still unclear and therefore it remains as a crucial question how we can definitely distinguish a planetary gap from other mechanisms. In case of large gaps or cavities as observed in transition discs, there have been several efforts from the theoretical point of view to distinguish between planets and other alternatives, such as dead zones and/or MHD winds, as discuss in the next section.
4.2.2 Discs with large inner holes and their connection to disc evolution and planet formation
Since transition objects where first identified as discs with “inner holes" (Strom et al. 1993), they have been considered to be a key clue in the disc evolution and planet formation puzzle. However, transition discs are clearly a heterogeneous group of objects, with a wide range of SED shapes, disc masses, acretion rates, and multiplicity (Cieza et al. 2010; Espaillat et al. 2014; Pinilla et al. 2018; van der Marel et al. 2018). While some famous transition objects such as CoKu Tau 4 and HD 142527 are known to be circumbinary discs (Ireland & Kraus 2008; Lacour et al. 2016; Price et al. 2018), most transition objects lack stellar companions that could explain their inner holes (Ruíz-Rodríguez et al. 2016), although in several cases observations of strongly non-Keplerian kinematics and spiral arms hint at the presence of relatively massive bodies inside the cavity (Calcino et al. 2019; Poblete et al. 2020; Calcino et al. 2020).
Non-circumbinary transition discs can be divided into two distinct groups based in their disc masses and accretion rates, which might indicate different clearing processes (Owen & Clarke 2012). On the one hand, weak-line T Tauri stars (non-accreting objects) are mostly discless (Cieza et al. 2007; Wahhaj et al. 2010), but the ones that do have IR excesses tend to show transition disc SEDs and very low disc masses (Cieza et al. 2008; Hardy et al. 2015). The properties of such objects are most consistent with photoevaporation models and disc dissipation (Alexander et al. 2014) rather than with planet formation. On the other hand, massive and still accreting transition discs around single stars have been considered prime candidates for the formation sites of giant planets (e.g., Zhu et al. 2012; Pinilla et al. 2012). All transition discs in our long-baseline sample belong to this latter category and provide an opportunity to further investigate the planet-formation hypothesis.
We find that the transition objects in our sample have outer discs with complex radial profiles indicating substructures at 3-5 au scales (see Fig. 5). All the profiles peak near the edge of the cavities; however, ISO-Oph 2 and RXJ1633.9-2442 show only narrow rings, while SR 24S DoAr 44, and WSB 82 show inflection points and significant "plateaus" beyond the mm peaks. These profiles are strikingly similar to the model predictions of planet-disc interactions (Pinilla et al. 2015; Pinilla et al. 2019), in which giant planets inside the cavities produce pressure bumps in the outer discs, which in turn efficiently trap mm dust particles, resulting in relatively narrow peaks in the surface density profiles. The details of the profiles depend on time, the mass of the planet, the viscosity of the disc, and the distribution of particles sizes, among other parameters. Therefore, constraining the masses of the planets producing observed profiles requires both dedicated modeling and radiative transfer (to compare observed brightness profiles to numerical surface density profiles).
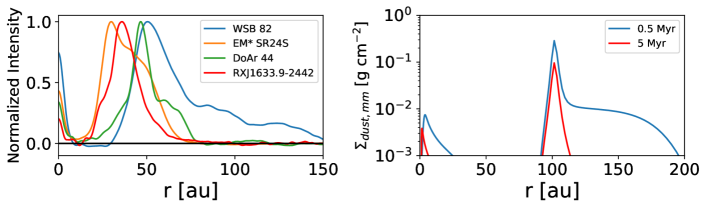
Just as an illustration, in Fig. 9 we show the radial profiles of WSB 82, DoAr 44, EM* SR 24S, and RXJ1633.9-2442, (left panel), next to the surface density distribution after 0.5 and 5 Myr of evolution of the millimeter-sized particles (0.1-10 mm) from dust evolution models (right panel). The model includes a massive planet (1 MJUP) at 70 au to create a large gap and the typical set-up from models in e.g. Pinilla et al. (2012); Pinilla et al. (2015); Pinilla et al. (2019). In short, this model includes the growth and fragmentation of dust particles when there is a large gap formed due to an embedded planet. The disc viscosity is assumed to be =10-3 and the threshold for the fragmentation is 10 ms-1. The surface density distribution at 0.5 Myr shows the "plateau" beyond the accumulation of the millimeter-sized particles in pressure maximum. This "plateau" is a result of dust that is still growing in the outer parts of the disc and drifting towards pressure maxima. The "plateau" vanishes with time when all the mm-sized particles have finally drift to the pressure bump. The inner dust disc also becomes more compact and it dissipates with time. We note that Fig. 9 compares observations in linear scale to model results in logarithmic scale and should only be considered qualitatively, not only for the reasons mentioned above (the lack of any fine-tuning and radiative transfer), but also because models of dust evolution in gas-rich discs tend to greatly overestimate the radial migration of mm-sized grains (e.g., Brauer et al. 2007). The detailed comparison of models to the observed profiles shown in Fig. 9 might provide hints on how to overcome the so-called "drift barrier", which is currently one of the main challenges in the fields of dust evolution and planet formation (Testi et al. 2014).
Pinilla et al. (2019) compared their models to multi-frequency ALMA data of EM* SR 24S at 0.1′′ (11 au) resolution and concluded that the observed brightness profiles were most consistent with a planet-induced inner hole and inconsistent with photoevaporation and dead zone models. As discussed in Sect. 4.1.9, they also concluded that the presence of an inner disc constrains the mass of the planet, even if only one is responsible for the cavity, to be less than 5 MJUP. Our high-resolution observations of transition discs should allow us to place further constrains on the properties of the embedded planets (Gonzalez-Ruilova et al. in prep). But, what is perhaps even more important, they provide strong evidence for planet formation being the main driver of substructures in massive (and accreting) discs.
The idea that the cavities of transition discs and the gaps seen in most disc sources observed at high resolution are mostly due to planet formation has been taken with much caution, considering that current core accretion models can not explain the formation of planets at tens of au separations within the age of the targets ( 1-3 Myr) and that most disc do not show evidence of gravitational instability. However, given the mounting evidence connecting transition disc cavities and rings to planets, planet formation is clearly becoming the leading explanation for the origin of substructures. This evidence now includes, not only the dust subtructures as in in Fig 9, but also independent indications such as the direct detection of protoplanets in the optical and infrared (Keppler et al. 2018; Haffert et al. 2019) and the kinematic detection of planets with ALMA (Pinte et al. 2019).
Since the observations very strongly suggest that giant planets can in fact form within cavities and gaps at tens of au or even at 100 au from the host star, it is worth considering whether most substructures seen in Ophiuchus at 3-5 au resolution are a result of planet formation processes. Before speculating about such idea in more detail in Sec. 4.2.4, we first discuss the demographic context of the long-baseline sample.
4.2.3 Demographic context
The architectures of planetary systems depend on different stellar properties, mainly mass, metallicity, and multiplicity (Winn & Fabrycky 2015). Since the metallicity is a very difficult parameter to investigate in pre-main-sequence star, stellar mass and multiplicity become the important variable to consider for the stellar population in Ophiuchus. Discs masses show a strong correlation with the mass of the host: Mdust (M⊙)1.3-1.9 (Pascucci et al. 2016; Andrews 2020). There is also at least an order of magnitude scatter around this correlation for a given stellar mass and age. Given our sample selection (the brightest 5 of the Ophiuchus disc population), our sample is heavily biased toward massive stars (solar or super solar) in the cloud and the most massive discs for a given stellar mass. As shown in Figure 1, most of the discs in Ophiuchus are fainter than a few mJy at 1.3 mm and only have a few Earth masses worth of dust. Most of the dusty discs are also smaller than 15 au in radius (Cieza et al. 2019). However they still meet the minimum requirements (in terms of mass and size) to form the kind of the terrestrial planets detected by Kepler or TESS, which are restricted to orbital separations 1 au (Batalha et al. 2013).
With disc masses of the order of a Minimum Mass Solar Nebula (Weidenschilling 1977), 10 MJUP (assuming a gas to dust mass ratio of 100), and radii 30 au, the Ophiuchus long-baseline sample actually contains the few objects in the cloud that are large enough and (currently) have enough mass to form giant planets at large separation. We find that 2/3 of these objects are located in the L1688 cluster (Fig. 7), which contains 50 of the YSOs in Ophiuchus. This suggests that the environment of this cluster does not strongly affect the presence of large and massive discs. However, as shown by Zurlo et al. (2020a), very large and massive discs in Ophiuchus are typically only present around single stars or wide separation binaries such as ISO-Oph 2 or EM* SR 24. Given the strong effects binaries have on disc sizes, masses, and lifetimes (Cieza et al. 2009; Kraus et al. 2012), the entire ODISEA sample is likely to be biased against medium-separation (1-100 au) binary systems. Instead, such binaries are likely to be part of the vast population of discless Ophiuchus members recently identified by Gaia (Cánovas et al. 2019). Gaia has identified over 150 new members, but the census of discless stars remains incomplete given the high extinction in the cloud; therefore, the total population of pre-main-sequence stars in Ophiuchus is likely to be over 500. This implies that the 15 objects in the Ophiuchus long-baseline sample correspond to 5 of the objects with discs but 3 of the pre-main-sequence population in the cloud. We therefore conclude that the Ophiuchus long-baseline sample represent a very small and special subset of the objects in the region and that these objects are the most likely formation sites of giant planets at large separations (r 5-100) au in the entire molecular cloud if such planets form through core accretion.
The discs around stars with and without giant planets are expected to evolve in different ways. The SEDs of YSOs do show evidence for different evolutionary paths (Cieza et al. 2007; Williams & Cieza 2011). While transition discs are very overrepresented in the literature, most of the Class II objects in molecular clouds have similar SEDs, which can be reproduced by a continuous disc extending down to the dust sublimation radius at 0.01 au (Ribas et al. 2017). Such SEDs can evolve from strong excesses at all near-IR and mid-IR wavelengths into SEDs with weaker but detectable excesses at the same wavelengths. Objects with these latter types of SEDs are know as anemic (Lada et al. 2006), homologously depleted (Currie et al. 2009), or weak excess (Muzerolle et al. 2010) discs. These objects are consistent with the dissipation of the disc without the formation of large cavities, except perhaps for the final inside-out clearing of the disc through photoevaporation, a fast process (Alexander et al. 2014) that is statistically difficult to observe. To match the statistics of exoplanet indicating that that M-type stars host an average of 2.2 0.3 rocky planets (R = 1-4 R⊕ and orbital period = 1.5-180 days (Gaidos et al. 2016), these numerous and "unremarkable" discs must be their main formation site. On the other hand, if massive discs with large dust cavities are associated to the formation of giant planets as discussed in the previous section, it is not surprising that such objects represent a significant fraction of the Ophiuchus long-baseline sample (33). Unfortunately, the incidence of 1 MJUP exoplanets at 10-100 au separations is not yet well constrained (Winn & Fabrycky 2015), and there is currently little overlap in the mass-separation plane between the population of known exoplanets and the potential population of planets derived from the properties of dust gaps observed in discs (e.g., Zhang et al. 2018) to allow for a direct comparison.
4.2.4 Towards an evolutionary sequence of substructures in massive discs
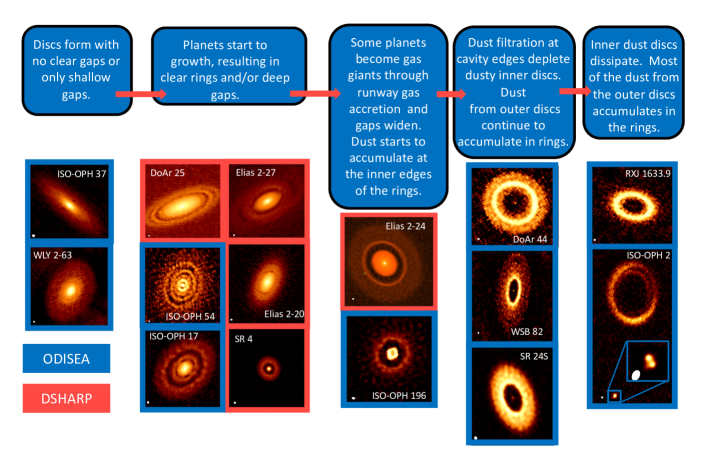
The Ophiuchus long-baseline sample is extraordinarily diverse in terms of SED Class and mm continuum morphologies and therefore provides a unique opportunity to speculate about the evolution of substructures of the most massive discs in a given molecular cloud. Even though each system is different and likely to form a distinct set of planets, most discs might still follow some common evolutionary steps, from formation to dissipation, which we illustrate in Fig. 10. As discussed in Sec. 2.2, the SED provides a good reference for the evolutionary stage of YSOs. While relatively small, the Ophiuchus long-baseline sample covers a wide range of SED classes (I, FS, II/full, II/PTD and II/TD). We find that only 33 (1/3) of the embedded (Class I/FS) sources show deep gaps and bright rings (i.e, ISO-Oph 54), while 100 (12/12) of the Class II objects present such features. Massive FU Ori discs like V883 Ori, V2775 Ori and V1647 Ori, which are believed to represent very early stages of disc evolution, also lack the obvious gaps seen in Class II sources (Cieza et al. 2016; Principe et al. in prep.) but show radial profiles with inflection points that could be due to changes in grain properties at snow lines. This suggests that the onset of bright rings and deep gaps occurs while discs are still embedded in their envelopes (age 1.0 Myr; Evans et al. 2009), but that substructures are not present from the start, with the possible exception of more subtle features that might be related to snow lines (first column in Fig. 10). The first pressure perturbations could be caused by magnetic effects (e.g., Flock et al. 2015) combined with wind-driven mass loss (e.g., Riols & Lesur 2019). Such perturbations would be enough to cause variations of the radial dust drift and so dust concentration and efficient growth. These locations could serve as the formation sites of planetary embryos.
By the time envelopes dissipate and the YSOs become Class II sources, the vast majority of massive discs have developed bright rings and/or deep gaps (second column). If the gaps are due to the growth of planets, their widths and depths should depend on the mass and location of the planet (Long et al. 2018). Most of the planets inferred from the gaps that have been observed have masses below or close to Neptune (Andrews 2020). In the core accretion model, gas giants form by the rapid runaway accretion of gaseous envelopes onto 10 M⊕ cores (Helled et al. 2014). The runaway gas accretion phase is expected to last of the order of 105 years for a 1 MJUP planet (Marley et al. 2007) and will continue for as long as there is material in the feeding zone. As the planets grows from 10 M⊕ cores to a 300 M⊕ giant planets, the gaps are expected to widen. At the same time, dust particles migrating in from the outer discs will start to accumulate at the strong pressure bumps produced by the newly-formed massive planets (third row in Fig. 10).
When giant planets accrete their envelopes, accretion is diverted onto the planets themselves and the accretion onto the stars is reduced by a factor of 10 (Lubow & D’Angelo 2006), in agreement with demographic results showing that transition discs have low accretion rates for a given disc mass (Najita et al. 2007). If planets become massive enough, they can even halt accretion onto the star completely (Lubow et al. 1999), isolating the inner disc from the outer disc, as with brown dwarf and stellar-mass companions. The complete isolation of the outer disc is not seen in the ODISEA long-baseline sample because all the transition discs have detectable accretion (see Table 4). In any case, when a giant planet is formed, the strong pressure bumps created will efficiently filter mm-sized dust grains (Zhu et al. 2012; Pinilla et al. 2016). This will prevent the replenishment of dust from the outer to the inner disc and the dusty inner disc will start to dissipate as dust grain rapidly migrate in (fourth row in Fig. 10). Meanwhile, in the absence of additional pressure bumps, dust particles in outer discs will also continue to radially drift and rings will become narrower. Eventually the dust in the inner disc will dissipate completely and/or grow beyond detectable sizes, leaving only detectable outer rings even in gas-accreting systems (last row in Fig. 10).
The scenario discussed above should be considered a tentative hypothesis at this point, but it represents a coherent picture of the evolution of substructures in discs that can be tested by detailed numerical modeling of each "evolutionary step" (e.g., see Sec. 4.2.2) and future observations. More observations of embedded sources at 3-5 au resolution would be particularly useful to investigate the timescale for the formation of gaps and rings. Given the low mass of the planets needed to produce the gaps and cavities observed, the proposed scenario is still consistent with the non-detection of planets in most transition discs (e.g., Zurlo et al. 2020b). However, future observations with JWST and the ELTs should result in more detection of protoplanets within gaps and cavities (e.g., PDS 70 b, PDS 70c), confirming the planetary origin of these substructures.
The implications of the proposed scenario are far-reaching as it would require planet formation through core accretion to be extremely fast (1-3 Myr) and efficient at many tens of au from the star, something that cannot be reproduced by current numerical models (Benz et al. 2014). It would also represent an opportunity to use disc substructures to investigate the architecture of nascent planetary systems and a population of planets that is currently very difficult to study by any other technique (planets with masses Saturn at tens of au from the host star). Since the ALMA images of TW Hydra at 1 au resolution (Andrews et al. 2016) suggest that rings and gaps are also common in discs less massive than the ones we are considering in Ophiuchus, similar studies with the future ngVLA would allow extending this novel "planet detection technique" to rocky planets within the snow lines of protoplanetary discs in nearby star-forming regions (Ricci et al. 2018).
4.3 Connection to substructures in debris discs
The substructures that we found in all massive Class II discs are likely to play an important role in the structure of massive debris discs if these are formed from the most massive Class II systems. This is because the substructure at tens of au overlays with the typical radii of exoKuiper belts (Matrà et al. 2018). This type of debris disc is the extrasolar analogues of the Kuiper belt, although with much higher dust levels sustained over Gyr timescales by destructive collisions of planetesimals at tens of au. Such planetesimal discs have masses (Krivov & Wyatt 2020), consistent with the present range of solid mass in the form of dust in our Class II targets. How the substructures in Class II discs relate to those of a young exoKuiper belt is an open question. Stammler et al. (2019) proposed that the bright rings in Class II discs are ideal formation locations for planetesimals via streaming instability, and this could explained the relatively uniform optical depth of these rings in the DHSARP sample. It is tempting to conclude then that a debris disc formed through this process will inherit the dust distribution in those locations where planetesimal formation conditions are met. However, as proposed here the structure of Class II discs is likely to evolve significantly over a few Myr. Therefore the structure of a debris disc might be set instead by the cumulative planetesimal formation history over multiple Class II disc stages. This might explain why debris discs are typically wider than substructure in Class II discs (Matrà et al. 2018, Matra et al. in prep). Alternatively, planetesimals in debris discs could form over a wide range of radii at the last stages of protoplanetary discs as gas densities drop due to photoevaporation and streaming instability becomes more efficient (Carrera et al. 2017). Both scenarios could lead to exoKuiper belts, although the latter scenario is less constrained by observations.
Thanks to ALMA, in the last few years tens of exoKuiper belts have been resolved (e.g. MacGregor et al. 2013; Dent et al. 2014; Marino et al. 2016; Matrà et al. 2018, and references therein) and their radial structure revealed. Of that sample only 6 systems have been resolved with a beam small enough to find substructure, 5 of which show evidence of gaps (Marino et al. 2018; Marino et al. 2019; Marino et al. 2020; MacGregor et al. 2019; Daley et al. 2019). Such gaps in the dust and planetesimal distribution could have been inherited from the dust distribution in their parent protoplanetary discs. Discs such as the one around ISO-OPH 2 ISO-OPH 54 indeed show gaps at 50-80 au, a range that is similar to the range in which gaps have been found in exoKuiper belts (Marino et al. 2020). Increasing the sample of observed systems with large protoplanetary and debris discs would provide better statistics on the propierties of gaps, which would help to assess if this type of substructures is simply inherited from the Class II stage or established afterwards.
A caveat in this direct comparison is that if the structure in Class II discs varies significantly over time in a given system, the structure of the product planetesimal disc might not resemble the instantaneous distribution of dust in a Class II disc. However, if gaps are indeed carved by planets, the properties of gaps in wide debris discs might already provide additional constraints for models that have attempted to predict the evolution of protoplanets responsible for gaps in protoplanetary discs (e.g. Lodato et al. 2019; Ndugu et al. 2019). For example, the location and width of a gap in debris discs could constrained the final mass and radial migration of those planets.
5 Summary and conclusions
We present 1.3 mm continuum ALMA long-baseline observations at 3-5 au resolution of the 10 brightest ODISEA targets not included in the DSHARP ALMA Cycle-4 Large Program. Our sample includes
objects with a wide range of SED types: Class I, Flat Spectrum, and Class II. This latter Class can be further divided into full, pre-transition, and transition discs.
Our main results can be summaries as follows:
1) By number, gaps and rings are the most common types of substructures.
We identify a total of 26 narrow rings and gaps (width/radius 1) distributed in 8 sources:
ISO-Oph 54 (4 rings and 4 gaps); ISO-Oph 17 (2 rings and 2 gaps); DoAr 44 (1 ring); WSB 82 (3 ring and 2 gaps), ISO-Oph 2A (2 rings, 1 gap); ISO-Oph 196 (2 rings and 1 gap), EM* SR 24S (1 ring), and RXJ1633.9-2442 (1 ring).
2) Two discs (WLY 2-63 and ISO-Oph 37) around embedded protostars with Flat Spectrum SEDs lack the clear gaps and rings that are ubiquitous in more evolved sources with Class II SEDs. However, the only Class I object in the sample (ISO-Oph 54), shows a large number of rings and gaps.
Since other embedded sources in the literature also lack clear gaps and rings,
this suggests that these substructures typically appear in the embedded stage of YSOs (age 1.0 Myr), but are not necessarily present from the formation of the disc. More observations of embedded sources at 3-5 au resolution are needed to confirm this trend.
3) The five Objects with large ( 20 au) dust cavities (ISO-Oph 2A; EM* SR 24S, DoAr 44, RXJ1633.9-2442, and WSB 82) exhibit different degrees of dust accumulation at the edges of their cavities, in agreement with numerical simulations of pressure bumps produced by giant planets. Three of the five objects mentioned above (EM* SR 24S, DoAr 44, and WSB 82) have small inner dust discs detected by ALMA, which strengthen the evidence for a planetary origin of the cavities and rules out the photoevaporation mechanism. At least in the case of EM* SR 24S, analysis of multi-frequency ALMA data has been used to also rule out an inner cavity produced by dead zones. The other 2 objects with large dust cavities (ISO-Oph 2A and RXJ1633.9-2442) have outer discs with ring-like morphologies and lack ALMA-detected inner dust discs. These systems are consistent with more "evolved" planet-induced cavities in which the dust in the inner disc has already drifted towards the star, and most of the dust in the outer disc has accumulated in narrow rings (i.e., the dust is trapped in a pressure bump).
Three additional discs (ISO-Oph 2B; ISO-Oph 54, and ISO-Oph 196) have much smaller (r 2.2-8.5 au) dust cavities.
4) We combine our ODISEA long-baseline sample with the brightest Ophiuchus objects observed by DSHARP to create a flux-limited sample (F 70 mJy) and construct a putative evolutionary sequence in which the substructures observed in massive protoplanetary discs are mostly the result of planet formation and dust evolution.
The sequence starts with discs without detectable gaps, but these start to appear with the formation of planets massive enough to carve them. Eventually, some of the planets reach the critical mass to undergo runaway gas accretion and become gas giants. These gas giants produce wider gaps and pressure bumps in the outer disc. The pressure bumps efficiently filter the mm-sized dust grain and the dusty inner discs start to dissipate. Radial drift in the outer disc also accumulate the dust near the edge of the cavity. The process continues until the inner dust discs dissipate in the absence of an inner trap that stop the radial drift of the particles, and all the dust in the outer disc is accumulated in a narrow ring.
5) Given the age of the sample (1-3 Myr), the scenario outlined above requires planet formation to be extremely fast and efficient at many tens of au distances. Once the cores of giant planets are formed, the run away gas accretion process is fast and relatively well understood. How planet cores massive enough to open detectable gaps at distances as large as 100 au in the timescales involved remains an open question. However, observational evidence is accumulating in this direction from several independent lines of research (dust continuum imaging, gas kinematics, and direct detection in the IR). Independently of the details of the planet formation process, dedicated studies of substructure in discs with ALMA might provide an avenue to investigate the demographics of recently-formed ice and gas giants at 5-100 au distances from the star.
Acknowledgements
We thank the anonymous referee for his/her constructive comments and suggestions.
This paper makes use of the following ALMA data: ADS/JAO.ALMA 2018.1.00028.S and 2016.1.00545.S.
ALMA is a partnership of ESO (representing its member states), NSF (USA) and NINS (Japan), together with NRC (Canada), MOST and ASIAA (Taiwan), and KASI (Republic of Korea), in cooperation with the Republic of Chile. The Joint ALMA Observatory is operated by ESO, AUI/NRAO and NAOJ. The National Radio Astronomy Observatory is a facility of the National Science Foundation operated under cooperative agreement by Associated Universities, Inc.
This work has made use of data from the European Space Agency (ESA) mission
Gaia (https://www.cosmos.esa.int/gaia), processed by the Gaia
Data Processing and Analysis Consortium (DPAC,
https://www.cosmos.esa.int/web/gaia/dpac/consortium). Funding for the DPAC
has been provided by national institutions, in particular the institutions
participating in the Gaia Multilateral Agreement.
J.P.W. acknowledges support from NSF grant AST-1907486. P.P. acknowledges support provided by the Alexander von Humboldt Foundation in the framework of the Sofja Kovalevskaja Award endowed by the Federal Ministry of Education and Research.
D.J.P. acknowledges Australian Research Council funding via grants DP180104235 and FT130100034. M.F. acknowledges support by the European Research Council (ERC) project under the European Union’s Horizon 2020 research and innovation program number 757957.
Data availability
The data underlying this article are available in the ALMA archive at https://almascience.eso.org/asax/ under project codes 2018.1.00028.S and 2016.1.00545.S.
References
- ALMA Partnership et al. (2015) ALMA Partnership et al., 2015, ApJ, 808, L3
- Alexander et al. (2014) Alexander R., Pascucci I., Andrews S., Armitage P., Cieza L., 2014, in Beuther H., Klessen R. S., Dullemond C. P., Henning T., eds, Protostars and Planets VI. p. 475 (arXiv:1311.1819), doi:10.2458/azu_uapress_9780816531240-ch021
- Allard et al. (2012) Allard F., Homeier D., Freytag B., 2012, Philosophical Transactions of the Royal Society of London Series A, 370, 2765
- Andrews (2020) Andrews S. M., 2020, arXiv e-prints, p. arXiv:2001.05007
- Andrews & Williams (2005) Andrews S. M., Williams J. P., 2005, ApJ, 619, L175
- Andrews et al. (2016) Andrews S. M., et al., 2016, ApJ, 820, L40
- Andrews et al. (2018) Andrews S. M., et al., 2018, ApJ, 869, L41
- Baraffe et al. (2002) Baraffe I., Chabrier G., Allard F., Hauschildt P. H., 2002, A&A, 382, 563
- Batalha et al. (2013) Batalha N. M., et al., 2013, ApJS, 204, 24
- Beckwith et al. (1990) Beckwith S. V. W., Sargent A. I., Chini R. S., Guesten R., 1990, AJ, 99, 924
- Benz et al. (2014) Benz W., Ida S., Alibert Y., Lin D., Mordasini C., 2014, in Beuther H., Klessen R. S., Dullemond C. P., Henning T., eds, Protostars and Planets VI. p. 691 (arXiv:1402.7086), doi:10.2458/azu_uapress_9780816531240-ch030
- Birnstiel et al. (2018) Birnstiel T., et al., 2018, ApJ, 869, L45
- Brauer et al. (2007) Brauer F., Dullemond C. P., Johansen A., Henning T., Klahr H., Natta A., 2007, A&A, 469, 1169
- Calcino et al. (2019) Calcino J., Price D. J., Pinte C., van der Marel N., Ragusa E., Dipierro G., Cuello N., Christiaens V., 2019, MNRAS, 490, 2579
- Calcino et al. (2020) Calcino J., Christiaens V., Price D. J., Pinte C., Davis T. M., van der Marel N., Cuello N., 2020, MNRAS, 498, 639
- Cánovas et al. (2019) Cánovas H., et al., 2019, A&A, 626, A80
- Carrera et al. (2017) Carrera D., Gorti U., Johansen A., Davies M. B., 2017, ApJ, 839, 16
- Casassus & Pérez (2019) Casassus S., Pérez S., 2019, ApJ, 883, L41
- Casassus et al. (2008) Casassus S., et al., 2008, MNRAS, 391, 1075
- Casassus et al. (2018) Casassus S., et al., 2018, MNRAS, 477, 5104
- Chambers et al. (2016) Chambers K. C., et al., 2016, arXiv e-prints, p. arXiv:1612.05560
- Cieza et al. (2007) Cieza L., et al., 2007, ApJ, 667, 308
- Cieza et al. (2008) Cieza L. A., Swift J. J., Mathews G. S., Williams J. P., 2008, ApJ, 686, L115
- Cieza et al. (2009) Cieza L. A., et al., 2009, ApJ, 696, L84
- Cieza et al. (2010) Cieza L. A., et al., 2010, ApJ, 712, 925
- Cieza et al. (2012) Cieza L. A., et al., 2012, ApJ, 752, 75
- Cieza et al. (2016) Cieza L. A., et al., 2016, Nature, 535, 258
- Cieza et al. (2017) Cieza L. A., et al., 2017, ApJ, 851, L23
- Cieza et al. (2019) Cieza L. A., et al., 2019, MNRAS, 482, 698
- Cox et al. (2017) Cox E. G., et al., 2017, ApJ, 851, 83
- Crida et al. (2006) Crida A., Morbidelli A., Masset F., 2006, Icarus, 181, 587
- Currie et al. (2009) Currie T., Lada C. J., Plavchan P., Robitaille T. P., Irwin J., Kenyon S. J., 2009, ApJ, 698, 1
- Cutri et al. (2003) Cutri R. M., et al., 2003, 2MASS All Sky Catalog of point sources.
- Daley et al. (2019) Daley C., et al., 2019, ApJ, 875, 87
- Dent et al. (2014) Dent W. R. F., et al., 2014, Science, 343, 1490
- Dipierro & Laibe (2017) Dipierro G., Laibe G., 2017, MNRAS, 469, 1932
- Dipierro et al. (2015) Dipierro G., Price D., Laibe G., Hirsh K., Cerioli A., Lodato G., 2015, MNRAS, 453, L73
- Dipierro et al. (2016) Dipierro G., Laibe G., Price D. J., Lodato G., 2016, MNRAS, 459, L1
- Dong & Fung (2017) Dong R., Fung J., 2017, ApJ, 835, 146
- Dong et al. (2015) Dong R., Zhu Z., Whitney B., 2015, ApJ, 809, 93
- Dong et al. (2017) Dong R., Li S., Chiang E., Li H., 2017, ApJ, 843, 127
- Dong et al. (2018) Dong R., Li S., Chiang E., Li H., 2018, ApJ, 866, 110
- Doppmann et al. (2005) Doppmann G. W., Greene T. P., Covey K. R., Lada C. J., 2005, AJ, 130, 1145
- Duffell & MacFadyen (2013) Duffell P. C., MacFadyen A. I., 2013, ApJ, 769, 41
- Dullemond & Penzlin (2018) Dullemond C. P., Penzlin A. B. T., 2018, A&A, 609, A50
- Enoch et al. (2009) Enoch M. L., Evans Neal J. I., Sargent A. I., Glenn J., 2009, ApJ, 692, 973
- Espaillat et al. (2014) Espaillat C., et al., 2014, in Beuther H., Klessen R. S., Dullemond C. P., Henning T., eds, Protostars and Planets VI. p. 497 (arXiv:1402.7103), doi:10.2458/azu_uapress_9780816531240-ch022
- Evans et al. (2009) Evans Neal J. I., et al., 2009, ApJS, 181, 321
- Fitzpatrick (1999) Fitzpatrick E. L., 1999, PASP, 111, 63
- Flock et al. (2012) Flock M., Henning T., Klahr H., 2012, ApJ, 761, 95
- Flock et al. (2015) Flock M., Ruge J. P., Dzyurkevich N., Henning T., Klahr H., Wolf S., 2015, A&A, 574, A68
- Francis & van der Marel (2020) Francis L., van der Marel N., 2020, ApJ, 892, 111
- Gaia Collaboration et al. (2018) Gaia Collaboration et al., 2018, A&A, 616, A1
- Gaidos et al. (2016) Gaidos E., Mann A. W., Kraus A. L., Ireland M., 2016, MNRAS, 457, 2877
- Gatti et al. (2006) Gatti T., Testi L., Natta A., Randich S., Muzerolle J., 2006, A&A, 460, 547
- González-Ruilova et al. (2020) González-Ruilova C., et al., 2020, ApJ, 902, L33
- Gonzalez et al. (2015) Gonzalez J. F., Laibe G., Maddison S. T., Pinte C., Ménard F., 2015, MNRAS, 454, L36
- Haffert et al. (2019) Haffert S. Y., Bohn A. J., de Boer J., Snellen I. A. G., Brinchmann J., Girard J. H., Keller C. U., Bacon R., 2019, Nature Astronomy, 3, 749
- Hardy et al. (2015) Hardy A., et al., 2015, A&A, 583, A66
- Helled et al. (2014) Helled R., et al., 2014, in Beuther H., Klessen R. S., Dullemond C. P., Henning T., eds, Protostars and Planets VI. p. 643 (arXiv:1311.1142), doi:10.2458/azu_uapress_9780816531240-ch028
- Huang et al. (2018) Huang J., et al., 2018, ApJ, 869, L42
- Hughes et al. (2007) Hughes A. M., Wilner D. J., Calvet N., D’Alessio P., Claussen M. J., Hogerheijde M. R., 2007, ApJ, 664, 536
- Indebetouw et al. (2005) Indebetouw R., et al., 2005, ApJ, 619, 931
- Ireland & Kraus (2008) Ireland M. J., Kraus A. L., 2008, ApJ, 678, L59
- Isella et al. (2019) Isella A., Benisty M., Teague R., Bae J., Keppler M., Facchini S., Pérez L., 2019, ApJ, 879, L25
- Jennings et al. (2020) Jennings J., Booth R. A., Tazzari M., Rosotti G. P., Clarke C. J., 2020, MNRAS, 495, 3209
- Keppler et al. (2018) Keppler M., et al., 2018, A&A, 617, A44
- Kraus et al. (2012) Kraus A. L., Ireland M. J., Hillenbrand L. A., Martinache F., 2012, ApJ, 745, 19
- Krivov & Wyatt (2020) Krivov A. V., Wyatt M. C., 2020, MNRAS,
- Lacour et al. (2016) Lacour S., et al., 2016, A&A, 590, A90
- Lada (1987) Lada C. J., 1987, in Peimbert M., Jugaku J., eds, IAU Symposium Vol. 115, Star Forming Regions. p. 1
- Lada et al. (2006) Lada C. J., et al., 2006, AJ, 131, 1574
- Lodato et al. (2019) Lodato G., et al., 2019, MNRAS, 486, 453
- Long et al. (2018) Long F., et al., 2018, ApJ, 869, 17
- Lorén-Aguilar & Bate (2015) Lorén-Aguilar P., Bate M. R., 2015, MNRAS, 453, L78
- Lubow & D’Angelo (2006) Lubow S. H., D’Angelo G., 2006, ApJ, 641, 526
- Lubow et al. (1999) Lubow S. H., Seibert M., Artymowicz P., 1999, ApJ, 526, 1001
- Lynds (1962) Lynds B. T., 1962, ApJS, 7, 1
- MacGregor et al. (2013) MacGregor M. A., et al., 2013, ApJ, 762, L21
- MacGregor et al. (2019) MacGregor M. A., et al., 2019, ApJ, 877, L32
- Manara et al. (2014) Manara C. F., Testi L., Natta A., Rosotti G., Benisty M., Ercolano B., Ricci L., 2014, A&A, 568, A18
- Marino et al. (2016) Marino S., et al., 2016, MNRAS, 460, 2933
- Marino et al. (2018) Marino S., et al., 2018, MNRAS, 479, 5423
- Marino et al. (2019) Marino S., Yelverton B., Booth M., Faramaz V., Kennedy G. M., Matrà L., Wyatt M. C., 2019, MNRAS, 484, 1257
- Marino et al. (2020) Marino S., et al., 2020, MNRAS, 498, 1319
- Marley et al. (2007) Marley M. S., Fortney J. J., Hubickyj O., Bodenheimer P., Lissauer J. J., 2007, ApJ, 655, 541
- Matrà et al. (2018) Matrà L., Marino S., Kennedy G. M., Wyatt M. C., Öberg K. I., Wilner D. J., 2018, ApJ, 859, 72
- Mayama et al. (2010) Mayama S., et al., 2010, Science, 327, 306
- McMullin et al. (2007) McMullin J. P., Waters B., Schiebel D., Young W., Golap K., 2007, in Shaw R. A., Hill F., Bell D. J., eds, Astronomical Society of the Pacific Conference Series Vol. 376, Astronomical Data Analysis Software and Systems XVI. p. 127
- Mentiplay et al. (2019) Mentiplay D., Price D. J., Pinte C., 2019, MNRAS, 484, L130
- Miotello et al. (2016) Miotello A., van Dishoeck E. F., Kama M., Bruderer S., 2016, A&A, 594, A85
- Muzerolle et al. (2010) Muzerolle J., Allen L. E., Megeath S. T., Hernández J., Gutermuth R. A., 2010, ApJ, 708, 1107
- Najita et al. (2007) Najita J. R., Strom S. E., Muzerolle J., 2007, MNRAS, 378, 369
- Natta et al. (2006) Natta A., Testi L., Randich S., 2006, A&A, 452, 245
- Ndugu et al. (2019) Ndugu N., Bitsch B., Jurua E., 2019, MNRAS, 488, 3625
- Okuzumi et al. (2016) Okuzumi S., Momose M., Sirono S.-i., Kobayashi H., Tanaka H., 2016, ApJ, 821, 82
- Owen & Clarke (2012) Owen J. E., Clarke C. J., 2012, MNRAS, 426, L96
- Padgett et al. (2008) Padgett D. L., et al., 2008, ApJ, 672, 1013
- Pascucci et al. (2016) Pascucci I., et al., 2016, ApJ, 831, 125
- Pecaut & Mamajek (2013) Pecaut M. J., Mamajek E. E., 2013, ApJS, 208, 9
- Perez et al. (2015) Perez S., Dunhill A., Casassus S., Roman P., Szulágyi J., Flores C., Marino S., Montesinos M., 2015, ApJ, 811, L5
- Pérez et al. (2019) Pérez S., Casassus S., Baruteau C., Dong R., Hales A., Cieza L., 2019, AJ, 158, 15
- Pinilla et al. (2012) Pinilla P., Benisty M., Birnstiel T., 2012, A&A, 545, A81
- Pinilla et al. (2015) Pinilla P., de Juan Ovelar M., Ataiee S., Benisty M., Birnstiel T., van Dishoeck E. F., Min M., 2015, A&A, 573, A9
- Pinilla et al. (2016) Pinilla P., Klarmann L., Birnstiel T., Benisty M., Dominik C., Dullemond C. P., 2016, A&A, 585, A35
- Pinilla et al. (2017) Pinilla P., et al., 2017, ApJ, 839, 99
- Pinilla et al. (2018) Pinilla P., et al., 2018, ApJ, 859, 32
- Pinilla et al. (2019) Pinilla P., Benisty M., Cazzoletti P., Harsono D., Pérez L. M., Tazzari M., 2019, ApJ, 878, 16
- Pinte et al. (2016) Pinte C., Dent W. R. F., Ménard F., Hales A., Hill T., Cortes P., de Gregorio-Monsalvo I., 2016, ApJ, 816, 25
- Pinte et al. (2018) Pinte C., et al., 2018, ApJ, 860, L13
- Pinte et al. (2019) Pinte C., et al., 2019, Nature Astronomy, 3, 1109
- Pinte et al. (2020) Pinte C., et al., 2020, ApJ, 890, L9
- Poblete et al. (2020) Poblete P. P., Calcino J., Cuello N., Macías E., Ribas Á., Price D. J., Cuadra J., Pinte C., 2020, MNRAS, 496, 2362
- Price et al. (2018) Price D. J., et al., 2018, MNRAS, 477, 1270
- Rebollido et al. (2015) Rebollido I., et al., 2015, A&A, 581, A30
- Reipurth & Zinnecker (1993) Reipurth B., Zinnecker H., 1993, A&A, 278, 81
- Ribas et al. (2017) Ribas Á., et al., 2017, ApJ, 849, 63
- Ricci et al. (2010) Ricci L., Testi L., Natta A., Brooks K. J., 2010, A&A, 521, A66
- Ricci et al. (2018) Ricci L., Liu S.-F., Isella A., Li H., 2018, ApJ, 853, 110
- Rice et al. (2006) Rice W. K. M., Armitage P. J., Wood K., Lodato G., 2006, MNRAS, 373, 1619
- Riols & Lesur (2019) Riols A., Lesur G., 2019, A&A, 625, A108
- Riols et al. (2020) Riols A., Lesur G., Menard F., 2020, A&A, 639, A95
- Rosotti et al. (2016) Rosotti G. P., Juhasz A., Booth R. A., Clarke C. J., 2016, MNRAS, 459, 2790
- Ruíz-Rodríguez et al. (2016) Ruíz-Rodríguez D., Ireland M., Cieza L., Kraus A., 2016, MNRAS, 463, 3829
- Segura-Cox et al. (2020) Segura-Cox D. M., et al., 2020, Nature, 586, 228
- Sheehan & Eisner (2018) Sheehan P. D., Eisner J. A., 2018, ApJ, 857, 18
- Soderblom et al. (2014) Soderblom D. R., Hillenbrand L. A., Jeffries R. D., Mamajek E. E., Naylor T., 2014, in Beuther H., Klessen R. S., Dullemond C. P., Henning T., eds, Protostars and Planets VI. p. 219 (arXiv:1311.7024), doi:10.2458/azu_uapress_9780816531240-ch010
- Stammler et al. (2019) Stammler S. M., Drążkowska J., Birnstiel T., Klahr H., Dullemond C. P., Andrews S. M., 2019, ApJ, 884, L5
- Strom et al. (1993) Strom S. E., Edwards S., Skrutskie M. F., 1993, in Levy E. H., Lunine J. I., eds, Protostars and Planets III. p. 837
- Suriano et al. (2017) Suriano S. S., Li Z.-Y., Krasnopolsky R., Shang H., 2017, MNRAS, 468, 3850
- Suriano et al. (2018) Suriano S. S., Li Z.-Y., Krasnopolsky R., Shang H., 2018, MNRAS, 477, 1239
- Suriano et al. (2019) Suriano S. S., Li Z.-Y., Krasnopolsky R., Suzuki T. K., Shang H., 2019, MNRAS, 484, 107
- Takahashi & Inutsuka (2014) Takahashi S. Z., Inutsuka S.-i., 2014, ApJ, 794, 55
- Teague et al. (2018) Teague R., Bae J., Bergin E. A., Birnstiel T., Foreman-Mackey D., 2018, ApJ, 860, L12
- Testi et al. (2014) Testi L., et al., 2014, in Beuther H., Klessen R. S., Dullemond C. P., Henning T., eds, Protostars and Planets VI. p. 339 (arXiv:1402.1354), doi:10.2458/azu_uapress_9780816531240-ch015
- Uribe et al. (2011) Uribe A. L., Klahr H., Flock M., Henning T., 2011, ApJ, 736, 85
- Veronesi et al. (2020) Veronesi B., et al., 2020, MNRAS, 495, 1913
- Wahhaj et al. (2010) Wahhaj Z., et al., 2010, ApJ, 724, 835
- Weidenschilling (1977) Weidenschilling S. J., 1977, MNRAS, 180, 57
- Williams & Cieza (2011) Williams J. P., Cieza L. A., 2011, ARA&A, 49, 67
- Williams et al. (2019) Williams J. P., Cieza L., Hales A., Ansdell M., Ruiz-Rodriguez D., Casassus S., Perez S., Zurlo A., 2019, ApJ, 875, L9
- Winn & Fabrycky (2015) Winn J. N., Fabrycky D. C., 2015, ARA&A, 53, 409
- Wright et al. (2010) Wright E. L., et al., 2010, AJ, 140, 1868
- Youdin (2011) Youdin A. N., 2011, ApJ, 731, 99
- Zhang et al. (2015) Zhang K., Blake G. A., Bergin E. A., 2015, ApJ, 806, L7
- Zhang et al. (2018) Zhang S., et al., 2018, ApJ, 869, L47
- Zhu et al. (2012) Zhu Z., Nelson R. P., Dong R., Espaillat C., Hartmann L., 2012, ApJ, 755, 6
- Zurlo et al. (2020a) Zurlo A., et al., 2020a, MNRAS, 496, 5089
- Zurlo et al. (2020b) Zurlo A., et al., 2020b, A&A, 633, A119
- de Val-Borro et al. (2006) de Val-Borro M., et al., 2006, MNRAS, 370, 529
- van der Marel et al. (2016) van der Marel N., van Dishoeck E. F., Bruderer S., Andrews S. M., Pontoppidan K. M., Herczeg G. J., van Kempen T., Miotello A., 2016, A&A, 585, A58
- van der Marel et al. (2018) van der Marel N., et al., 2018, ApJ, 854, 177
Appendix A Brightness profile reconstruction using Frankenstein code