Eridanus II: A Fossil from Reionization with an Off-Center Star Cluster
Abstract
We present deep Hubble Space Telescope (HST) photometry of the ultra-faint dwarf galaxy Eridanus II (Eri II). Eri II, which has an absolute magnitude of , is located at a distance of 339 kpc, just beyond the virial radius of the Milky Way. We determine the star formation history of Eri II and measure the structure of the galaxy and its star cluster. We find that a star formation history consisting of two bursts, constrained to match the spectroscopic metallicity distribution of the galaxy, accurately describes the Eri II stellar population. The best-fit model implies a rapid truncation of star formation at early times, with of the stellar mass in place before . A small fraction of the stars could be as young as 8 Gyr, but this population is not statistically significant; Monte Carlo simulations recover a component younger than 9 Gyr only 15% of the time, where they represent an average of 74% of the population. These results are consistent with theoretical expectations for quenching by reionization. The HST depth and angular resolution enable us to show that Eri II’s cluster is offset from the center of the galaxy by a projected distance of pc. This offset could be an indication of a small ( pc) dark matter core in Eri II. Moreover, we demonstrate that the cluster has a high ellipticity of and is aligned with the orientation of Eri II within degrees, likely due to tides. The stellar population of the cluster is indistinguishable from that of Eri II itself.
Subject headings:
galaxies: dwarf; galaxies: individual (Eridanus II); galaxies: stellar content; Local Group;1. INTRODUCTION
Nearly 50 years ago, Einasto et al. (1974) pointed out a striking trend among the satellites of the Milky Way and other large spiral galaxies: the dwarf galaxies located closest to a massive galaxy are almost exclusively dwarf spheroidals containing little or no gas, while more distant satellites are largely dwarf irregulars hosting significant amounts of neutral gas. Einasto et al. (1974) and subsequent authors (e.g., Lin & Faber, 1983; van den Bergh, 1999) attributed this spatial segregation of different morphological types to ram-pressure stripping by hot halo gas. Blitz & Robishaw (2000) brought this result into sharper focus by showing that around the Milky Way and M31, gas-rich dwarfs are strictly limited to distances greater than 250 kpc.111Blitz & Robishaw (2000) ignored the potential counterexample of the Magellanic Clouds because they were focused on much lower-mass satellites that can be stripped more easily. Of course, we now know that the explanation for the presence of the gas-rich Magellanic Clouds so close to the Galaxy is that they were first accreted by the Milky Way quite recently (Besla et al., 2007; Kallivayalil et al., 2013). The discovery of plentiful star-forming dwarf galaxies around Milky Way-mass hosts by Geha et al. (2017) suggests that satellites more luminous than the Milky Way dwarf spheroidals () may not obey this rule as they are more difficult to strip.
The discovery of large numbers of dwarf galaxies in the Local Group over the past 15 years (e.g., Willman et al., 2005; Zucker et al., 2006; Martin et al., 2006; Belokurov et al., 2007; McConnachie et al., 2008; Richardson et al., 2011; Bechtol et al., 2015; Koposov et al., 2015; Drlica-Wagner et al., 2015) has not changed this picture. With the single exception of Leo T (Irwin et al., 2007; Ryan-Weber et al., 2008), located at a distance of 409 kpc (Clementini et al., 2012), all of the recently-identified Milky Way and M31 satellites are devoid of gas (e.g., Bailin & Ford, 2007; Grcevich & Putman, 2009; Spekkens et al., 2014; Westmeier et al., 2015; Mutlu-Pakdil et al., 2018).
A particularly interesting object in this regard is Eridanus II (Eri II), discovered by Bechtol et al. (2015) and Koposov et al. (2015). At a distance of 366 kpc (Crnojević et al., 2016), Eri II joins Leo T as the only newly discovered dwarfs that appear to be associated with the Milky Way but are currently outside its presumed virial radius. The two galaxies also have similar luminosities, with Eri II fainter by a factor of (de Jong et al., 2008; Crnojević et al., 2016). However, while Leo T contains M⊙ of neutral hydrogen (Adams & Oosterloo, 2018), the upper limit on the gas content of Eri II is more than two orders of magnitude smaller (Crnojević et al., 2016). On the other hand, Koposov et al. (2015) identified a handful of bright blue stars coincident with Eri II whose colors and luminosities are consistent with a 250 Myr stellar population, suggesting that star formation might have continued until very recently. Later spectroscopy of 5 out of the 7 candidate young stars by Li et al. (2017) showed that they are not associated with Eri II, casting significant doubt on the hypothesis of recent star formation. These observational results raise obvious questions: Did Eri II lose its gas within the last few hundred Myr? Could environmental processes have been responsible for ending its star formation despite its large distance from the Milky Way?
Adding to the intrigue surrounding Eri II is the possible presence of a central star cluster in the galaxy. In the discovery images from the Dark Energy Survey, Koposov et al. (2015) noted a “curious fuzzy object which can be interpreted as a very faint GC [globular cluster].” Crnojević et al. (2016) confirmed the identification of this cluster using deeper ground-based imaging, making Eri II the lowest-mass galaxy known to host a cluster by several orders of magnitude. At around the same time, Cusano et al. (2016) detected a stellar overdensity near the center of the dwarf spheroidal Andromeda XXV, which at more luminous than Eri II would be the next faintest galaxy containing a cluster. Brandt (2016) showed that the survival of a cluster near the center of a dwarf galaxy has significant implications for the viability of dark matter made up of massive compact halo objects (see also Li et al., 2017; Zoutendijk et al., 2020), and Marsh & Niemeyer (2019) pointed out that the cluster could also be used to constrain models of ultra-light dark matter.
Motivated by the possible presence of young stars, the lack of gas, and its distance beyond the apparent quenching radius of the Milky Way, we obtained deep Hubble Space Telescope (HST) imaging of Eri II to determine its star formation history (SFH). These data reach below the main sequence turnoff of Eri II for the first time. In this paper we report our measurements of the SFH and structure of Eri II using the HST photometry. In Section 2 we describe our processing of the data and photometric procedures. We determine the distance of Eri II and derive its SFH in Section 3. We measure the structural parameters of Eri II and its cluster in Section 4. In Section 5 we discuss the implications of our results for the evolution of the galaxy and the cluster, as well as various dark matter models, and in Section 6 we summarize our results and conclude.
2. HUBBLE SPACE TELESCOPE DATA
2.1. Observations
We observed Eri II with the Wide Field Channel of the Advanced Camera for Surveys (ACS; Ford et al. 2003) on HST through program GO-14234 (PI: Simon). The observations were scheduled over seven visits between 2016 January 16 and 2016 February 8. We devoted four visits (8 orbits) to imaging in the F814W filter, totaling 20680 s. The remaining three visits (two visits of 2 orbits each and one single orbit visit) were used to image Eri II in the F606W filter, totaling 12830 s. The exposure times were chosen in order to reach a signal-to-noise ratio (S/N) of 10 at 1 mag below the oldest main sequence turnoff in each filter. This target S/N is significantly lower than that achieved by the ultra-faint dwarf imaging by Brown et al. (2012, 2014) because Eri II is farther away than the previously observed systems, but it is still sufficient to provide useful constraints on the star formation history (e.g., Gallart et al., 1999; Monelli et al., 2010; Hidalgo et al., 2011; Weisz et al., 2012, 2014; Geha et al., 2015; Skillman et al., 2017; Albers et al., 2019).
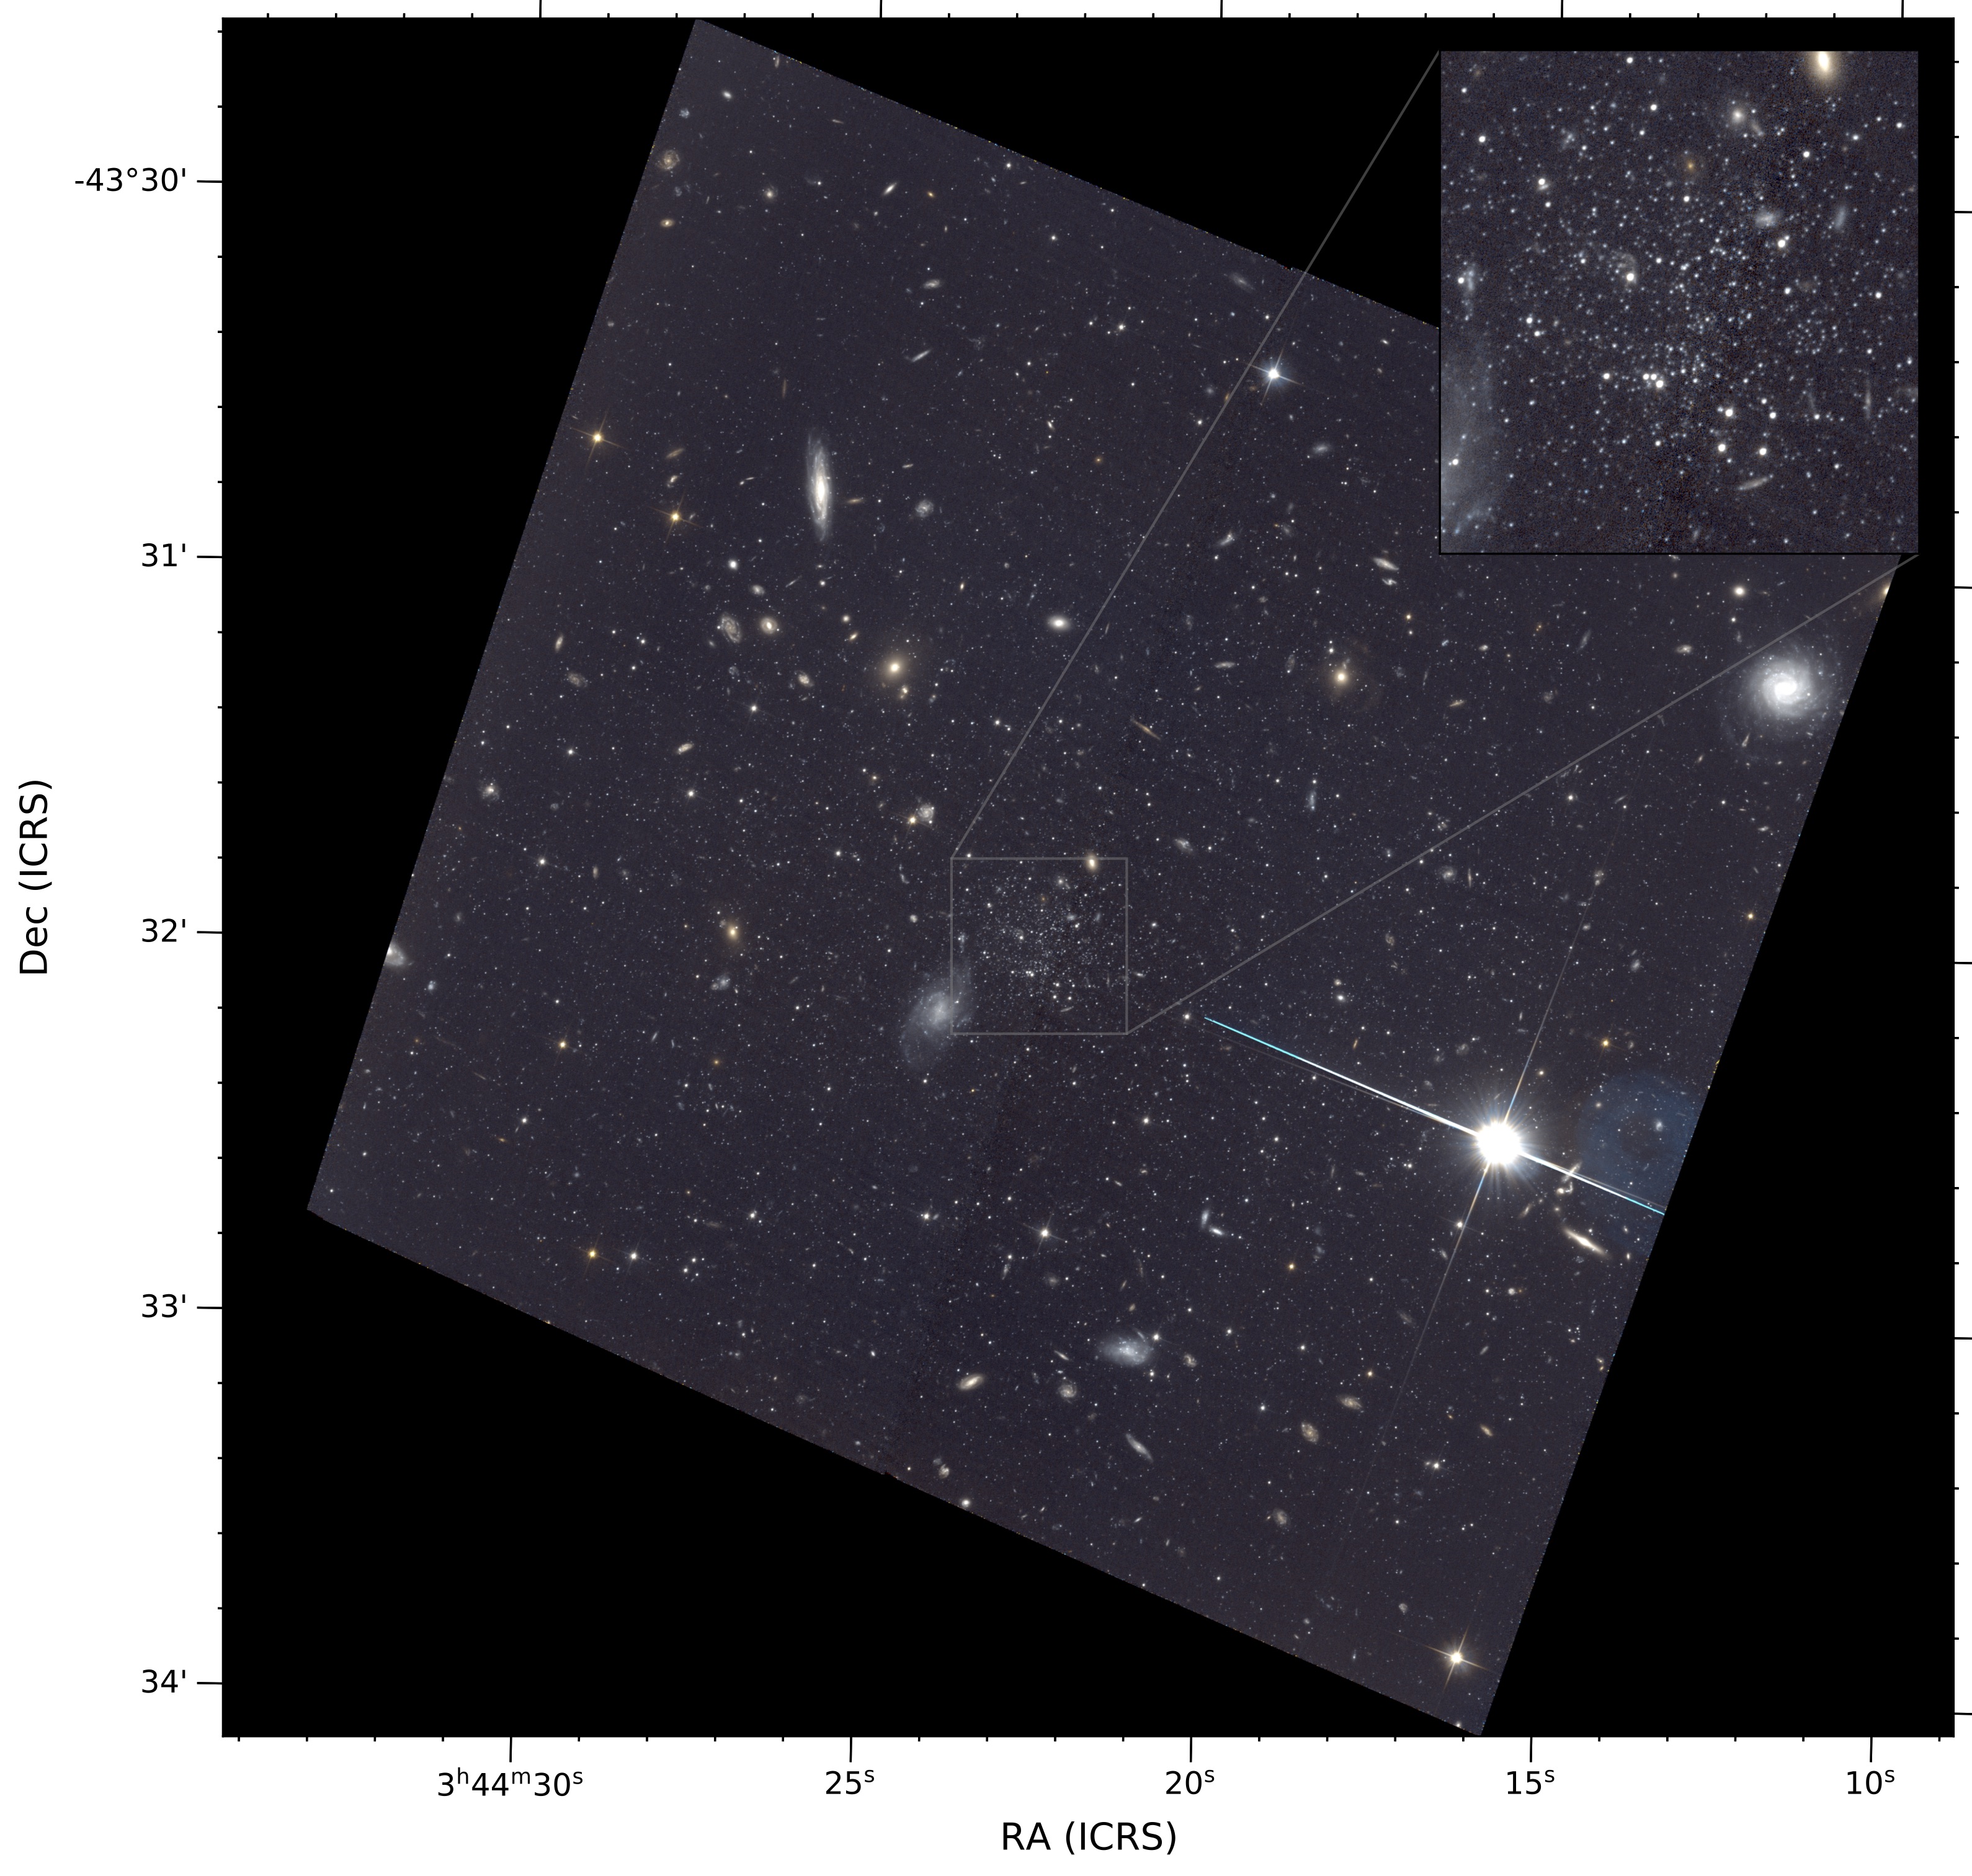
Our ACS observations cover a single field centered on Eri II (see Figure 1). The half-light radius () of Eri II is (Crnojević et al., 2016), so the ACS field of view spans somewhat less than . All 7 visits were executed at the same orientation in order to provide uniform depth over the entire field. Each 2-orbit visit placed exposures on a dither pattern to improve the sampling of the ACS point spread function (PSF), allow mitigation of detector artifacts, and enable rejection of cosmic rays. Successive visits were stepped by 40% of the gap between the ACS detectors for the F814W images and 120% of the gap for the F606W images. The shorter F606W visit employed the first and third steps of the PSF resampling dither and was positioned between the two larger offsets spanning the detector gap.
2.2. Reduction and Photometry
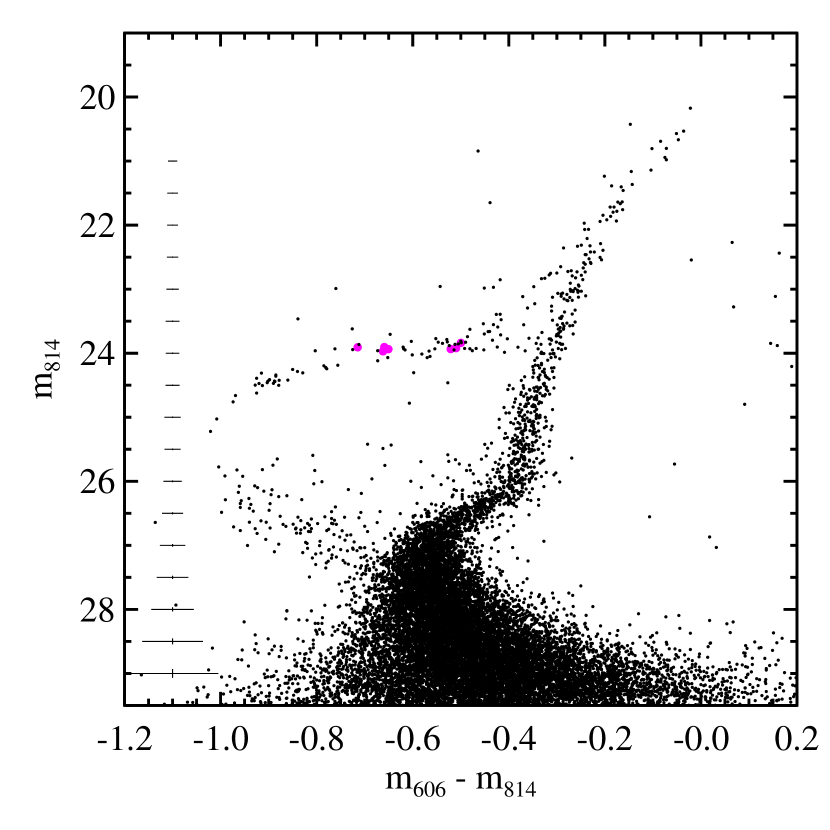
The process for reducing the data and deriving photometric catalogs was that used by Brown et al. (2014), to which we refer the reader for details. In brief, the images were processed with the latest ACS pipeline, including subtraction of darks and biases, flagging of detector artifacts, and correction for charge transfer inefficiency. The individual images for each bandpass were then registered, resampled, geometrically corrected, and coadded, producing final images with a scale of 0.″035/pix and an area of approximately 210″ 220″. We then performed aperture and PSF-fitting photometry using the DAOPHOT-II package (Stetson, 1987), producing a catalog in the STMAG system. The resulting color-magnitude diagram (CMD) is displayed in Fig. 2, and the measurements for all detected stars are listed in Table 1. The CMD of Eri II extends about two magnitudes below the main sequence (MS) turnoff. The galaxy is characterized by a well defined red giant branch (RGB) and a very extended horizontal branch (HB) that is populated on both sides of and across the classical instability strip (IS). A prominent blue straggler sequence extends blueward of the MS turnoff. Through a separate reduction of the individual ACS exposures, we have identified RR Lyrae stars in Eri II (Garofalo et al., in preparation). A full characterization of seven of those stars, including their light curves, periods, and mean magnitudes, will be presented by Garofalo et al. (in prep.).
| Star | RA (J2000) | Dec J2000) | FlagaaFlag values are: 1 (fails criterion in F606); 2 (fails criterion in F814); 4 (fails sharp criterion in F606); 8 (fails sharp criterion in F814); 16 (bright neighbor within 4 pixels); 32 (bright neighbor within 8 pixels); 64 (bright neighbor within 12 pixels and 2.5 mag); 128 (bright neighbor within 16 pixels and 2.5 mag); 256 (bright neighbor within 20 pixels and 1.5 mag); 512 (bright neighbor within 24 pixels and 1.5 mag); 1024 (fails photometric uncertainty criterion in both bands). | ||||
|---|---|---|---|---|---|---|---|
| 1 | 56.066504 | 43.567203 | 28.369 | 0.043 | 29.145 | 0.068 | 0 |
| 2 | 56.067151 | 43.566783 | 28.401 | 0.056 | 28.915 | 0.065 | 0 |
| 3 | 56.065480 | 43.566400 | 28.727 | 0.080 | 28.888 | 0.059 | 64 |
| 4 | 56.069306 | 43.566333 | 29.105 | 0.084 | 29.527 | 0.077 | 0 |
| 5 | 56.066171 | 43.566216 | 25.686 | 0.027 | 26.105 | 0.029 | 0 |
| 6 | 56.068574 | 43.565958 | 28.427 | 0.044 | 28.858 | 0.056 | 0 |
| 7 | 56.070531 | 43.565746 | 28.174 | 0.091 | 28.773 | 0.100 | 1039 |
| 8 | 56.071340 | 43.565622 | 29.561 | 0.101 | 29.888 | 0.113 | 1024 |
| 9 | 56.069295 | 43.565489 | 27.197 | 0.024 | 27.765 | 0.028 | 512 |
| 10 | 56.068095 | 43.565436 | 29.710 | 0.119 | 29.429 | 0.089 | 0 |
Note. — (This table is available in its entirety in machine-readable form.)
To characterize the photometric uncertainties and completeness as a function of color and magnitude, over artificial stars were blindly inserted and recovered from the images, adding small numbers of stars at a time to avoid significantly affecting the stellar crowding, and including the effects of charge transfer inefficiency on the recovered S/N. The 90% completeness limits are and , and 50% completeness is reached at and .
We used the brightest stars in the field () to place the HST astrometry in the reference frame of the second data release (DR2; Gaia Collaboration et al. 2018; Lindegren et al. 2018) of the Gaia mission (Gaia Collaboration et al., 2016). Based on the positions of 29 stars with both HST and Gaia positions, the native HST astrometry was offset from the Gaia coordinates by 048. After correcting this offset, the HST coordinates of the bright stars agree with the Gaia measurements with a standard deviation of 002. All coordinates given in this paper have been shifted to the Gaia frame.
3. THE STAR FORMATION HISTORY OF ERI II
3.1. Metallicity Distribution, Distance, and Reddening
In order to provide a zero point for comparing theoretical isochrones to the observed color-magnitude diagram, the metallicity of Eri II stars, the distance to the galaxy, and the reddening along the line of sight must be determined first.
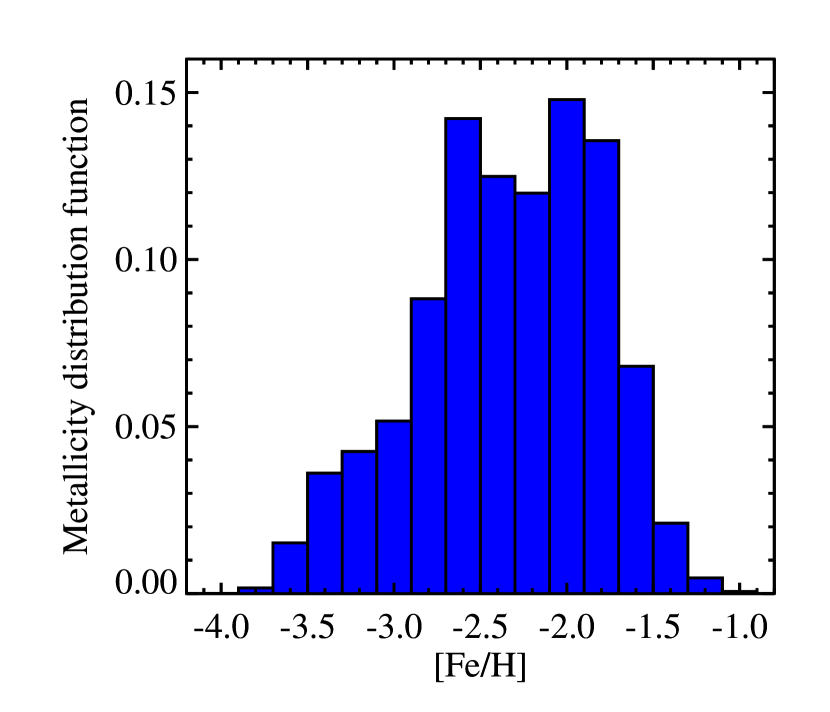
Li et al. (2017) measured the metallicities of 16 stars in Eri II based on spectroscopy of the Ca triplet absorption lines. We used those metallicities to construct a metallicity distribution function (MDF) by modeling the metallicity of each star as a Gaussian probability distribution function (PDF), with the Gaussian dispersion set as the uncertainty of that metallicity measurement. We then summed the 16 individual PDFs to create a cumulative distribution of Eri II metallicities.222Because the spatial coverage of the Li et al. (2017) spectroscopy is larger than the ACS field of view, 3 of the 16 stars with metallicities are located outside the boundary of our HST imaging. However, the mean metallicity of the more distant stars agrees with that of the sample as a whole, indicating that the MDF should not be biased by including them. We note that this method results in an MDF that is artificially broadened relative to the intrinsic MDF because it effectively double-counts the measurement uncertainties. However, the width of the Eri II MDF is dominated by real star-to-star metallicity variations rather than measurement uncertainties (Li et al., 2017), so this broadening is a minor effect. Finally, we made draws of 16 samples from the cumulative distribution to determine the fraction of stars expected in each 0.2 dex bin between and (see Figure 3). We adopt this distribution as the Eri II MDF for the remainder of the paper.
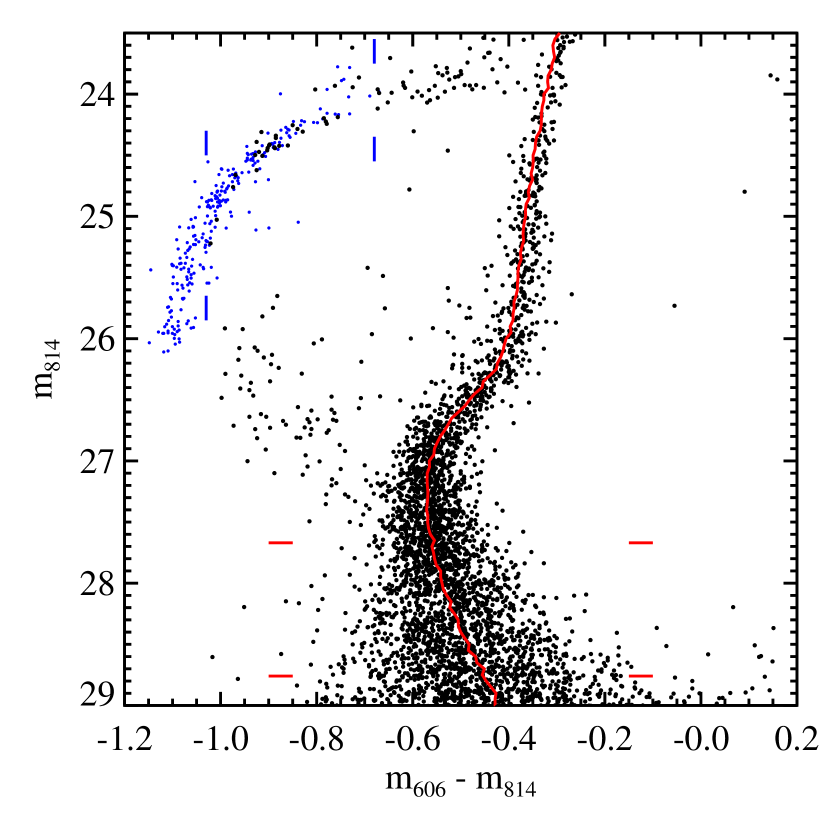
Next, we estimated the distance and reddening. As in Brown et al. (2014), we compared the Eri II main sequence to a synthetic Victoria-Regina theoretical isochrone from VandenBerg et al. (2014) and the horizontal branch of Eri II to the horizontal branch of M92, which was observed with the same ACS filters by Brown et al. (2005). The synthetic main sequence isochrone was constructed assuming an age of 13 Gyr, the metallicity distribution displayed in Figure 3, and a binary fraction of 0.48 (Geha et al., 2013). For M92 we assumed a distance modulus of 14.62 mag (the mean of literature measurements by Del Principe et al. 2005, Sollima et al. 2006, and Paust et al. 2007) and reddening of mag (Schlegel et al., 1998). We included main sequence stars more than 0.5 mag below the main sequence turnoff () to avoid portions that are age-sensitive and we used horizontal branch stars that are bluer than to avoid the RR Lyrae instability strip. Fitting the main sequence and the horizontal branch simultaneously, we found mag ( kpc) and mag, as shown in Fig. 4. This distance modulus is consistent within the uncertainties with the distance derived from the Eri II RR Lyrae stars by Garofalo et al. (in prep.). The statistical uncertainties on the distance fit are very small (0.015 mag in distance modulus, 0.003 mag in reddening), and certainly dominated by systematics in the choice of comparison cluster/isochrone and the magnitude and color range of stars to include. By analogy to Brown et al. (2014) we assume overall uncertainties of 0.07 mag in and 0.01 mag in . Similar to a few of the ultra-faint dwarfs studied by Brown et al. (2012) and Brown et al. (2014), the distance modulus determined with this approach is in modest disagreement with some literature results (Crnojević et al. 2016 measured mag and Koposov et al. 2015 estimated mag, although Bechtol et al. 2015 found a comparable value of mag) and the derived reddening is larger than the mag value obtained by Schlafly & Finkbeiner (2011) (also see Mutlu-Pakdil et al., 2019). However, for consistency with previous star formation history analyses, we adopt the derived values for the remainder of this study.
3.2. Fitting the Star Formation History
Our method for determining the star formation history of Eri II follows the procedures described by Brown et al. (2012, 2014) for analyzing ACS observations of ultra-faint dwarf galaxies. Using the distance modulus and reddening determined in Section 3.1, we created a set of synthetic single-age, single-metallicity stellar populations spanning ages from 8 to 14.5 Gyr and metallicities from to . The synthetic populations were based on VandenBerg et al. (2014) isochrones with and the metallicity-dependent [O/Fe] abundance used by Brown et al. (2014).
We constructed Hess diagrams from both the observed CMD and each of the synthetic simple stellar populations. We evaluated the contamination from foreground Milky Way stars in the ACS photometry by comparing to a simulation from the Besançon model (Robin et al., 2003). Consistent with the appearance of the CMD, the number of Milky Way stars expected in a single ACS pointing is extremely small, so we assumed that 0.1% of the stars in the region of interest do not belong to Eri II.
We then carried out maximum likelihood fits to compare the synthetic Hess diagrams to Eri II. We included only the portion of the CMD in the vicinity of the main sequence turnoff, which is the most sensitive to stellar age. To match the color and absolute magnitude range used to determine the star formation histories for other ultra-faint dwarfs (Brown et al., 2014), we defined a mask tracing out the stellar locus from and . Only bins within this mask contributed to the fit. Because the S/N at the main sequence turnoff of Eri II is lower than those achieved for closer galaxies by Brown et al. (2014), we widened the mask slightly to account for the larger photometric uncertainties. For each model of interest, we computed the Poisson equivalent of derived by Dolphin (2002) to evaluate the quality of the fit.
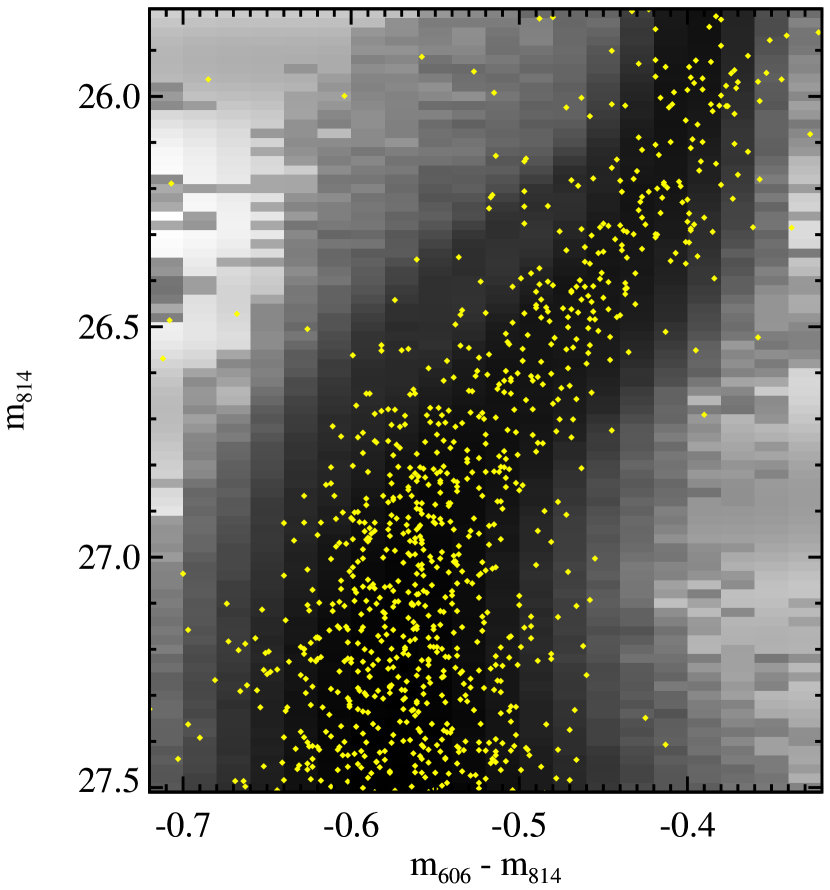
We considered two possible models for the star formation history of Eri II. The simpler one included a single burst of star formation of negligible duration. Using a linear combination of theoretical isochrones to match the observed MDF, the best fit age for the single-burst model was Gyr, with a maximum likelihood score of 903. The second model consisted of two bursts of star formation, plus one additional degree of freedom so that the older burst is constrained to be more metal-poor than the younger one. This model still followed the spectroscopic MDF, with all stars below a threshold metallicity having the older age and more metal-rich stars forming in the younger burst. Although this scenario is undoubtedly a simplification of the actual star formation history, Brown et al. (2014) showed that it was a good match to the histories of other ultra-faint dwarfs. In the second model, the best fit had 93.7% of the stars in Eri II forming 13.5 Gyr ago and 6.3% of the stars being 8.8 Gyr old. To match the MDF, the division between the older and younger populations occurs at The mean age for Eri II in this model was 13.2 Gyr and the maximum likelihood score was 883. Because it offers the best likelihood score and is the most physically reasonable description of the data, we adopt this three-parameter fit as the best star formation model for Eri II. In Fig. 5 this model is displayed in grayscale, with the Eri II stars overlaid.
To assess the statistical uncertainties in the star formation history fits, we created Monte Carlo simulations of the best models. Using the best fit model as a seed, we constructed 10,000 mock CMDs with approximately the same number of stars as the actual Eri II data set. We then converted the mock CMDs into Hess diagrams and computed the maximum likelihood statistic for each mock Hess diagram against the observed Hess diagram. For the three-parameter model, the standard deviation of the maximum likelihood scores from the 10,000 Monte Carlo iterations was 36, indicating that the difference of 20 (i.e., ) in the score between a single-burst model and two bursts for Eri II is not statistically significant. Finally, we repeated the Monte Carlo exercise above, but instead of using the single best model as the seed for all of the mock CMDs, the seed population was drawn randomly from all models within one standard deviation of the best fit. In Figure 6, we illustrate the range of star formation histories that are consistent with the data as the shaded gray band. We note that the last step of this procedure differs slightly from the approach of Brown et al. (2014), where only the best model was used as a seed. Using a broader selection of models in the Monte Carlo simulation provides a more conservative appraisal of the uncertainties.
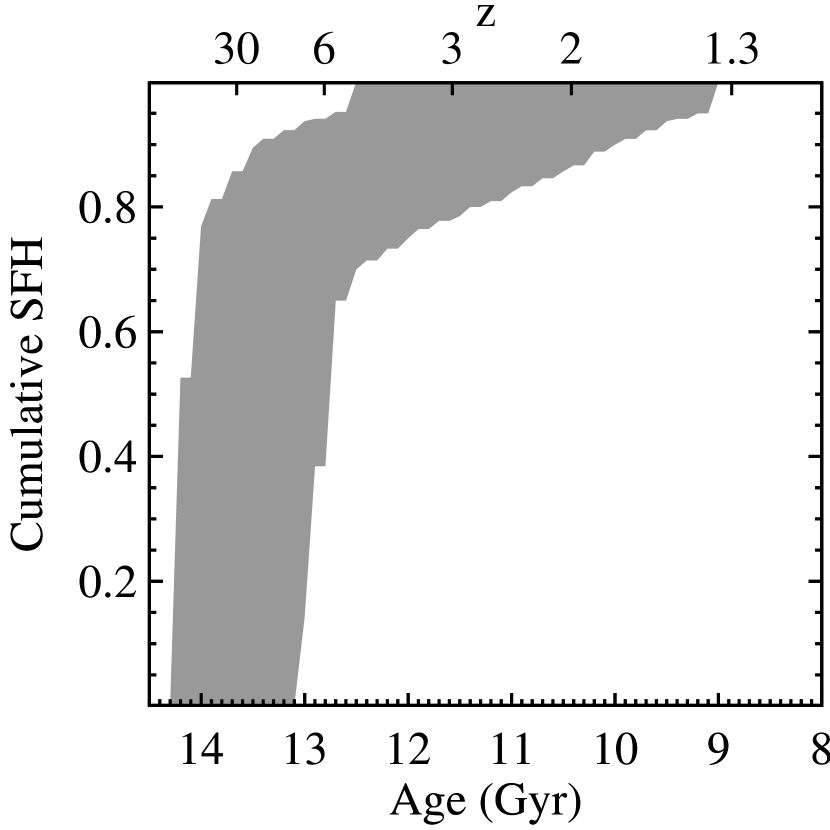
Our results show that % of the stars in Eri II formed by Gyr ago. In the model consisting of two bursts of star formation rather than a single burst, the data are consistent with a small fraction of stars as young as 8–9 Gyr. However, this possible younger population is not detected at a statistically significant level given the uncertainties involved in our star formation history modeling. A component younger than 9 Gyr appears in only 15% of the Monte Carlo iterations on the fit, and when this component appears, it accounts for only a small fraction of the total population (%).
The discussion above quantifies the statistical uncertainties of our star formation history fits. However, as demonstrated by many previous studies, systematic uncertainties associated with isochrone libraries are likely to be comparable to or larger than the statistical uncertainties (e.g., Dolphin, 2012; Weisz et al., 2014; Skillman et al., 2017). Including sources of systematic uncertainties such as the chemical composition of Eri II, the distance of Eri II, the distance and reddening of M92, and following the discussion by Brown et al. (2014), the absolute ages we derive are uncertain at the level of Gyr.
3.3. Blue Stragglers
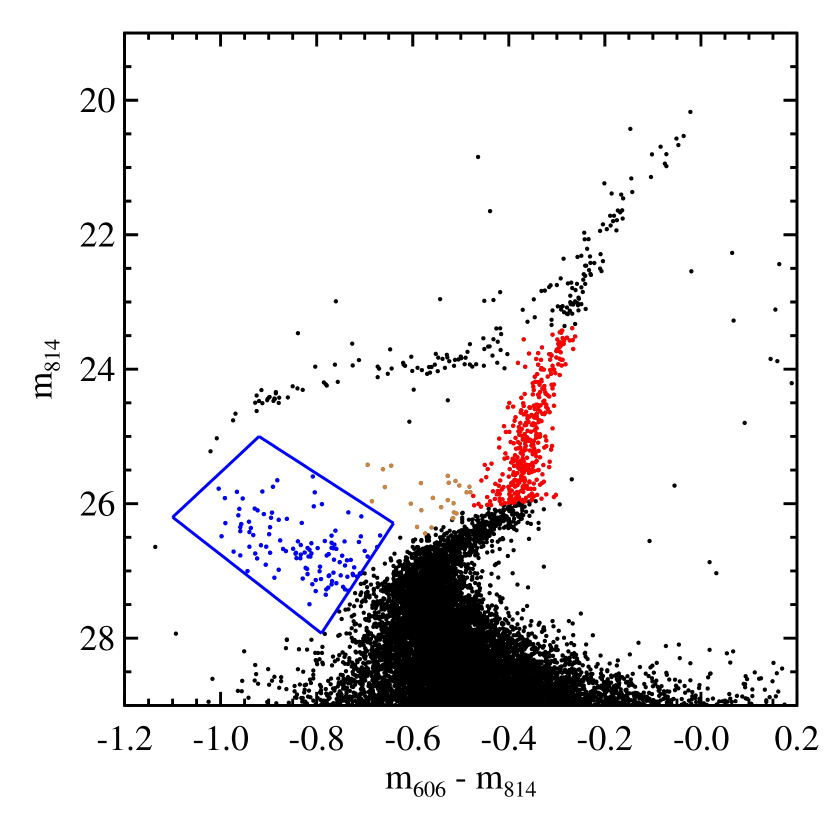
As is the case for all old stellar populations, Eri II contains a small number of blue straggler stars brighter and bluer than the main sequence turnoff. A priori, we do not know whether stars in this part of the CMD are rejuvenated members of an old stellar population or represent evidence of more recent star formation (e.g., McCrea, 1964; Stryker, 1993; Bailyn, 1995; Preston & Sneden, 2000). To quantify this population, we followed the methodology established by Santana et al. (2013), who provided a uniform analysis of the blue straggler abundance across the classical dwarf spheroidals, ultra-faint dwarfs, and globular clusters.
Santana et al. (2013) defined the quantity , which is the ratio of the number of blue stragglers to the number of stars on the lower portion of the RGB. Their color-magnitude selection of blue stragglers was done empirically for each system, using a box drawn to maximize the number of blue stars while avoiding contamination from the MSTO and extreme horizontal branch populations. To normalize the blue straggler abundance, they used the number of RGB stars located between 2.4 and 4.9 mag below the tip of the RGB in -band. We similarly selected blue stragglers in Eri II with customized CMD criteria, as shown in Figure 7. The choice of how closely to allow the blue straggler region to approach the MSTO is to some degree arbitrary, and the position of the cutoff closest to the MSTO can change the number of blue stragglers by up to %. However, as long as this decision is made in a consistent way for each system it should not affect the relative values of .
Given the difference in filters and photometric systems between this study and the ground-based photometry of Santana et al. (2013), the definition of the RGB selection region does not translate directly. Instead, we selected RGB stars within a 2.5 mag region (matching the size of the range used by Santana et al. 2013) extending from the base of the RGB () to the top of the horizontal branch () with a width in color of 0.19 mag, equivalent to the Santana et al. window. To confirm that these changes do not affect , we applied the same procedures to HST photometric catalogs for the four galaxies in common between Santana et al. (2013) and Brown et al. (2014). In each case, we found that the values determined for the HST ACS data sets agree within the uncertainties with the Santana et al. (2013) measurements, confirming that the blue straggler fraction is robust to these choices.
We found and , yielding . This value is in perfect agreement with the result of Santana et al. (2013) that dwarf galaxies spanning from the smallest ultra-faint dwarfs to dSphs with times the stellar mass of Eri II share a common value of . The blue straggler population of Eri II is therefore entirely consistent with other old stellar populations, and there is no evidence for an excess of bright main sequence stars indicating a younger component in Eri II. We also examined sources in the blue straggler region for SX Phoenicis-type variability, with results presented in Garofalo et al. (in prep.).
In addition to the stars brighter and bluer than the MSTO, Eri II also contains a small number of stars above the subgiant branch, between the blue straggler sequence and the red giant branch (RGB). Equivalent populations may be present in other dwarfs as well, but are difficult to assess quantitatively because of significant contamination from foreground stars and background galaxies (see, e.g., the CMDs in Santana et al. 2013). For Eri II, the combination of its high Galactic latitude, the small ACS field of view, and the excellent HST angular resolution, result in negligible contamination so that these yellow stragglers (Hesser et al., 1984; Portegies Zwart et al., 1997) stand out clearly. We counted stars in this portion of the CMD. As with the blue stragglers themselves, in principle these stars could indicate a small fraction of younger stars in Eri II, so we would like to assess whether there are more of them than would be expected from the evolution of the blue stragglers as they leave the main sequence. However, the high incidence of binary stars in this part of the CMD (e.g., Rozyczka et al., 2012; Kaluzny et al., 2013; Sales Silva et al., 2014; Leiner et al., 2016) and the complexities of binary evolution make this a difficult task that is beyond the scope of the present study. As an alternative, we compared the ratio of yellow stragglers to blue stragglers to that seen in the old, metal-poor globular cluster M92 using HST photometry from Brown et al. (2005). Using the same blue straggler/yellow straggler definitions as applied to the Eri II CMD (adjusted for the different distance modulus and reddening), we found that M92 contains 0.37 yellow stragglers for each blue straggler. If the same ratio applied to Eri II, we would expect to observe yellow stragglers, well above the actual number. This discrepancy may reflect the difference in blue straggler populations between globular clusters and dwarf galaxies, but we conclude that the yellow stragglers in Eri II can plausibly be explained by evolution of its blue straggler population, without need for a contribution from younger stars.
3.4. Comparison of Eri II and Cluster Stellar Populations
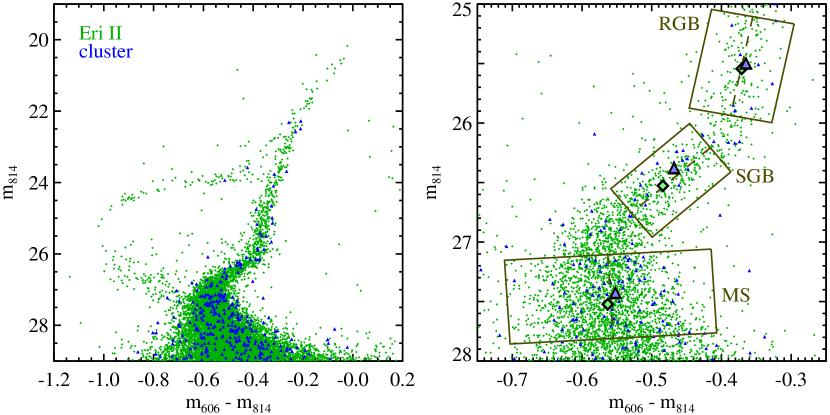
Finally, we considered the stellar population of the star cluster in Eri II. As originally argued by Brandt (2016), the age of the cluster affects constraints on dark matter models (also see Sections 5.3 and 5.4). The CMD of the cluster, overlaid on that of Eri II, is displayed in Fig. 8. To provide maximal separation between the cluster and Eri II populations, only stars inside the half-light radius of the cluster (as determined below in Section 4) are shown as cluster members here, with Eri II members limited to those stars outside 3 cluster half-light radii.333The modeling in Section 4 shows that even in the central region of the cluster, of the stars are Eri II members, so it is not possible to select a pure sample of cluster stars. However, the results below are unlikely to be affected by this level of contamination. It is visually obvious that the cluster CMD closely resembles that of Eri II itself, with the primary difference being the absence of stars in rare evolutionary phases (tip of the RGB, blue horizontal branch, and blue stragglers). We did not detect any RR Lyrae variables in the cluster. By drawing random samples matching the number of cluster stars from the Eri II population, we concluded that these differences are not statistically significant.
As shown by Vandenberg et al. (1990), the color difference between the main sequence and the base of the RGB is an indicator of relative age when comparing two populations. Importantly, this color difference does not depend significantly on metallicity.444Eri II has a mean metallicity of , with an internal dispersion of dex (Li et al., 2017). The cluster does not have a published metallicity, but Zoutendijk et al. (2020) measured the metallicities of 7 likely cluster members. Zoutendijk et al. used two different methods to determine metallicities, spexxy (Husser, 2012) and The Cannon (Ness et al., 2015). Based on a comparison with Li et al. (2017) for one star included in both data sets, and for the mean metallicity of Eri II as a whole, we found that the spexxy metallicities appear to be overestimated by dex. We therefore preferred The Cannon metallicities, from which we estimated that the mean metallicity of the cluster is .
We measured color differences between the main sequence and RGB of 0.192 mag for Eri II and 0.187 mag for the cluster, so the difference between Eri II and the cluster in this quantity is 0.005 mag. For comparison, using the VandenBerg et al. (2014) isochrones described in Section 3.2, at (approximately the mean of the Eri II MDF), an age increase of 1 Gyr corresponds to a color decrease of 0.009 mag. By this metric, the cluster is therefore nominally 0.6 Gyr older than Eri II, but because of the small number of stars in the cluster, this age difference is not statistically significant.
This data set also provided the first opportunity to assess the distance to the cluster. Unfortunately, the cluster does not contain any blue horizontal branch stars, which provided critical leverage on the distance of Eri II in Section 3.1. Since the metallicity and age of the cluster are similar to those of Eri II, as described above, the luminosity of the subgiant branch can also serve as a relative distance indicator. We found a median luminosity difference in the subgiant box between the cluster and Eri II of 0.14 mag. However, as is evident in the right panel of Fig. 8, the small number of subgiants in the cluster is biased toward the brighter, redder end of the subgiant branch. Relative to the midline of the subgiant branch box, the difference between the median luminosity of the cluster stars and the Eri II stars is negligible. We therefore concluded that the cluster distance is identical to that of Eri II, with an uncertainty of 0.14 mag in distance modulus.
4. THE STRUCTURE OF ERI II AND ITS CLUSTER
In addition to determining the star formation history of Eri II, our HST imaging also provides a well resolved look at its central star cluster for the first time. The ACS photometry is mag deeper than the ground-based data obtained by Crnojević et al. (2016), and the angular resolution is improved by a factor of . We therefore took advantage of this data set to model the spatial structure of both Eri II and its star cluster.
We followed the methodology described by Drlica-Wagner et al. (2020) to perform binned Poisson maximum likelihood fits to the cluster and Eri II, modeling each with elliptical profiles as defined by Martin et al. (2008). The stellar catalog used for these fits was limited to magnitudes where the completeness determined from our artificial star tests was at least 90% ( and ), with an additional color cut of applied to eliminate a handful of foreground stars. We also excluded stars flagged as bad by DAOPHOT, with the exception of those flagged because of bright neighbors. A large majority of the stars in the cluster have neighbors within the DAOPHOT fitting radius, so it is not possible to accurately model the stellar distribution in the cluster without including those stars. Even if the fluxes of the crowded stars are biased by the neighboring objects (which does not appear to be the case from the CMD), their positions should be unaffected at any level that is relevant to determining the size and shape of the cluster.
We determined the best-fitting parameters for Eri II and the cluster using the affine-invariant Markov chain Monte Carlo ensemble sampler emcee (Foreman-Mackey et al., 2013). We divided the ACS field of view into pixel () bins and counted the number of stars in each bin. We excluded bins located in the gap between ACS chips and in the core and diffraction spikes of the saturated star Gaia DR2 4836638439545141504 to the west of Eri II. Based on tests using mock catalogs generated with various assumptions, we concluded that we could accurately recover the input parameters with this procedure and that the bin size does not affect the results. We first fit Eri II and the cluster one at a time with the parameters of the other held fixed to determine the most appropriate functional form for each system, along with approximate best fit parameter values. For the cluster, we attempted fits with exponential, Plummer (1911), King (1962), and Sérsic (1963) profiles.555The Sérsic index and the normalization of a Sérsic profile are tied together by the relation , where is the gamma function, is the lower incomplete gamma function, and the surface brightness profile is , so it is not possible to solve for analytically (Ciotti & Bertin, 1999). We therefore carried out the Sérsic fit twice, first with free to vary and the normalization left arbitrary, and then a second time with held fixed at the best-fit value and the normalization calculated accordingly. The exponential profile overestimated the central surface density of the cluster, but the other three profiles all matched the data well. Any of these profiles would be a reasonable choice as a model of the cluster, but we identified a Sérsic profile with as the best fit because it produced the lowest value of the Akaike information criterion. Crnojević et al. (2016) also determined that a Sérsic profile was the best description of the cluster, although their Sérsic index of was somewhat smaller. For Eri II itself, we explored exponential and Plummer fits. The exponential model is slightly better over the central of the galaxy, but the Plummer model is superior in the outer regions. We decided to move forward with the Plummer fit for Eri II based on its improved fit over most of the imaged area and the better agreement with previous results.
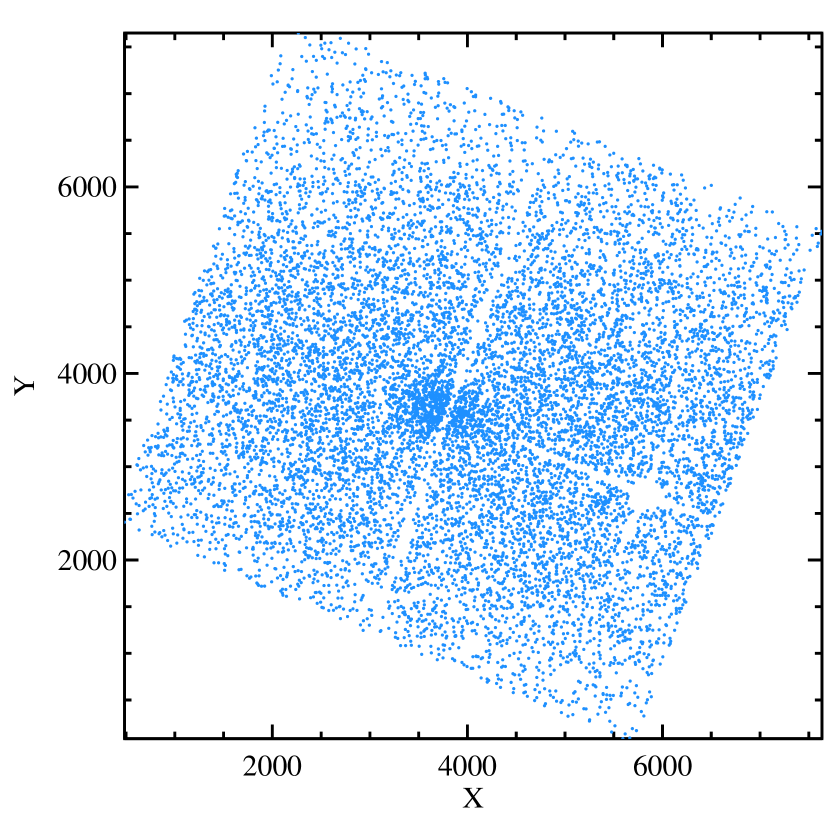
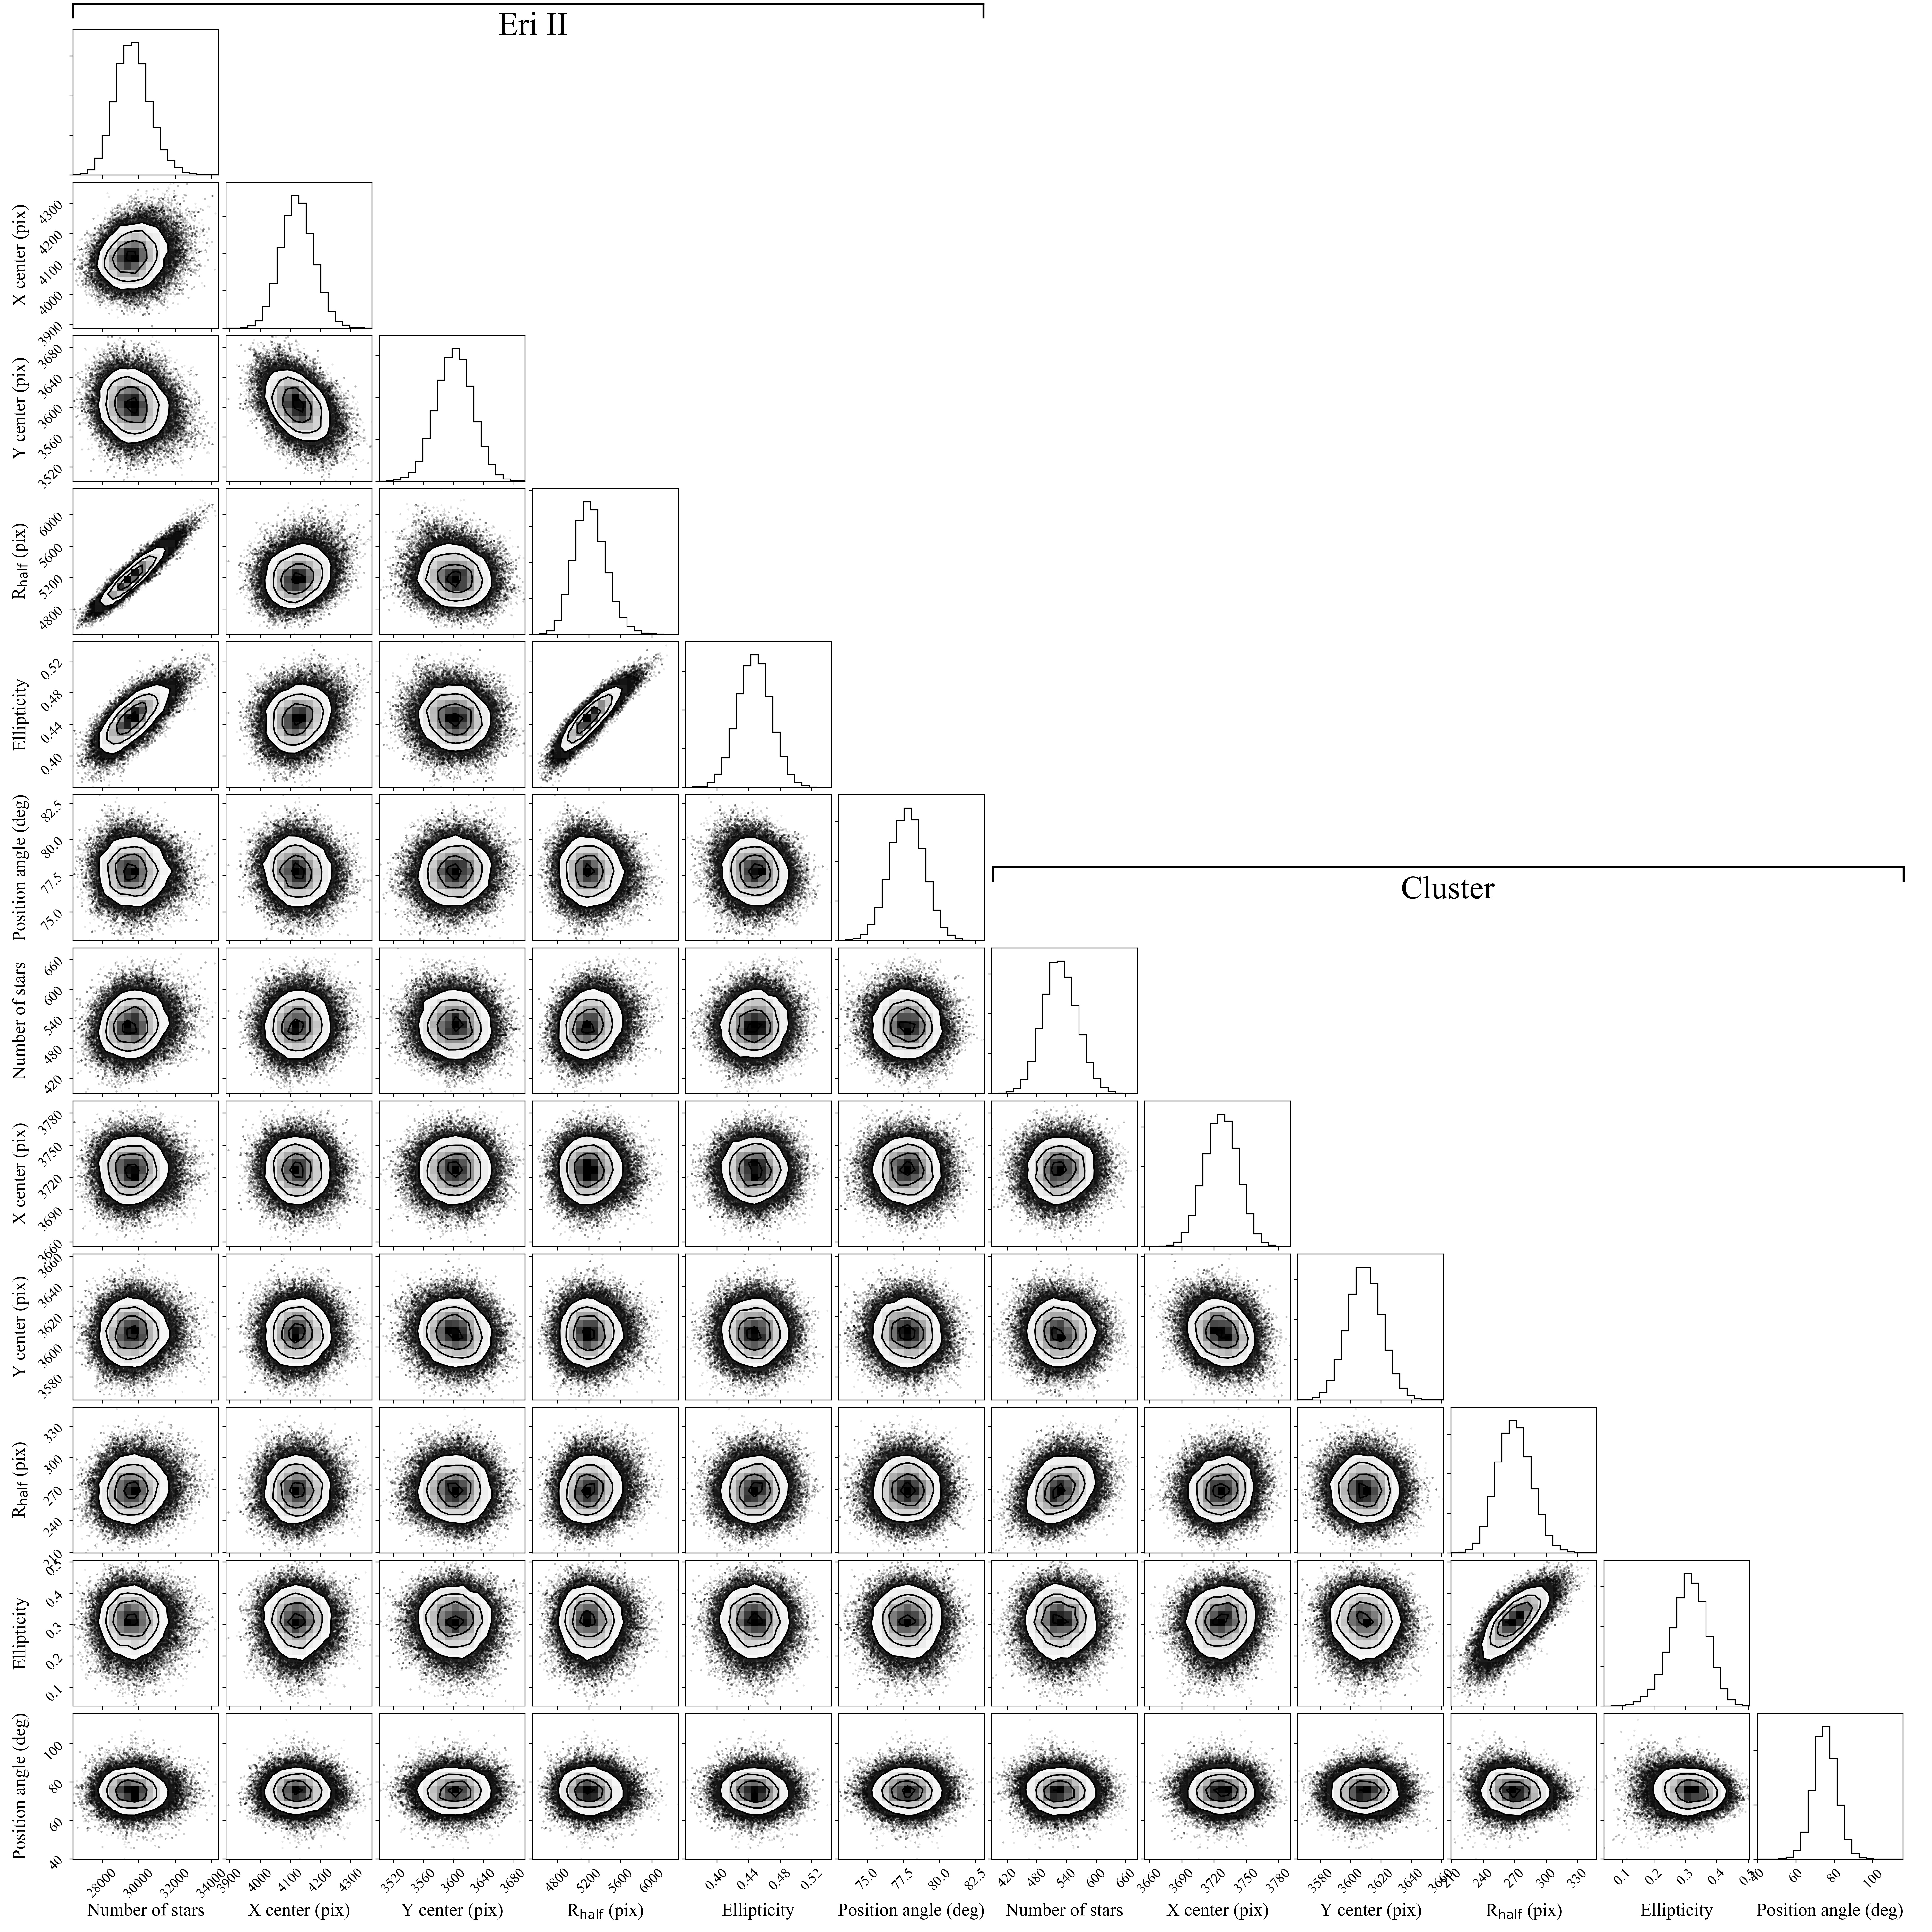
Finally, we modeled both Eri II and the cluster simultaneously with a 12 parameter fit, using a Sérsic profile for the cluster and a Plummer profile for Eri II. The free parameters were the center position, number of stars, half-light radius, ellipticity, and position angle for Eri II and the cluster (see Table 2), and the best-fit values are listed in Table 3. The spatial distribution of stars in the ACS image and the half-light ellipses of the cluster and Eri II are shown in Fig. 9. The posterior distributions for each parameter from the Monte Carlo analysis are displayed in Fig. 10. For most parameters, the fit appeared to be well-behaved, with approximately Gaussian posteriors and minimal correlations between parameters. However, the half-light radius and ellipticity for each component were strongly correlated with each other, in the sense that larger sizes result in higher ellipticities. The number of stars in Eri II also exhibited strong positive correlations with both half-light radius and ellipticity, but the number of stars in the cluster was only weakly related to the cluster half-light radius, and not at all to the cluster ellipticity. The correlations for Eri II result from the fact that the imaging only covers the central portion of the galaxy, so that a more extended profile requires a larger total number of stars to match the observed number in the imaged region.
| Row | Parameter | Range |
|---|---|---|
| (1) | Eri II RA (J2000) | [03:44:18.3, 03:44:24.8] |
| (2) | Eri II Dec (J2000) | [43:32:21, 43:31:11] |
| (3) | Eri II (arcsec) | [70, 280] |
| (4) | Eri II Ellipticity | [0.1, 0.9] |
| (5) | Eri II Position angle (degrees) | [50, 90] |
| (6) | Eri II N | [5000, 40000] |
| (7) | Cluster RA (J2000) | [03:44:22.0, 03:44:23.0] |
| (8) | Cluster Dec (J2000) | [43:32:04, 43:31:53] |
| (9) | Cluster (arcsec) | [5.25, 28] |
| (10) | Cluster Ellipticity | [0.0, 0.7] |
| (11) | Cluster Position angle (degrees) | [30, 120] |
| (12) | Cluster N | [200, 1200] |
| Row | Quantity | Eri II | Cluster |
|---|---|---|---|
| (1) | RA (J2000)aaNote that although the R.A. is listed here in hours, minutes, and seconds, the uncertainties are given in arcseconds rather than seconds. | 03:44: | 03:44: |
| (2) | Dec (J2000) | :32: | :32: |
| (3) | (arcsec)bbThe radii listed here are the semi-major axes of the half-light ellipse for each system. As discussed in the text, the half-light radius of Eri II is likely overestimated because of the limited spatial coverage of the HST imaging. We include the best-fit value here for completeness, but we expect that the smaller size given by Crnojević et al. (2016) is more accurate. | ||
| (4) | (pc)b,cb,cfootnotemark: | ||
| (5) | Ellipticity | ||
| (6) | Position angle (degrees) | ||
| (7) | Sérsic index | … | 0.41 |
| (8) | NmembersddThe number of member stars (integrated to infinity, not limited to the spatial extent of our imaging) satisfying the constraints , , and . |

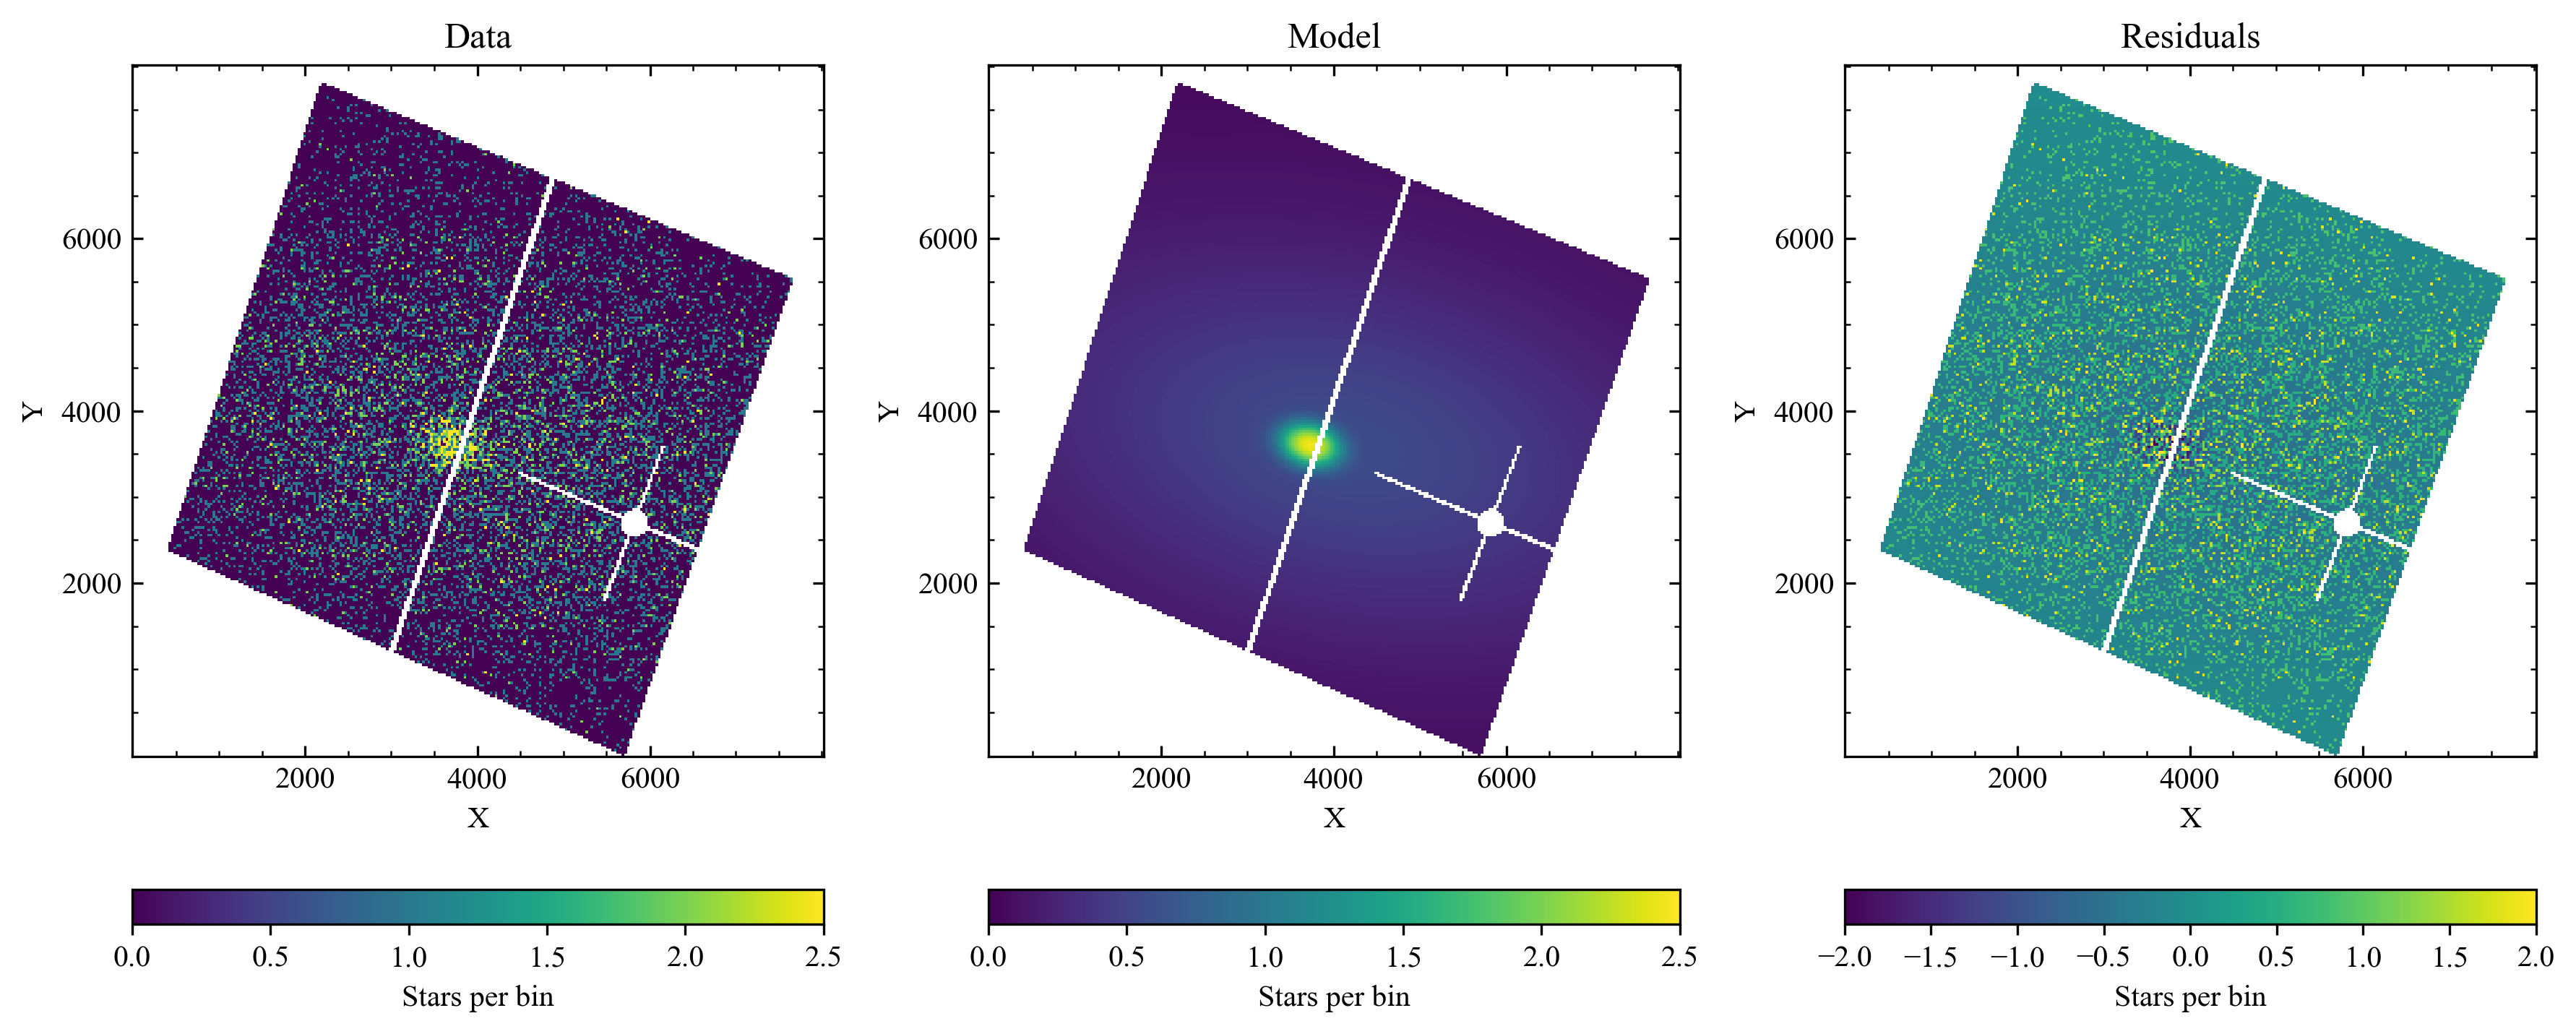
The spatially binned and masked data, along with the best-fit model and the residuals, are illustrated in Fig. 11. We found that the cluster is significantly elongated, with an ellipticity of . In earlier ground-based imaging, the cluster appeared to be round because of the decreased angular resolution and the small number of resolved stars (Crnojević et al., 2016). Moreover, the cluster is perfectly aligned with the orientation of Eri II: we measured position angles of degrees for Eri II and degrees for the cluster. It is unlikely that this alignment would occur by chance, so this result points to a common physical mechanism being responsible for the shapes of the cluster and Eri II. We also determined a half-light radius for the cluster of ( pc), larger than the obtained by Crnojević et al. (2016). Again, the deeper, higher-resolution HST data are likely responsible for this difference. Based on the best-fit number of member stars in each object (integrated out to infinity; Drlica-Wagner et al. 2020), the luminosity of the cluster is that of Eri II, which translates to for an Eri II absolute magnitude of (Crnojević et al., 2016). For comparison, Crnojević et al. (2016) measured an absolute magnitude for the cluster of , somewhat brighter than but roughly consistent with our result.
We measured central positions of , for Eri II and , for the cluster. The separation between the two is , or pc at a distance of 339 kpc. The cluster is therefore offset from the center of the galaxy by a small, but detectable, amount. Crnojević et al. (2016) obtained a slightly larger offset of 23″ (41 pc), but given the uncertainty on the center of Eri II in their shallower imaging, this offset was only significant at the level.
Comparing our overall results to those of Crnojević et al. (2016), as described above, we determined that the central cluster is larger and more elliptical than previously measured. For Eri II, we also found a larger radius () than measured from ground-based data (). Although we were able to recover the input half-light radius in tests with mock data designed to match the properties of the HST photometric catalog, we concluded that this discrepancy is likely the result of the geometry and limited spatial coverage of our imaging. In particular, Muñoz et al. (2012) showed that, among other conditions, the field of view for an imaging program should be at least 3 the half-light radius of a system in order to accurately recover its structural parameters. Since measuring the size of Eri II was not one of the goals of the ACS imaging, the obtained data set is not close to meeting this criterion. We therefore suggest that the Eri II half-light radius determined by Crnojević et al. (2016) from much wider-field imaging is likely more reliable. The ellipticity that we measured for Eri II agrees with that of Crnojević et al. (2016) within the uncertainties, and the center position and PA are consistent at the level.
5. ANALYSIS AND IMPLICATIONS
In this section we consider the implications of our star formation history and structural measurements for the history of Eri II and the properties of dark matter.
5.1. The Quenching of Eri II
As mentioned in Section 1, the discovery imaging for Eri II contained hints of star formation within the past few hundred million years (Koposov et al., 2015). Li et al. (2017) cast significant doubt on this possibility by showing that the brightest stars in this putative young population are not spectroscopic members of Eri II. Our much deeper imaging analyzed in Section 3.2 confirms that Eri II is exclusively an old system, with no sign of stars having formed in the past Gyr. The prevalence of RR Lyrae variables in Eri II (cf. Martínez-Vázquez et al., 2019; Vivas et al., 2020), combined with the lack of anomalous Cepheids (unlike the populations exhibited by Leo T; Clementini et al. 2012), supports this conclusion. Here we consider what these results mean for the quenching of star formation in Eri II.
Fritz et al. (2018) used astrometric measurements from the second Gaia data release (Gaia Collaboration et al., 2018) to determine the proper motion of Eri II. Based on a sample of 12 spectroscopic member stars from Li et al. (2017) that are also in the Gaia catalog, Fritz et al. (2018) obtained the first proper motion constraint for Eri II. Subsequently, Zoutendijk et al. (2020) identified additional Eri II members via deep VLT/MUSE spectroscopy, but none of those stars have astrometry in the Gaia DR2 catalog. We adopted the member sample of Pace & Li (2019), which is based on the Li et al. spectroscopic members plus an additional 7 likely member stars (membership probability and colors consistent with a low metallicity) identified via photometry and astrometry. We added one spectroscopically confirmed bright red giant member from Li et al. (2017) that is missing from the Pace & Li (2019) list because its photometry in the DES DR1 catalog (DES Collaboration et al., 2018) is compromised by its proximity to the 12th magnitude foreground star visible in Fig. 1. Using these stars, the weighted average proper motion for Eri II is mas yr-1, mas yr-1. Unsurprisingly, given the large distance to Eri II, the proper motion is consistent with zero within the uncertainties, and all of the available estimates are mutually consistent.666McConnachie & Venn (2020) determined a proper motion with much smaller uncertainties based on the assumption that Eri II is gravitationally bound to the Milky Way. Because we are attempting to investigate the orbital history of Eri II, we prefer to avoid making such an assumption. By removing their prior on the tangential velocity, McConnachie & Venn (2020) find mas yr-1, mas yr-1, in agreement within the uncertainties with our determination.
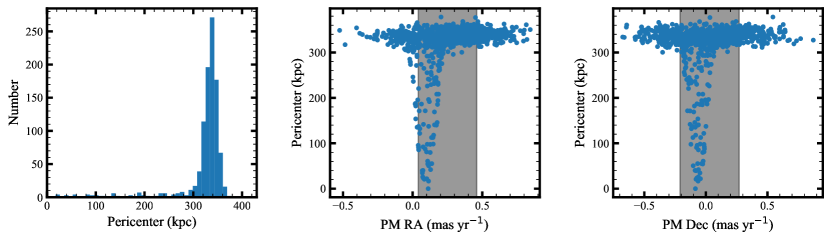
We used the galpy software developed by Bovy (2015) to compute the orbit of Eri II in the Milky Way potential. We adopted the modified MWPotential2014 gravitational potential described by Carlin & Sand (2018), which has a total mass of (e.g., Watkins et al., 2019). For the nominal proper motion of Eri II, the resulting orbit places the galaxy essentially at the pericenter of its trajectory around the Milky Way at present. However, because the measurement uncertainties are comparable to the proper motion itself, a substantially broader array of orbits are also consistent with the data. To explore the parameter space, we drew 1000 samples of the radial velocity, proper motion, and distance of Eri II from Gaussian distributions of each quantity centered on the measured value and with the dispersion set equal to the uncertainty. We then calculated the orbit for each set of values. We found a median orbital pericenter of kpc, on a highly eccentric orbit with . The orbital properties are independent of the line-of-sight velocity or distance of Eri II, but for a narrow range of proper motions ( mas yr-1, mas yr-1) the pericenter can be significantly smaller ( kpc). The observed proper motion is consistent with this solution (see Fig. 12).
Although the proper motion uncertainties for Eri II will shrink in future Gaia data releases, for the time being the observed kinematics do not conclusively reveal whether it is a bound satellite of the Milky Way. As an alternative avenue for providing insight into the history of Eri II, we examined the properties of subhalos drawn from the ELVIS simulations (Garrison-Kimmel et al., 2014) that have similar distances, stellar masses, and galactocentric velocities as Eri II, following Li et al. (2017). Using the full ELVIS data set (including both isolated and paired Milky Way analogs), the majority of the ELVIS subhalos compatible with Eri II have already made at least one pericentric passage around their host galaxy, with only currently falling in for the first time. If future improved proper motion measurements show that Eri II is one of the minority of subhalos on its first infall, then reionization is by far the most likely explanation for its early quenching. On the other hand, in the more common scenario where Eri II is a backsplash galaxy (e.g., Warnick et al., 2008; Teyssier et al., 2012; Fillingham et al., 2018; Blaña et al., 2020), we must examine the distribution of possible infall times. Using broader selection criteria than Li et al. (2017) to provide a larger sample of comparison halos, Rodriguez Wimberly et al. (2019) showed that Eri II may have interacted with the Milky Way at low redshift (), but is unlikely to have experienced a close passage at earlier times. We conducted a similar exercise but with slightly updated distance and velocity selection cuts, finding that the earliest first infall time among 125 Eri II analogs in ELVIS is 11 Gyr ago. On the other hand, most of the star formation in Eri II ended at even earlier times, prior to 12 Gyr ago (see Section 3). If the orbital distribution of the ELVIS subhalos is realistic, we therefore conclude that environmental influences from the Milky Way are very unlikely to be the dominant factor controlling star formation in Eri II. Instead, as with the more nearby ultra-faint dwarfs (Brown et al., 2014), the timing of the decline in star formation in Eri II is more consistent with reionization (e.g., Ricotti & Gnedin, 2005; Bovill & Ricotti, 2011; Wheeler et al., 2019). However, we cannot rule out that environmental processes affected low levels of star formation in Eri II that may have persisted until somewhat later times.
5.2. The Curious Alignment of the Cluster with Eri II
In Section 4 we determined that the star cluster is both significantly elongated, with , and aligned with the orientation of Eri II within the measurement uncertainties, as can be seen visually in Fig. 9. The ellipticity is unusually large for a globular cluster; the highest ellipticity listed in the Harris (1996, 2010 edition) catalog is 0.27, for NGC 6273 (White & Shawl, 1987). A handful of faint clusters analyzed by Muñoz et al. (2018) have comparable shapes, such as Koposov 1 and 2, AM 4, Muñoz 1, Balbinot 1, and Kim 1, although the measurement uncertainties are generally large. The size of the cluster is also an outlier from the Milky Way globular cluster population. Among clusters with similar luminosities, only Pal 12, Laevens 1, and DES 1 have pc.777More recent measurements of Pal 12 by Musella et al. (2018) indicate a smaller half-light radius of 5.4 pc and attribute the larger size found previously to contamination from the Sagittarius stream. Perhaps the closest known analogs to the Eri II cluster are Fornax 6 (Wang et al., 2019) and the candidate cluster in And XXV, which is somewhat larger and brighter ( pc and ; Cusano et al. 2016). We note that if the cluster had been discovered in isolation rather than near the center of a dwarf galaxy, it might be considered a candidate dwarf galaxy itself, with properties resembling, e.g., Triangulum II or Draco II. The only obvious way to test the possibility that the cluster is actually a dwarf would be with metallicity and chemical abundance measurements of cluster stars to determine whether it is a monometallic system. Unfortunately, even the brightest few stars in the cluster are challenging targets at best for spectroscopy with current instruments (see Fig. 8 and Zoutendijk et al. 2020).
The simplest explanation for the properties of the cluster is that it is being tidally distorted by the gravitational potential of Eri II. To provide an initial assessment of the viability of this hypothesis, we compute the Jacobi radius of the cluster, as defined by Binney & Tremaine (2008). Assuming that the velocity dispersion of Eri II is constant with radius, as is the case for most Milky Way satellites (e.g., Walker et al., 2007; Battaglia et al., 2011; Pace et al., 2020), the mass profile near the center of the galaxy is . Then, for a cluster mass-to-light ratio of 2 and the estimated absolute magnitude given in Section 4, the Jacobi radius at the projected radius of the cluster is pc. The observed half-light radius of the cluster is 15 pc, indicating that most of the cluster’s stars are currently beyond its tidal radius. In order for the Jacobi radius to exceed the half-light radius, the three-dimensional distance between the cluster and Eri II would need to be pc despite their much smaller projected separation. Although this calculation is highly simplified in all respects, we conclude that it is not surprising that the cluster is being tidally stretched along the axis connecting the center of the cluster and the center of Eri II.
If the instantaneous tidal force of Eri II is responsible for the ellipticity of the cluster, the alignment between the two remains to be explained. An ellipsoidal or triaxial dark matter halo for Eri II with a similar orientation to the stellar component of the galaxy could have contributed to the shape of the cluster via its gravitational potential. On the other hand, one might expect precession or tumbling motions to decrease such an alignment with time. Alternatively, if the cluster moves on a radial orbit that is aligned with the major axis of Eri II, then the tidal forces described above would tend to cause the cluster’s elongation to be oriented in the same direction as well.
5.3. Does Eri II Contain a Dark Matter Core?
Goerdt et al. (2006) suggested that the positions of globular clusters within dwarf galaxies can be an indicator of the central dark matter density profile of the galaxy, potentially providing new insight into the longstanding cusp-core problem (e.g., Flores & Primack, 1994; Moore, 1994; de Blok et al., 2001; Kuzio de Naray et al., 2008; Relatores et al., 2019). The basic argument is that in a cuspy dark matter halo, dynamical friction should rapidly drag clusters to the center of the galaxy, while in a cored halo the clusters can survive at larger radii for more than a Hubble time (e.g., Read et al., 2006; Boldrini et al., 2019; Leung et al., 2020). This picture has primarily been investigated to explain the observational fact that the globular clusters of the Fornax dwarf spheroidal are located at typical radii of kpc.
The discovery of a cluster in the lower luminosity and more dark matter-dominated galaxy Eri II offers an even better laboratory for the exploration of globular cluster dynamics, as already recognized by Amorisco (2017) and Contenta et al. (2018). Both Amorisco and Contenta et al. showed with N-body simulations that star clusters in an Eri II-like galaxy are quickly tidally disrupted if the galaxy has a cuspy density profile. Clusters can only survive in a cuspy galaxy if located exactly at the center of the halo. On the other hand, they found that clusters in cored potentials (, where the inner density profile is ) are long-lived and dynamical friction stalls before the cluster reaches the center of Eri II.
Unlike in the case of Fornax, the cluster in Eri II is quite close to the center of the galaxy. However, our measurements in Section 4 revealed a small but significant offset of pc (in projection) between the two. Such a small offset is surprising because the cores often postulated in other dwarfs have typical sizes of a few hundred pc to kpc. Recent calculations indicate that the radius at which dynamical friction stalls for a cluster orbiting within a dwarf galaxy is of the radius of the core (Meadows et al., 2020; Kaur & Sridhar, 2018). If this mechanism is responsible for the location of the cluster, the implied core size for Eri II is only pc. Alternatively, if Eri II has a cuspy density profile, clusters with stellar masses similar to the observed value should be destroyed within a few Gyr at distances of less a few hundred pc from the center of the galaxy, unless the cluster formed as a nuclear cluster at the center of the halo (Amorisco, 2017). Since a central position for the cluster is disfavored by its apparent tidal elongation, a cuspy halo can only be consistent with the observed location in the unlikely scenario that the line-of-sight distance between Eri II and the cluster is kpc, and the cluster is projected to lie so close to the center by coincidence (Contenta et al., 2018).
We note that given the measured stellar mass and size of the cluster, its relaxation time is less than its age, so two-body effects may be important to its evolution (Contenta et al., 2018). The interaction between tides and relaxation-driven expansion and mass loss depends on the mass profile of the galaxy and the position of the cluster relative to the center of the potential. A measurement of the velocity dispersion of the cluster could in principle separate the cored and cuspy cases, but obtaining accurate enough velocities for such faint stars is beyond the capabilities of current instruments (see Zoutendijk et al. 2020). As in Section 5.2, a follow-up to the N-body experiments of Contenta et al. (2018) may be necessary to investigate these processes fully.
There are several caveats to the conclusions of the above studies. First, we measured a lower luminosity for the cluster than the value from Crnojević et al. (2016) that was assumed by Amorisco (2017) and Contenta et al. (2018). Neither set of authors simulated clusters with a stellar mass below , but Amorisco (2017) found that lighter clusters have a dynamical friction timescale longer than a Hubble time even in a cuspy potential. Therefore, an offset between the cluster and the center of the galaxy does not necessarily imply that Eri II must be cored. On the other hand, the smaller mass and larger size that we determined for the cluster leave it even more vulnerable to tidal stripping than the simulated clusters, so the survival of the cluster in a tidal field still supports a shallow density profile for Eri II. Second, the offset we determined is between the center of the cluster and the center of the stellar distribution of Eri II. The preceding discussion is contingent upon the stars in Eri II being centered on the dark matter halo of the galaxy. If the position of the cluster marks the center of the mass distribution, and the galaxy’s stars are slightly off-center, then a cuspy profile would be allowed. Finally, we again note that the measured quantity from the HST imaging is the projected position of the cluster, which provides only a lower limit on the three-dimensional separation between the cluster and the galaxy. If the geometry of the system is such that the cluster is actually at a much larger distance and only appears to be close to the center of Eri II, then no conclusions about the density profile could be drawn.
If Eri II does contain a small core, the core must have been formed either through baryonic feedback processes or dark matter physics. Most dark matter models that have been investigated so far do not produce such small cores in a particularly natural way. Nishikawa et al. (2020) showed that if dark matter is self-interacting, core collapse can occur rapidly in a halo that has experienced tidal stripping, but the orbit of Eri II is unlikely to have brought it close enough to the Milky Way for significant tidal mass loss.
5.4. Implications of the Star Formation History for Dark Matter Models
As initially recognized by Brandt (2016), the existence of a star cluster near the center of Eri II places limits on the composition of dark matter in the galaxy. If dark matter were made of massive compact halo objects (MaCHOs) with masses on the order of tens of solar masses, dynamical interactions between the MaCHOs and cluster stars would heat the cluster, eventually leading to its destruction. Lacking any quantitative SFH measurements at the time, Brandt (2016) considered an age range for the cluster of Gyr, corresponding to upper limits of () on the MaCHO mass if MaCHOs make up all (half) of the dark matter. This limit was tightened somewhat by Zoutendijk et al. (2020) using an estimated age of 8 Gyr for the cluster. Our results suggest that the cluster is actually Gyr old, comparable to the age of Eri II itself, pushing the upper limit on the mass of MaCHOs to the low end of the previously discussed range. MaCHO dark matter fractions above 50% at were also ruled out by LMC microlensing experiments (e.g., Alcock et al., 2001). More recently, microlensing of a star crossing the giant arc in the galaxy cluster MACS J1149 was used to limit MaCHOs to less than 20% of the dark matter in the mass range (Oguri et al., 2018), while constraints from lensing of supernovae have ruled out MaCHOs as the dominant component of dark matter from (Zumalacárregui & Seljak, 2018). Because various caveats apply to most of these constraints, limits derived from any single technique may not be airtight, but the combination of multiple methods appears to close the window for MaCHOs to comprise a large fraction of dark matter in the solar masses to hundreds of solar masses range.
The survival of the star cluster in Eri II also constrains fuzzy dark matter (FDM) models, where dark matter consists of an ultra-light particle such as the axion (Hu et al., 2000; Hui et al., 2017). Similar to the case with MaCHOs, fluctuations in the FDM potential near the center of Eri II will act to heat the stars in the cluster over time. Assuming an age for the cluster of 3 Gyr, Marsh & Niemeyer (2019) showed that FDM particle masses below eV are ruled out (presuming that FDM comprises all of the dark matter). Combined with constraints from gravitational lensing, the Ly- forest, and Milky Way satellite galaxies, this result excludes FDM models that have been proposed to address small-scale challenges to the CDM paradigm (Schutz, 2020; Nadler et al., 2020). Our determination of a significantly older age for the cluster increases the lower limit on the FDM mass by roughly a factor of 1.6 relative to the constraints derived by Marsh & Niemeyer (2019); that is, eV.
6. CONCLUSIONS
We have presented an analysis of deep HST imaging of the Milky Way satellite galaxy Eri II to determine its star formation history and structure. The data extend well below the main sequence turnoff of the galaxy for the first time, enabling improved age measurements. We fit the star formation history with models consisting of one and two bursts of star formation, subject to the constraint that they match the spectroscopic metallicity distribution from Li et al. (2017). We found that Eri II is dominated by a very old ( Gyr) stellar population containing of its stars, similar to the closer and lower-luminosity ultra-faint dwarfs that have been studied previously (Brown et al., 2014). The star formation rate in Eri II dropped sharply by . It is possible that much lower rates of star formation persisted for up to a few Gyr beyond that time, but we did not detect such a population at a statistically significant level. There is no evidence for stars younger than 8 Gyr in Eri II. Although the orbit of Eri II is not strongly constrained by the available kinematic data, comparison with simulations suggests that Eri II is unlikely to have approached the Milky Way early enough for environmental processes to be responsible for its quenching. We therefore conclude that star formation in Eri II was shut off by reionization.
Taking advantage of the combination of high angular resolution and deep photometry, we also measured the structure of Eri II, focusing especially on its star cluster. We determined that the cluster has a half-light radius of pc, and it contains 1.8% of the total stars in Eri II, corresponding to an absolute magnitude of for the Eri II luminosity measured by Crnojević et al. (2016). This size is larger and the luminosity is smaller than previously estimated. The cluster is significantly elongated () and its position angle is aligned with that of Eri II to an accuracy of degrees. Moreover, we showed that there is a small but significant offset of pc between the center of the cluster and the center of the galaxy. The size, elongation, and position suggest that tidal forces are responsible for shaping the cluster, but the origin of the cluster’s orientation is less clear. The stellar population of the cluster appears qualitatively consistent with that of Eri II itself, suggesting a likely age of Gyr.
Confirmation that the cluster is not located at the center of Eri II provides some insight into the distribution of dark matter within the galaxy. Numerical simulations have shown that in a dark matter halo with a cuspy density profile, clusters rapidly suffer tidal destruction and (if not destroyed) are dragged to the center by dynamical friction (e.g., Goerdt et al., 2006; Amorisco, 2017; Contenta et al., 2018). The survival of the cluster in Eri II and its off-center position therefore indicate a shallow density profile. However, the 23 pc offset of the cluster from the center of Eri II suggests a surprisingly small dark matter core of size pc. The implications of such a core for dark matter models remain to be explored.
References
- Adams & Oosterloo (2018) Adams, E. A. K., & Oosterloo, T. A. 2018, A&A, 612, A26
- Albers et al. (2019) Albers, S. M., Weisz, D. R., Cole, A. A., et al. 2019, MNRAS, 490, 5538
- Alcock et al. (2001) Alcock, C., Allsman, R. A., Alves, D. R., et al. 2001, ApJ, 550, L169
- Amorisco (2017) Amorisco, N. C. 2017, ApJ, 844, 64
- Astropy Collaboration et al. (2018) Astropy Collaboration, Price-Whelan, A. M., Sipőcz, B. M., et al. 2018, AJ, 156, 123
- Bailin & Ford (2007) Bailin, J., & Ford, A. 2007, MNRAS, 375, L41
- Bailyn (1995) Bailyn, C. D. 1995, ARA&A, 33, 133
- Battaglia et al. (2011) Battaglia, G., Tolstoy, E., Helmi, A., et al. 2011, MNRAS, 411, 1013
- Bechtol et al. (2015) Bechtol, K., Drlica-Wagner, A., Balbinot, E., et al. 2015, ApJ, 807, 50
- Belokurov et al. (2007) Belokurov, V., Zucker, D. B., Evans, N. W., et al. 2007, ApJ, 654, 897
- Besla et al. (2007) Besla, G., Kallivayalil, N., Hernquist, L., et al. 2007, ApJ, 668, 949
- Binney & Tremaine (2008) Binney, J., & Tremaine, S. 2008, Galactic Dynamics: Second Edition (Princeton University Press)
- Blaña et al. (2020) Blaña, M., Burkert, A., Fellhauer, M., Schartmann, M., & Alig, C. 2020, MNRAS, 497, 3601
- Blitz & Robishaw (2000) Blitz, L., & Robishaw, T. 2000, ApJ, 541, 675
- Boldrini et al. (2019) Boldrini, P., Mohayaee, R., & Silk, J. 2019, MNRAS, 485, 2546
- Bovill & Ricotti (2011) Bovill, M. S., & Ricotti, M. 2011, ApJ, 741, 17
- Bovy (2015) Bovy, J. 2015, ApJS, 216, 29
- Brandt (2016) Brandt, T. D. 2016, ApJ, 824, L31
- Brown et al. (2005) Brown, T. M., Ferguson, H. C., Smith, E., et al. 2005, AJ, 130, 1693
- Brown et al. (2012) Brown, T. M., Tumlinson, J., Geha, M., et al. 2012, ApJ, 753, L21
- Brown et al. (2014) —. 2014, ApJ, 796, 91
- Carlin & Sand (2018) Carlin, J. L., & Sand, D. J. 2018, ApJ, 865, 7
- Ciotti & Bertin (1999) Ciotti, L., & Bertin, G. 1999, A&A, 352, 447
- Clementini et al. (2012) Clementini, G., Cignoni, M., Contreras Ramos, R., et al. 2012, ApJ, 756, 108
- Contenta et al. (2018) Contenta, F., Balbinot, E., Petts, J. A., et al. 2018, MNRAS, 476, 3124
- Crnojević et al. (2016) Crnojević, D., Sand, D. J., Zaritsky, D., et al. 2016, ApJ, 824, L14
- Cusano et al. (2016) Cusano, F., Garofalo, A., Clementini, G., et al. 2016, ApJ, 829, 26
- de Blok et al. (2001) de Blok, W. J. G., McGaugh, S. S., Bosma, A., & Rubin, V. C. 2001, ApJ, 552, L23
- de Jong et al. (2008) de Jong, J. T. A., Harris, J., Coleman, M. G., et al. 2008, ApJ, 680, 1112
- Del Principe et al. (2005) Del Principe, M., Piersimoni, A. M., Bono, G., et al. 2005, AJ, 129, 2714
- DES Collaboration et al. (2018) DES Collaboration, Abbott, T. M. C., Abdalla, F. B., et al. 2018, ApJS, 239, 18
- Dolphin (2002) Dolphin, A. E. 2002, MNRAS, 332, 91
- Dolphin (2012) —. 2012, ApJ, 751, 60
- Drlica-Wagner et al. (2015) Drlica-Wagner, A., Bechtol, K., Rykoff, E. S., et al. 2015, ApJ, 813, 109
- Drlica-Wagner et al. (2020) Drlica-Wagner, A., Bechtol, K., Mau, S., et al. 2020, ApJ, 893, 47
- Einasto et al. (1974) Einasto, J., Saar, E., Kaasik, A., & Chernin, A. D. 1974, Nature, 252, 111
- Fillingham et al. (2018) Fillingham, S. P., Cooper, M. C., Boylan-Kolchin, M., et al. 2018, MNRAS, 477, 4491
- Flores & Primack (1994) Flores, R. A., & Primack, J. R. 1994, ApJ, 427, L1
- Ford et al. (2003) Ford, H. C., Clampin, M., Hartig, G. F., et al. 2003, Society of Photo-Optical Instrumentation Engineers (SPIE) Conference Series, Vol. 4854, Overview of the Advanced Camera for Surveys on-orbit performance, ed. J. C. Blades & O. H. W. Siegmund, 81–94
- Foreman-Mackey (2016) Foreman-Mackey, D. 2016, The Journal of Open Source Software, 24, doi:10.21105/joss.00024
- Foreman-Mackey et al. (2013) Foreman-Mackey, D., Hogg, D. W., Lang, D., & Goodman, J. 2013, PASP, 125, 306
- Fritz et al. (2018) Fritz, T. K., Battaglia, G., Pawlowski, M. S., et al. 2018, A&A, 619, A103
- Gaia Collaboration et al. (2016) Gaia Collaboration, Prusti, T., de Bruijne, J. H. J., et al. 2016, A&A, 595, A1
- Gaia Collaboration et al. (2018) Gaia Collaboration, Brown, A. G. A., Vallenari, A., et al. 2018, A&A, 616, A1
- Gallart et al. (1999) Gallart, C., Freedman, W. L., Aparicio, A., Bertelli, G., & Chiosi, C. 1999, AJ, 118, 2245
- Garrison-Kimmel et al. (2014) Garrison-Kimmel, S., Boylan-Kolchin, M., Bullock, J. S., & Lee, K. 2014, MNRAS, 438, 2578
- Geha et al. (2015) Geha, M., Weisz, D., Grocholski, A., et al. 2015, ApJ, 811, 114
- Geha et al. (2013) Geha, M., Brown, T. M., Tumlinson, J., et al. 2013, ApJ, 771, 29
- Geha et al. (2017) Geha, M., Wechsler, R. H., Mao, Y.-Y., et al. 2017, ApJ, 847, 4
- Goerdt et al. (2006) Goerdt, T., Moore, B., Read, J. I., Stadel, J., & Zemp, M. 2006, MNRAS, 368, 1073
- Grcevich & Putman (2009) Grcevich, J., & Putman, M. E. 2009, ApJ, 696, 385
- Harris (1996) Harris, W. E. 1996, AJ, 112, 1487
- Hesser et al. (1984) Hesser, J. E., McClure, R. D., Hawarden, T. G., et al. 1984, PASP, 96, 406
- Hidalgo et al. (2011) Hidalgo, S. L., Aparicio, A., Skillman, E., et al. 2011, ApJ, 730, 14
- Hu et al. (2000) Hu, W., Barkana, R., & Gruzinov, A. 2000, Phys. Rev. Lett., 85, 1158
- Hui et al. (2017) Hui, L., Ostriker, J. P., Tremaine, S., & Witten, E. 2017, Phys. Rev. D, 95, 043541
- Hunter (2007) Hunter, J. D. 2007, Computing In Science & Engineering, 9, 90
- Husser (2012) Husser, T.-O. 2012, Ph.D. Thesis, Universitätsverlag Göttingen, doi:10.17875/gup2012-87
- Irwin et al. (2007) Irwin, M. J., Belokurov, V., Evans, N. W., et al. 2007, ApJ, 656, L13
- Kallivayalil et al. (2013) Kallivayalil, N., van der Marel, R. P., Besla, G., Anderson, J., & Alcock, C. 2013, ApJ, 764, 161
- Kaluzny et al. (2013) Kaluzny, J., Rozyczka, M., Pych, W., et al. 2013, Acta Astron., 63, 309
- Kaur & Sridhar (2018) Kaur, K., & Sridhar, S. 2018, ApJ, 868, 134
- King (1962) King, I. 1962, AJ, 67, 471
- Koposov et al. (2015) Koposov, S. E., Belokurov, V., Torrealba, G., & Evans, N. W. 2015, ApJ, 805, 130
- Kuzio de Naray et al. (2008) Kuzio de Naray, R., McGaugh, S. S., & de Blok, W. J. G. 2008, ApJ, 676, 920
- Leiner et al. (2016) Leiner, E., Mathieu, R. D., Stello, D., Vand erburg, A., & Sandquist, E. 2016, ApJ, 832, L13
- Leung et al. (2020) Leung, G. Y. C., Leaman, R., van de Ven, G., & Battaglia, G. 2020, MNRAS, 493, 320
- Li et al. (2017) Li, T. S., Simon, J. D., Drlica-Wagner, A., et al. 2017, ApJ, 838, 8
- Lin & Faber (1983) Lin, D. N. C., & Faber, S. M. 1983, ApJ, 266, L21
- Lindegren et al. (2018) Lindegren, L., Hernández, J., Bombrun, A., et al. 2018, A&A, 616, A2
- Marsh & Niemeyer (2019) Marsh, D. J. E., & Niemeyer, J. C. 2019, Phys. Rev. Lett., 123, 051103
- Martin et al. (2008) Martin, N. F., de Jong, J. T. A., & Rix, H.-W. 2008, ApJ, 684, 1075
- Martin et al. (2006) Martin, N. F., Ibata, R. A., Irwin, M. J., et al. 2006, MNRAS, 371, 1983
- Martínez-Vázquez et al. (2019) Martínez-Vázquez, C. E., Vivas, A. K., Gurevich, M., et al. 2019, MNRAS, 490, 2183
- McConnachie & Venn (2020) McConnachie, A. W., & Venn, K. A. 2020, AJ, 160, 124
- McConnachie et al. (2008) McConnachie, A. W., Huxor, A., Martin, N. F., et al. 2008, ApJ, 688, 1009
- McCrea (1964) McCrea, W. H. 1964, MNRAS, 128, 147
- Meadows et al. (2020) Meadows, N., Navarro, J. F., Santos-Santos, I., Benítez-Llambay, A., & Frenk, C. 2020, MNRAS, 491, 3336
- Monelli et al. (2010) Monelli, M., Gallart, C., Hidalgo, S. L., et al. 2010, ApJ, 722, 1864
- Moore (1994) Moore, B. 1994, Nature, 370, 629
- Muñoz et al. (2018) Muñoz, R. R., Côté, P., Santana, F. A., et al. 2018, ApJ, 860, 66
- Muñoz et al. (2012) Muñoz, R. R., Padmanabhan, N., & Geha, M. 2012, ApJ, 745, 127
- Musella et al. (2018) Musella, I., Di Criscienzo, M., Marconi, M., et al. 2018, MNRAS, 473, 3062
- Mutlu-Pakdil et al. (2018) Mutlu-Pakdil, B., Sand, D. J., Carlin, J. L., et al. 2018, ApJ, 863, 25
- Mutlu-Pakdil et al. (2019) Mutlu-Pakdil, B., Sand, D. J., Walker, M. G., et al. 2019, ApJ, 885, 53
- Nadler et al. (2020) Nadler, E. O., Drlica-Wagner, A., Bechtol, K., et al. 2020, arXiv e-prints, arXiv:2008.00022
- Ness et al. (2015) Ness, M., Hogg, D. W., Rix, H. W., Ho, A. Y. Q., & Zasowski, G. 2015, ApJ, 808, 16
- Nishikawa et al. (2020) Nishikawa, H., Boddy, K. K., & Kaplinghat, M. 2020, Phys. Rev. D, 101, 063009
- Oguri et al. (2018) Oguri, M., Diego, J. M., Kaiser, N., Kelly, P. L., & Broadhurst, T. 2018, Phys. Rev. D, 97, 023518
- Pace & Li (2019) Pace, A. B., & Li, T. S. 2019, ApJ, 875, 77
- Pace et al. (2020) Pace, A. B., Kaplinghat, M., Kirby, E., et al. 2020, MNRAS, 495, 3022
- Paust et al. (2007) Paust, N. E. Q., Chaboyer, B., & Sarajedini, A. 2007, AJ, 133, 2787
- Plummer (1911) Plummer, H. C. 1911, MNRAS, 71, 460
- Portegies Zwart et al. (1997) Portegies Zwart, S. F., Hut, P., McMillan, S. L. W., & Verbunt, F. 1997, A&A, 328, 143
- Preston & Sneden (2000) Preston, G. W., & Sneden, C. 2000, AJ, 120, 1014
- Read et al. (2006) Read, J. I., Goerdt, T., Moore, B., et al. 2006, MNRAS, 373, 1451
- Relatores et al. (2019) Relatores, N. C., Newman, A. B., Simon, J. D., et al. 2019, ApJ, 887, 94
- Richardson et al. (2011) Richardson, J. C., Irwin, M. J., McConnachie, A. W., et al. 2011, ApJ, 732, 76
- Ricotti & Gnedin (2005) Ricotti, M., & Gnedin, N. Y. 2005, ApJ, 629, 259
- Robin et al. (2003) Robin, A. C., Reylé, C., Derrière, S., & Picaud, S. 2003, A&A, 409, 523
- Rodriguez Wimberly et al. (2019) Rodriguez Wimberly, M. K., Cooper, M. C., Fillingham, S. P., et al. 2019, MNRAS, 483, 4031
- Rozyczka et al. (2012) Rozyczka, M., Kaluzny, J., Pietrukowicz, P., et al. 2012, A&A, 537, A89
- Ryan-Weber et al. (2008) Ryan-Weber, E. V., Begum, A., Oosterloo, T., et al. 2008, MNRAS, 384, 535
- Sales Silva et al. (2014) Sales Silva, J. V., Peña Suárez, V. J., Katime Santrich, O. J., et al. 2014, AJ, 148, 83
- Santana et al. (2013) Santana, F. A., Muñoz, R. R., Geha, M., et al. 2013, ApJ, 774, 106
- Schlafly & Finkbeiner (2011) Schlafly, E. F., & Finkbeiner, D. P. 2011, ApJ, 737, 103
- Schlegel et al. (1998) Schlegel, D. J., Finkbeiner, D. P., & Davis, M. 1998, ApJ, 500, 525
- Schutz (2020) Schutz, K. 2020, Phys. Rev. D, 101, 123026
- Sérsic (1963) Sérsic, J. L. 1963, Boletin de la Asociacion Argentina de Astronomia La Plata Argentina, 6, 41
- Skillman et al. (2017) Skillman, E. D., Monelli, M., Weisz, D. R., et al. 2017, ApJ, 837, 102
- Sollima et al. (2006) Sollima, A., Cacciari, C., & Valenti, E. 2006, MNRAS, 372, 1675
- Spekkens et al. (2014) Spekkens, K., Urbancic, N., Mason, B. S., Willman, B., & Aguirre, J. E. 2014, ApJ, 795, L5
- Stetson (1987) Stetson, P. B. 1987, PASP, 99, 191
- Stryker (1993) Stryker, L. L. 1993, PASP, 105, 1081
- Teyssier et al. (2012) Teyssier, M., Johnston, K. V., & Kuhlen, M. 2012, MNRAS, 426, 1808
- van den Bergh (1999) van den Bergh, S. 1999, A&A Rev., 9, 273
- Van Der Walt et al. (2011) Van Der Walt, S., Colbert, S. C., & Varoquaux, G. 2011, Computing in Science & Engineering, 13, 22
- VandenBerg et al. (2014) VandenBerg, D. A., Bergbusch, P. A., Ferguson, J. W., & Edvardsson, B. 2014, ApJ, 794, 72
- Vandenberg et al. (1990) Vandenberg, D. A., Bolte, M., & Stetson, P. B. 1990, AJ, 100, 445
- Vivas et al. (2020) Vivas, A. K., Martínez-Vázquez, C., & Walker, A. R. 2020, ApJS, 247, 35
- Walker et al. (2007) Walker, M. G., Mateo, M., Olszewski, E. W., et al. 2007, ApJ, 667, L53
- Wang et al. (2019) Wang, M. Y., Koposov, S., Drlica-Wagner, A., et al. 2019, ApJ, 875, L13
- Warnick et al. (2008) Warnick, K., Knebe, A., & Power, C. 2008, MNRAS, 385, 1859
- Watkins et al. (2019) Watkins, L. L., van der Marel, R. P., Sohn, S. T., & Evans, N. W. 2019, ApJ, 873, 118
- Weisz et al. (2014) Weisz, D. R., Dolphin, A. E., Skillman, E. D., et al. 2014, ApJ, 789, 147
- Weisz et al. (2012) Weisz, D. R., Zucker, D. B., Dolphin, A. E., et al. 2012, ApJ, 748, 88
- Westmeier et al. (2015) Westmeier, T., Staveley-Smith, L., Calabretta, M., et al. 2015, MNRAS, 453, 338
- Wheeler et al. (2019) Wheeler, C., Hopkins, P. F., Pace, A. B., et al. 2019, MNRAS, 490, 4447
- White & Shawl (1987) White, R. E., & Shawl, S. J. 1987, ApJ, 317, 246
- Willman et al. (2005) Willman, B., Blanton, M. R., West, A. A., et al. 2005, AJ, 129, 2692
- Zoutendijk et al. (2020) Zoutendijk, S. L., Brinchmann, J., Boogaard, L. A., et al. 2020, A&A, 635, A107
- Zucker et al. (2006) Zucker, D. B., Belokurov, V., Evans, N. W., et al. 2006, ApJ, 643, L103
- Zumalacárregui & Seljak (2018) Zumalacárregui, M., & Seljak, U. 2018, Phys. Rev. Lett., 121, 141101