The long-term evolution of main-sequence binaries in DRAGON simulations
Abstract
We present a comprehensive investigation of main-sequence (MS) binaries in the DRAGON simulations, which are the first one-million particles direct -body simulations of globular clusters. We analyse the orbital parameters of the binary samples in two of the DRAGON simulations, D1-R7-IMF93 and D2-R7-IMF01, focusing on their secular evolution and correlations up to 12 Gyr. These two models have different initial stellar mass functions: Kroupa 1993 (D1-R7-IMF93) and Kroupa 2001 (D2-R7-IMF01); and different initial mass ratio distributions: random paring (D1-R7-IMF93) and a power-law (D1-R7-IMF93). In general, the mass ratio of a population of binaries increases over time due to stellar evolution, which is less significant in D2-R7-IMF01. In D1-R7-IMF93, primordial binaries with mass ratio are most common, and the frequency linearly declines with increasing at all times. Dynamical binaries of both models have higher eccentricities and larger semi-major axes than primordial binaries. They are preferentially located in the inner part of the star cluster. Secular evolution of binary orbital parameters does not depend on the initial mass-ratio distribution, but is sensitive to the initial binary distribution of the system. At Gyr, the binary fraction decreases radially outwards, and mass segregation is present. A color difference of mag in and 0.2 mag in between the core and the outskirts of both clusters is seen, which is a reflection of the binary radial distribution and the mass segregation in the cluster. The complete set of data for primordial and dynamical binary systems at all snapshot intervals is made publicly available.
1 Introduction
The vast majority of stars are thought to have formed as part of a binary or multiple stellar system (e.g., Shatsky & Tokovinin, 2002; Kouwenhoven, et al., 2005; Duchêne & Kraus, 2013, and references therein). Most known binary systems have been discovered in radial velocity surveys, transit surveys, and direct imaging surveys. It is estimated that less than one-third of the nearby solar-type field stars is single (Mayor et al., 2004; Burgasser et al., 2003; Raghavan et al., 2010). The multiplicity fraction among field stars increases along with the primary mass (e.g., Goodwin et al., 2007; Duchêne & Kraus, 2013, and references therein), ranging from for M-dwarfs (e.g., Allen, 2007) to nearly 100% for OB stars (e.g, Shatsky & Tokovinin, 2002; Kobulnicky, Fryer & Kiminki, 2006; Sana, James & Gosset, 2011; Sana et al., 2012). Observational surveys have also found that open clusters hold a significant higher binary fraction of 35% up to 70% (e.g., Sollima et al., 2010) than globular clusters, which typically have binary fractions of % (e.g., Milone et al., 2012).
Open clusters, globular clusters, OB associations, and star forming regions provide excellent laboratories for studying stellar evolution and binary evolution (e.g., Kalirai & Richer, 2010; Catelan, Valcarce & Sweigart, 2010). Similarly, binary systems provide indispensable tools for studying the historical and present-day properties of these stellar groupings. The vast majority of binaries in most star clusters, notably globular clusters, remain unresolved in direct imaging surveys, due to their large distances, which results in crowding, while individual stars are normally too faint for radial velocity surveys. The most efficient method for constraining the global properties of the binary population in massive star clusters makes use of the colour-magnitude diagram that enables the identification of unresolved binaries that populate certain regions in the diagram (Sollima et al., 2010; Milone et al., 2012, 2016).
Despite substantial observational and theoretical efforts, the process of star formation is still not fully understood. The primordial binary population is a direct outcome of star formation, and can therefore provide important constraints about the star formation process (e.g., Kroupa, 1995; Marks & Kroupa, 2012). The origin of these primordial binary stars is strongly related to conservation and dissipation of angular momentum as proto-stellar clouds contract (see, e.g., Larson, 2003; McKee & Ostriker, 2007). Interaction of the stars in a binary with a circumstellar disk tends to lead to more or less equal-mass binary systems (e.g., Tokovinin, 2000; Krumholz & Thompson, 2007), while the fragmentation of massive circumstellar disks tends to result in unequal-mass, lower-mass binary systems (e.g., Li, et al., 2015, 2016). The formation process of primordial binary systems is highly complex and may be strongly affected by the physical properties of the molecular cloud and by the presence of strong radiation fields, magnetic fields (e.g., Price & Bate, 2007), and close encounters with nearby stars (e.g., Whitworth, 2001).
The orbital elements of binary stars may gradually evolve over time, and some of the binaries are completely disrupted through either internal or external processes. This may occur as a consequence of dynamical interactions with neighbouring stars (see, e.g., Heggie, 1975; Hut, et al., 1992, and references therein), or in the case of very wide binary systems, by the external galactic tidal field (e.g., Jiang & Tremaine, 2010). Stellar evolution and mass loss in detached binary systems, as well as binary evolution, will affect binary stars over time (Hurley, Tout & Pols, 2002). Secular evolution in multiple stellar system can have similar effects (e.g., Ford, Kozinsky & Rasio, 2000; Naoz, et al., 2013; Hamers, 2020).
Over time, new binary stars may form as a result of dynamical interactions. This process is very inefficient in the galactic field (e.g., Goodman & Hut, 1993), but three-body interactions can lead to the formation of population of dynamical binaries in star clusters (e.g., Belloni et al., 2017). The direct formation of close binary systems in star cluster is rare, although hardening of binaries due to interaction with neighbour stars occasionally results in short-period dynamical binary systems. Star clusters tend to have a transient population of very wide binary systems (Moeckel & Clarke, 2011) that may freeze in as the star cluster evolves (e.g., Kouwenhoven, et al., 2010) and contribute to the wide binaries in the Galactic field.
Accurate knowledge of the present-day properties of the binary population provides comprehensive information about the formation history and the dynamical evolution the stellar population. The amount of information provided by the binary population is enormous, which poses opportunities as well as major challenges. Firstly, it is difficult to quantify the available information in the multi-dimensional parameter space using simple expressions, such as a binary fraction or a prescription for the mass ratio distribution, without significant loss of relevant information. Secondly, observational limitations have thus far limited the astronomical community from providing a complete record of the stellar population, even in the neighbourhood of the Sun, although substantial progress has been made in recent years (see, e.g., Tokovinin, 2014a, b, and references therein).
The binary population in very young and sparse stellar groupings (such as OB associations, e.g., Raghavan et al., 2010) are the least affected by stellar evolution and binary evolution, and is therefore closest to the outcome of the star formation process. OB associations and star forming regions are often used to relate the properties of the binary population to the star forming process. The binary population in globular clusters, on the other hand, is strongly affected by both stellar evolution and dynamical evolution. Globular clusters are bright, abundant, and can be studied in detail at intergalactic distances. The observable properties of globular clusters can provide important information on both stellar evolution and dynamical evolution, and at the same time, can provide constraints on the primordial binary population, at substantially earlier epochs, and at much lower metallicities.
Characterizing the binary population in globular clusters is challenging, as is constraining the primordial binary population. Unlike in nearby star-forming regions, it is substantially more challenging to survey individual stars for binary companions in extra-galactic globular clusters, even though obtaining multi-band photometry and spectroscopic measurements is not difficult. In addition, it is possible to obtain measurements of distinguishing features of binaries. Even though it may not be possible to observe binaries directly, such measurements can be used to constrain the properties of the binary population (including the primordial binary population), and to exclude alternatives.
Direct -body simulations can be model to study star clusters and their constituent populations. Modern -body simulations are able to model the relevant physical processes that occur in star clusters, most importantly stellar dynamics, stellar evolution, and the influence of external tidal fields (see, e.g., Aarseth, 1999). Developments in both software and hardware have significantly improved in the recent decade, resulting in significant speed-ups, as well as the ability to model star clusters with unprecedented accuracy. The recent implementation of the use of Graphical Processing Units (GPUs) and hybrid parallelization methods made the direct -body simulations for globular clusters feasible (Wang et al., 2015).
Substantial progress was made with the DRAGON simulation project (Wang et al., 2016). The DRAGON simulations are the first 1-million particle direct -body simulations of globular clusters. The set of DRAGON simulations consists of four models. Each model is initialized with a binary fraction of 5%, and were dynamically evolved using NBODY6++GPU (Wang et al., 2015, 2016). In these simulations, the evolution the stellar and binary population, can be modeled more accurately than those carried out using in Monte Carlo simulations (Wang et al., 2016), albeit at a greater computational cost. Moreover, the properties of the binary population are recorded frequently, at an interval of 0.1 Myr, such that these can be easily compared with observations, to deepen our understanding of the physical processes involved. In these study we distinguish between primordial binaries and dynamical binaries. We define a primordial binary system as a a binary system as a binary system that were present at the start of the simulation. Dynamical binary systems, on the other hand, are binary systems that form at a later time, through capture or exchange.
There are four models in the DRAGON simulation project: D1-R7-IMF93, D2-R7-IMF01, D3-R7-ROT and D4-R3-IMF01. We carry out a detailed investigation on the long-term evolution of the properties of stellar binary systems in the DRAGON simulations, and compare our findings with properties of observed globular clusters, in order to provide the underlined physics for observed features in current and future observations. We will focus primarily on the parameter characterization of main-sequence (MS) binaries, which are by far the most common types of binary systems in star clusters, and in the Galactic field. The analysis of the temporal evolution of the orbital elements of the binary systems provides information about the formation, destruction, and secular evolution of binary systems, whereas comparing these with their location inside the parent cluster will provide us with insights on dynamical processes like mass segregation. Distributions of primordial and dynamical binaries are compared over time and position, in order to evaluate whether our result are in agreement with realistic globular cluster data. We will compare the secular evolution of orbital elements, and mass ratio, of the two different binary types, using the probability distribution (i.e., the relative frequency) for a large set of data (e.g., the primordial binaries), while we use the cumulative distribution for smaller sets of data (e.g., the dynamical binaries). Subsequently, we will study the correlations between the orbital elements and the correlations with mass ratio, in order to find how binaries mass ratio groups distribute in their orbital parameters. Finally, we carry out an observational comparison with our data, in order to analyse how they compare with the results of our simulations. We also provide an online database with the kinematic and orbital properties of all binary systems in the two DRAGON models analysed in this study.
This paper is organized as follows. In Section 2 we present the initial conditions of the binary systems in the DRAGON simulations. In Section 3 we analyse the evolution of the binary population over time, and identify correlations between different orbital properties, physical properties, and dynamical histories. We provide an observational analysis in Section 4. Finally, we summarize and discuss our findings in Section 5.
2 Binary samples from DRAGON simulations
2.1 Initial conditions of DRAGON simulations
Among four models of DRAGON simulations, model D4-R3-IMF01 was initialized with a more compact density profile. This model was evolved for only 1 Gyr, which is too short for a comparison with observed globular clusters. Cluster model D3-R7-ROT included global rotation. However, it did not show any significantly different results in the evolution of the binary population, which is the focus of our study. The other two models, D1-R7-IMF93 and D2-R7-IMF01, have many similar initial conditions and a few differences. The small differences between both models result in a different evolution that deserves a comparison. Therefore, in this work we select D1-R7-IMF93 and D2-R7-IMF01 as our target models to study the evolution of the binary population in detail. Both models aim to simulate the dynamical evolution of globular cluster NGC 4372. In both models, the globular cluster is placed in an external tidal field corresponding to that of the Milky Way, at NGC 4372’s Galactocentric distance of 7.1 kpc. The star cluster is placed in a circular orbit around the Milky Way centre. The Galactic centre is represented with a point mass, corresponding to the enclosed mass of the Milky Way of and exerting the tidal force on the star cluster. In both models, the clusters are initially tidally under-filled.
As direct -body simulations, the DRAGON simulations represent each particle as an individual star in the cluster. These globular cluster models are initialized with 950,000 single stars and 50,000 primordial binary systems. We list the main properties of the two models in Table 1. Both globular cluster models have a King (1966) initial density profile with a King dimensionless parameter , and are assigned initial half-mass radii, , of 7.5 pc for D1-R7-IMF93 and 7.6 pc D2-R7-IMF01. Both globular clusters are initialized in virial equilibrium, , where the virial ratio is the ratio between the total kinetic energy () and the total potential energy () of the star cluster.
One major difference between the initial conditions of D1-R7-IMF93 and D2-R7-IMF01 is the initial mass function (IMF). Model D1-R7-IMF93 adopts the IMF of Kroupa et al. (1993), while D2-R7-IMF01 uses that of Kroupa (2001). The IMF is initialised following in the mass range . Both simulations adopt for the mass range . The value of differs in , with for D1-R7-IMF93, and for model D2-R7-IMF01. Finally, for range, D1-R7-IMF93 uses and D2-R7-IMF01 uses . Due to different slopes in the IMFs, D2-R7-IMF01 has a higher total mass than D1-R7-IMF93. Therefore it also has a slightly larger tidal radius (), as shown in Table 1. The initial metallicity of both models, was chosen identical to that of the globular cluster NGC 4372 (Geisler et al., 1995; Kacharov et al., 2014; San Roman et al., 2015).
Each model is initialized with a binary fraction of 5%. The start of the simulations () represents the time after which the star clusters have expelled all their interstellar gas, have smothered out their initial substructure, and have obtained virial equilibrium. Moreover, soft binaries are assumed to have been destroyed; the binary population at Myr is thus modeled to represent the hard binary population at that epoch. In the analysis below, the first snapshot (0.1 Myr) after the start of the simulations is defined as Myr. The initial semi-major axes of the primordial binary system follows a log-normal distribution in the range AU. The lower limit is a consequence of the physical size of the stars, while the upper limit is near the hard-soft boundary for stars in these globular clusters. The initial eccentricity distribution is thermal: (see, e.g., Heggie, 1975; Goodman & Hut, 1993).
The initial mass ratio distribution of the binary stars, , is also different for the two simulations. Here, the mass ratio is defined as , where is the mass of the primary star, and is the mass of the companion star (i.e., the least massive of the two stars in the binary system). In D1-R7-IMF93, the mass of primordial binaries were generated by random pairing from the IMF. In D2-R7-IMF01, the mass of the primary star () is randomly chosen from the IMF, and the secondary mass is subsequently assigned after drawing the mass ratio from the probability distribution (Kouwenhoven et al., 2007) in the mass range . The latter lower limit ensures that both primary stars and companions stars are in the mass range . This major difference will lead to variation in binary evolution (see Section 3.1).
Stellar evolution is modeled following the prescriptions of Hurley et al. (2000) for single stars, and those of Hurley, Tout & Pols (2002) for interacting binary systems. The gravitational kicks exerted on neutron stars and black holes follow a Maxwellian velocity distribution. The variance of the Maxwellian distribution in model D1-R7-IMF93 differs from that in model D2-R7-IMF01 (see Table 1). The kick velocity determines the number of remaining bound neutron stars and the retained black hole subsystems in the cluster, which affects the global dynamics of the cluster.
| D1-R7-IMF93 | D2-R7-IMF01 | |
|---|---|---|
| Profile | King (1966) = 6 | King (1966) = 6 |
| M () | 474 603 | 591 647 |
| IMF | Kroupa et al. (1993) | Kroupa (2001) |
| 0.00016 | 0.00016 | |
| 0.5 | 0.5 | |
| 5% | 5% | |
| random pairing | Kouwenhoven et al. (2007) | |
| thermal, | thermal, | |
| (AU) | logarithmic normal | logarithmic normal |
| 7.5 pc | 7.6 pc | |
| 89 pc | 97 pc | |
| 30 km s-1 | 265 km s-1 |
2.2 Binary star data
Primordial binaries are present immediately after the star formation process has ended (e.g., Kouwenhoven et al., 2003), and have therefore, in an idealised scenario, not yet been affected by dynamical evolution. Over time, existing binary systems are disrupted, and new binary systems are formed. Dynamical binary systems are formed as the simulation proceeds, through dynamical close encounters between single stars and/or binary systems. The two stars that form the new binary system may or may not have been part of a primordial (and/or dynamical binary) at earlier times. In this paper, We consider the binaries present in the initial conditions of D1-R7-IMF93 and D2-R7-IMF01 as primordial binaries, which can be identified with the unique IDs. Any binaries formed at later times are considered as dynamical binaries, whose IDs are different from the primordial ones.
We identify all binary systems in each snapshot of both models, for a period of 12 Gyr, and identify the evolution of each binary system. The evolution of total number of MS stars, , the properties of MS binaries for both simulations are listed in Tables 2 and 3, for snapshots at times 0 (more precisely, 0.1), 100, 300, 600, 1000, 3000, 6000, and 12000 Myr. The detailed binary samples for each snapshot are provided in Appendix A.
| Property | 0 | 100 | 300 | 600 | 1000 | 3000 | 6000 | 12000 | |
|---|---|---|---|---|---|---|---|---|---|
| All particles | 1 050 000 | 1 046 536 | 1 045 610 | 1 044 067 | 1 041 297 | 1 020 529 | 986 958 | 923 860 | |
| Binary fraction (%) | 4.73 | 4.63 | 4.50 | 4.36 | 4.21 | 3.84 | 3.55 | 3.31 | |
| All binaries | 49 628 | 48 458 | 47 036 | 45 489 | 43 885 | 39 169 | 35 007 | 30 568 | |
| Primordial binaries | 49 628 | 48 446 | 47 018 | 45 454 | 43 833 | 39 059 | 34 860 | 30 359 | |
| Dynamical binaries | 0 | 12 | 18 | 35 | 52 | 110 | 147 | 209 |
| Property | 0 | 100 | 300 | 600 | 1000 | 3000 | 6000 | 12000 | |
|---|---|---|---|---|---|---|---|---|---|
| All particles | 1 050 000 | 1 041 914 | 1 039 032 | 1 032 165 | 1 021 608 | 966 365 | 887 621 | 729 738 | |
| Binary fraction (%) | 4.76 | 4.72 | 4.61 | 4.48 | 4.39 | 4.13 | 3.94 | 3.77 | |
| All binaries | 50 003 | 49 151 | 47 880 | 46 252 | 44 798 | 39 894 | 34 935 | 27 530 | |
| Primordial binaries | 49 997 | 49 136 | 47 857 | 46 223 | 44 756 | 39 831 | 34 840 | 27 438 | |
| Dynamical binaries | 6 | 15 | 23 | 29 | 42 | 63 | 95 | 92 |
3 Secular evolution of binary properties
In this section we investigate the secular evolution of binary parameters, such as the mass ratio, the primary mass, the semi-major axis, and the eccentricity. We also discuss the statistical significance of the properties of the primordial and dynamical binary systems in models D1-R7-IMF93 and D2-R7-IMF01. This study focuses on MS binaries, i.e., systems in which both the primary and secondary are MS stars.
3.1 Mass ratio
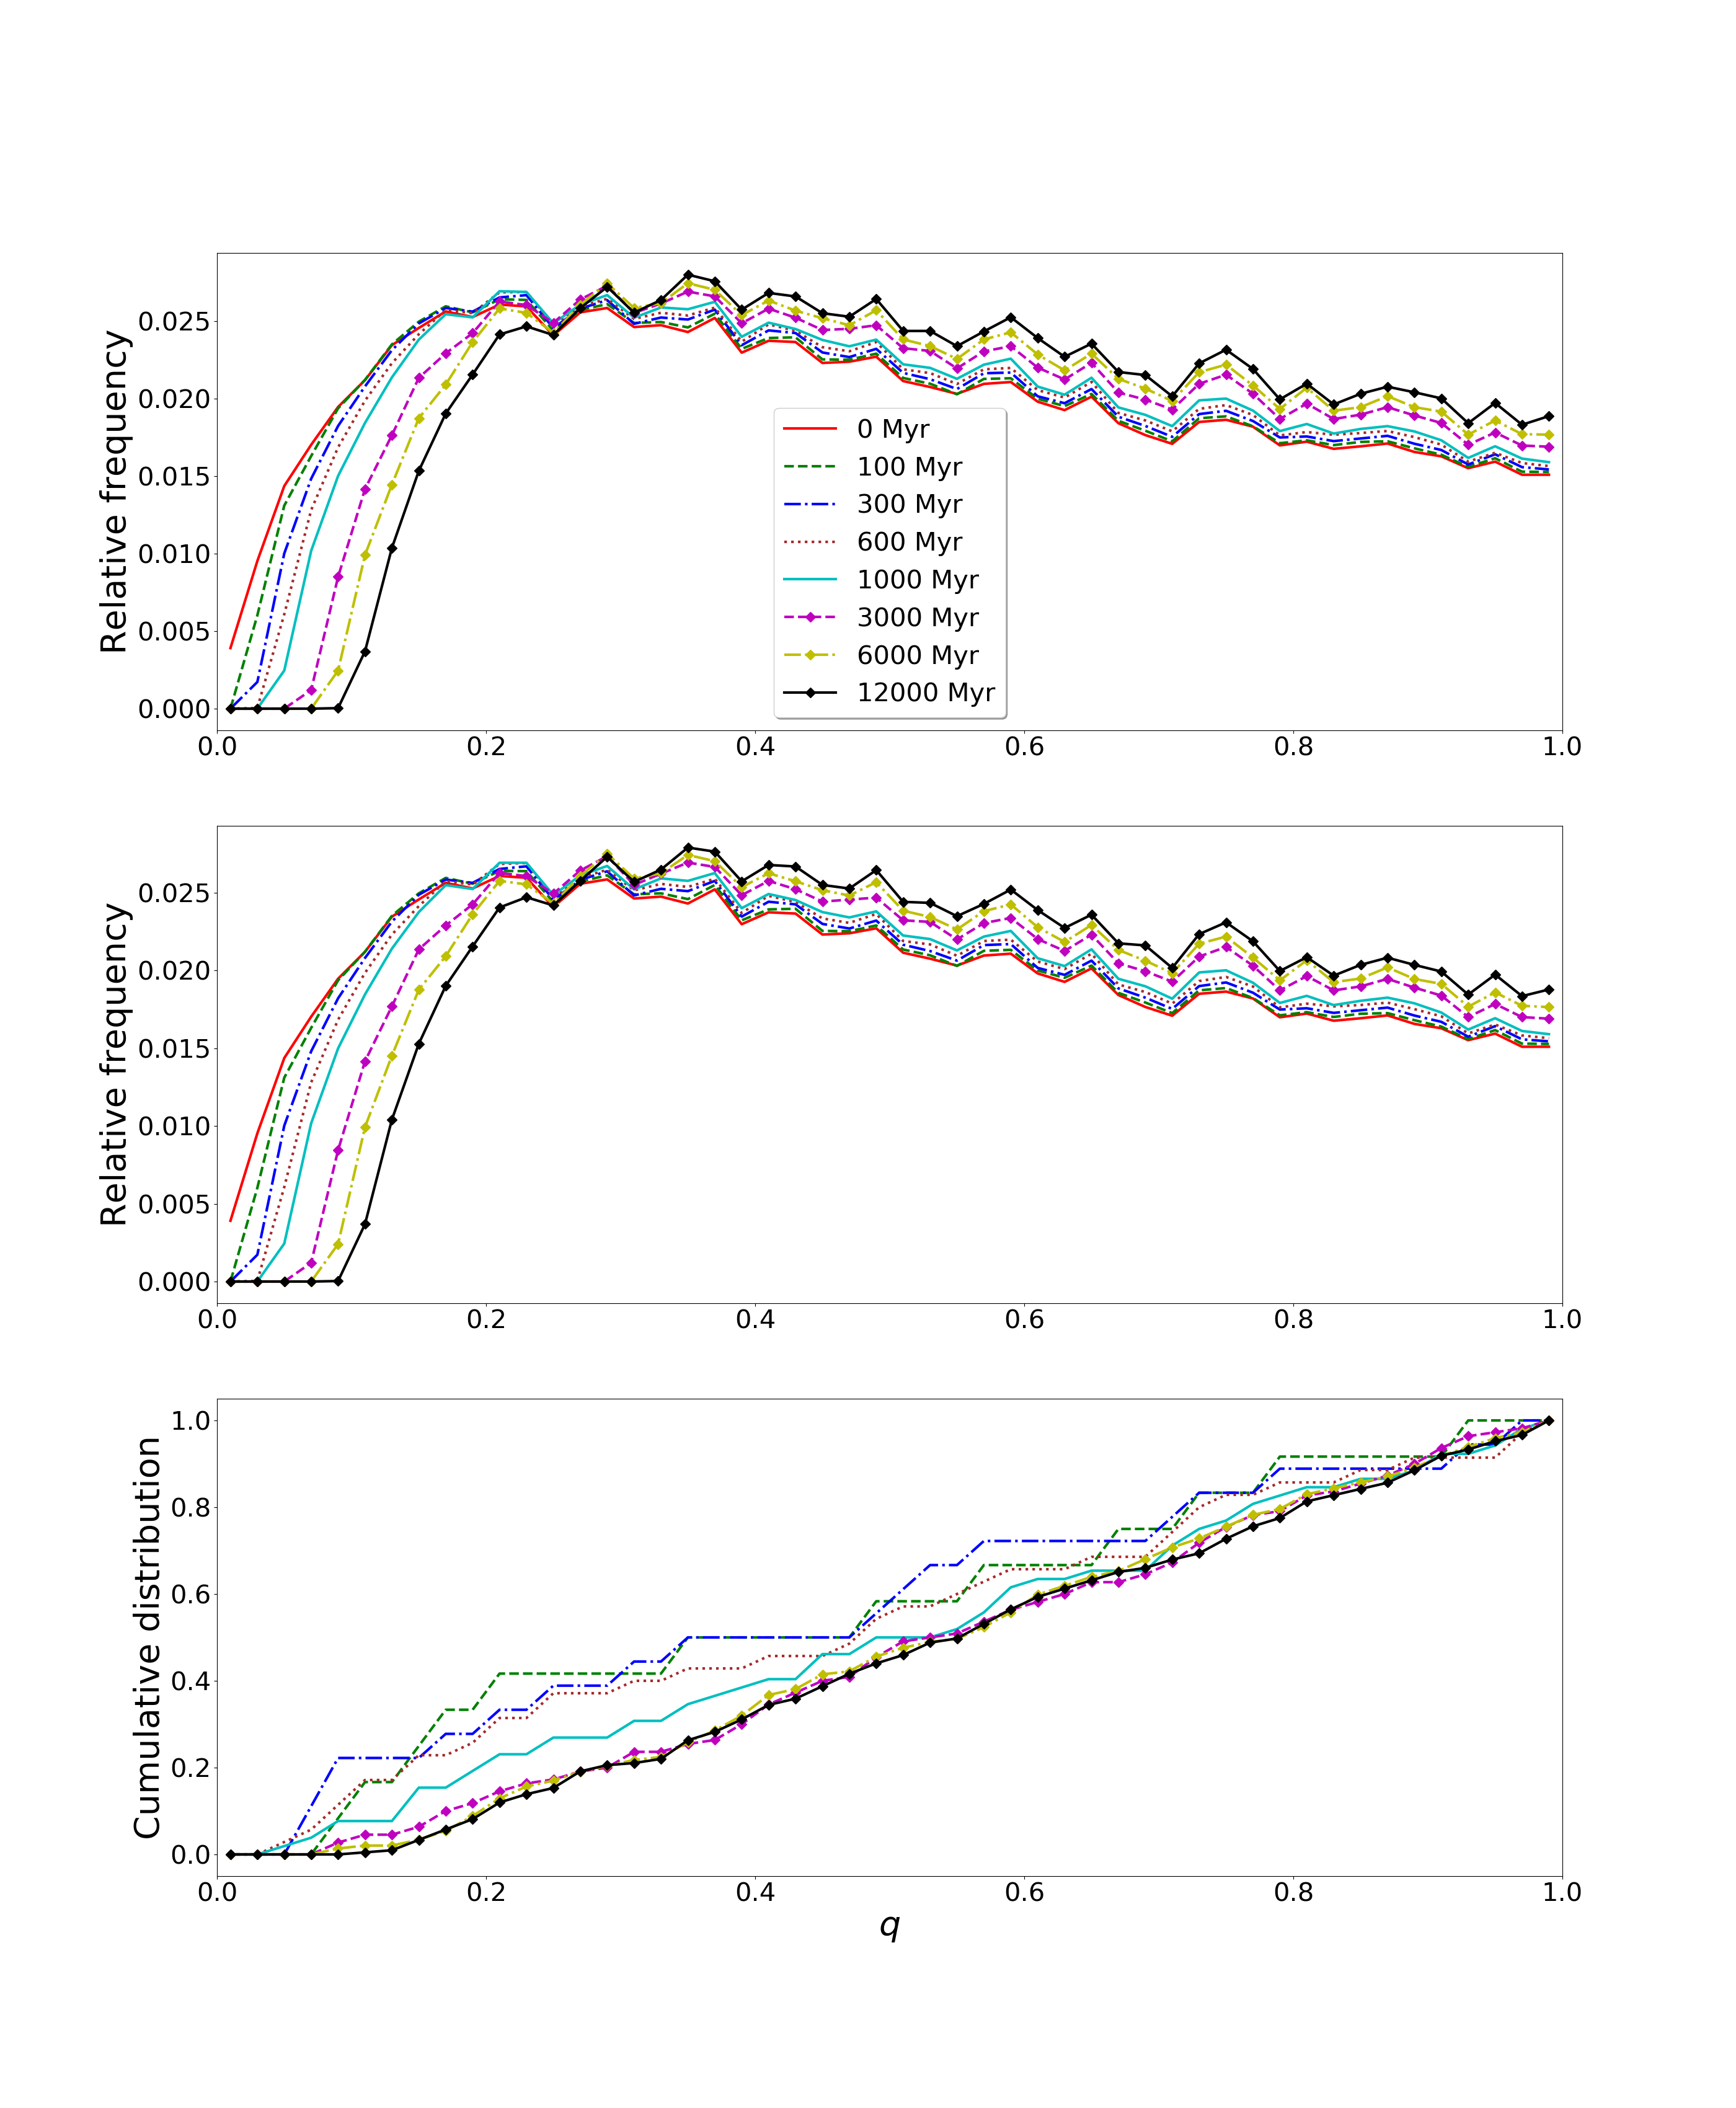
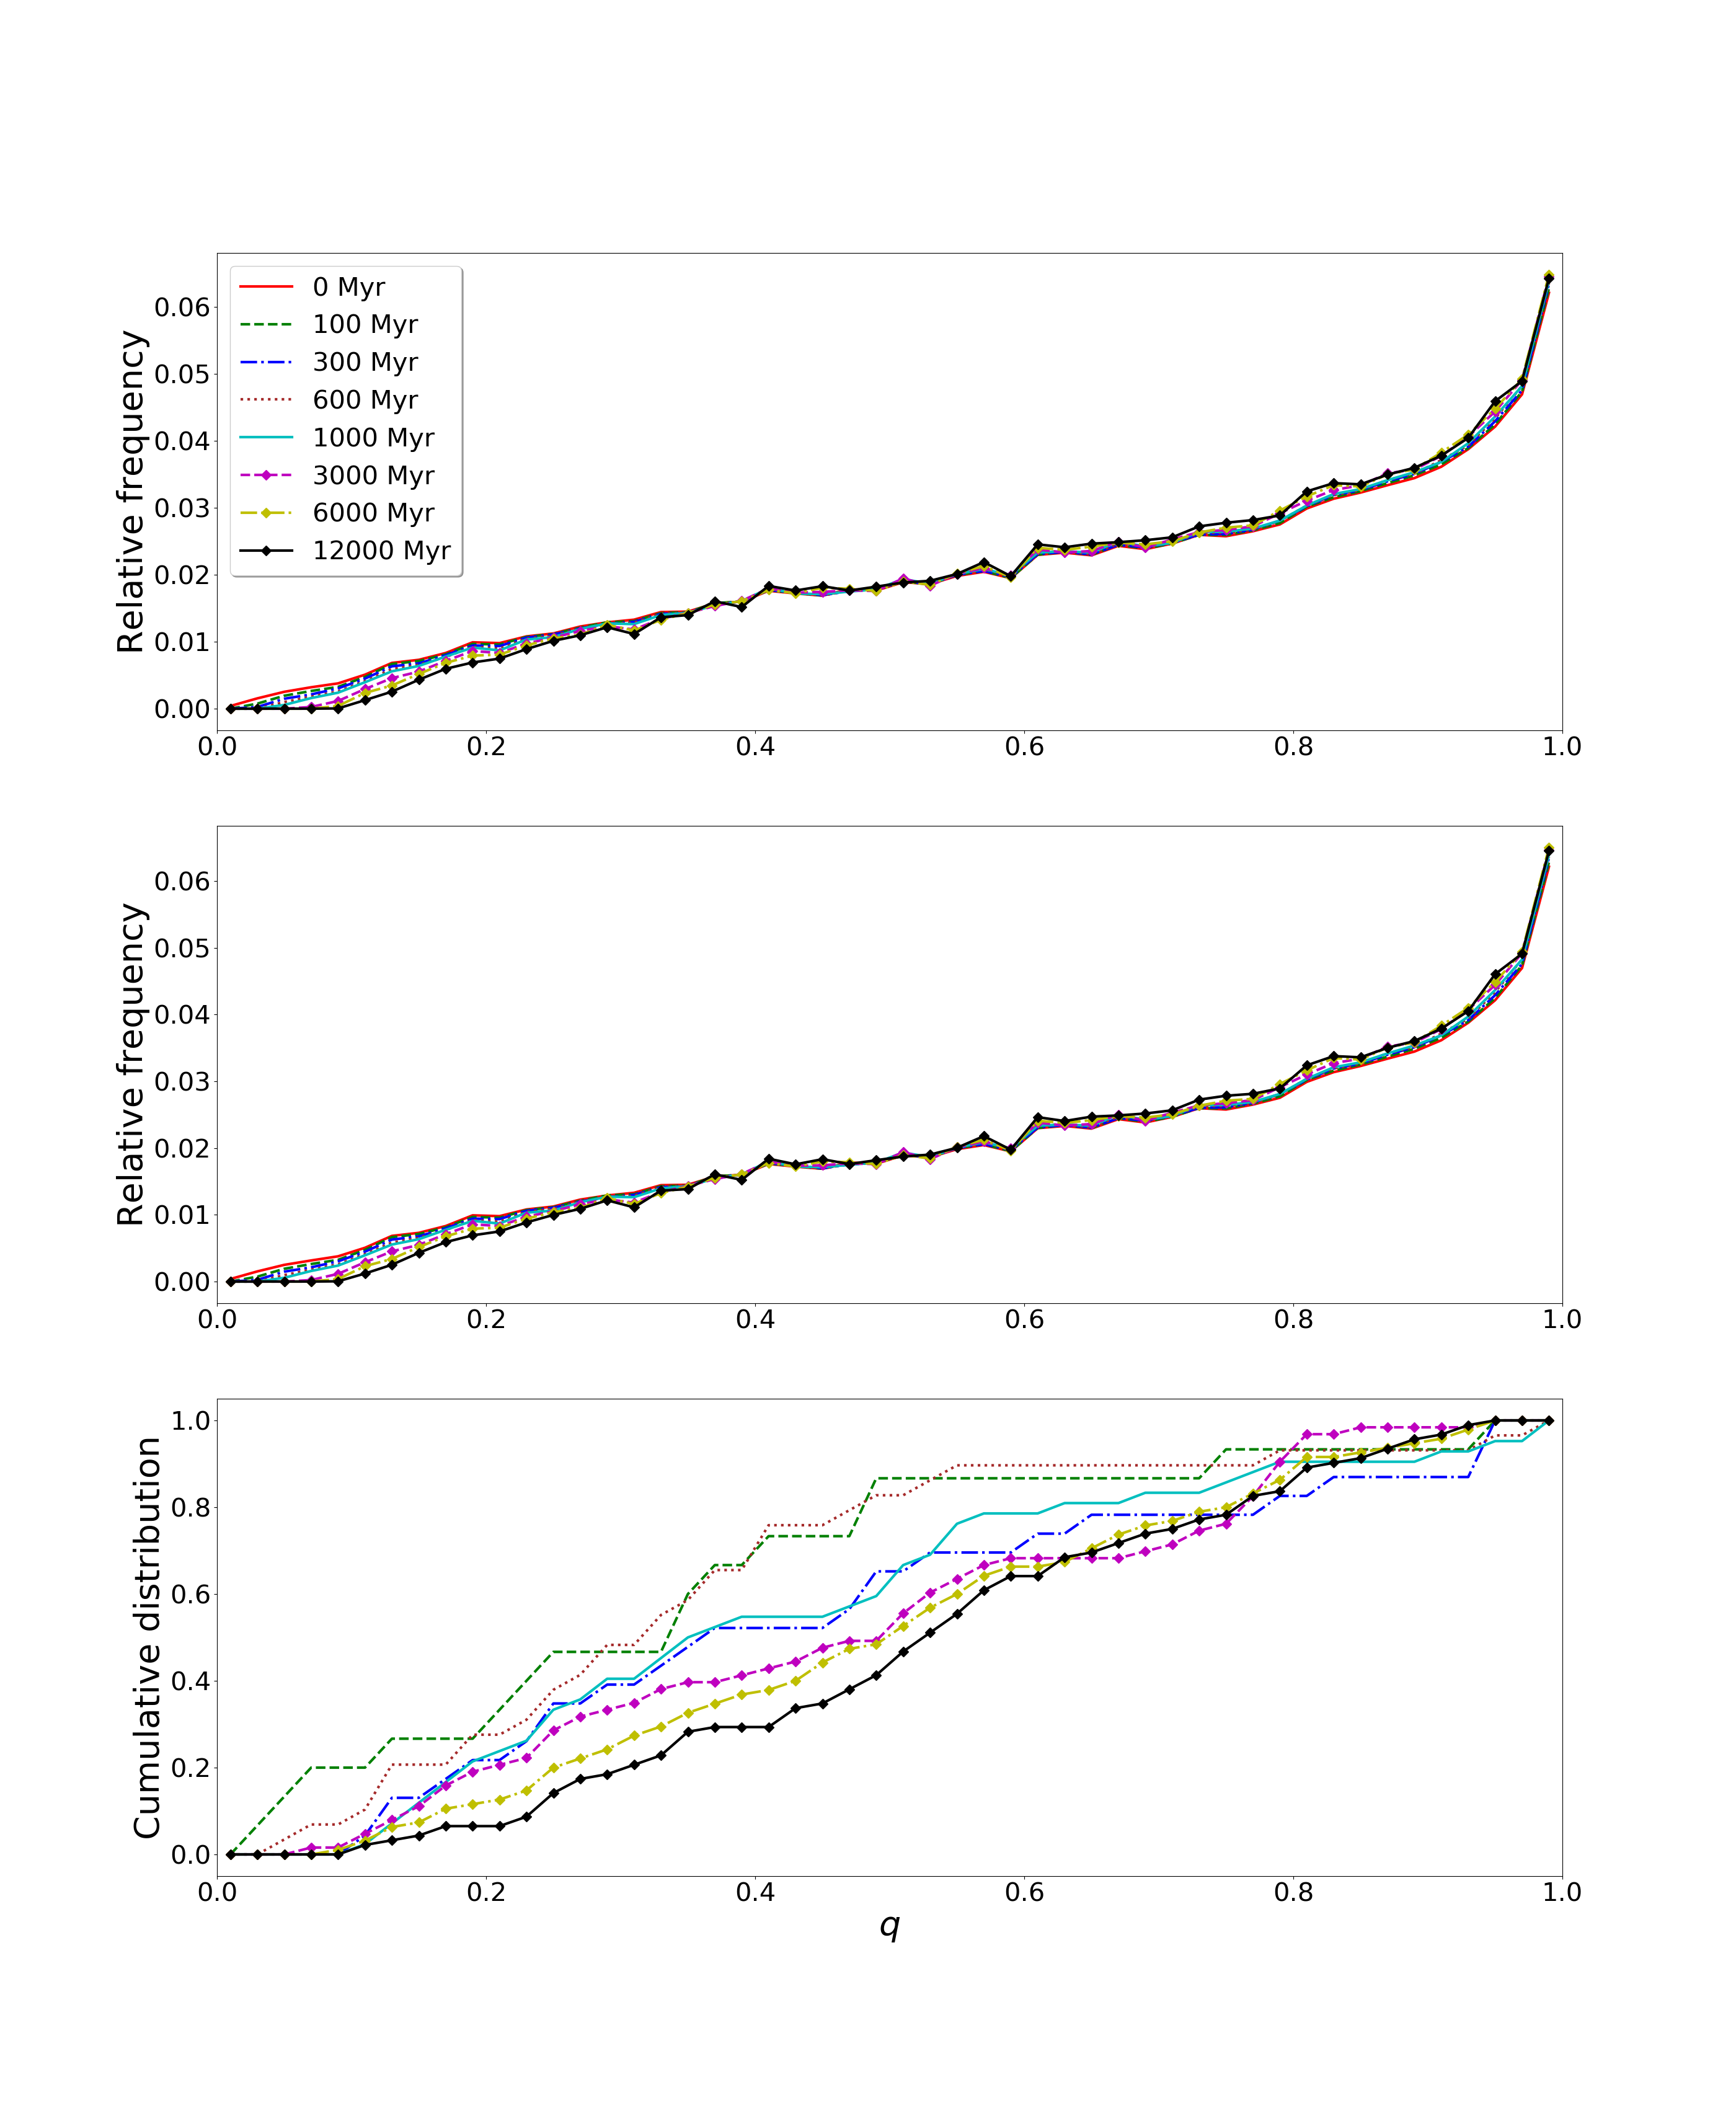
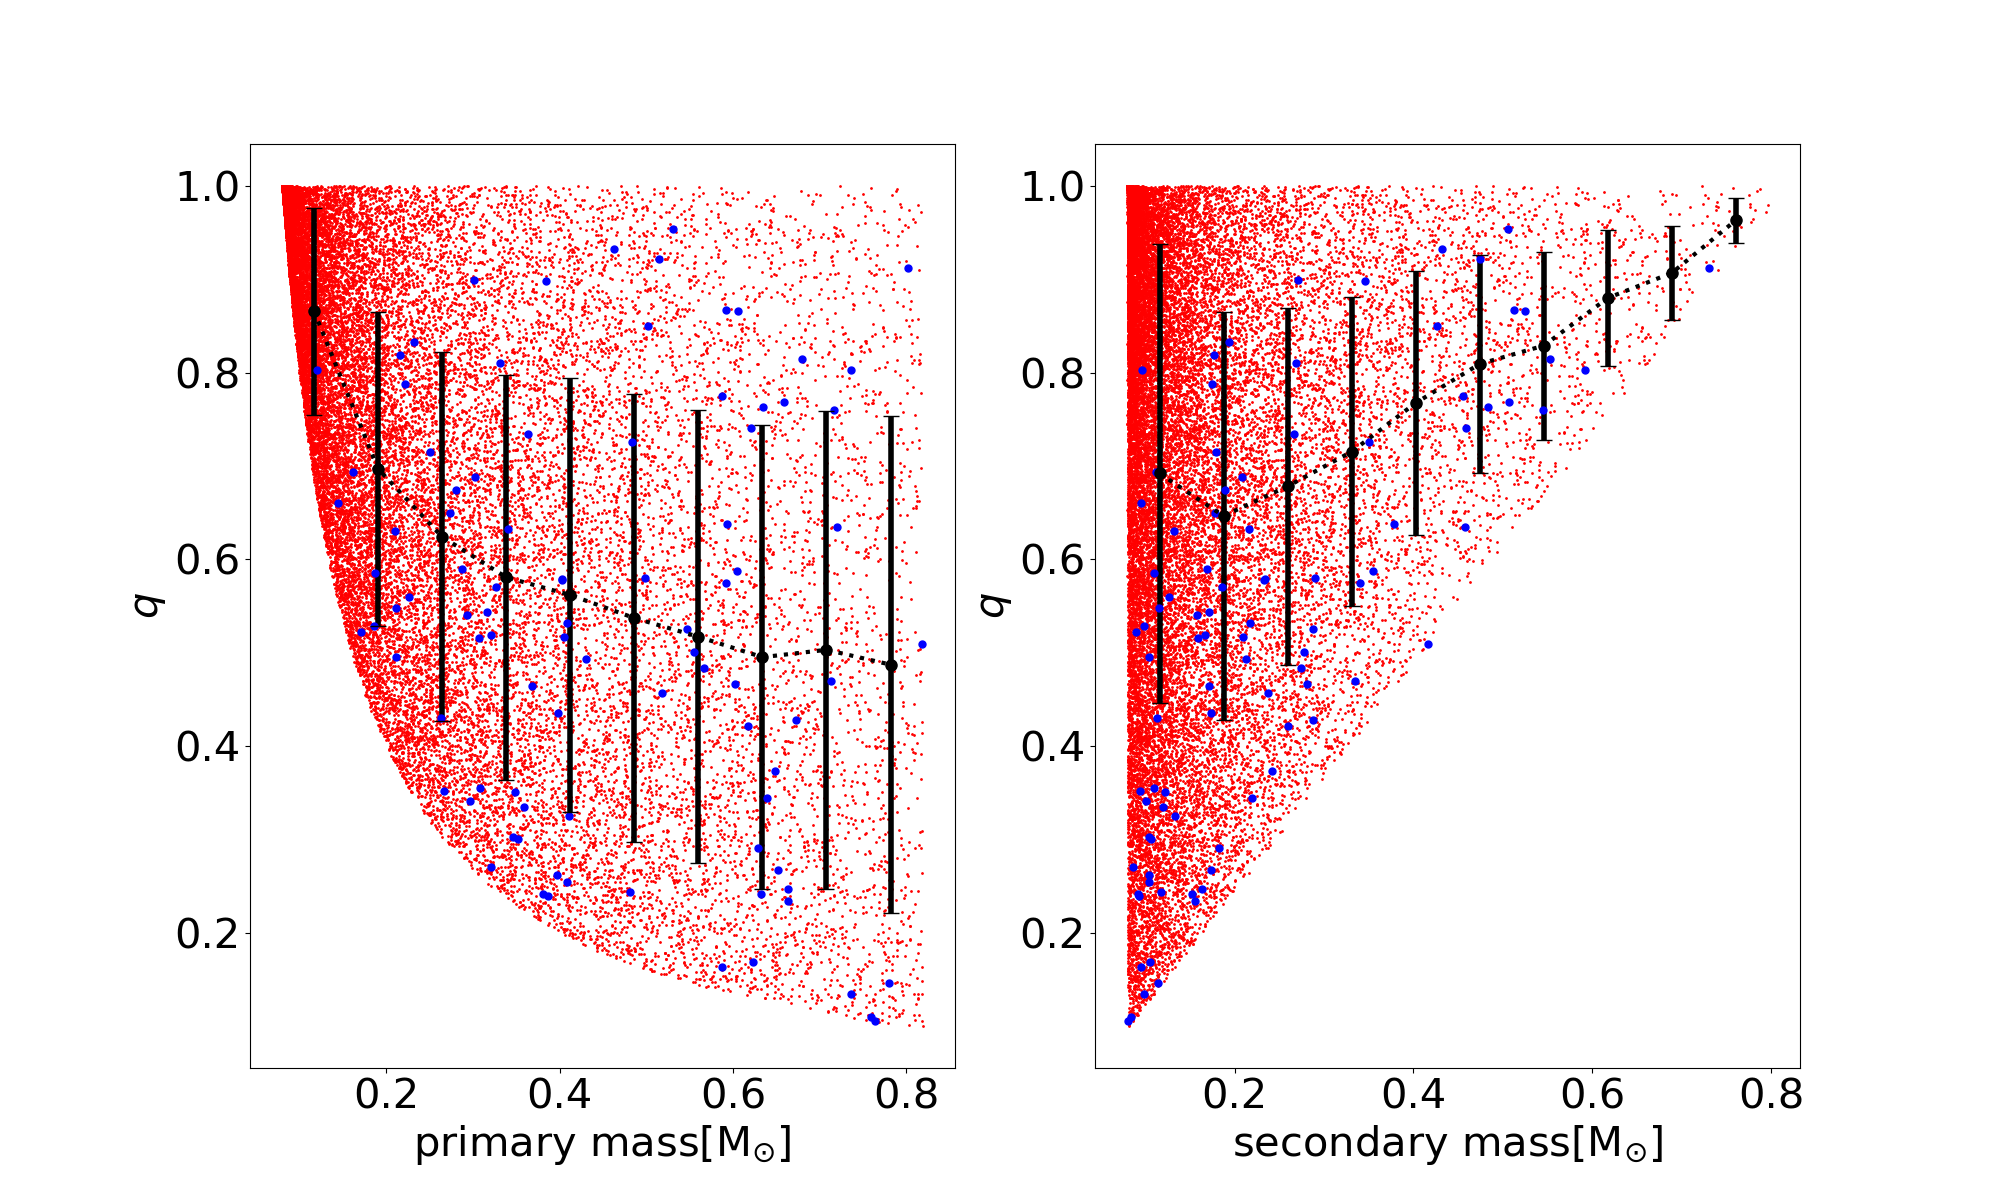
Figure 1 shows the secular evolution of MS binary mass ratio in model D1-R7-IMF93. Throughout this work, we define the mass ratio, , as the ratio of the masses of the secondary star, , and the primary star, , where . Binary systems in model D1-R7-IMF93 are generated through random pairing of the two components, which are independently drawn from the IMF. The mass ratio distribution for the combined sample of primordial MS binaries generated through random pairing is highest in the range , and remains so during the entire simulation. The relative frequency of binary systems with decreases over time. At early times, primary stars of binaries with are typically more massive than those of binaries with . The former evolve faster and experience higher mass loss, resulting in a tendency of the average mass ratio of the MS binary population to increase over time.
The relative frequency of MS binaries in D2-R7-IMF01 also decreases over time (see Figure 2), similar to in model D1-R7-IMF93. However, the decrease is less prominent due to the different initial mass ratio distribution of Kouwenhoven et al. (2007) that is assigned to the population. For MS binaries in model D2-R7-IMF01, the initial fraction of MS stars with in the combined sample is lower than that for model D1-R7-IMF93. Model D1-R7-IMF93 has a higher fraction of MS binaries with lower mass ratios, and therefore more massive MS binaries.
Throughout the entire simulation, the number of dynamically-formed MS binaries remains more than two orders of magnitude smaller than the number of primordial MS binaries, for both model D1-R7-IMF93 and model D2-R7-IMF01. The bottom panels of Figures 1 and 2 show the mass ratio distributions for the dynamical binary systems in both models. Note that, while in the top and middle panels in these figures we show mass ratio distributions, , the bottom panels show cumulative mass ratio distributions, , which are more suitable for representing the much smaller number of dynamical binary systems. Note that the mass ratio distribution of a population of binary systems with a restricted primary star mass range may look substantially different from that of the entire population of binary systems (see, e.g., Kouwenhoven et al., 2009, and references therein).
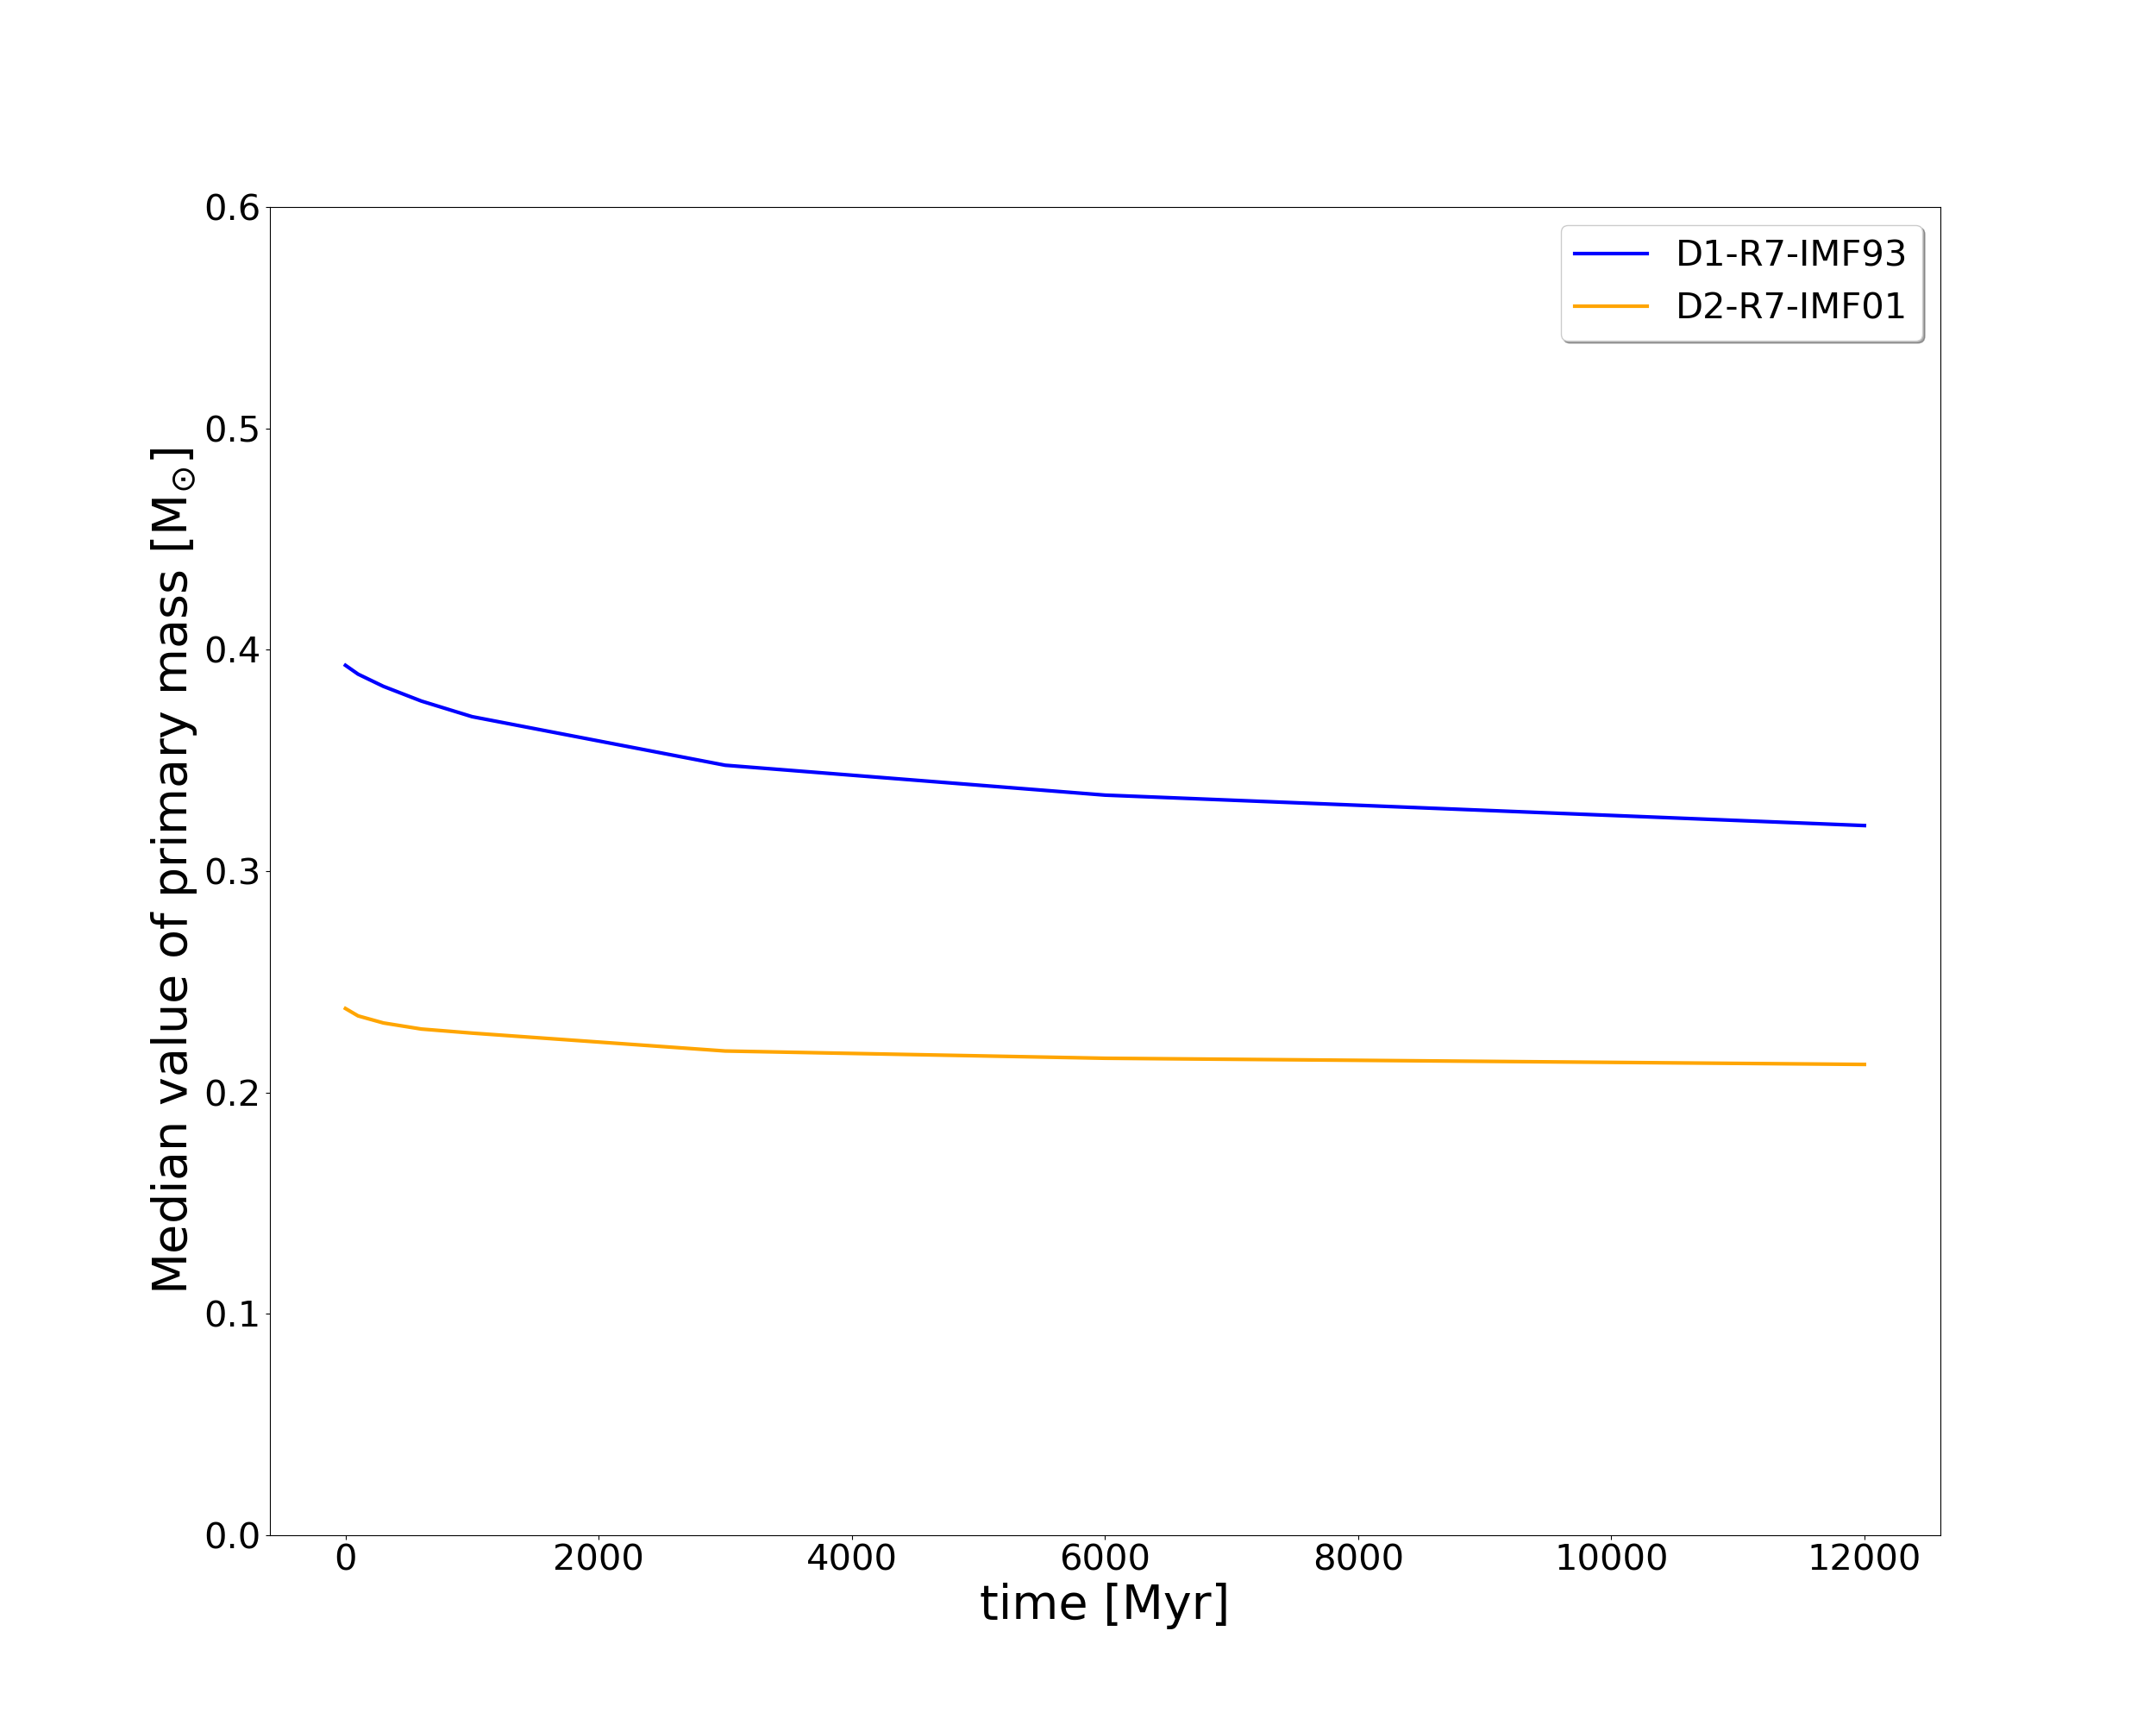
Figure 3 shows the secular evolution of the median primary masses of the MS binaries in models D1-R7-IMF93 and D2-R7-IMF01. The median primary mass resulting from random paring (D1-R7-IMF93) is generally larger than that resulting from the Kouwenhoven et al. (2007) recipe (model D2-R7-IMF01), fully consistent with Figures 1 and 2. Over time, the median primary mass in both models decreases as a consequence of stellar evolution.
Numerous observational studies have made efforts to obtain parameter distributions of binary systems in star clusters (e.g., Sollima et al., 2010; Milone et al., 2012, 2016). In addition to the binary fraction, the most sought-after parameter parameter distributions are that of the mass ratio and that of the semi-major axis (or orbital period). The mass ratio distribution of massive MS binaries (B-type), in the OB-association Sco OB2, is well-described by the power law (Shatsky & Tokovinin, 2002), similar to Kouwenhoven et al. (2007). The mass ratio distribution in the regime of these massive binaries in Sco OB2, is similar to our binary samples at the time before 1 Gyr. On the other hand, a flat distribution of the mass ratio (for ) has been observed in 59 Galactic globular clusters (see Milone et al., 2012).
Raghavan et al. (2010) carried out a systematic study for binary companions amongst 454 solar-type stars the Galactic neighbourhood. The mass ratio distribution of these field binaries peaks at (Raghavan et al., 2010), with companion star masses range in the range . D2-R7-IMF01 appears to be consistent with Raghavan et al. (2010). However, if the high-order binaries (i.e., triples or quadruples) are removed in Raghavan et al. (2010), the mass ratio distribution flattens.
3.2 Semi-major axis
The semi-major axis, , is another important parameter in binary evolution. We show the secular evolution of the semi-major axis distribution, , in Figure 4 (for D1-R7-IMF93) and Figure 5 (for D2-R7-IMF01). The initial semi-major axis distribution is log-normal, ranging from AU to AU for both simulations. Binary systems with large semi-major axis are easily disrupted, since they are vulnerable to close encounters with neighbouring stars. Therefore, values of semi-major axis are limited to AU at the start of the simulation. Generally, the evolution pattern of the in primordial binaries is similar for both simulations, that the relative frequency of small- increases with time.
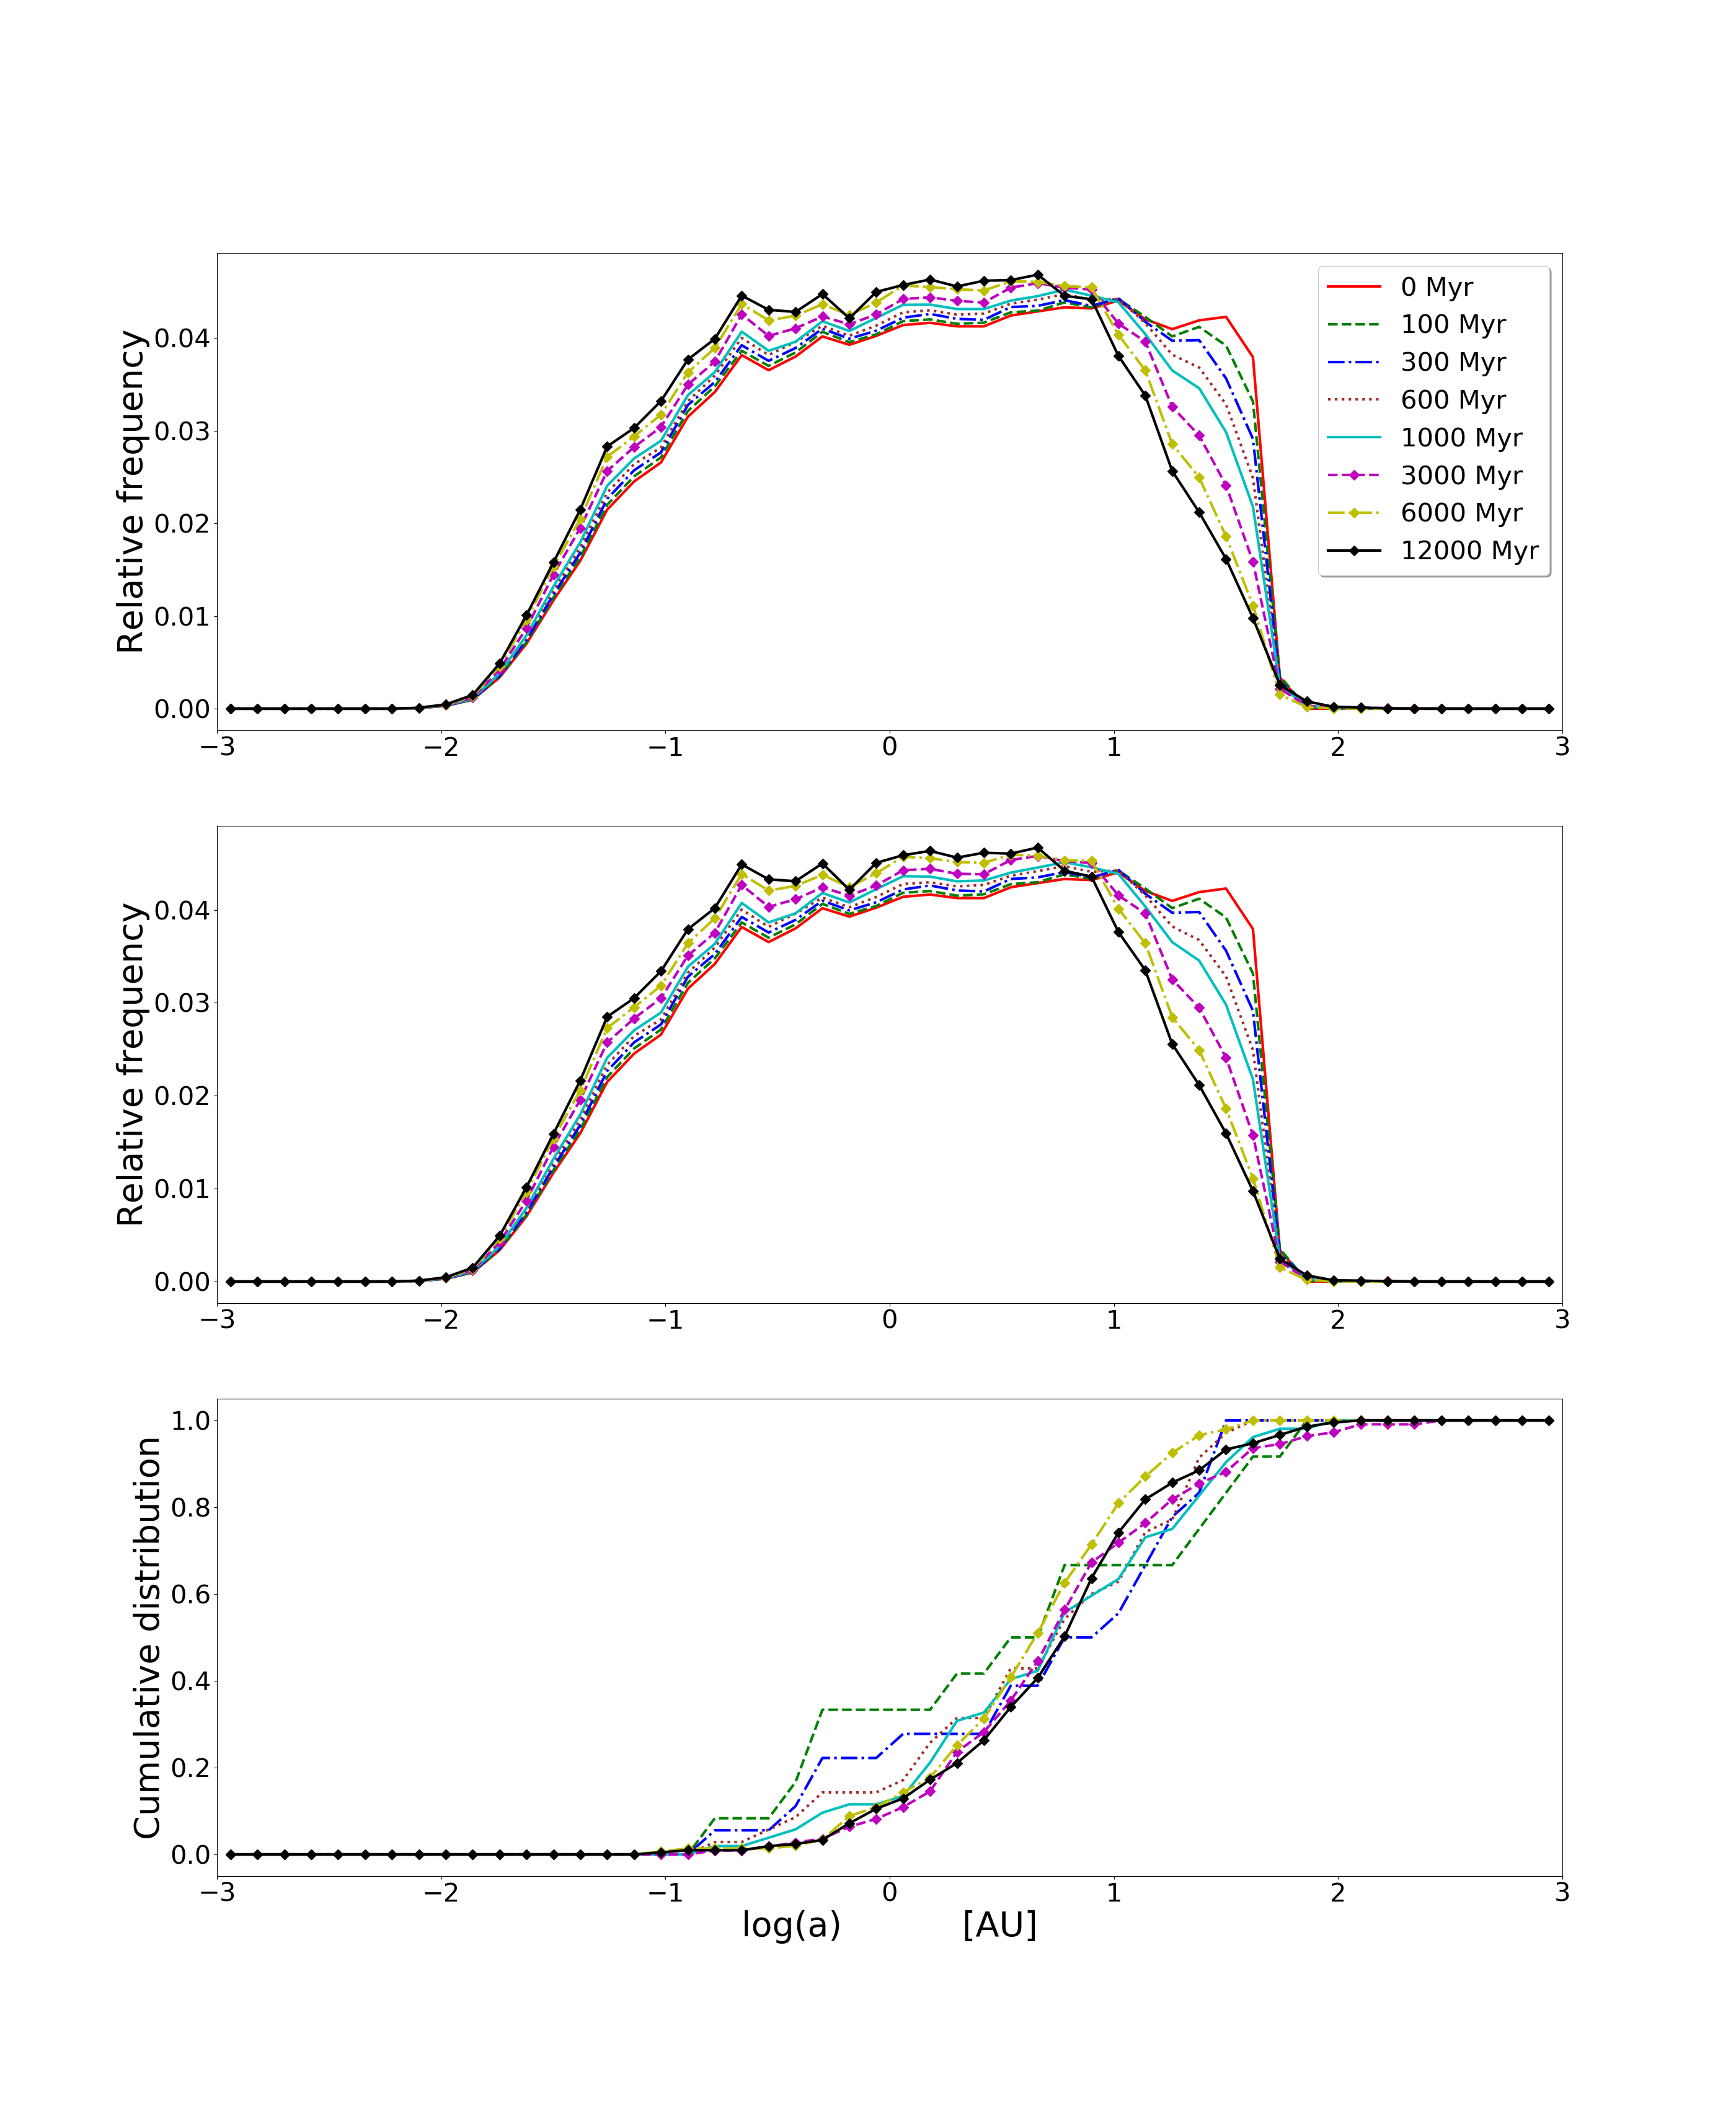
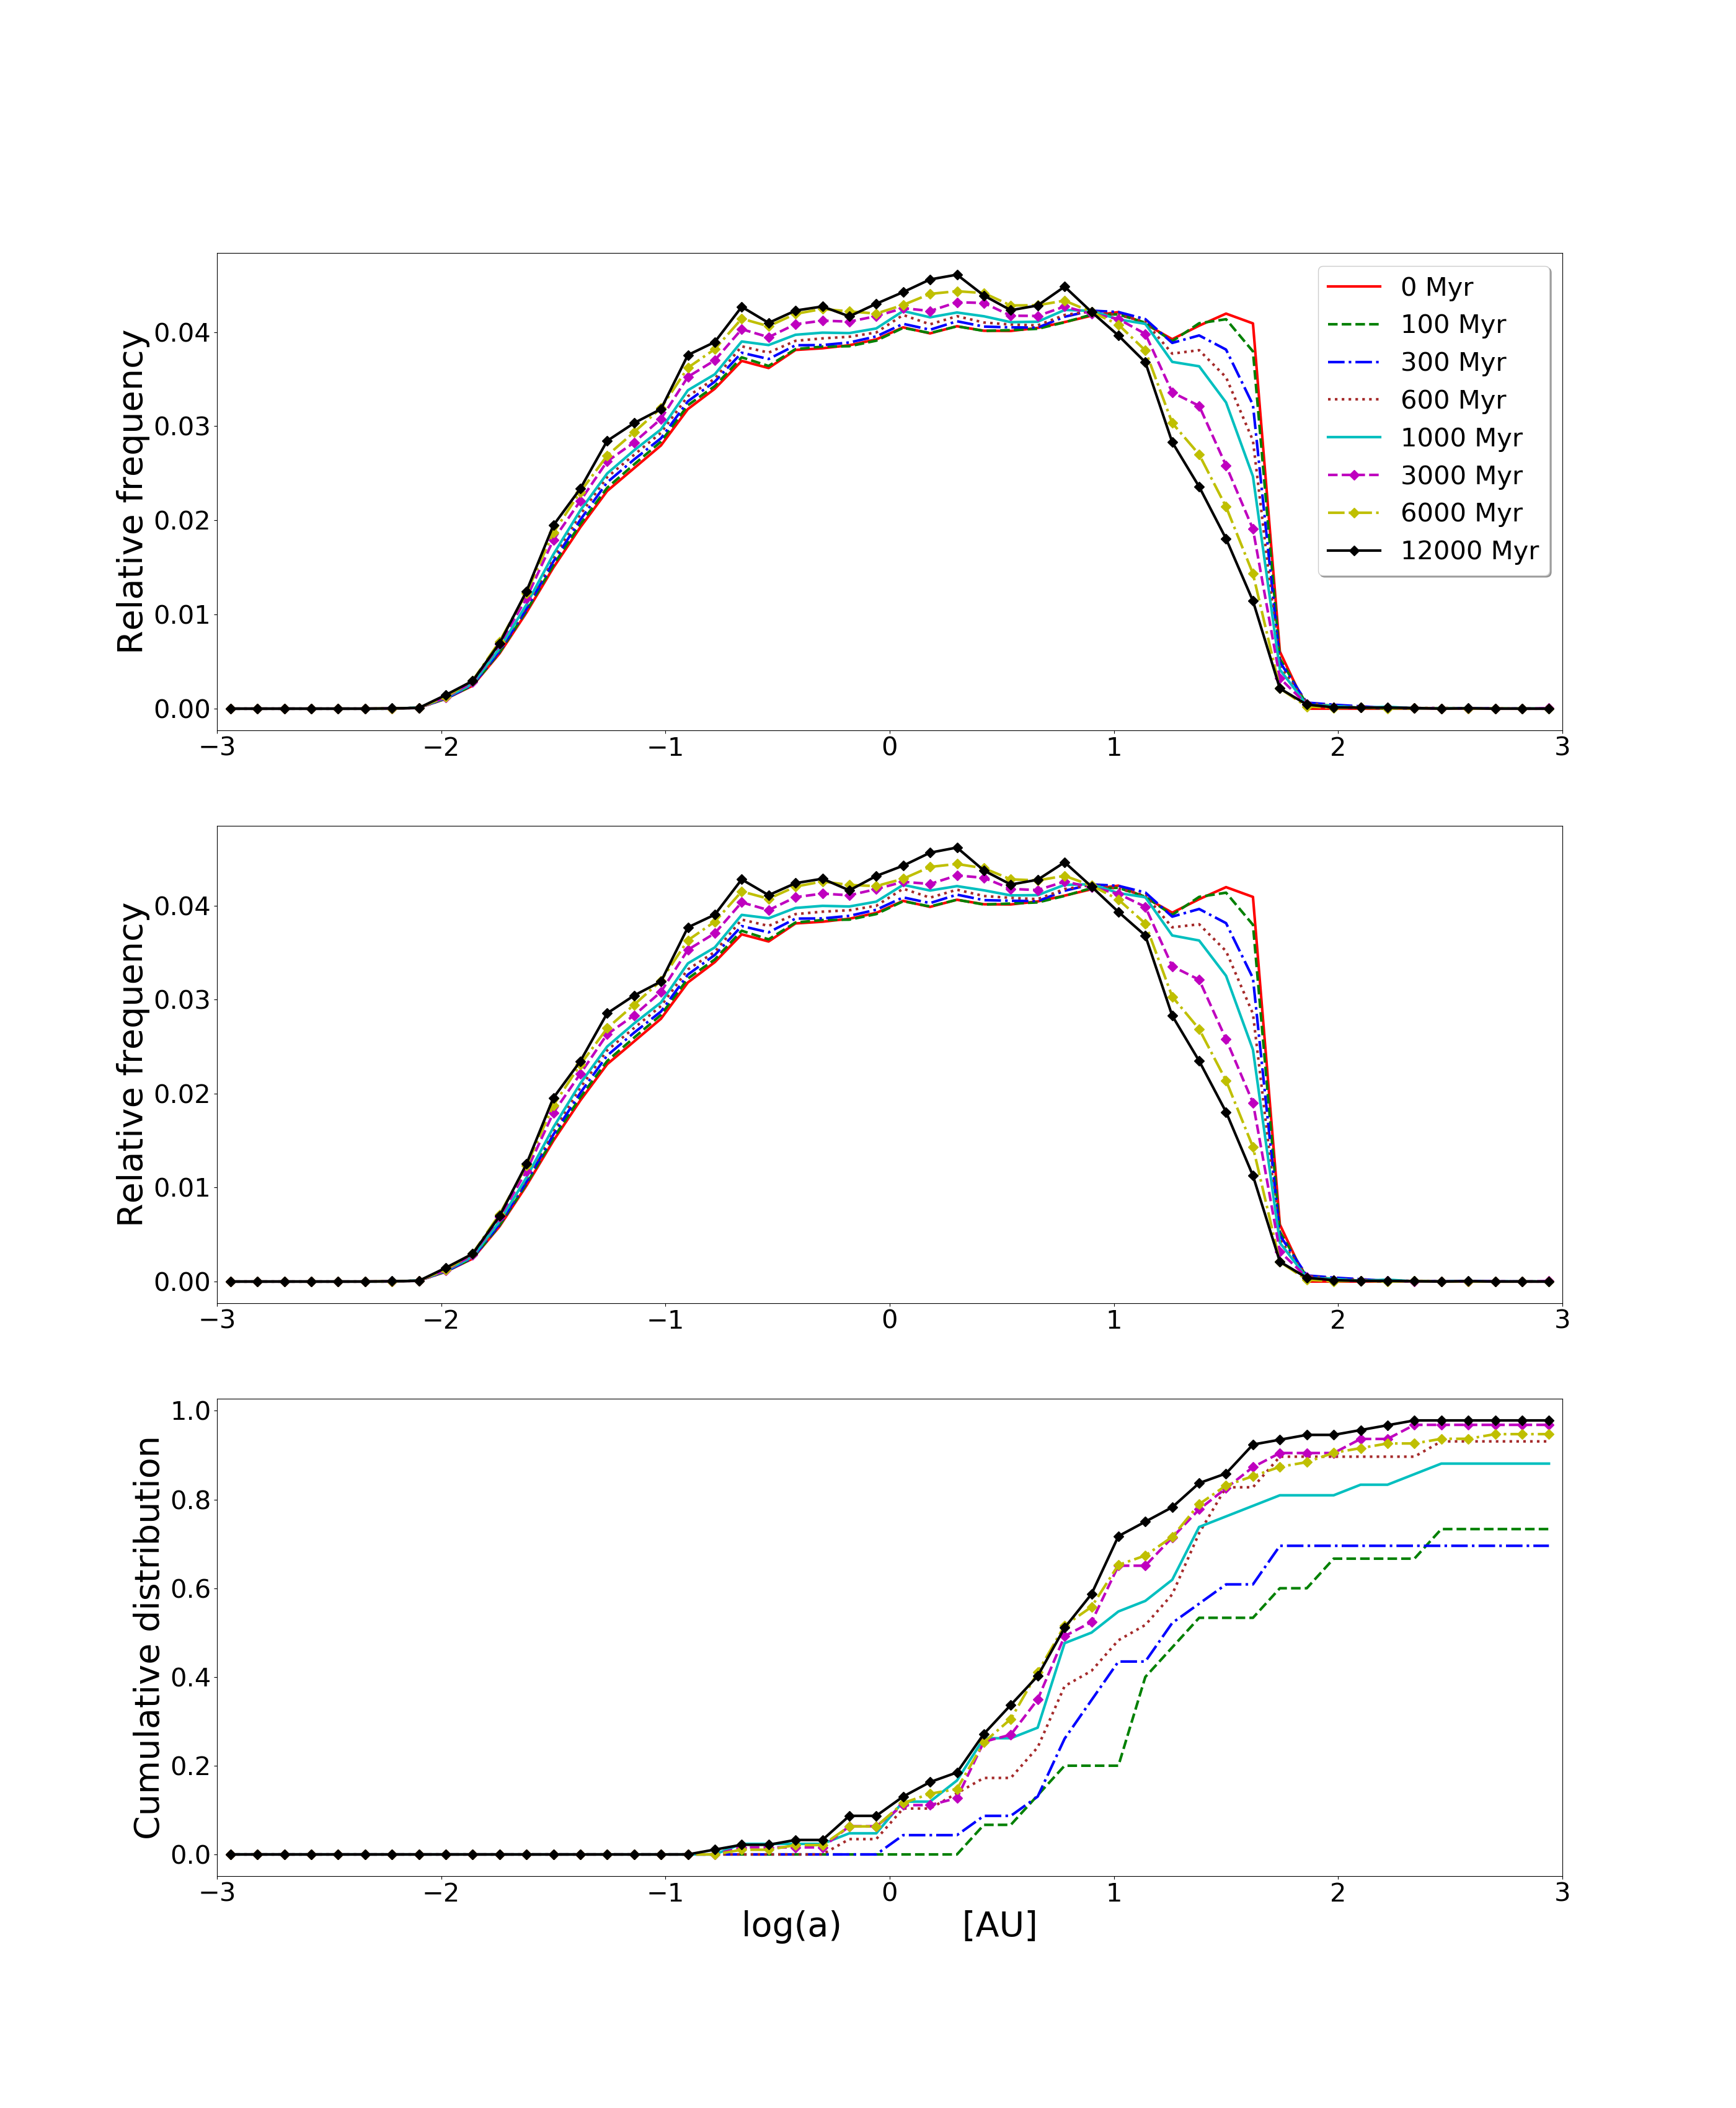
The case is different in dynamical binaries. In the D1-R7-IMF93 before 1 Gyr, a high fraction of dynamical binaries (Figure 4) have AU. The fraction of dynamical binaries with AU drops from 0.4 at Myr to to 0.1 at Gyr. On the contrary, in D2-R7-IMF01, the fraction of dynamical binaries with semi-major axes AU increases with time. As compared to the MS field binaries in Raghavan et al. (2010), the semi-major axis ranges AU, and peaks at AU, the D1-R7-IMF93 and D2-R7-IMF01 produced much larger number of close binaries with AU, as wide binaries are less likely to survive in a star cluster environment.
3.3 Eccentricity
Although the evolution of the semi-major axis is closely linked to that of the eccentricity , the secular evolution of eccentricity is not as apparent as that of the semi-major axis and the mass ratio. We show the secular evolution of the eccentricity distribution, , in Figure 6 (for D1-R7-IMF93) and Figure 7 (for D2-R7-IMF01). Both simulations D1-R7-IMF93 and D2-R7-IMF01 initially adopted a thermal eccentricity distribution, . To avoid immediate collisions between the two components of binary systems at the start of the simulations, binary systems with very small periastron distances are not included in the DRAGON simulations. This is the reason why there is a depression at . Through dynamical encounters, dynamical binaries reach an energy equipartition state, which leads to a thermal eccentricity distribution for dynamical binaries, similar to the earlier discovery of Jeans (1919).
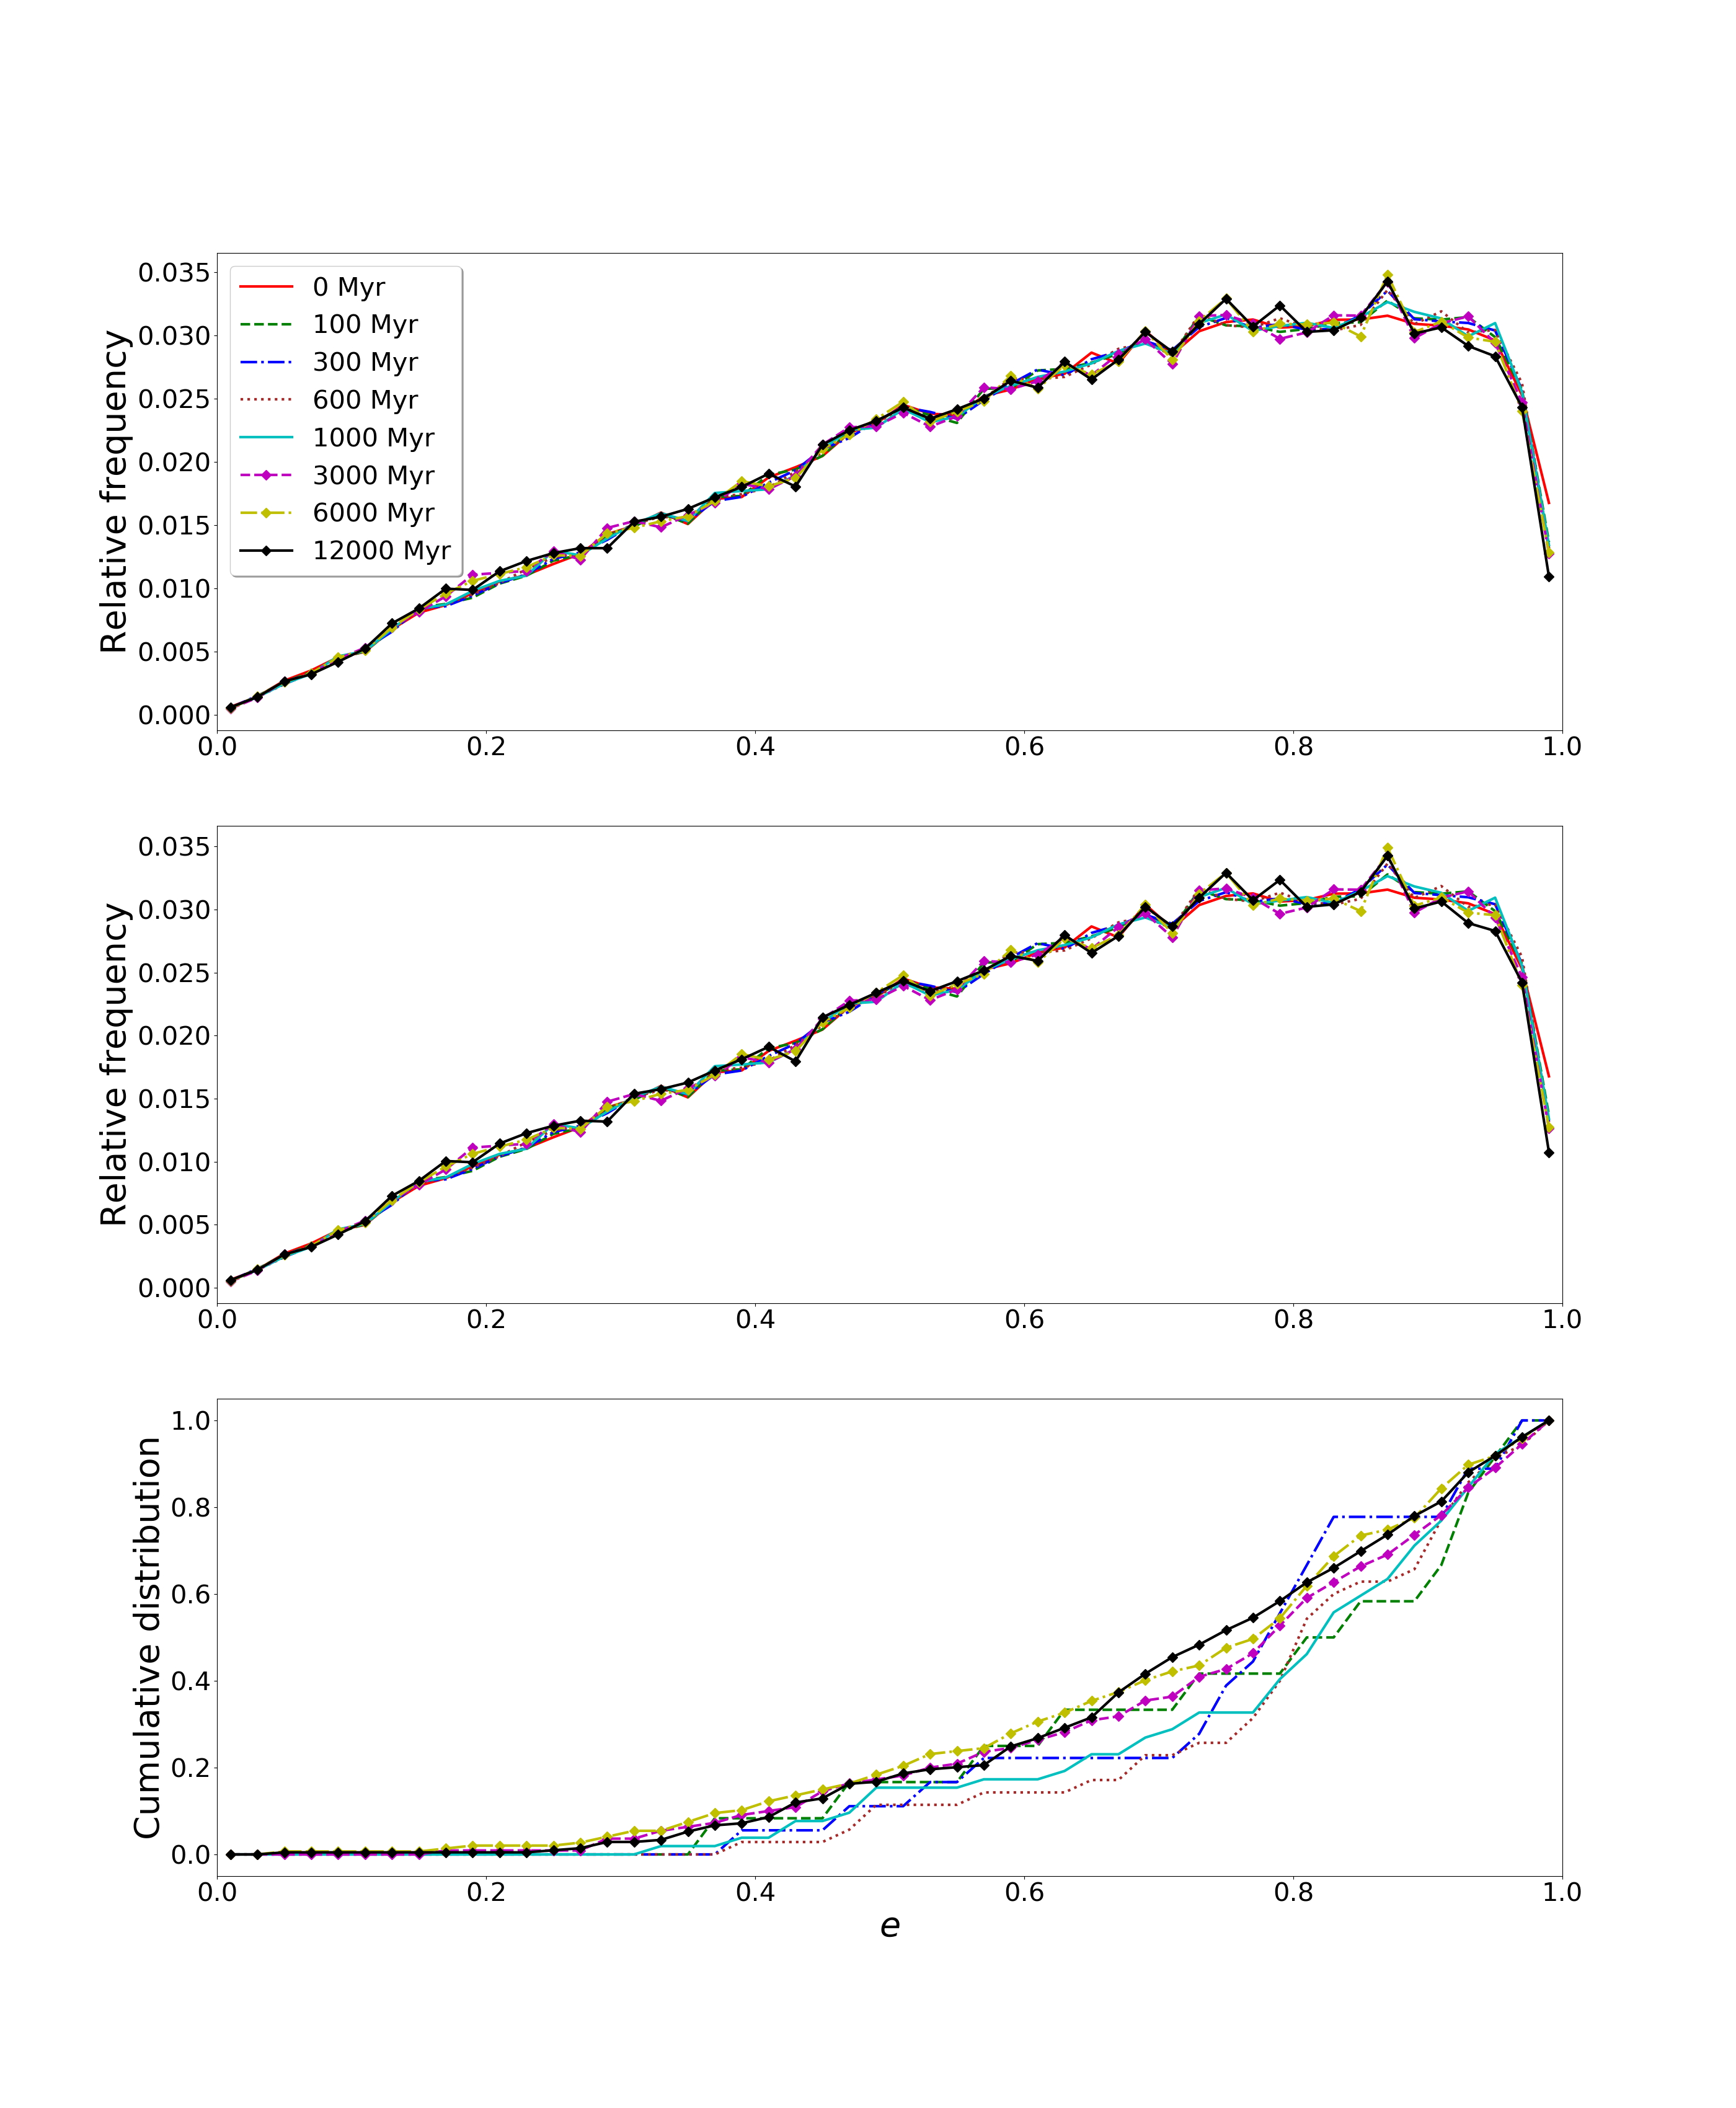
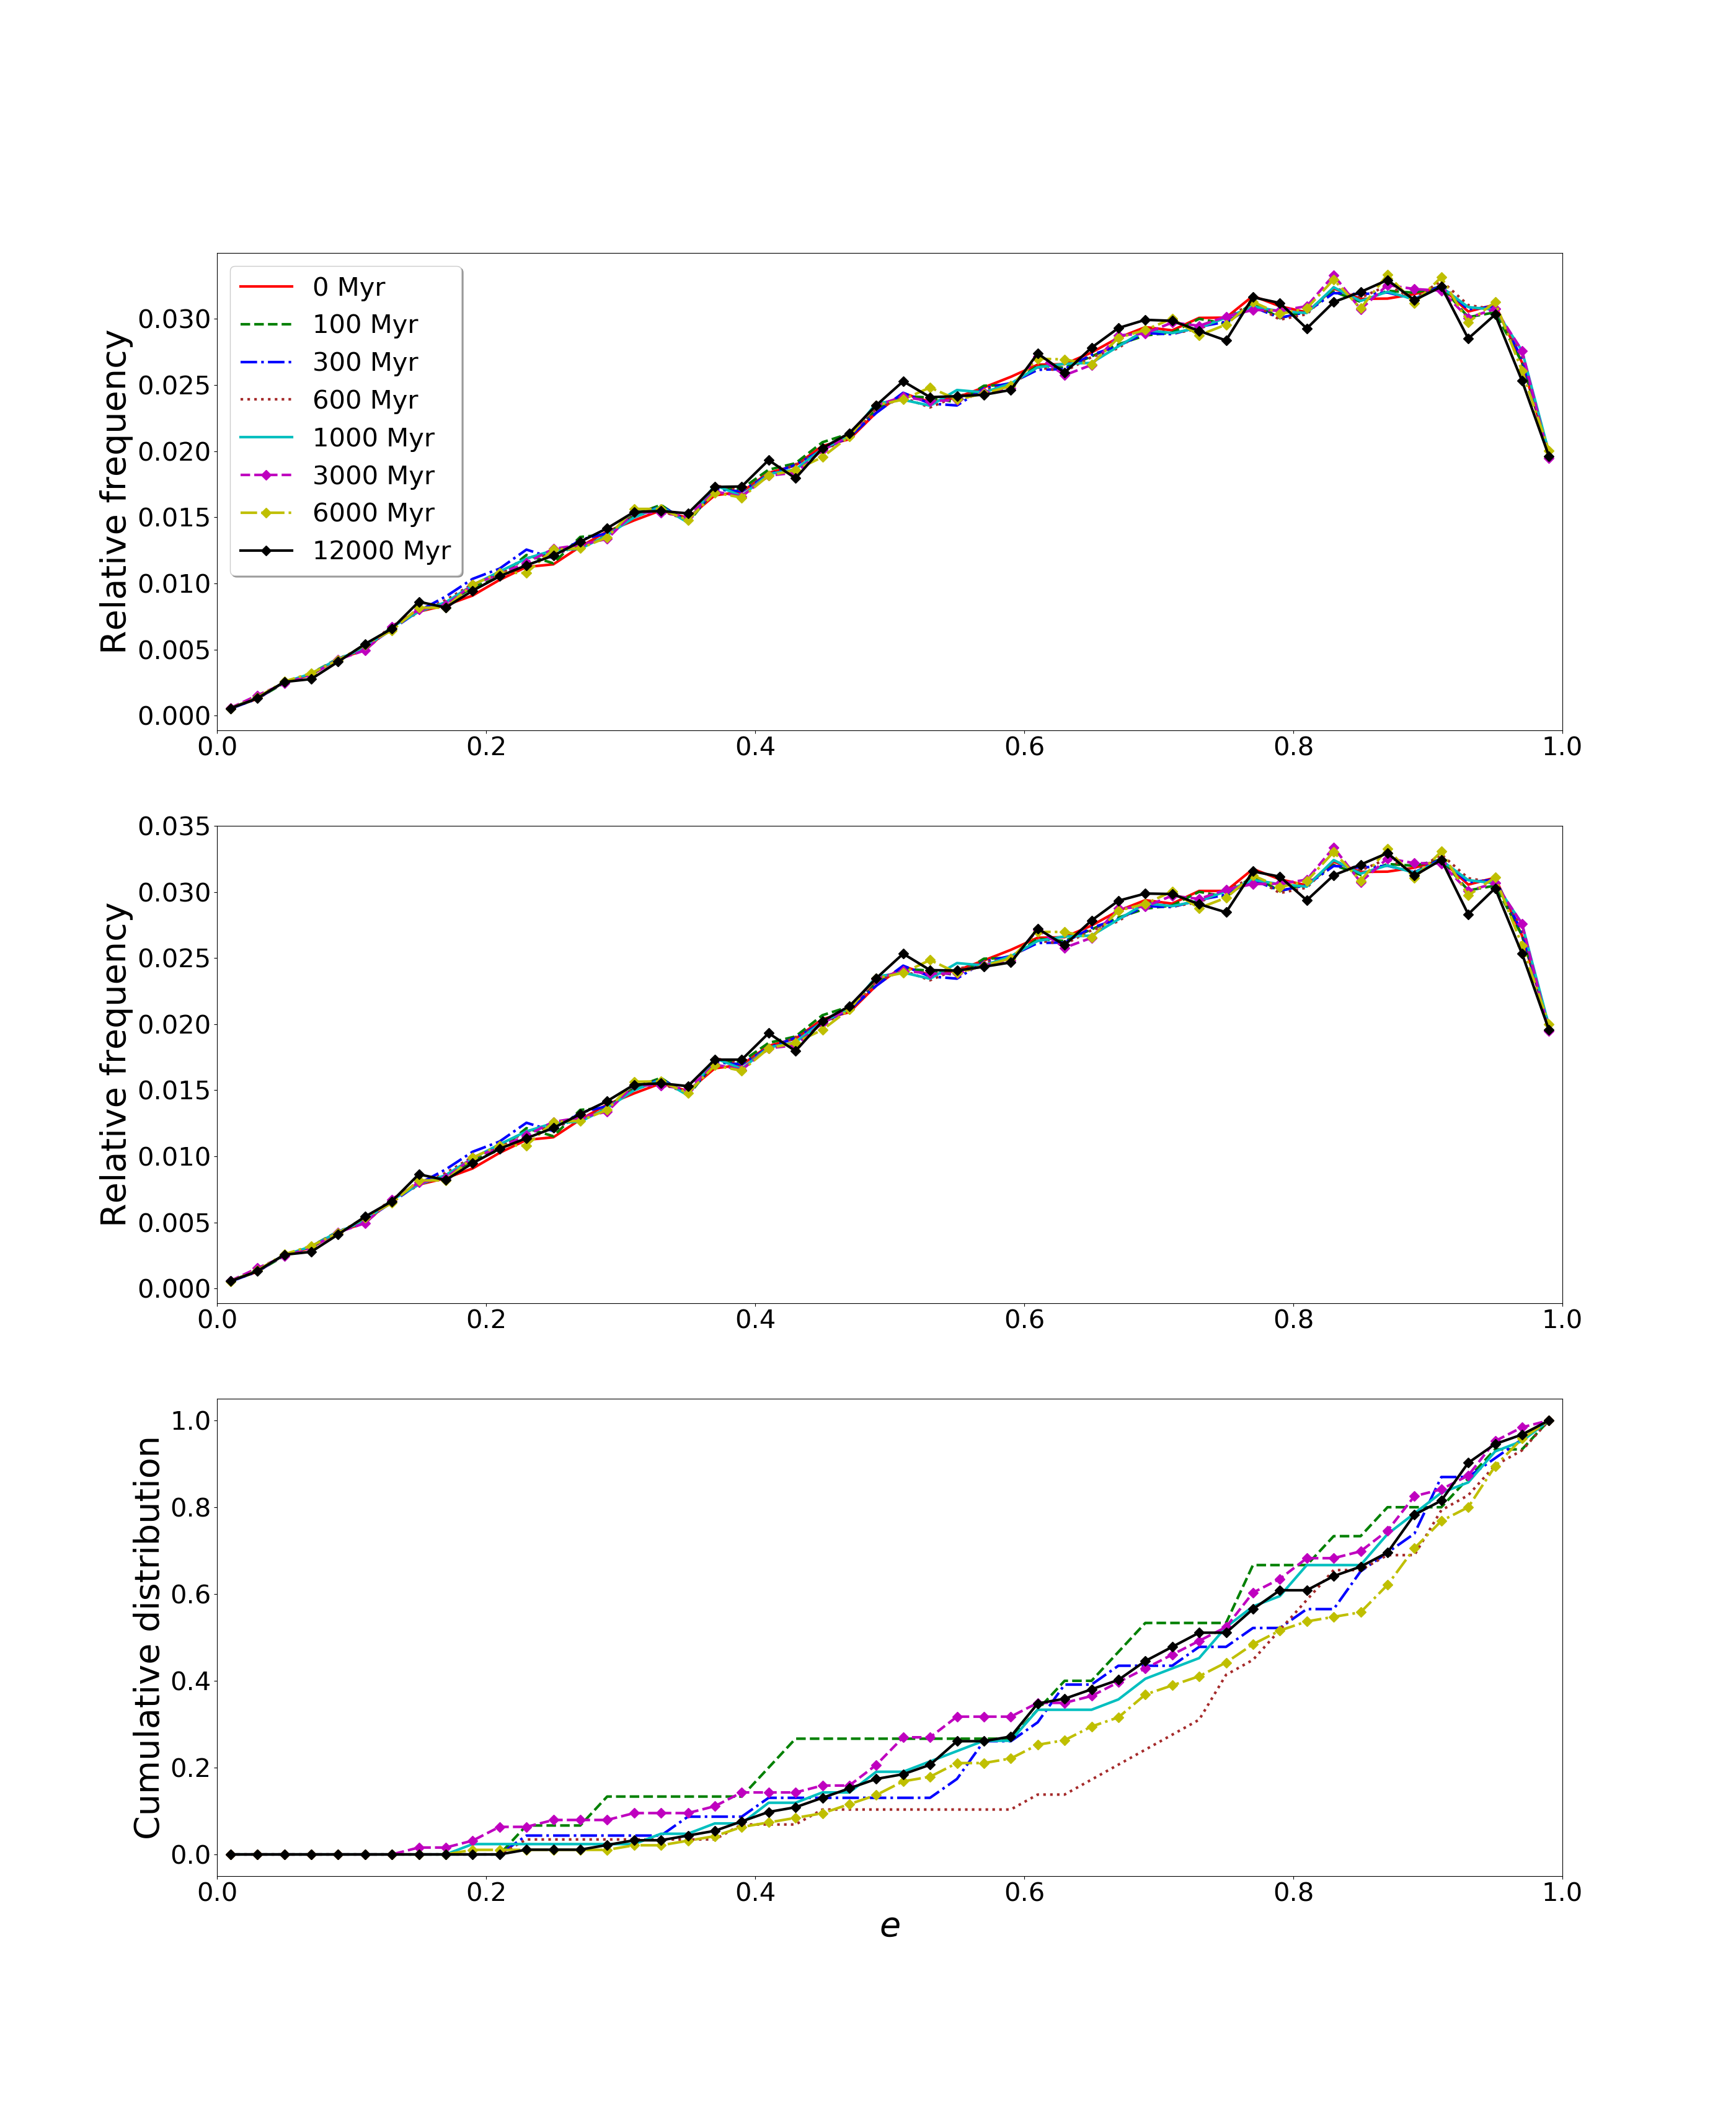
Our models predict that the mean eccentricity at Gyr is and for models D1-R7-IMF93 and D2-R7-IMF01, respectively. Milone et al. (2016) find a mean eccentricity of binaries within the half-mass radius (excluding the core region) of Galactic globular clusters is (Milone et al., 2016), assuming a binary fraction of 33%. The discrepancy between the two may be explained by the choice for the initial conditions of D1-R7-IMF93 and D2-R7-IMF01, notably the initial thermal eccentricity distribution, and the initial binary fraction of 5%. However, it should be noted that in Milone et al. (2016) only one of the binary systems is a MS-MS binary, and therefore a direct comparison has to be carried out with caution.
3.4 Correlations between binary parameters
In this section, we search for the correlations between the parameters of MS binaries at 12 Gyr. We analyse the evolution of the mass ratio distributions (), semi-major axis (), eccentricity (), period (), primary mass, secondary mass, and cluster-centric distances () of binaries in the star clusters under consideration.
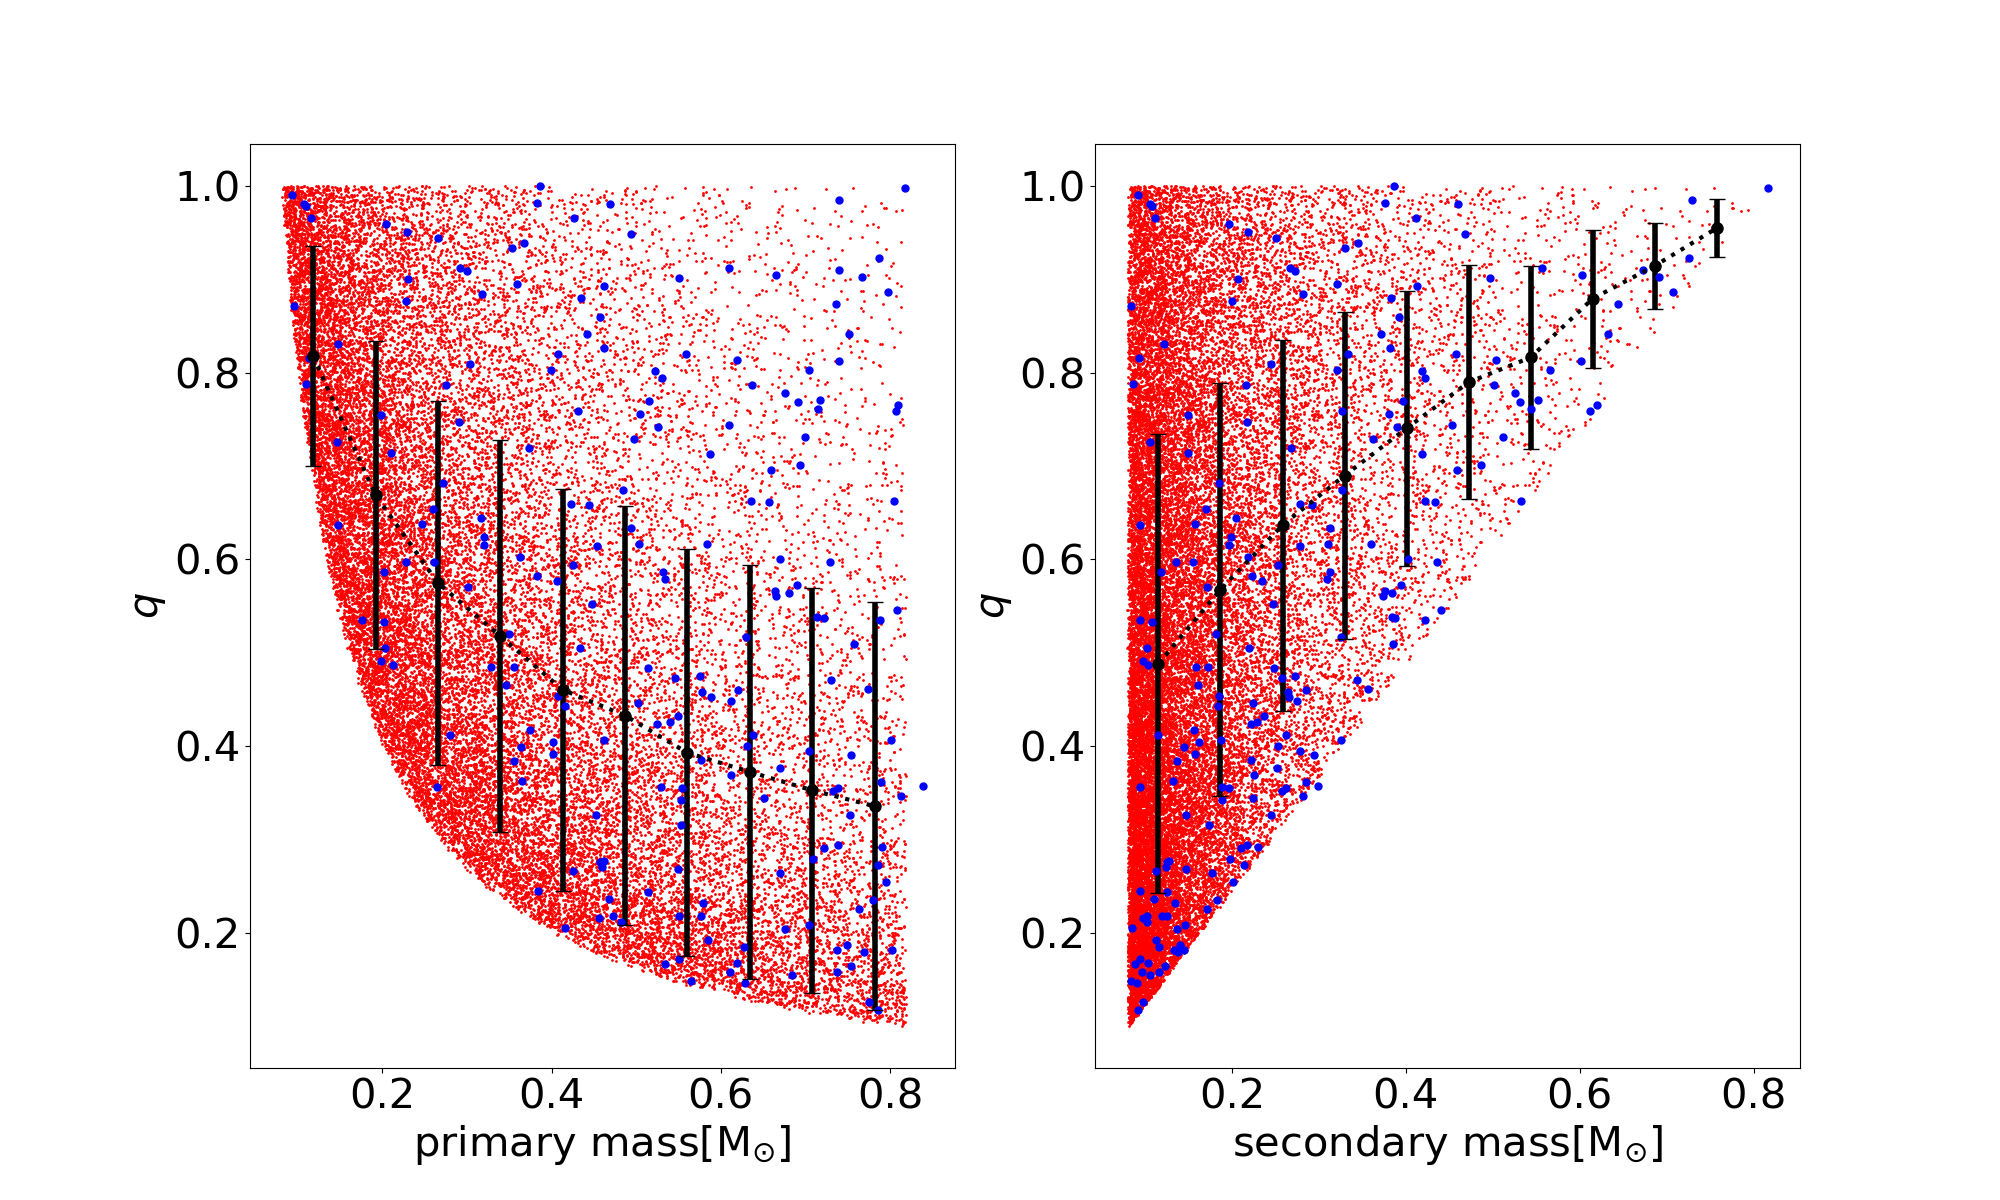
We carry out this analysis for both models D1-R7-IMF93 and D2-R7-IMF01, and we consider both primordial binary systems and dynamical binaries. One of the major differences between D1-R7-IMF93 and D2-R7-IMF01 is the initial binary mass ratio , which generates a statistically different distributions, like shown in Figure 1 and Figure 2. We display and primary/secondary mass in Figure 8. Red dots are primordial binaries, while blue dots are dynamical binaries. There is an asymptotic boundary for the distribution of and the primary mass, which is due to the lower limit of secondary mass 0.08, equal to the IMF lower boundary, as is the ratio between the secondary and primary mass. The comparison between and the secondary mass shows a nearly straight curve with a slope of 1.25 as lower boundary, which is also the maximum possible mass of the primary star. At the end of the simulation, at 12 Gyr, all massive star evolve over the MS. The highest mass of MS stars reaches 0.8.
The number of dynamical binaries (blue dots) is statistically too small. The trend of total binaries (black dots) is dominated by primordial binaries (red dots). The mean mass ratio declines with increasing primary mass (black dotted curves), and as the secondary mass decrease.
Comparing black curves in D2-R7-IMF01 and D1-R7-IMF93, the D2-R7-IMF01 has larger average value, because of the different initial mass ratio distribution (see Section 2.1). The latter generated relatively more high- binaries, and thus larger average value.
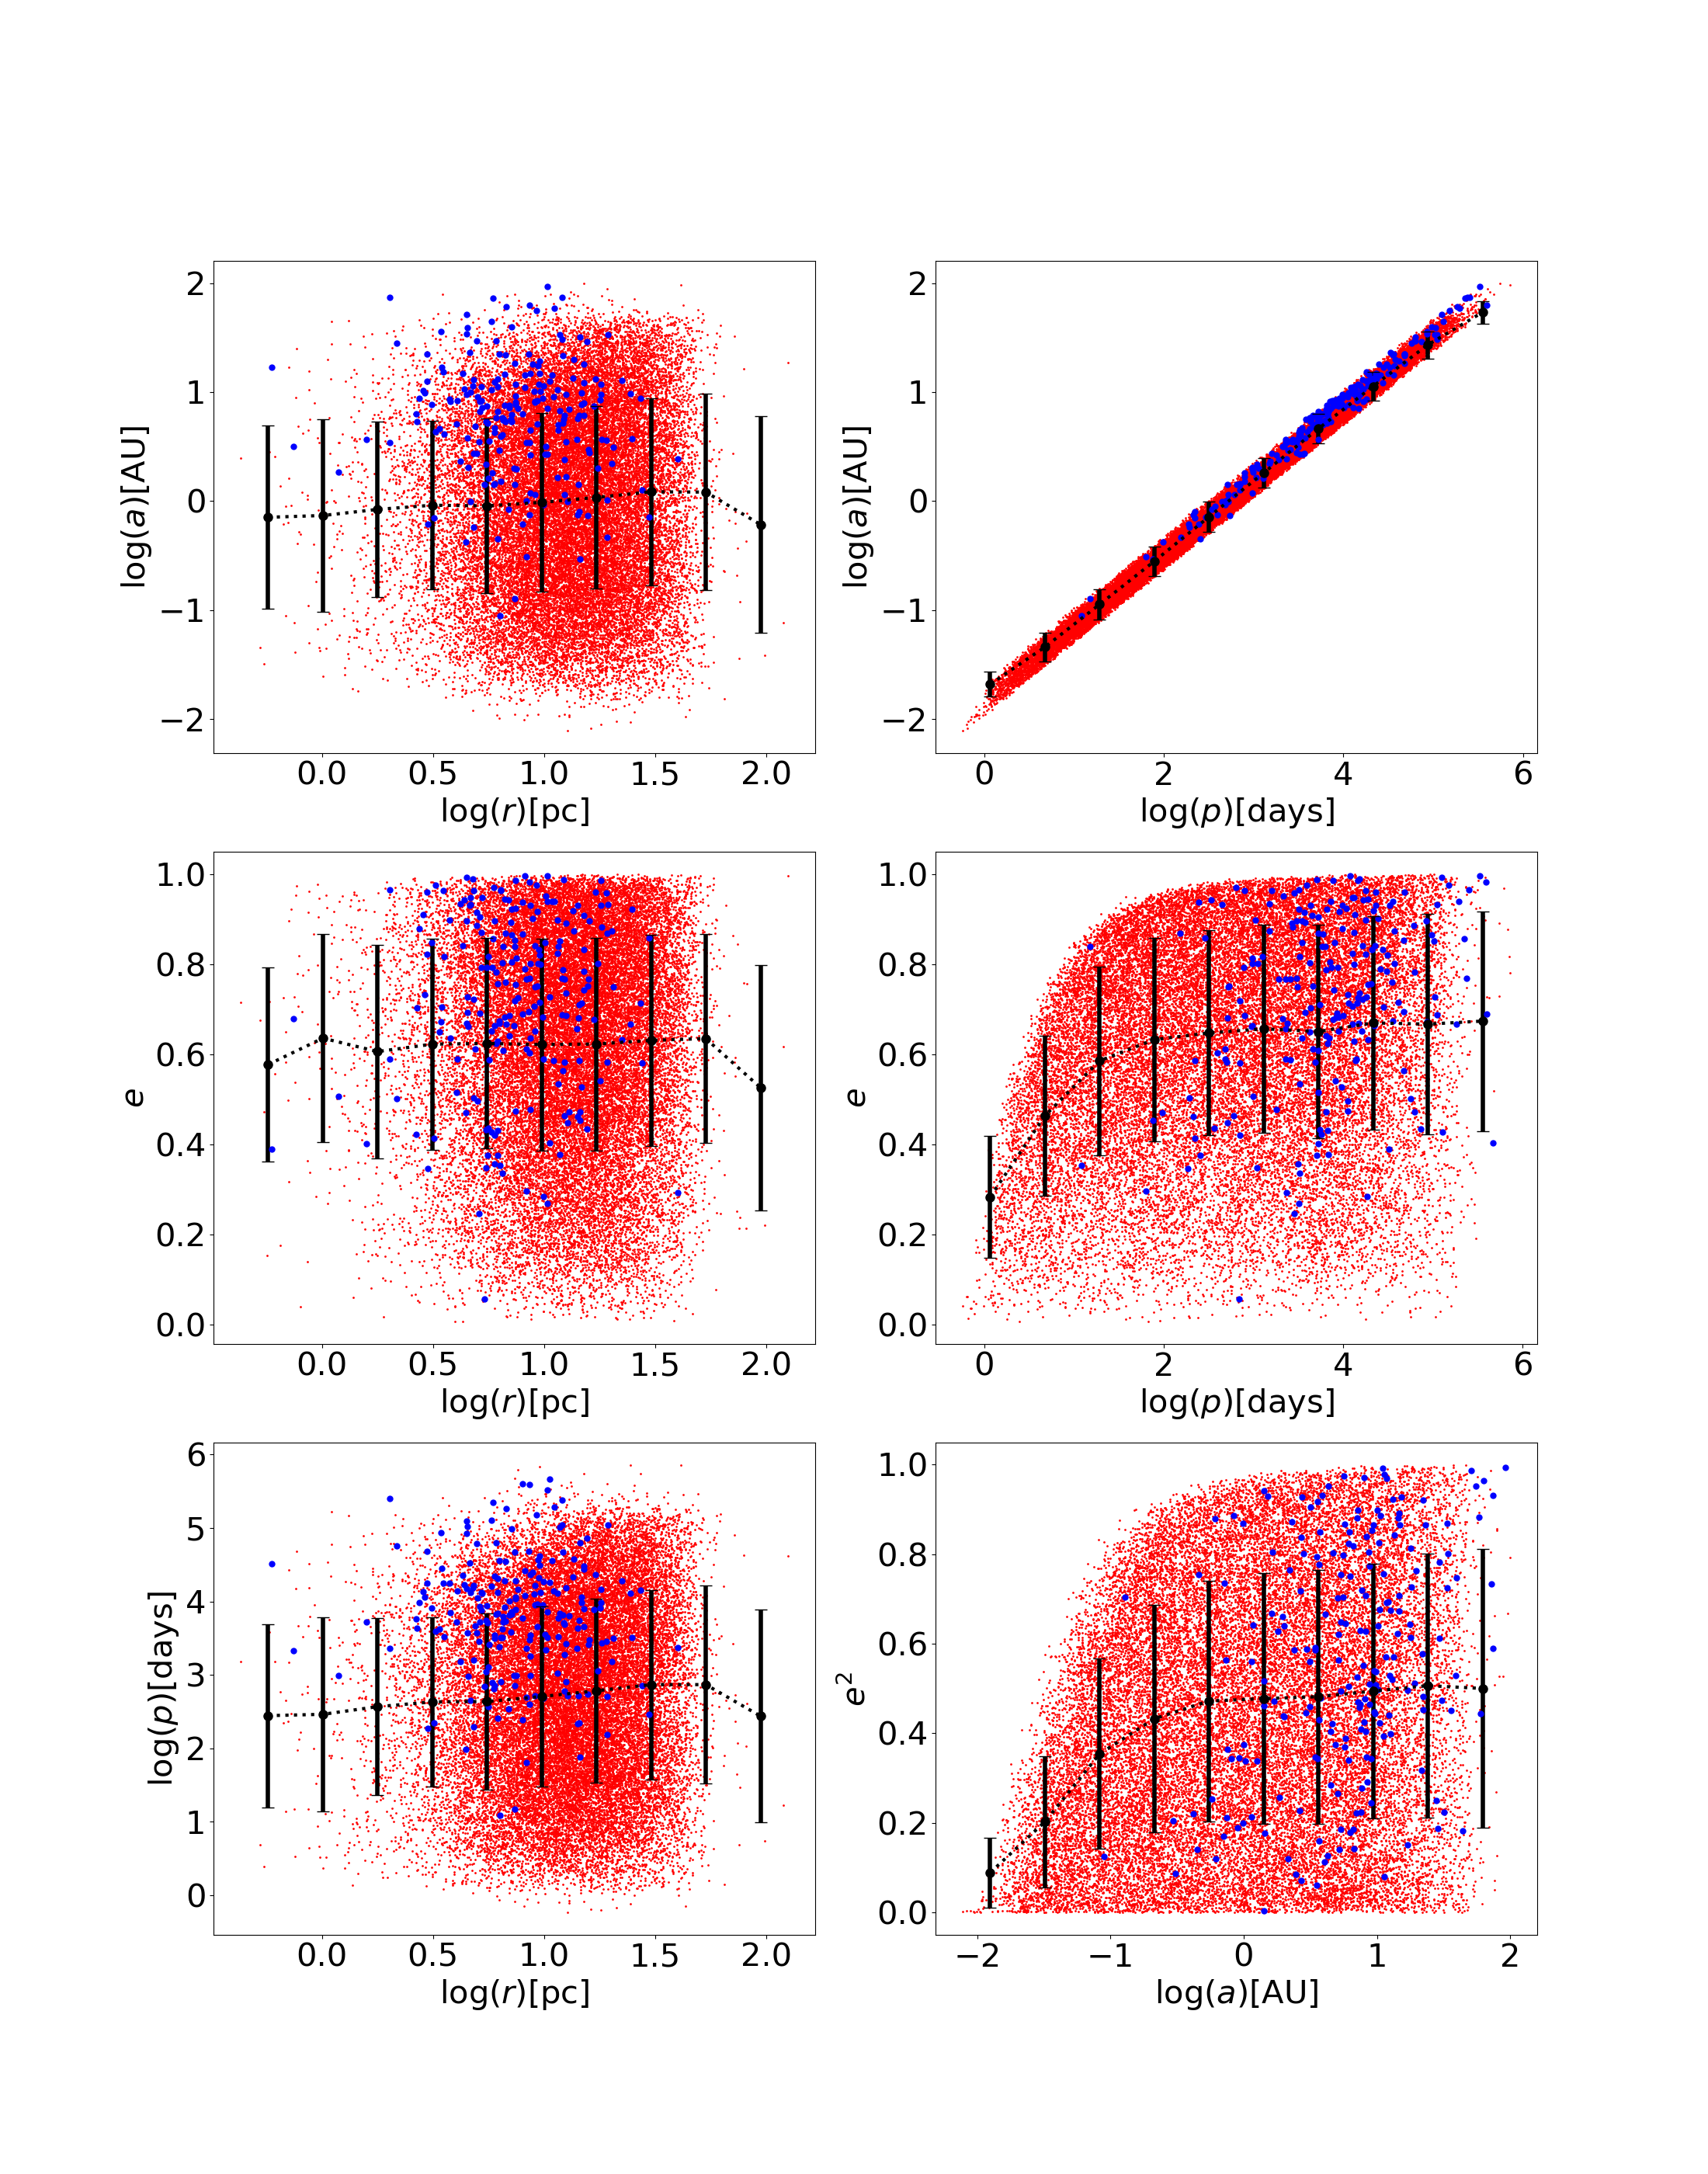
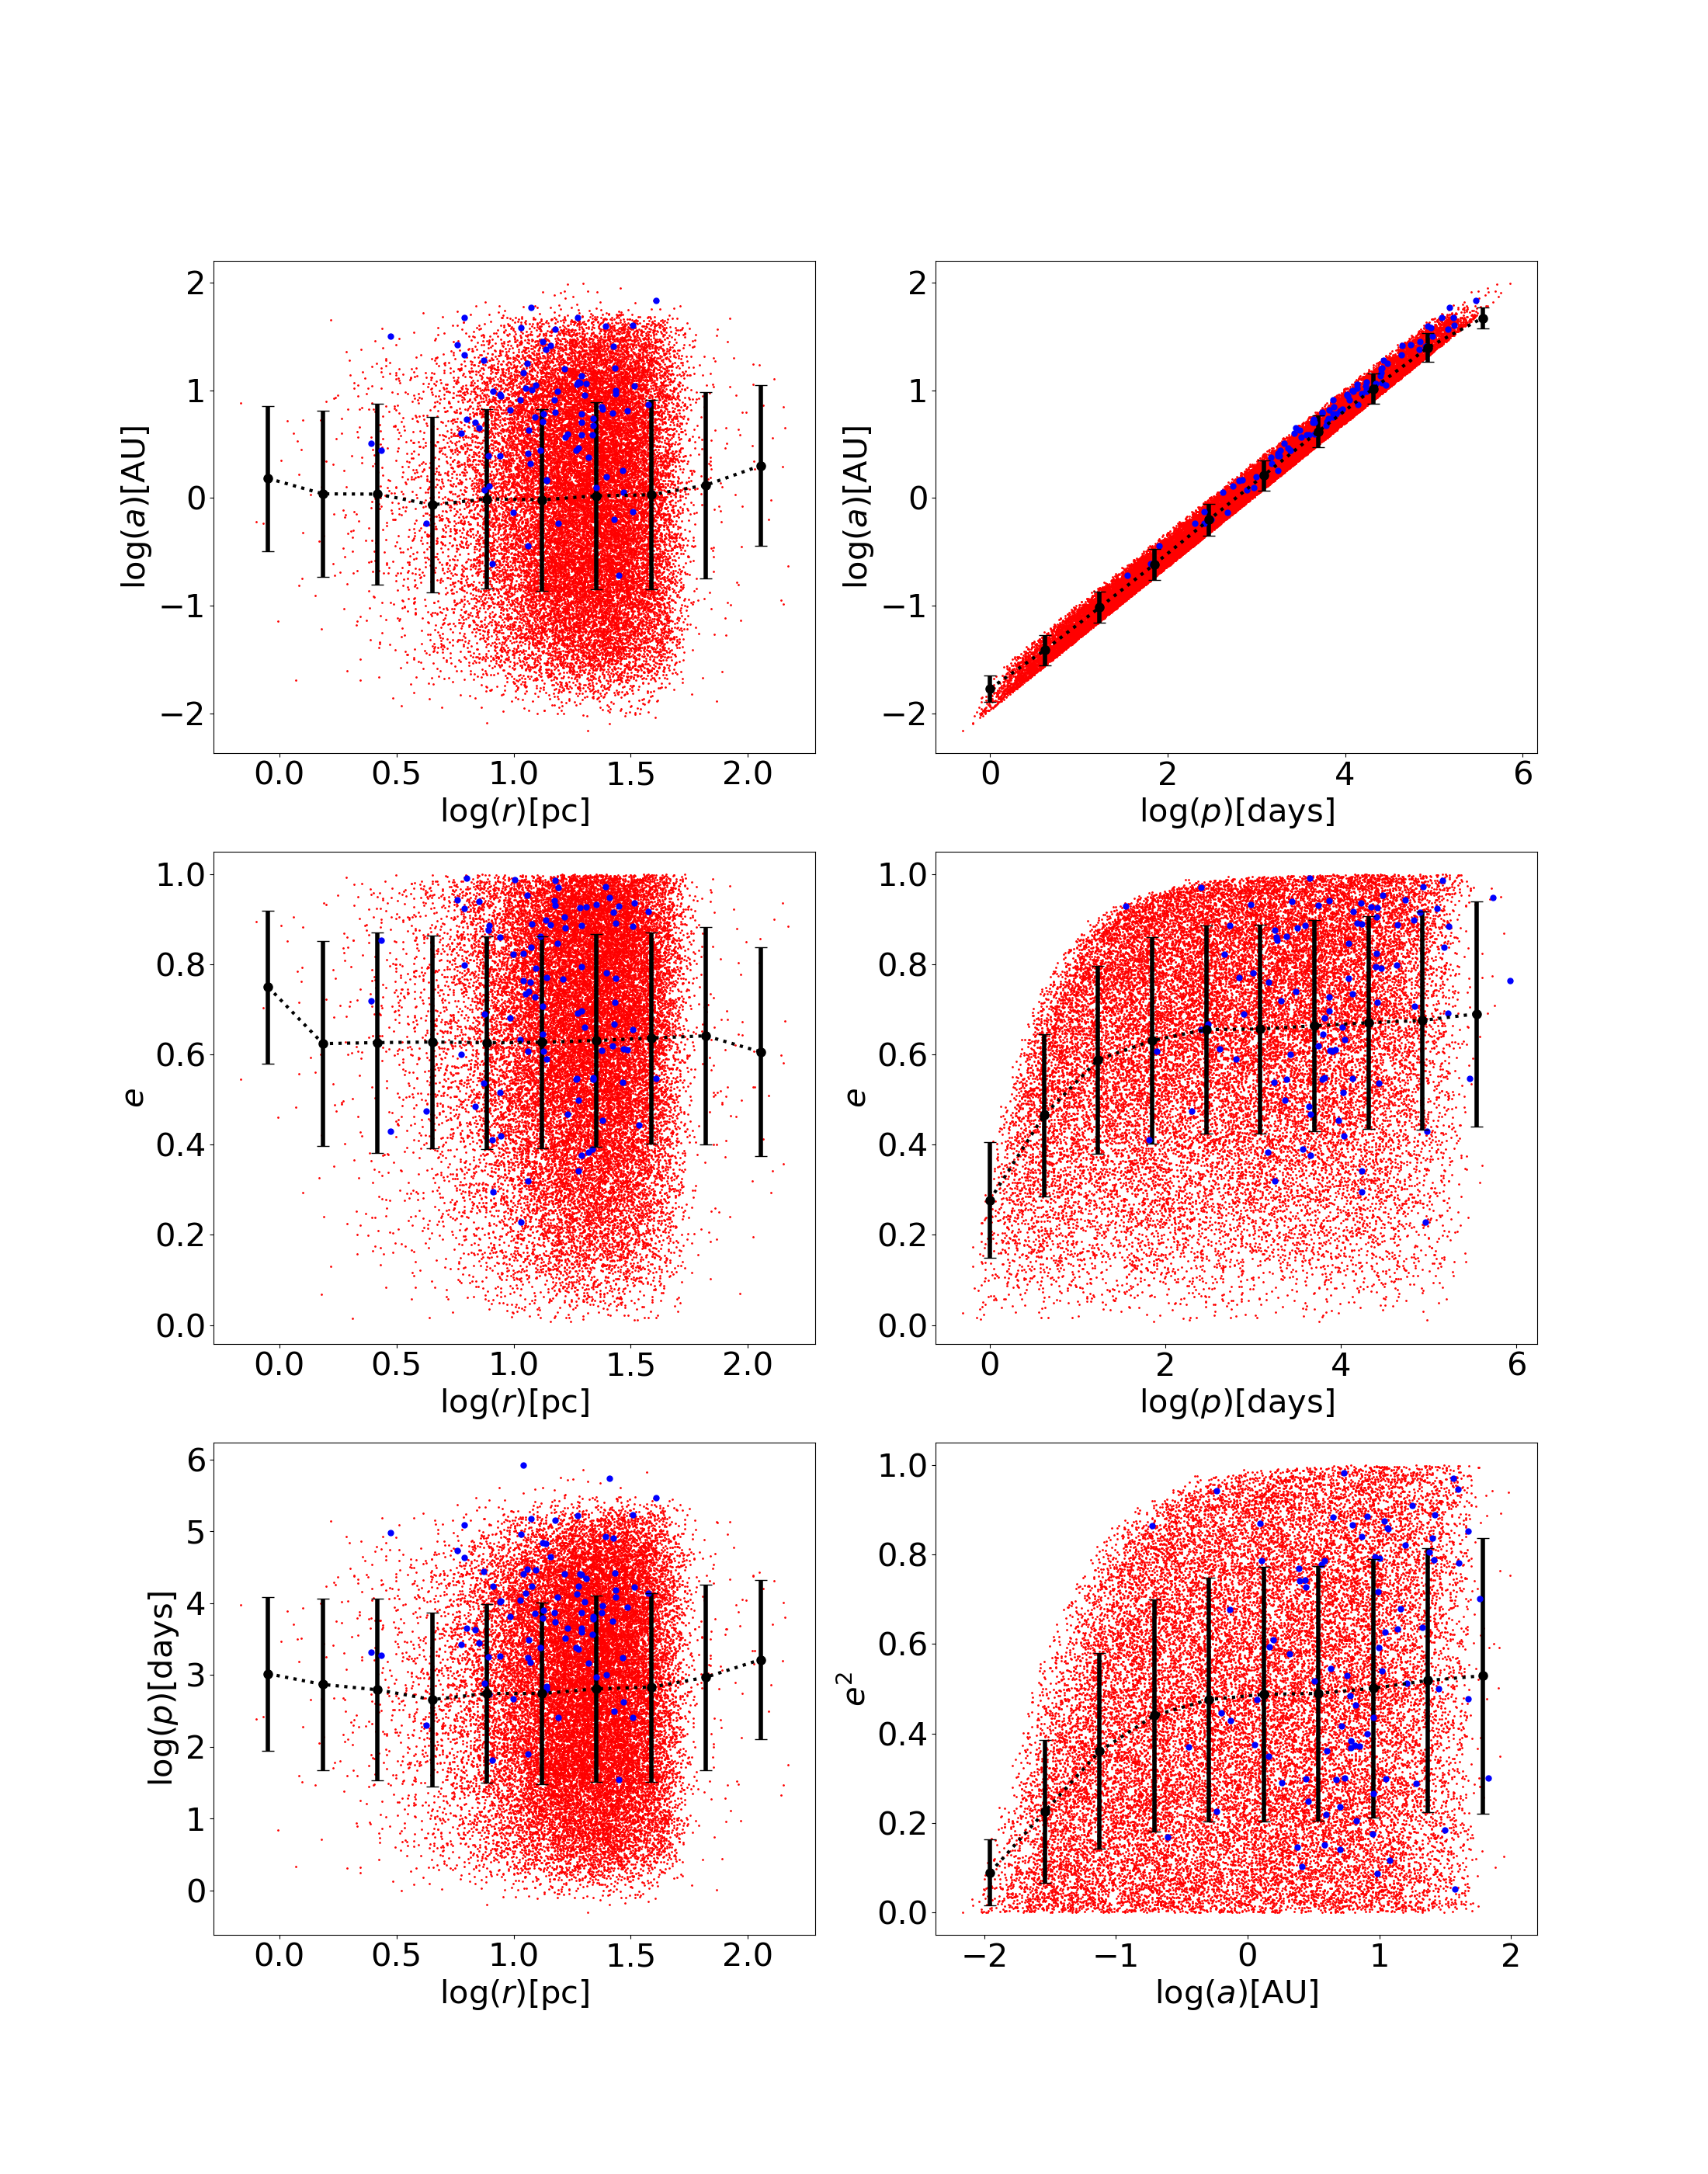
Figures 9 and 10 show another set of correlations between parameters in D1-R7-IMF93 and D2-R7-IMF01 at 12 Gyr. Despite the different mass ratio distribution of binaries on the initial conditions, the MS binary parameters correlations in these two simulations show very similar behaviours. We find no statistical difference of these six correlations in two simulations. The evolution of these parameters are not influenced by mass ratio. Although the considered binary are only MS stars, they form the vast majority of the binary population at all times. Therefore, the behaviour of the general binary population is well described with the MS binaries.
Generally, binaries located in the outskirts of the star clusters typically have larger semi-major axis (upper left panels in Figure 9 and 10), and longer orbital periods (bottom left panels) than their counterparts in the inner part. The linear relation between the semi-major axis and the period is simply a consequence of Kepler’s third law. The dynamical binaries (blue dots) preferentially have larger semi-major axis, longer period and more eccentric orbits than the average primordial binaries. The encounter probability in the inner region of the star cluster is far larger than that in the outer region, therefore the dynamical binaries form easier in the inner region. The blue dots in the left panels shows that the dynamical binaries are more, statistically, located in the inner regions than primordial binaries. The eccentricity of the system (middle left panels) does not depend on the position of the binary system in the star cluster. The values of eccentricity are related to the strength of encounters, which does not depend on the position either (e.g. Spurzem et al., 2009; Flammini et al., 2019).
Binary stars with small semi-major axis or short orbital periods do not have large eccentricities (middle right panels), because two very close stars are more likely to have mass transfer through the Roche-lobe overflow (Eggleton, 1983), and circularize and/or merge shortly after. Due to initial thermal eccentricity distribution, the mean eccentricity is , and the distribution in is flat. The uniform number density in the distribution of versus semi-major axis indicates a tendency towards energy equipartition among MS binaries.
4 Dynamical signature vs. photometry of binaries in the star cluster
4.1 Radial evolution of binaries
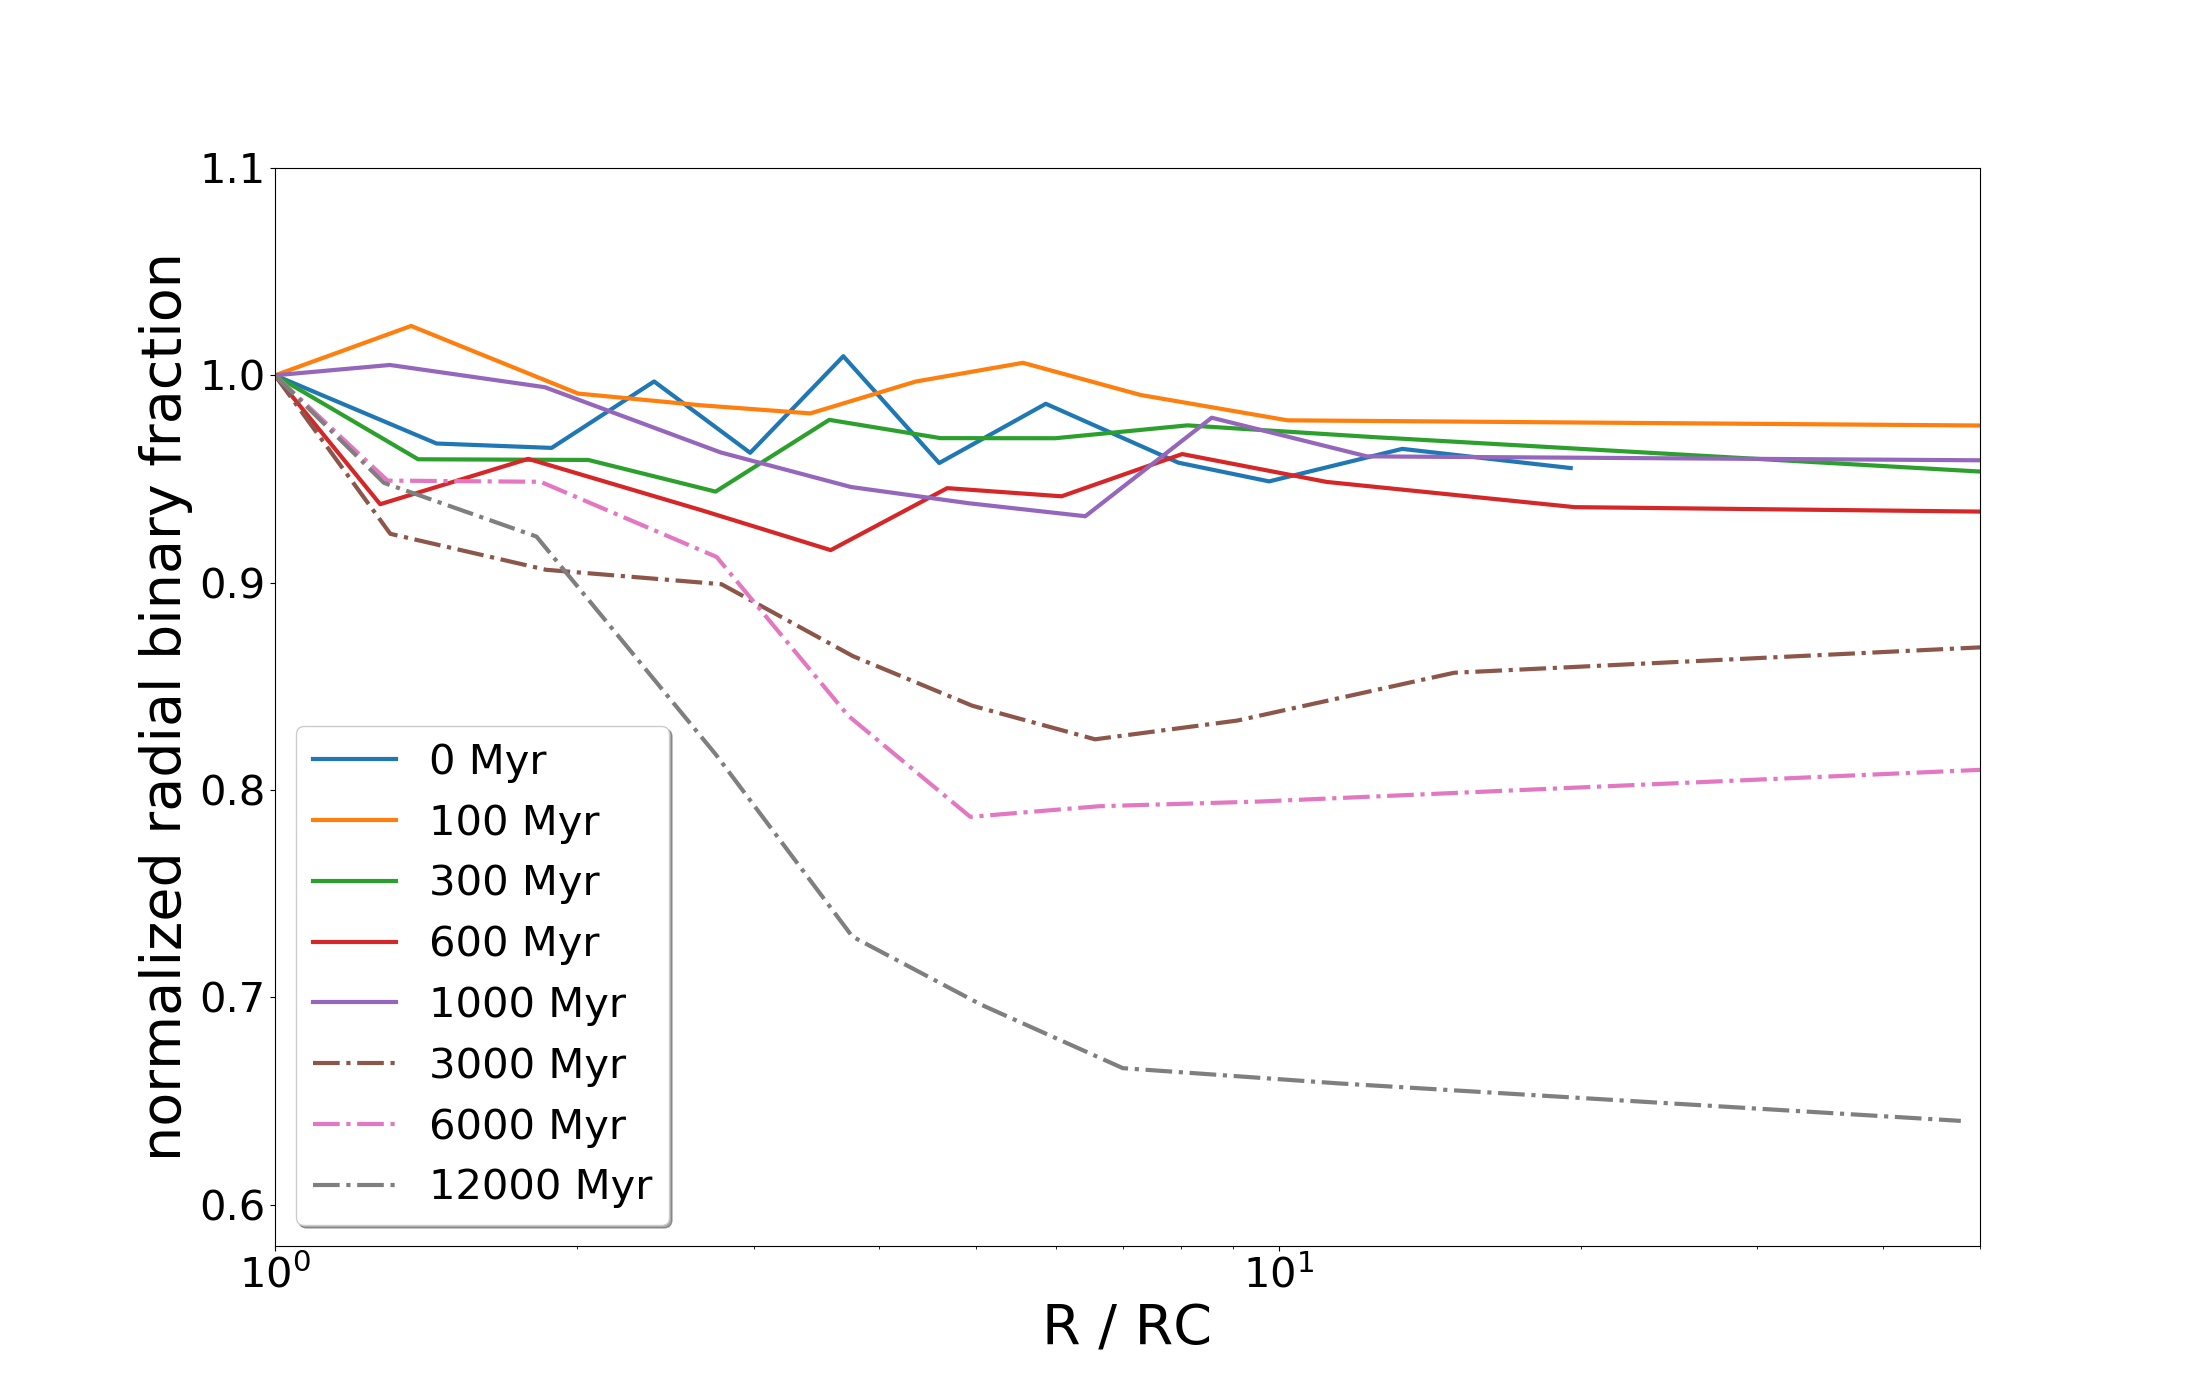
As a consequence of the dependence of dynamical processes on the local stellar density, the binary fraction in the star cluster core tends to evolve different from that in the outskirts. We show the radial binary fraction, normalized to the value within the core binary fraction, in the upper panels of Figures 11 and 12. For both models D1-R7-IMF93 and D2-R7-IMF01, before 1 Gyr, the binary fraction is larger within the core radius, and slightly drops outside the core. Only in D1-R7-IMF93, a significant drop of binary fraction outside the core occurs after 1 Gyr. The radial decreasing trend becomes more and more steeper with time. In model D2-R7-IMF01, the binary fraction drops outside the core radius, and more profoundly at 1 Gyr. Binary evolution is often closely linked to the long-term dynamical evolution of star clusters. The radial binary distribution can therefore be used as a probe of notable dynamical events that have occurred in the history of the star cluster.
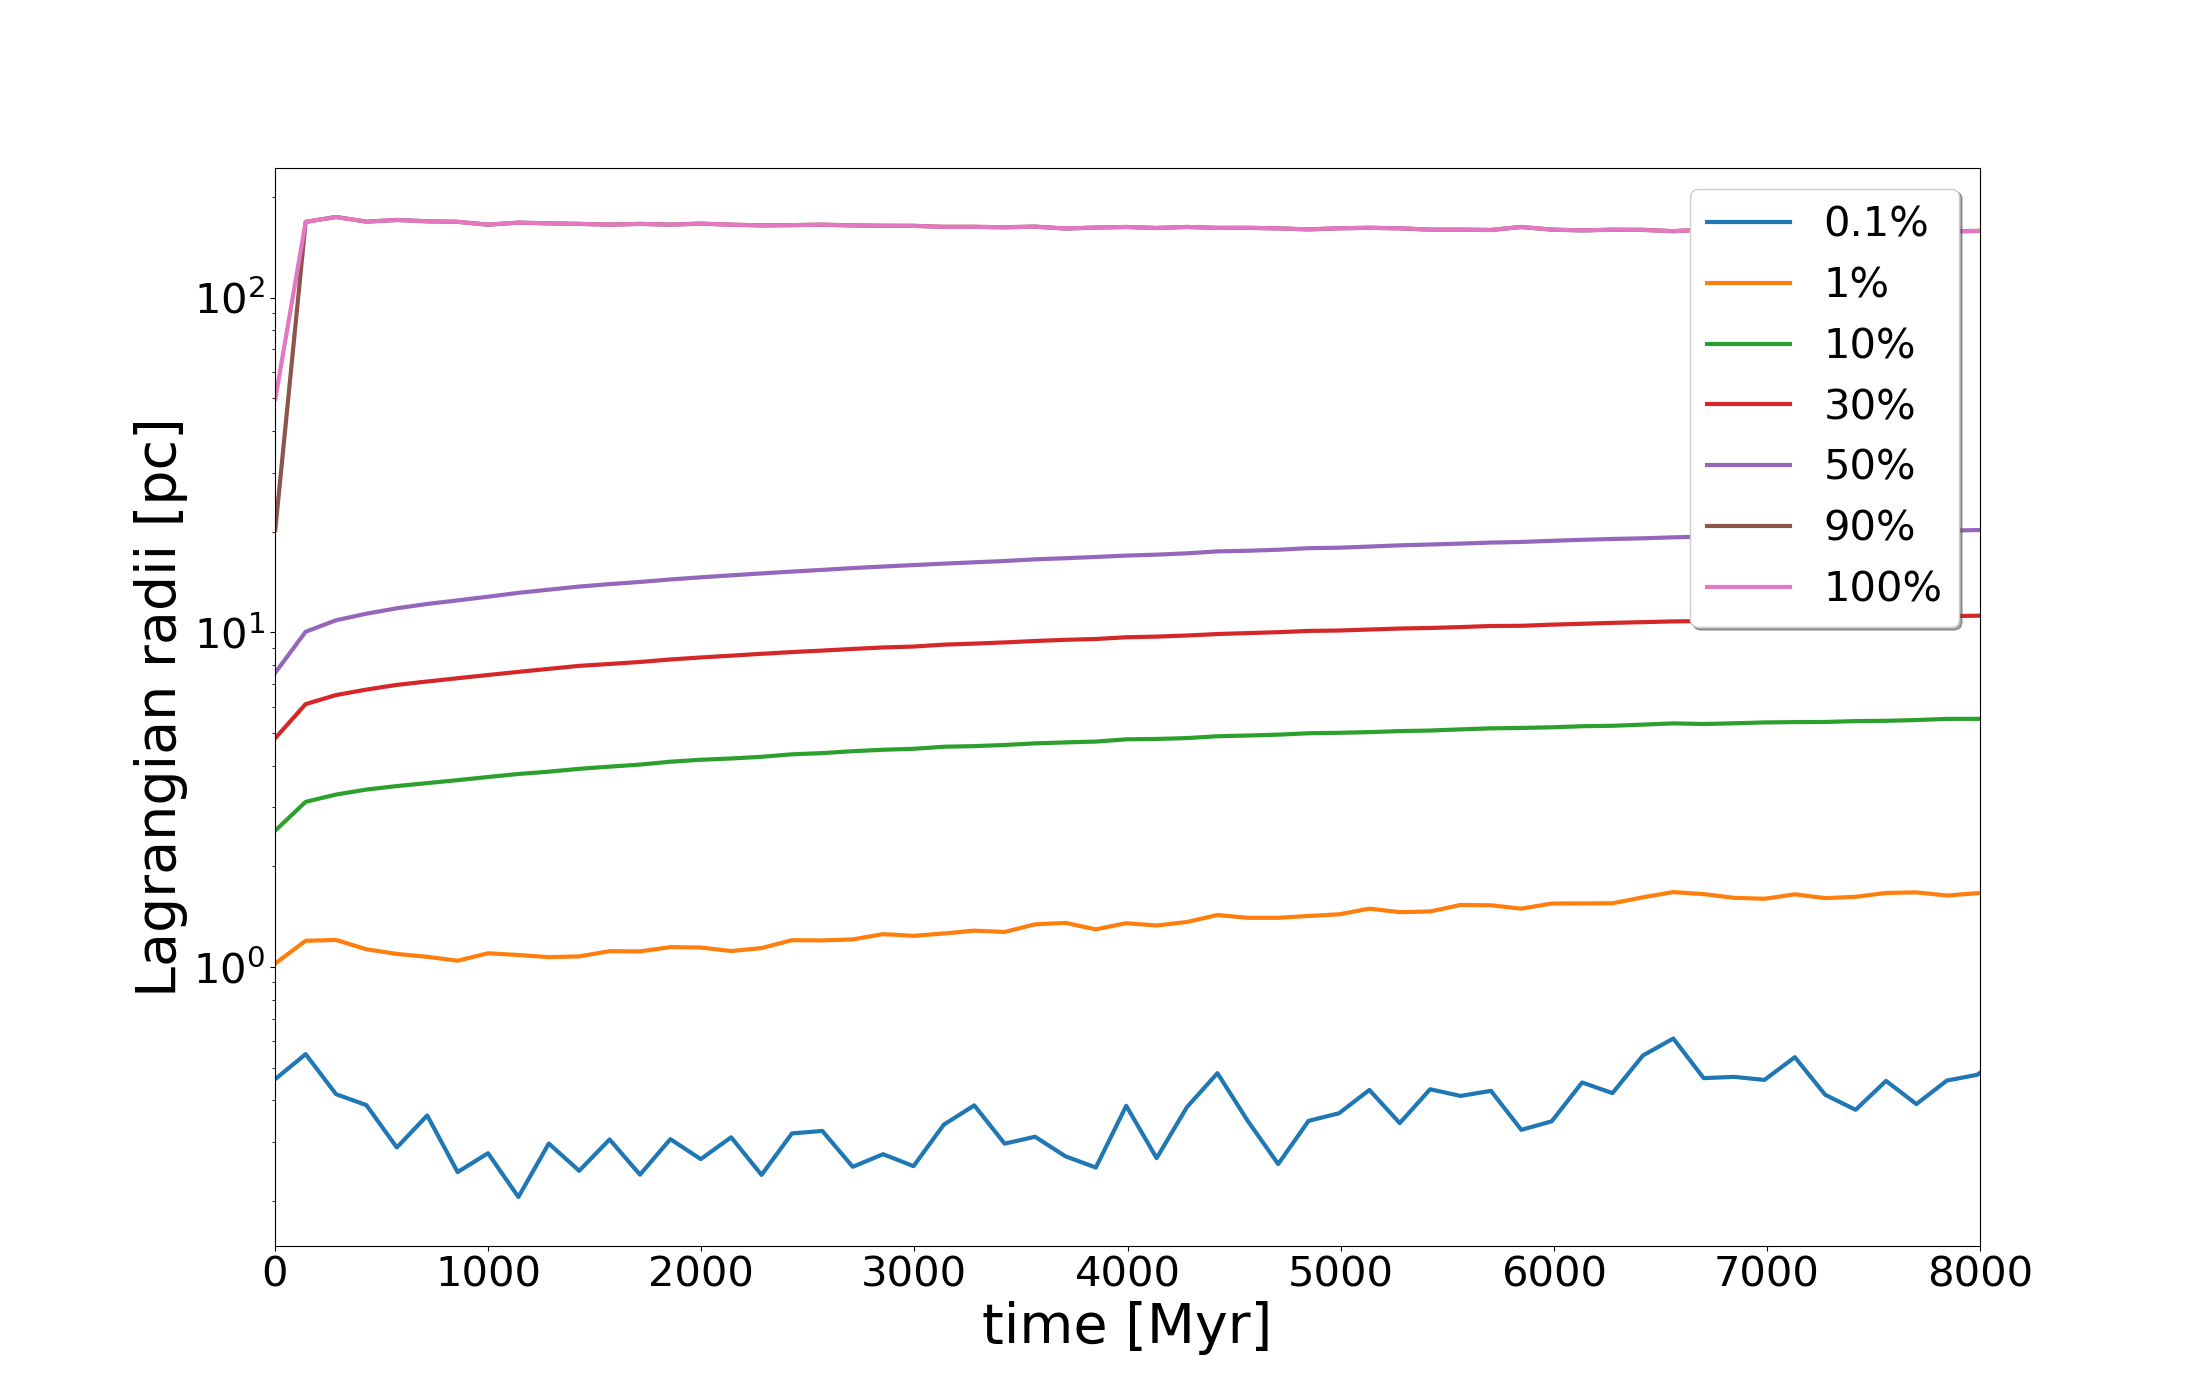
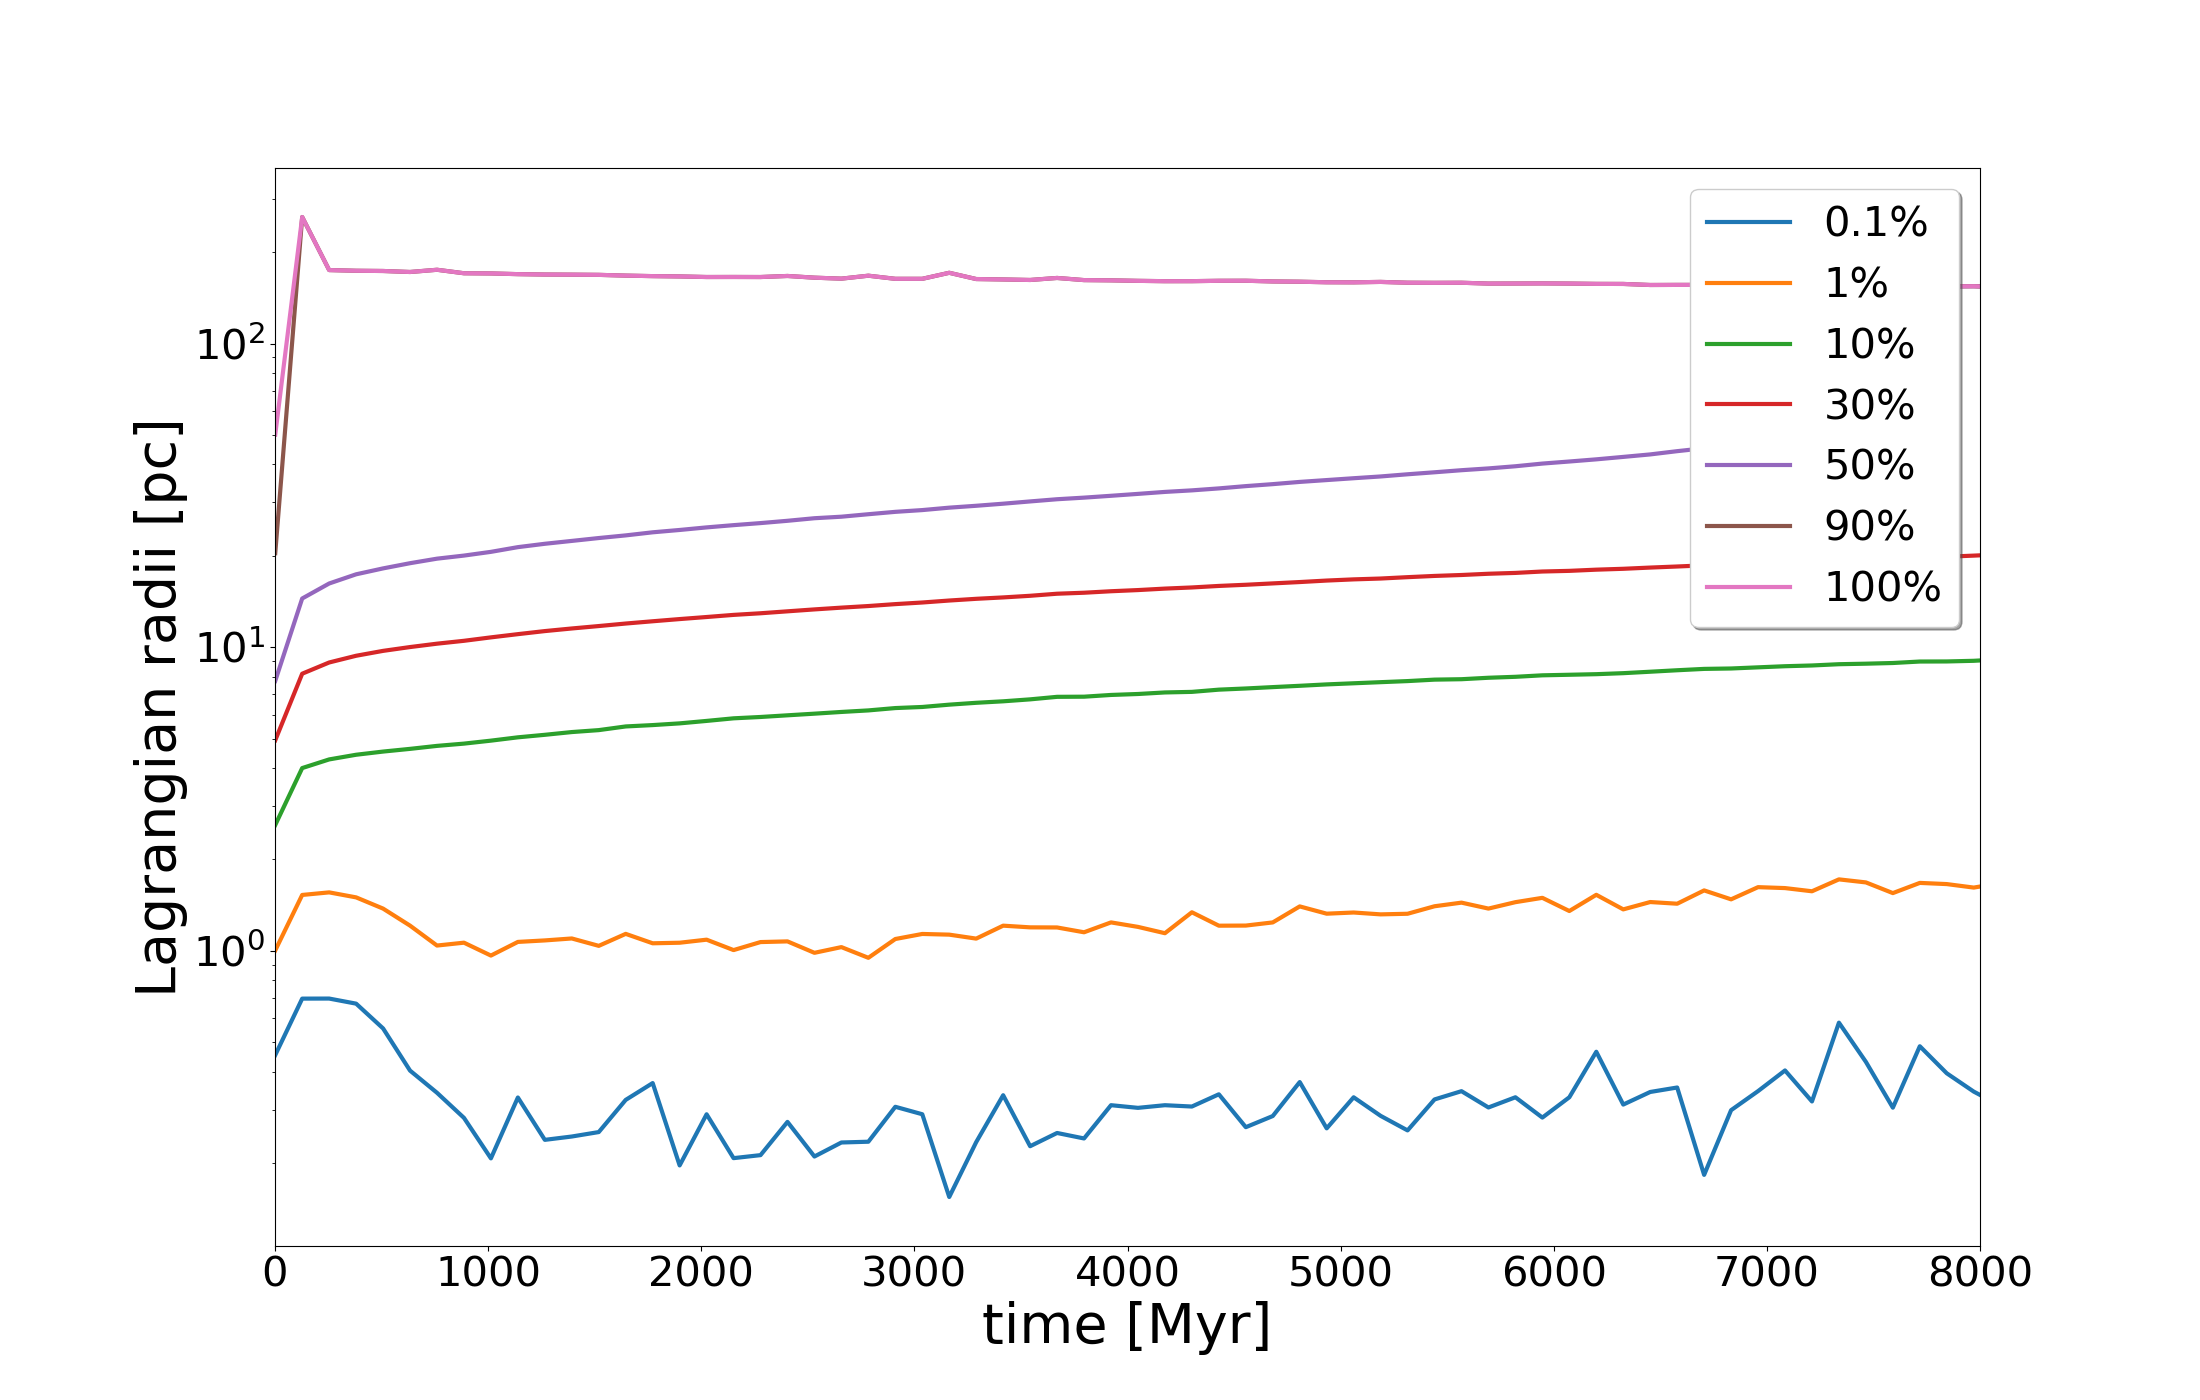
In order to determine the related dynamical process at 1 Gyr, we show the evolution of the Lagrangian radii in the bottom panel of Figures 11 and 12. The significant decrease in the 0.1 % and 1 % Lagrangian radii is the evidence of core-collapse, which terminated at Gyr in both simulations. The other Lagrangian radii curves show a smooth expansion, since the core-collapse affects only the innermost regions of the star cluster. The classical core-collapse phase is caused by two-body relaxation processes, which transfer energy from the inner region to the outskirts of a star cluster. In the DRAGON simulations, the center of the cluster is occupied by a black hole subsystem after 1 Gyr, which is quite different from the classical paradigm. As time passes, the radial gradient of the binary fraction increases, with the normalized radial binary fraction dropping at larger radii, as the cluster evolves approaching the time of 1 Gyr when the core-collapse phase for both simulations is terminated. A steep radial binary fraction distribution may thus indicate a post core-collapse phase in globular clusters, and vice versa.
The decreasing radial binary fraction at 12 Gyr appears to be a common trend, and is similar to the observed globular clusters (Milone et al., 2016). We fit the radial binary fraction distribution at 12 Gyr of D1-R7-IMF93 with the function proposed by Milone et al. (2016):
| (1) |
where is cluster-centric distance in units of the core-radius, the same as Figure 11 and Figure 12. This function generally fits the D1-R7-IMF93 binary sample (Figure 13), with fitted parameters of , , and . These values are different from the parameters of Galactic globular clusters, i.e. , , and (Milone et al., 2016). The smaller value of in D1-R7-IMF93 might be due to the sample only including MS binaries. A larger value of indicates a steeper decrease of radial binary fraction in our sample. When all types of binaries in the simulation are included in the fit, we obtain , , and , which make no significant differences from the values obtained from MS binaries when fitting errors are taken into account.


4.2 Imprint of dynamical evolution from integrated color
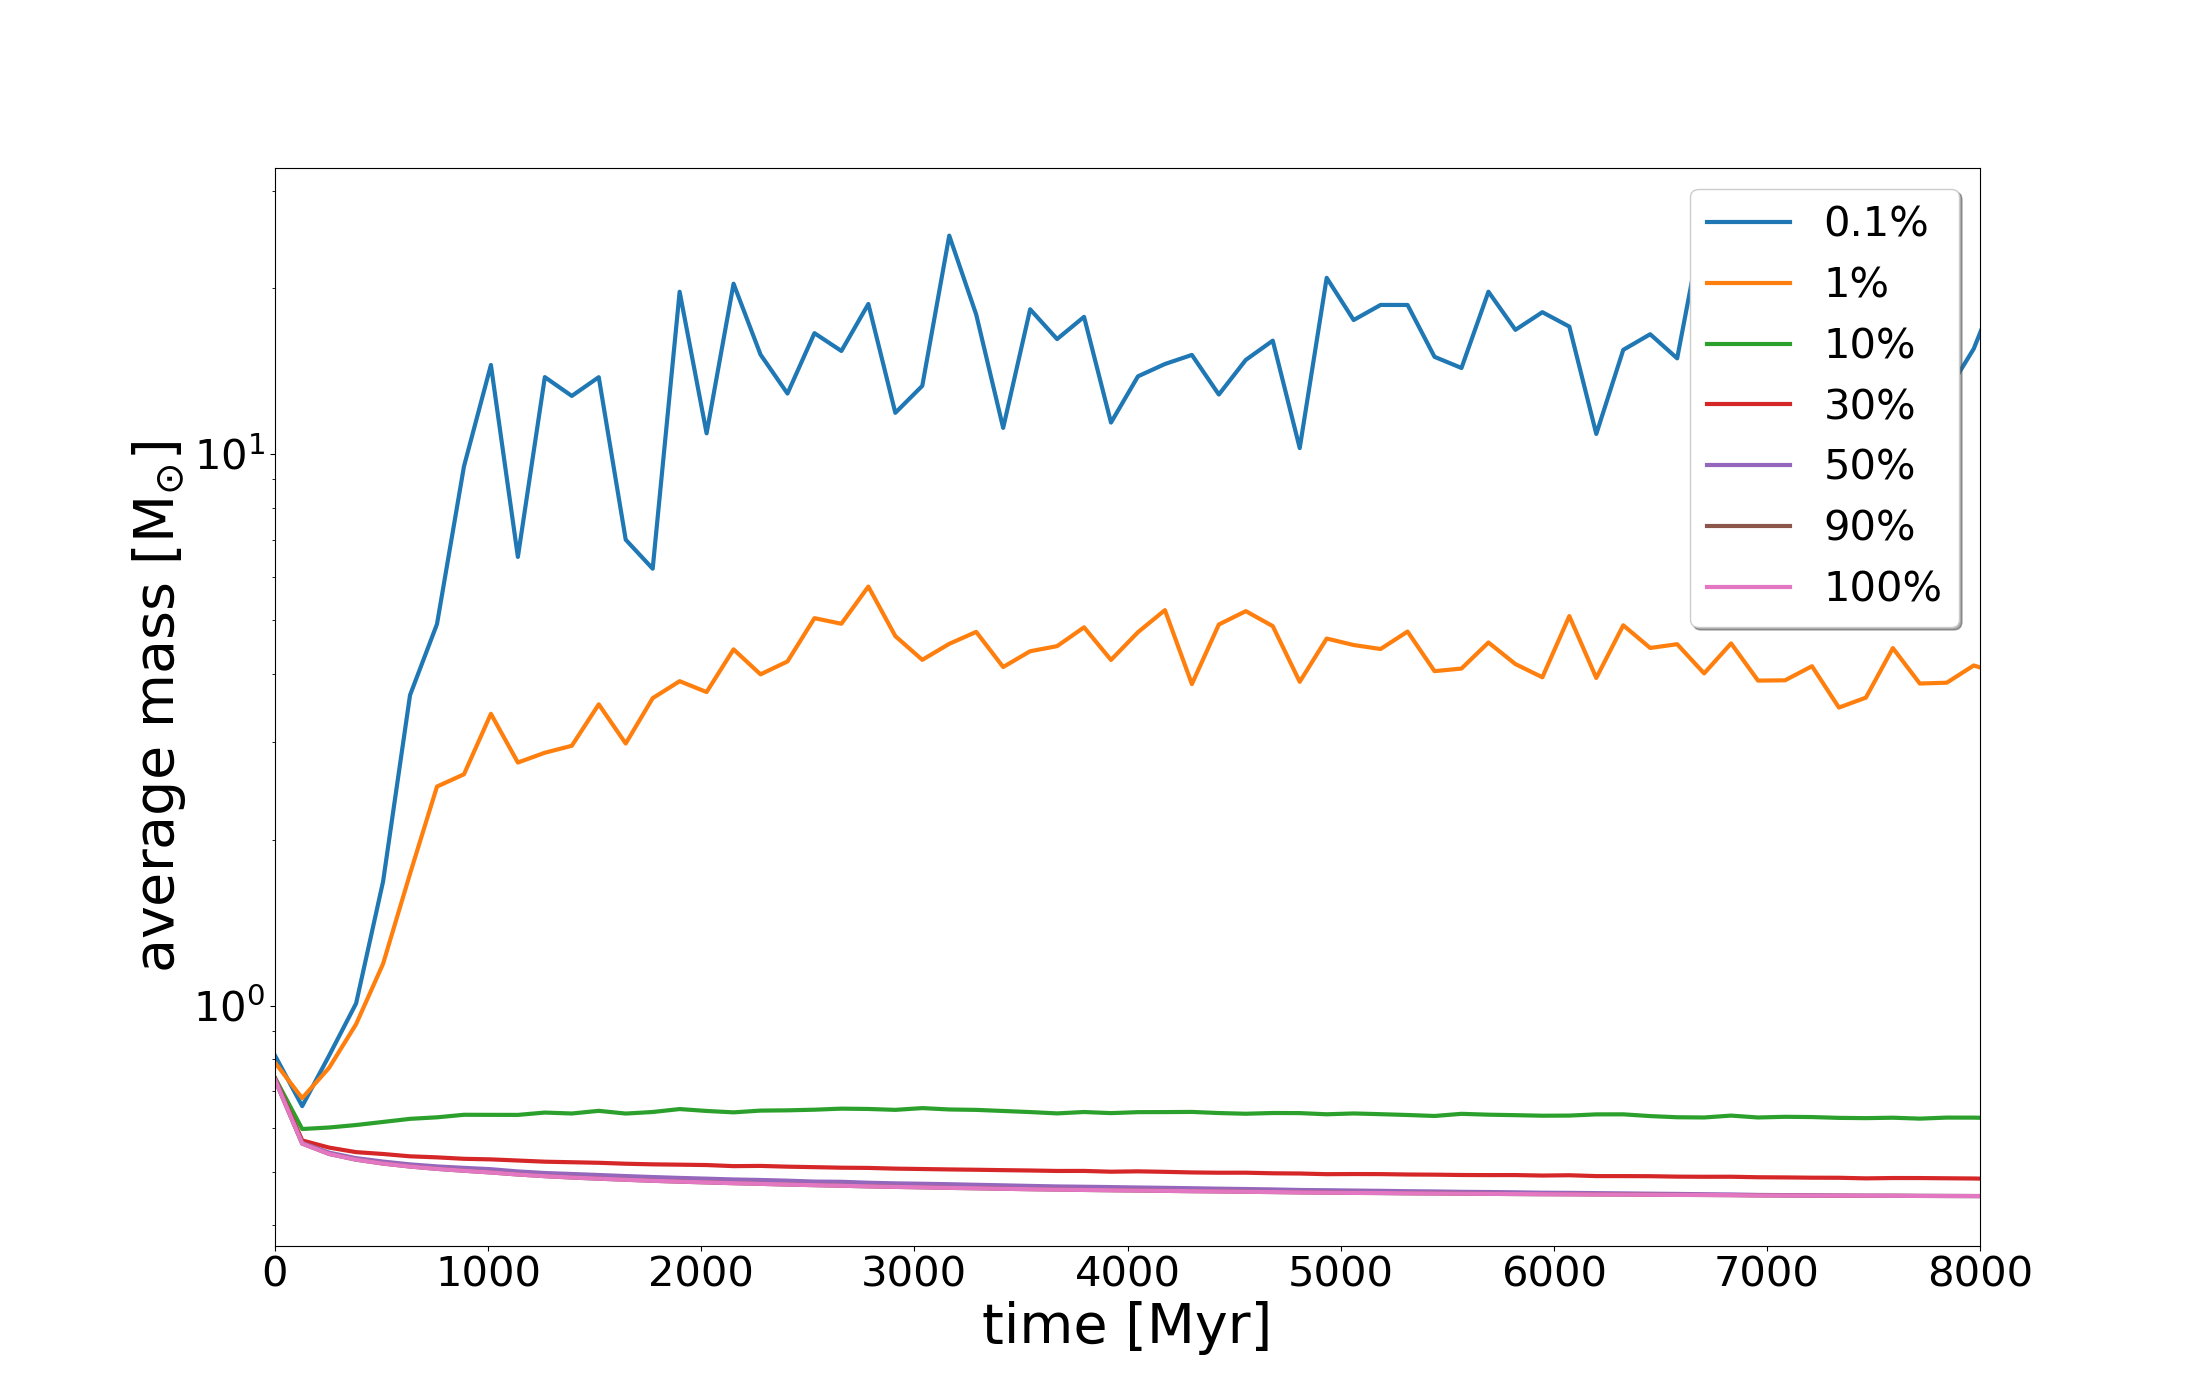
The major dynamical process in a star cluster is two-body relaxation, which segregates massive stars to the cluster center, and low-mass stars to the outskirt (Khalisi et al., 2007). Even a cluster as young as 1 Myr can exhibit mass segregation (Pang et al., 2013), since the segregation timescale is faster for massive stars. The 12 Gyr simulation time in D1-R7-IMF93 and D2-R7-IMF01, is much longer than two-body relaxation timescale, and long enough to segregate low-mass members. We found significant mass segregation within the core in both simulations (see Figure 14). The mean stellar mass in the core region (within the 0.1–1% Lagrangian radii; see Figures 11 and 12) is more than an order of magnitude larger than in the outskirts of each cluster. Gaburov & Gieles (2008) investigated the integrated color of simulated star clusters, and found that the process of mass segregation will eventually change them. There was a color difference of roughly mag between the center and outer part of the mass-segregated clusters.
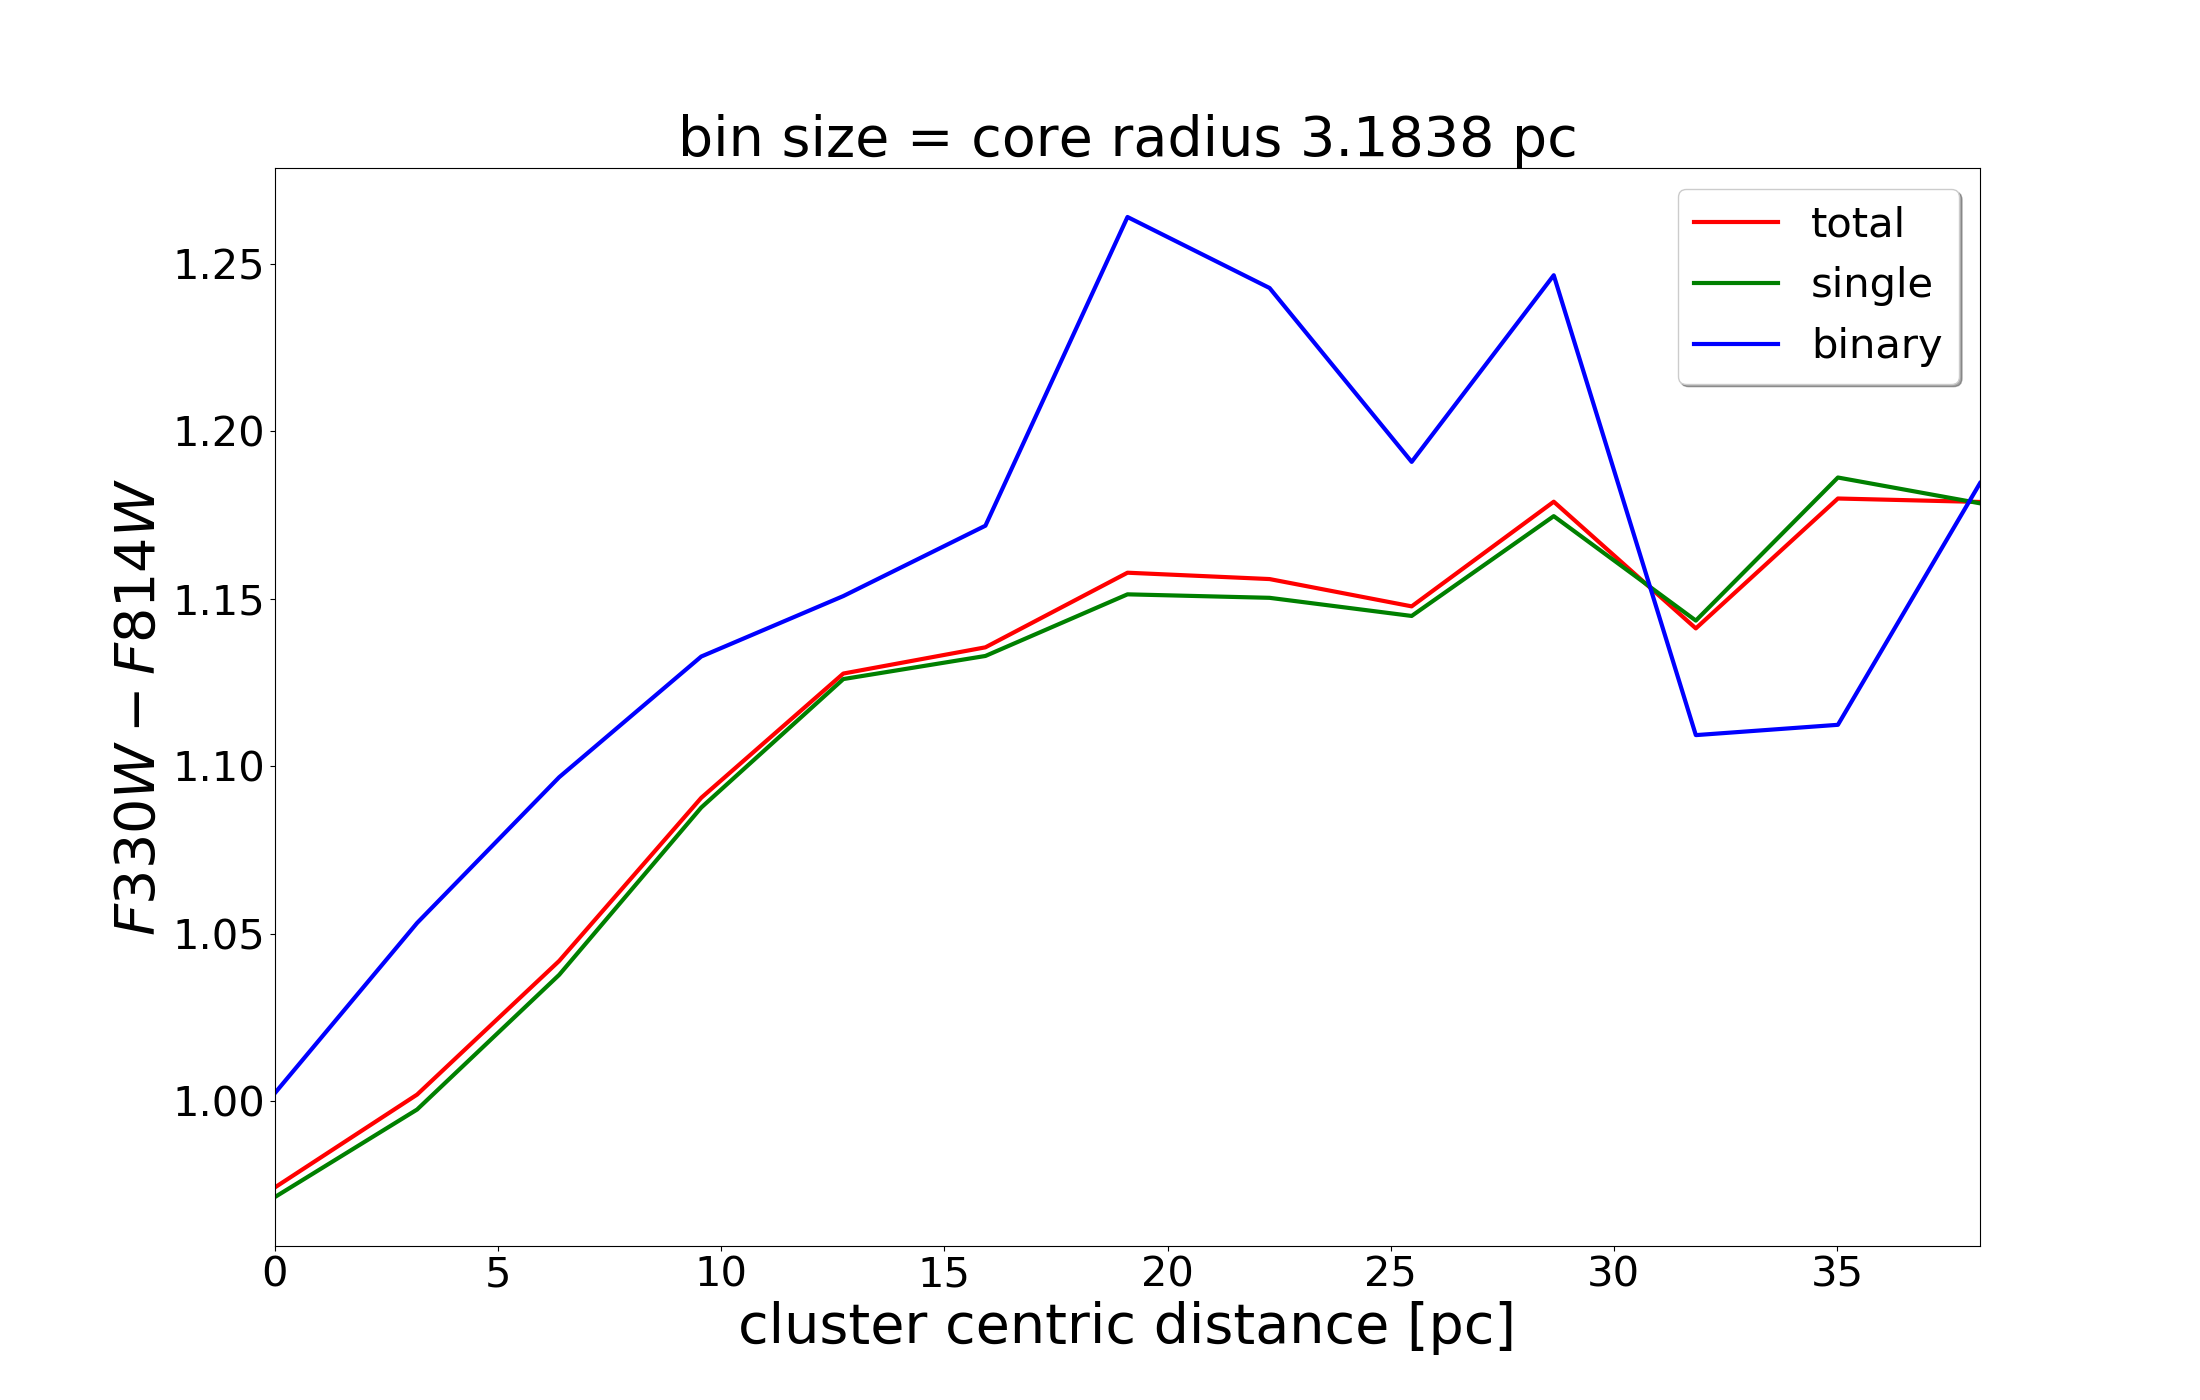
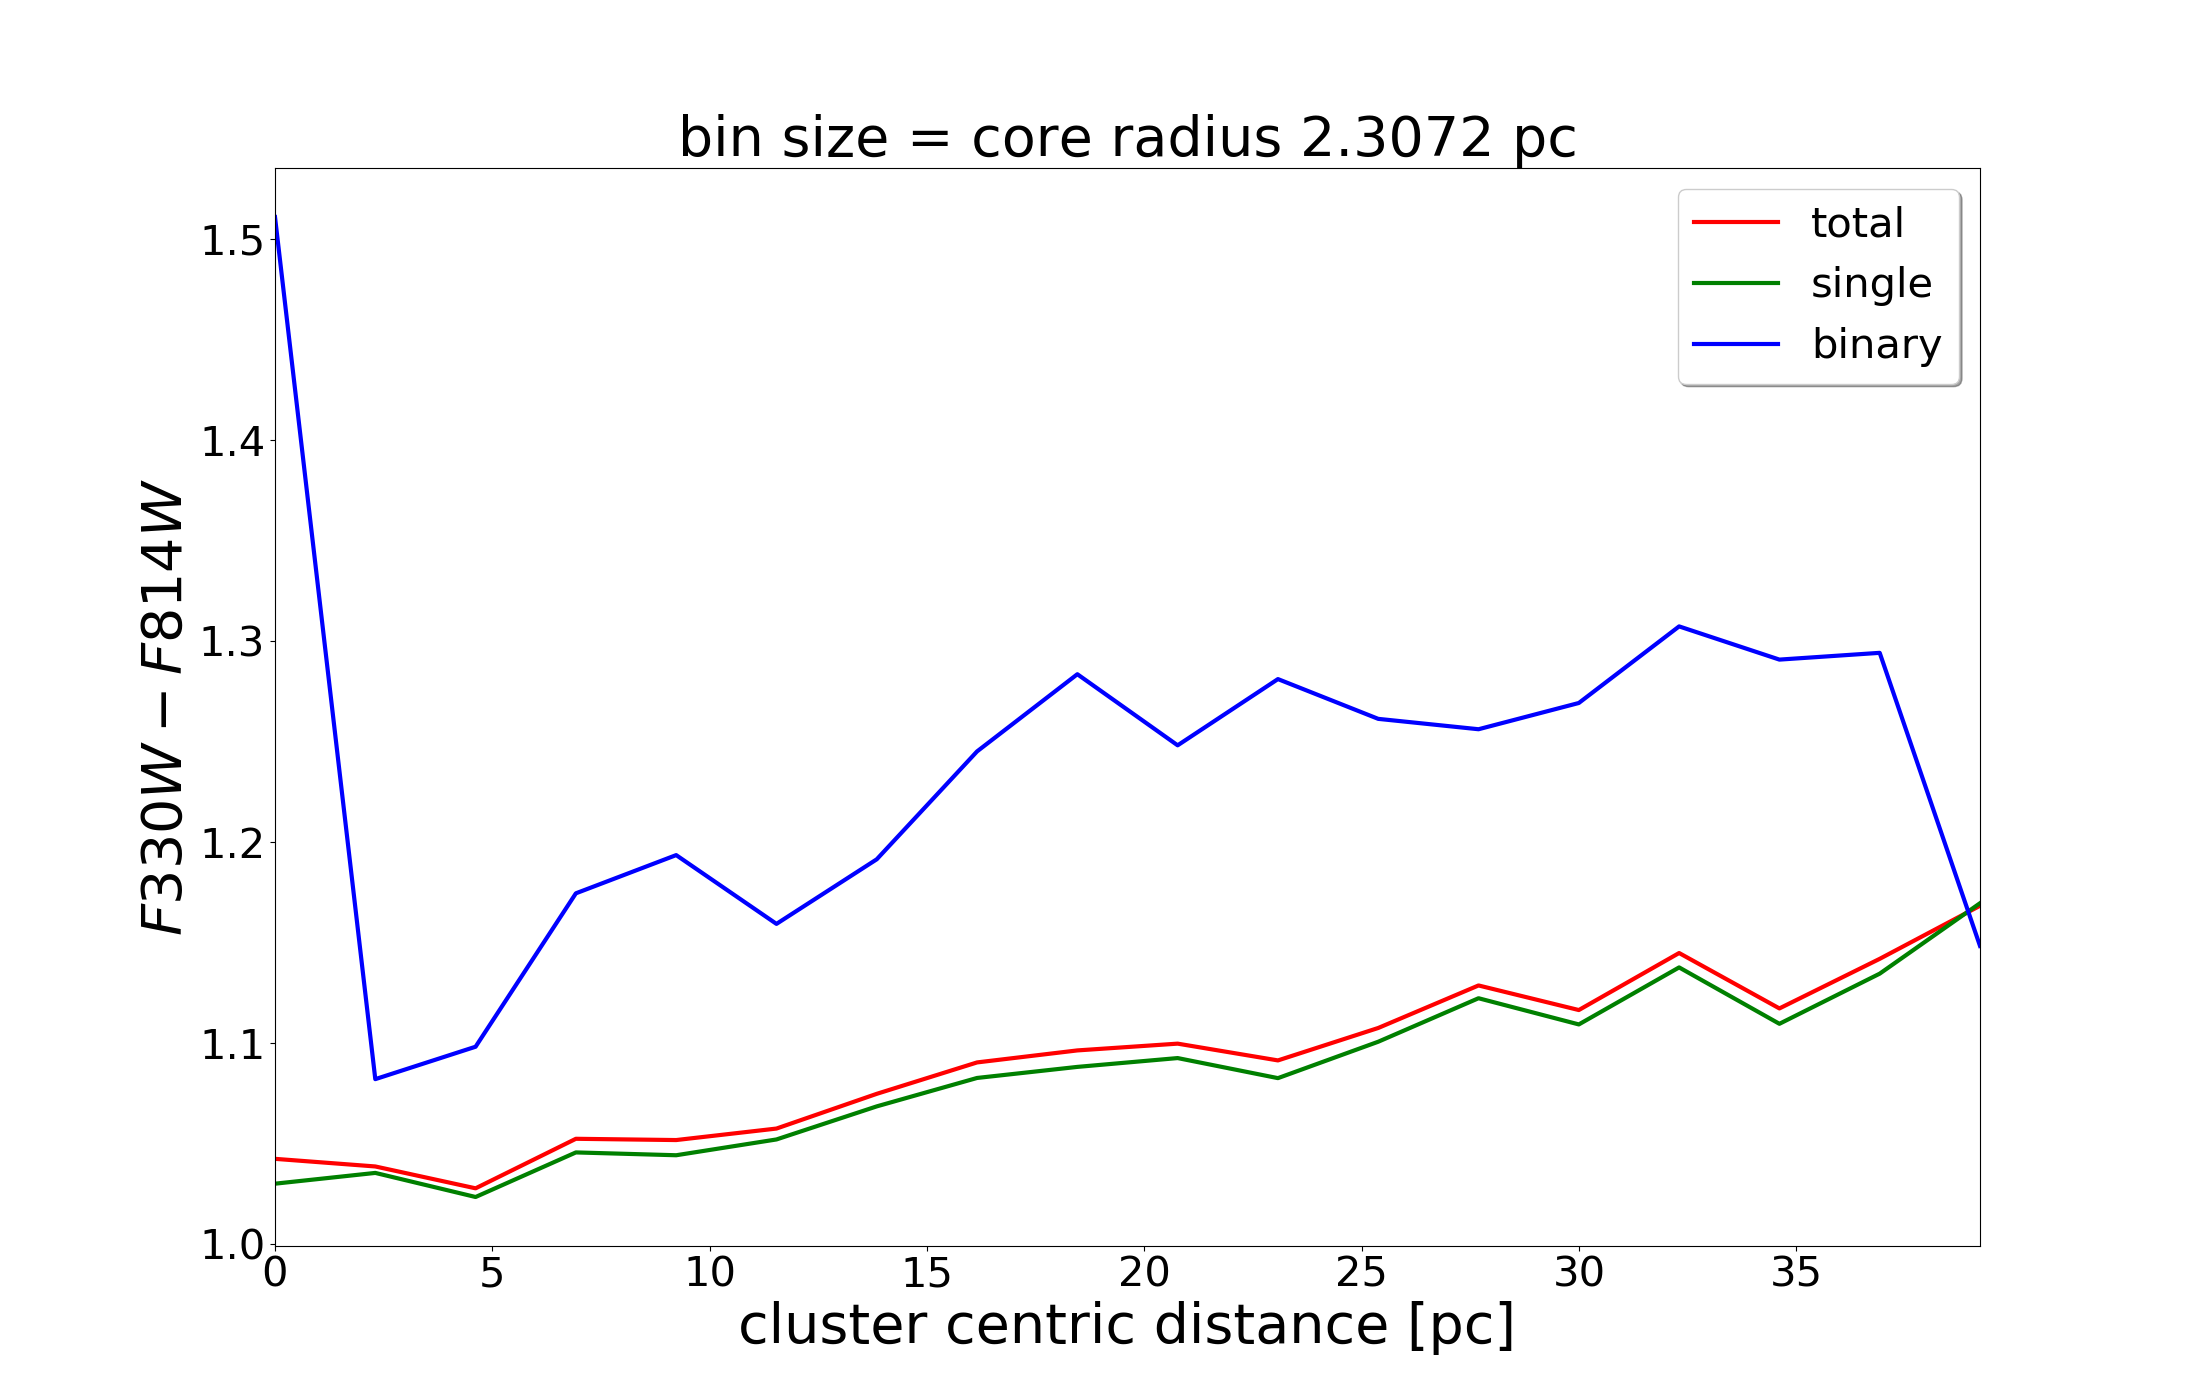
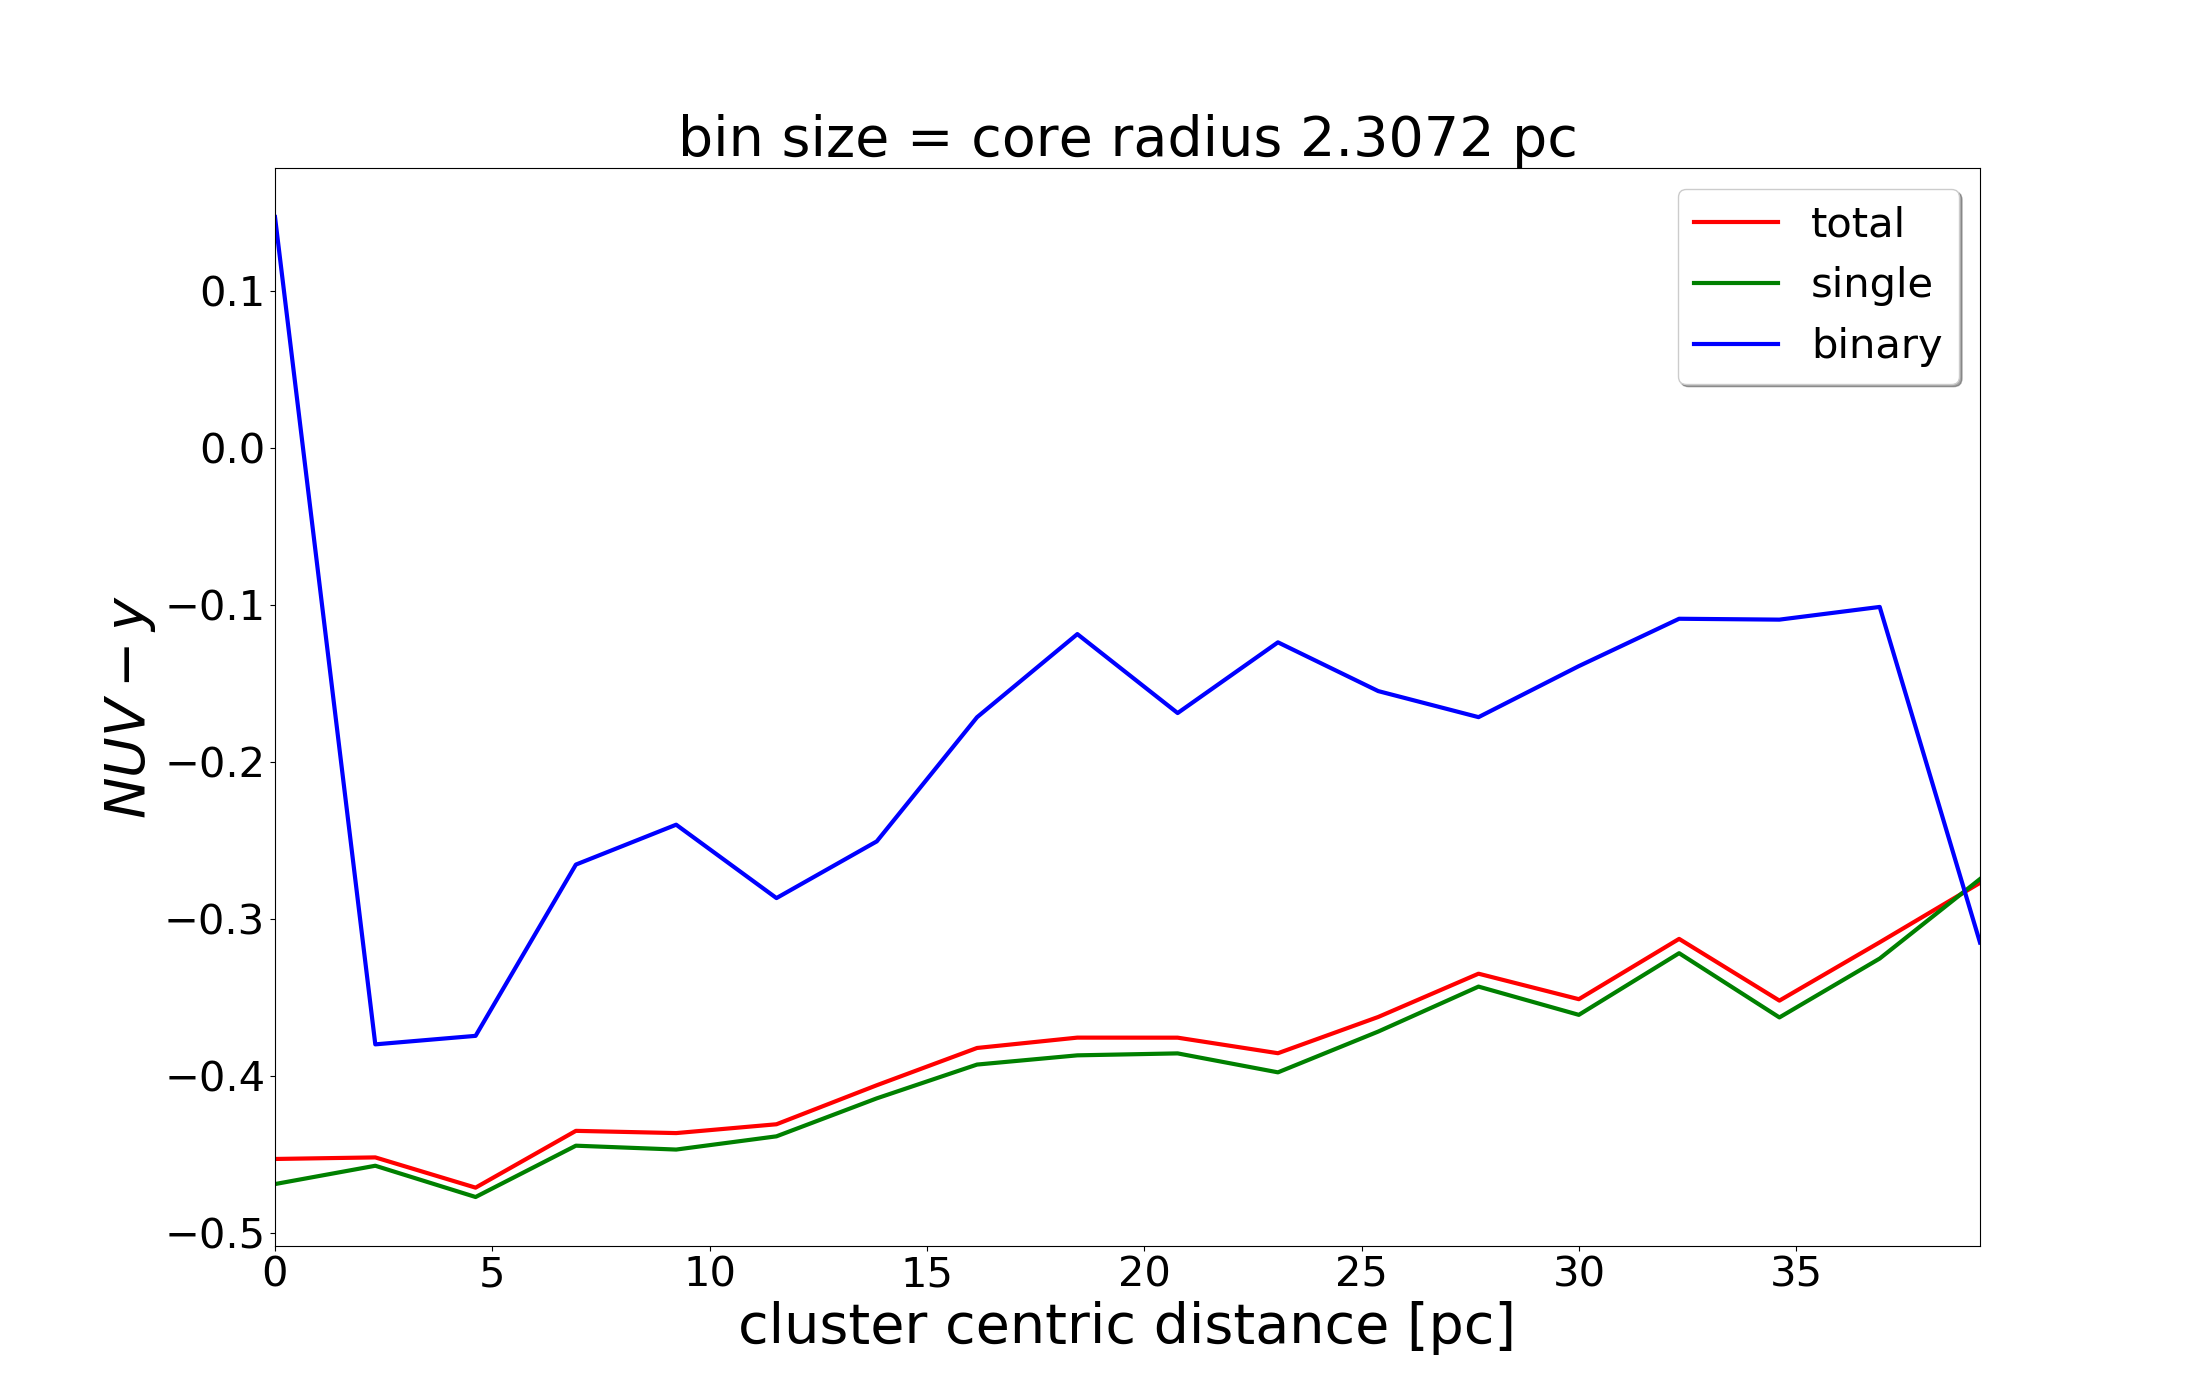
To investigate the radial color difference in the segregated DRAGON clusters, we derived the integrated color ( filters) of two modeled clusters via GalevNB (Pang et al., 2016) and show the color value in each annulus in Figure 15. A color gradient is found in all star and binary samples of D1-R7-IMF93, and only in all star samples of D2-R7-IMF01. The color is bluer in the center and redder in the outskirts, with a difference of mag. The result is in agreement with the findings of Gaburov & Gieles (2008). The color gradient of binary stars may reflect the steep radial profile of the binary fraction in D1-R7-IMF93, which is not found in D2-R7-IMF01. Thus no color gradient is found in binaries of D2-R7-IMF01 for the same reason. Therefore, mass segregation and the binary radial distribution are related. Both have an imprint in the star clusters photometry.
The color difference of or mag requires a photometric uncertainty of less than 0.1 mag. This corresponds to mag in Hubble Space Telescope (HST) depending on the exposure time. HST has been the major instrument for extra-galactic star cluster observations, which are usually cannot resolved into single stars.
The Chinese Space Station Telescope (CSST) will be an essential equipment of observing extra-galactic objects after HST. with a spatial resolution of (Cao et al., 2018; Gong et al., 2019). CSST will observe down to mag. With the ultra-deep field observation (down to 30 mag), much better photometry is expected. In the right panels in Figure 15, we show radial color distribution for both models. The color gradient becomes more significant in color, with a color difference of mag, which is larger than filters. Therefore, CSST will be an excellent instrument used to search for the dynamical signature through radial color difference in extra-galactic star clusters.

5 Discussion and Conclusions
The properties of binary systems provide important information about the formation process and dynamical history of a stellar population. In this work, we have carried out an extensive study of main sequence binaries in the DRAGON simulations, the most comprehensive direct -body simulations of globular clusters available to date. We have analysed the evolution of the orbital parameters and mass properties, and compare these with observational results. In our analysis, we focus specifically on two of the DRAGON simulations: model D1-R7-IMF93 and model D2-R7-IMF01.
The main objective of this work is to analyse the properties of the binary population in globular clusters and to make a comparison with observational data, in order to open opportunities for extracting information from simulations of star clusters. Moreover, we aim to understand the global behaviour of the population of MS binaries in a globular cluster environments through analysing both primordial and dynamical binary systems. Our main results can be summarised as follows:
(i) For model D1-R7-IMF93, due to the random paring binary generation method, the initial mass ratio distribution of the combined set of primordial MS binaries have relative frequency that is highest at . The peak value moves larger to until 12 Gyr due to the stellar evolution. For D2-R7-IMF01, the primordial binaries grows similarly to D1-R7-IMF93, but their decrease of mass ratio is less significant, due to the different initial mass ratio distribution. D1-R7-IMF93 and D2-R7-IMF01 have similar dynamical binaries mass ratio evolution. Their dynamical binaries have at the beginning and a relatively flat mass ratio distribution at 12 Gyr.
(ii) For both models, the semi-major axis distribution maintains a roughly uniform logarithmic distribution over time, although the binary systems with AU are gradually disrupted as the cluster evolves. The dynamical binary systems mostly form with semi-major axes AU. However, these binaries are typically short-lived in a dense star cluster environment. For the Kouwenhoven et al. (2007) distribution, the same behaviour holds. The star cluster have, therefore, the major control over the semi-major axis of the binaries, due to the close encounters. We found more AU binaries in our simulated star clusters (this work) than field stars (Raghavan et al., 2010).
(iii) For both models, the eccentricity distribution of primordial binaries follows roughly a thermal distribution, but with a depression at , as a consequence of the initial conditions. This depression does not exist in dynamical binaries.
(iv) For D1-R7-IMF93, the radial distribution of binary fraction is almost uniform until 1 Gyr, After this time, the binary fraction in the outer part of the cluster tends to radially decrease. For D2-R7-IMF01 we do not observe a similar evolution.
(v) MS binaries in the outskirts of clusters tend to have orbits with larger semi-major axis and longer periods than the clusters’ averages. General parameter evolution of binaries is not affected by the initial mass-ratio distribution.
(vi) Mass segregation is observed in both simulations. Moreover, the mass segregation and binary radial distribution are related. The color difference of 0.1 mag in - and 0.2 mag in from inner to outer part of the cluster, reflect the radial distribution of binaries and the mass segregation in the cluster, with similar results as Gaburov & Gieles (2008). The future Chinese Space Station Telescope (CSST) will provide an excellent opportunity to further investigate the radial color gradient in extra-galactic star clusters.
(vii) We present our data online (see Appendix A). For each simulation model, we present complete sample of MS binaries at eight snapshots as , 100, 300, 600, 1000, 3000, 6000, and 12000 Myr. This is the first public data from DRAGON project to the community. This publicly-available data resource can be used for follow-up work and/or comparison between models. We envision that this will help to bridging computational and observational star cluster communities, and between the research groups that work on different computational approaches.
In this study we have limited our study to main-sequence binary systems, primarily because these are by far the most dominant population of binary systems in star clusters. Our focus has been primarily on two DRAGON simulations (models D1-R7-IMF93 and D2-R7-IMF01). These two comprehensive data-sets can be used for comparison with extended simulation sets, and as benchmarks for comparison with observations in future studies. Based on the observed properties of binaries in star clusters, people can infer which is the proper hidden long-term evolution of binaries from our work.
References
- Aarseth (1999) Aarseth, S. J. 1999, PASP, 111, 1333
- Allen (2007) Allen P. R., 2007, ApJ, 668, 492
- Allison, et al. (2009) Allison R. J., Goodwin S. P., Parker R. J., de Grijs R., Portegies Zwart S. F., Kouwenhoven M. B. N., 2009, ApJL, 700, L99
- Ahmad & Cohen (1973) Ahmad A., Cohen L., 1973, JCoPh, 12, 389
- Belczynski et al. (2002) Belczynski, K., Kalogera, V., & Bulik, T. 2002, ApJ, 572, 407
- Belloni et al. (2017) Belloni, D., Zorotovic, M., Schreiber, M. R., et al. 2017, MNRAS, 468, 2429
- Burgasser et al. (2003) Burgasser, A. J., Kirkpatrick, J. D., Reid, I. N., et al. 2003, ApJ, 586, 512
- Cai et al. (2015) Cai, M. X., Meiron, Y., Kouwenhoven, M. B. N., et al. 2015, ApJS, 219, 31
- Catelan, Valcarce & Sweigart (2010) Catelan M., Valcarce A. A. R., Sweigart A. V., 2010, IAUS, 266, 281, IAUS..266
- Cao et al. (2018) Cao, Y., Gong, Y., Meng, X.-M., et al. 2018, MNRAS, 480, 2178
- de Zeeuw et al. (1999) de Zeeuw, P. T., Hoogerwerf, R., de Bruijne, J. H. J., et al. 1999, AJ, 117, 354
- Eggleton (1983) Eggleton, P. P. 1983, ApJ, 268, 368
- Duchêne & Kraus (2013) Duchêne G., Kraus A., 2013, ARA&A, 51, 269
- Fisher et al. (2005) Fisher, J., Schröder, K.-P., & Smith, R. C. 2005, MNRAS, 361, 495
- Flammini et al. (2019) Flammini Dotti, F., Kouwenhoven, M. B. N., Cai, M. X., Spurzem, R., 2019, MNRAS, 489, 2280
- Flammini et al. (2020) Flammini Dotti, F., Cai, M. X., Kouwenhoven, M. B. N., Spurzem, R., Origins: From the Protosun to the First Steps of Life. Proceedings of the International Astronomical Union, 345, 293
- Ford, Kozinsky & Rasio (2000) Ford E. B., Kozinsky B., Rasio F. A., 2000, ApJ, 535, 385
- Fujii et al. (2019) Fujii, M. S., Hori, Y., 2019, A&A, 624, A110
- Gaburov & Gieles (2008) Gaburov, E., & Gieles, M. 2008, MNRAS, 391, 190
- Geisler et al. (1995) Geisler, D., Piatti, A. E., Claria, J. J., et al. 1995, AJ, 109, 605
- Gong et al. (2019) Gong, Y., Liu, X., Cao, Y., et al. 2019, ApJ, 883, 203
- Goodman & Hut (1993) Goodman, J., & Hut, P. 1993, ApJ, 403, 271
- Goodwin et al. (2007) Goodwin, S. P., Kroupa, P., Goodman, A., et al. 2007, Protostars and Planets V, 133
- Hamers (2020) Hamers A. S., 2020, arXiv, arXiv:2002.08746
- Heggie (1975) Heggie, D. C. 1975, MNRAS, 173, 729
- Hurley et al. (2013a) Hurley, J. R., Pols, O. R., & Tout, C. A. 2013a, SSE: Single Star Evolution, ascl:1303.015
- Hurley et al. (2013b) Hurley, J. R., Tout, C. A., & Pols, O. R. 2013b, BSE: Binary Star Evolution, ascl:1303.014
- Hurley & Shara (2002) Hurley, J. R., & Shara, M. M. 2002, ApJ, 570, 184
- Hurley et al. (2000) Hurley, J. R., Pols, O. R., & Tout, C. A. 2000, MNRAS, 315, 543
- Hurley, Tout & Pols (2002) Hurley J. R., Tout C. A., Pols O. R., 2002, MNRAS, 329, 897
- Hut, et al. (1992) Hut P., et al., 1992, PASP, 104, 981
- Jeans (1919) Jeans, J. H. 1919, MNRAS, 79, 408
- Jiang & Tremaine (2010) Jiang Y.-F., Tremaine S., 2010, MNRAS, 401, 977
- Kacharov et al. (2014) Kacharov, N., Bianchini, P., Koch, A., et al. 2014, A&A, 567, A69
- Kalirai & Richer (2010) Kalirai J. S., Richer H. B., 2010, RSPTA, 368, 755
- Khalisi et al. (2007) Khalisi, E., Amaro-Seoane, P., & Spurzem, R. 2007, MNRAS, 374, 703
- King (1966) King, I. R. 1966, AJ, 71, 64
- Kroupa (1995) Kroupa P., 1995, MNRAS, 277, 1491
- Kobulnicky, Fryer & Kiminki (2006) Kobulnicky H. A., Fryer C. L., Kiminki D. C., 2006, arXiv, astro-ph/0605069
- Kouwenhoven et al. (2003) Kouwenhoven, T., Brown, A., Gualandris, A., et al. 2003, IAU Symposium, P49
- Kouwenhoven, et al. (2005) Kouwenhoven M. B. N., Brown A. G. A., Zinnecker H., Kaper L., Portegies Zwart S. F., 2005, A&A, 430, 137
- Kouwenhoven et al. (2007) Kouwenhoven, M. B. N., Brown, A. G. A., Portegies Zwart, S. F., et al. 2007, A&A, 474, 77
- Kouwenhoven et al. (2009) Kouwenhoven M. B. N., Brown A. G. A., Goodwin S. P., Portegies Zwart S. F., Kaper L., 2009, A&A, 493, 979
- Kouwenhoven, et al. (2010) Kouwenhoven M. B. N., Goodwin S. P., Parker R. J., Davies M. B., Malmberg D., Kroupa P., 2010, MNRAS, 404, 1835
- Kroupa (2001) Kroupa, P. 2001, MNRAS, 322, 231
- Kroupa (2002) Kroupa, P. 2002, Masters Thesis
- Kroupa et al. (1993) Kroupa, P., Tout, C. A., & Gilmore, G. 1993, MNRAS, 262, 545
- Krumholz & Thompson (2007) Krumholz M. R., Thompson T. A., 2007, ApJ, 661, 1034
- Kustaanheimo & Stiefel (1965) Kustaanheimo P., Stiefel E., 1965, J. Reine Angew. Math., 218, 204
- Larson (2003) Larson R. B., 2003, RPPh, 66, 1651
- Li, et al. (2015) Li Y., Kouwenhoven M. B. N., Stamatellos D., Goodwin S. P., 2015, ApJ, 805, 116
- Li, et al. (2016) Li Y., Kouwenhoven M. B. N., Stamatellos D., Goodwin S. P., 2016, ApJ, 831, 166
- Makino (1991) Makino, J. 1991, ApJ, 369, 200
- Marks & Kroupa (2012) Marks M., Kroupa P., 2012, A&A, 543, A8
- Mayor et al. (2004) Mayor, M., Udry, S., Naef, D., et al. 2004, A&A, 415, 391
- McKee & Ostriker (2007) McKee C. F., Ostriker E. C., 2007, ARA&A, 45, 565
- Meylan & Heggie (1997) Meylan, G., & Heggie, D. C. 1997, A&A Rev., 8, 1
- McMillan (1986) McMillan, S. L. W. 1986, The Use of Supercomputers in Stellar Dynamics, 156
- Mikkola & Aarseth (1993) Mikkola S., Aarseth S. J., 1993, CeMDA, 57, 439
- Milone et al. (2016) Milone, A. P., Marino, A. F., Bedin, L. R., et al. 2016, MNRAS, 455, 3009
- Milone et al. (2010) Milone, A. P., Piotto, G., Bedin, L. R., et al. 2010, SF2A-2010: Proceedings of the Annual Meeting of the French Society of Astronomy and Astrophysics, 319
- Milone et al. (2012) Milone, A. P., Piotto, G., Bedin, L. R., et al. 2012, A&A, 540, A16
- Moeckel & Clarke (2011) Moeckel N., Clarke C. J., 2011, MNRAS, 415, 1179
- Naoz, et al. (2013) Naoz S., Farr W. M., Lithwick Y., Rasio F. A., Teyssandier J., 2013, MNRAS, 431, 2155
- Pang et al. (2016) Pang, X.-Y., Olczak, C., Guo, D.-F., et al. 2016, Research in Astronomy and Astrophysics, 16, 37
- Pang et al. (2013) Pang, X., Grebel, E. K., Allison, R. J., et al. 2013, ApJ, 764, 73
- Price & Bate (2007) Price D. J., Bate M. R., 2007, MNRAS, 377, 77
- Raghavan et al. (2010) Raghavan, D., McAlister, H. A., Henry, T. J., et al. 2010, ApJS, 190, 1
- San Roman et al. (2015) San Roman, I., Muñoz, C., Geisler, D., et al. 2015, A&A, 579, A6
- Sana et al. (2012) Sana, H., de Mink, S. E., de Koter, A., et al. 2012, Science, 337, 444
- Sana, James & Gosset (2011) Sana H., James G., Gosset E., 2011, MNRAS, 416, 817
- Shatsky & Tokovinin (2002) Shatsky, N., & Tokovinin, A. 2002, A&A, 382, 92
- Shukirgaliyev, et al. (2018) Shukirgaliyev B., Parmentier G., Just A., Berczik P., 2018, ApJ, 863, 171
- Sollima et al. (2010) Sollima, A., Carballo-Bello, J. A., Beccari, G., et al. 2010, MNRAS, 401, 577
- Spurzem et al. (2009) Spurzem, R., Giersz, M., Heggie, D. C., Lin, D. N. C., 2009, ApJ, 697, 458
- Tapamo (2009) Tapamo, H. 2009, Jets from Young Stars V, 3
- Tokovinin (2014a) Tokovinin A., 2014a, AJ, 147, 86
- Tokovinin (2000) Tokovinin A. A., 2000, A&A, 360, 997
- Tokovinin (2014b) Tokovinin A., 2014b, AJ, 147, 87
- Wang et al. (2015) Wang, L., Spurzem, R., Aarseth, S., et al. 2015, MNRAS, 450, 4070
- Wang et al. (2016) Wang, L., Spurzem, R., Aarseth, S., et al. 2016, MNRAS, 458, 1450
- Whitworth (2001) Whitworth A. P., 2001, IAUS, 200, 33, IAUS..200
Appendix A Binary sample
We provide a complete data sample of the MS binaries in simulation model D1-R7-IMF93 and D2-R7-IMF01, accessible on Github222https://github.com/qshu/table.git and Zenodo 333https://zenodo.org/record/4042966#.X2mb9BNLgUE. The file names are of the form M_T.table, where M is the name of simulation model, and T is the physical time of this snapshot. We display the first ten lines of D1-R7-IMF93_0.table shown in Table 4 as an example for other tables (the same format).
The meanings of parameters are as followed.
PDflag: primordial (1) or dynamical (0);
, : name ID of these two stars in the binary, keep unchanged in different snapshots in one simulation;
: distance to cluster center [pc];
: binary eccentricity;
: logarithmic value of binary period [days];
: logarithmic value of binary semi-major axis [AU];
, : stellar mass of these two stars [];
, : logarithmic value of stellar luminosity of these two stars [solar luminosity];
, : logarithmic value of stellar radius of these two stars [soalr radius];
, : logarithmic value of effective temperature of these two stars [K].
| PDflag | a | |||||||||||||
|---|---|---|---|---|---|---|---|---|---|---|---|---|---|---|
| 1 | 1 | 2 | 4.767 | 0.762 | 2.985 | 0.943 | 96.385 | 0.082 | 6.113 | -3.148 | 1.010 | -0.818 | 4.785 | 3.384 |
| 1 | 3 | 4 | 12.541 | 0.803 | 4.049 | 1.603 | 68.621 | 0.109 | 5.844 | -2.694 | 0.935 | -0.859 | 4.756 | 3.518 |
| 1 | 5 | 6 | 14.910 | 0.723 | 2.276 | 0.408 | 62.280 | 0.255 | 5.763 | -1.826 | 0.912 | -0.596 | 4.747 | 3.603 |
| 1 | 7 | 8 | 8.607 | 0.888 | 3.989 | 1.544 | 59.830 | 0.329 | 5.730 | -1.634 | 0.902 | -0.519 | 4.743 | 3.612 |
| 1 | 9 | 10 | 3.005 | 0.886 | 2.143 | 0.313 | 59.346 | 0.607 | 5.723 | -0.781 | 0.900 | -0.269 | 4.742 | 3.701 |
| 1 | 11 | 12 | 4.888 | 0.452 | 3.973 | 1.527 | 56.895 | 0.717 | 5.687 | -0.443 | 0.891 | -0.193 | 4.738 | 3.747 |
| 1 | 13 | 14 | 18.930 | 0.557 | 1.401 | -0.204 | 51.291 | 0.093 | 5.598 | -2.930 | 0.867 | -0.836 | 4.728 | 3.447 |
| 1 | 15 | 16 | 16.545 | 0.897 | 3.053 | 0.889 | 47.998 | 0.552 | 5.540 | -0.963 | 0.851 | -0.315 | 4.721 | 3.679 |
| 1 | 17 | 18 | 3.097 | 0.650 | 1.991 | 0.179 | 47.674 | 0.093 | 5.533 | -2.942 | 0.850 | -0.835 | 4.720 | 3.444 |
| 1 | 19 | 20 | 7.330 | 0.640 | 3.986 | 1.508 | 47.020 | 0.565 | 5.521 | -0.918 | 0.846 | -0.304 | 4.719 | 3.684 |