4FGLzoo. Classifying Fermi-LAT uncertain gamma-ray sources by machine learning analysis.
Abstract
Since 2008 August the Fermi Large Area Telescope (LAT) has provided a continuous coverage of the gamma-ray sky yielding more than 5000 -ray sources, but 54 of the detected sources remain with no certain or unknown association with a low energy counterpart. Rigorous determination of class type for a -ray source requires the optical spectrum of the correct counterpart but optical observations are demanding and time-consuming, then machine learning techniques can be a powerful alternative for screening and ranking. We use machine learning techniques to select blazar candidates among uncertain sources characterized by -ray properties very similar to those of Active Galactic Nuclei. Consequently, the percentage of sources of uncertain type drops from 54 to less than 12 predicting a new zoo for the Fermi -ray sources. The result of this study opens up new considerations on the population of the gamma energy sky, and it will facilitate the planning of significant samples for rigorous analysis and multi-wavelength observational campaigns.
keywords:
active galaxy, blazar, neural network1 Introduction
Since the beginning of its mission, the Fermi Large Area Telescope (Atwood et al., 2009) detected more than 5000 -ray sources in the 100 MeV - 300 GeV energy range.
Referring to 10 years of monitoring (Ballet et al., 2020)
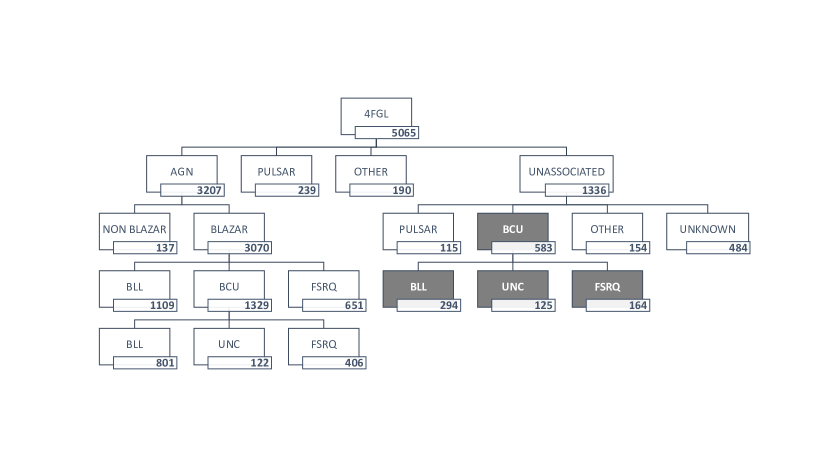
in the fourth Fermi Large Area Telescope catalog (4FGL) the two largest classes of sources are Active Galactic Nuclei (AGN) and pulsars (PRS).Approximately 95 of AGNs can be classified as blazar objects subdivided in BL Lacertae (BLL) and Flat Spectrum Radio Quasars (FSRQ) or uncertain sources positionally coincident with an object showing distinctive broad-band blazar characteristics (BCU), but lacking reliable optical spectrum measurements.
BCUs represent 43 of the blazar class. Also, 28 of the
Fermi-LAT sources have not even a tentative association with a likely -ray emitting object and are referred to as Unassociated Gamma-ray Sources (UGS). As a result, the nature of 54 of the -ray sources is not yet completely known.
However, since blazars are the most numerous -ray source class, we expect that a large fraction of the uncertain or unassociated sources might belong to one of the blazar subclasses, BLL or FSRQ.
FSRQs show strong, broad emission lines at optical wavelengths, while BLL spectra are more challenging since they show at most weak emission lines, but they are often featureless or can display absorption features(Abdo et al., 2010)
Unfortunately optical observations are demanding and time-consuming. Machine learning techniques (ML) can be a powerful
tool for screening and ranking gamma sources according to their classification.
We tested the power of ML methods by applying a ML algorithm to the first release of the Fermi Large Area Telescope Fourth Source Catalog (Abdollahi et al., 2020).
This paper is a continuation of a series of
studies that use machine learning to classify Fermi Large Area Telescope gamma-ray sources that are likely active galactic nuclei (Chiaro et al., 2016; Salvetti et al., 2017).
In this study, we use an improved release of an original Artificial Neural Network (ANN) algorithm
first applied in Chiaro et al. (2016) and based on the variation of the Empirical Cumulative Distribution Function (ECDF, Kolmogorov, 1933) extracted from the -ray light curves of the sources. A detailed description of the algorithm that we use and of its performance dealing with the BCU population in the 3FGL data set is described in Kovacevic et al. (2019)
This paper is organized as follows: in Sect. 2 we provide a brief description of the machine learning technique. In that section, we also
discuss the result of the ANN analysis. In Sect. 3 we validate the predictions by optical spectral observations of a number of targets, finally we discuss the 4FGL zoo in Sect. 4.
2 Machine learning technique
In previous studies, machine learning techniques, mainly ANN, have been applied to classifying uncertain -ray sources (see, e.g., Ackermann et al., 2012; Lee et al., 2012; Hassan et al., 2013; Doert et al., 2014; Chiaro et al., 2016; Mirabal et al., 2016; Saz Parkinson et al., 2016; Lefaucheur et al., 2017; Salvetti et al., 2017, and others)
The basic building block of an ANN algorithm is the neuron.
Information is passed as inputs to the neuron, which produces an output (Gish, 1990; Richard et al., 1991). The output is typically determined as a
mathematical function of the inputs and can be interpreted as a Bayesian a posteriori probability that models the likelihood of classification
based on input parameters. The power of a ANN algorithm comes from assembling many neurons into a network. The network can model very complex behavior from input to output.
Here we apply the same ANN algorithm described in Kovacevic et al. (2019) to the data set available at the time of the 4FGL catalog publication (Abdollahi et al., 2020) which covered 8 years of observations. The improvement over the previous study is due to the use of a longer observing period, including the first eight years of operations, to better statistics on the measurements of the source parameters, and a wider database of multi-wavelength information. The only relevant change in the process consists in the use of the 7 energy bands for the measurements of energy-dependent properties in 4FGL (0.05-0.1, 0.1-0.3, 0.3-1, 1-3, 3-10, 10-30, 30-300 GeV), with respect to the 5 bands used in 3FGL.
2.1 Analysis of -ray sources
In Kovacevic et al. (2020), the authors analyzed 1329
BCUs and the algorithm selected 801 BLL candidates, 406 FSRQ candidates, while 122 sources remained with uncertain classification.
Zhu et al. (2020) used a combination of Random Forest (RF) and ANN classification approaches to study 1336 UGS sources. As result 583 sources were classified as AGN-like, 115 as pulsars, and 154 as sources belonging to other classes of known gamma-ray emitters while 484 sources remained of uncertain classification.
Since the algorithm used in our study is specific for blazar classes selection we further extended the classification of these UGS sources, by providing a blazar classification likelihood for the ones identified as AGN candidates.
Machine learning techniques always consider the algorithm reliable efficiency to produce classification likelihoods if it achieves a precision of 90 111 Precision is a threshold based on the optimization of the positive association rate defined as the fraction of true positives over the objects classified as positive, of 90.
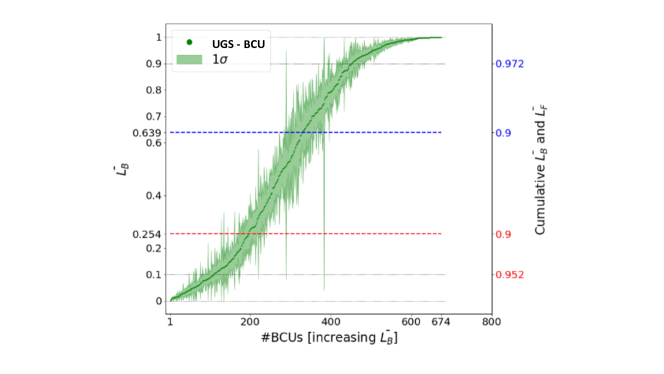
In Fig. 1 the BL Lac likelihood LB for each of the 583 sources in our sample is shown. Each source is presented by a green dot. On the left-hand vertical axis, the final value of LB is an average of 300 LB obtained by selecting different training and testing samples. On the right-hand side of the plot are the cumulative values.
The cumulative value for each source is obtained by summing all the LB values (from the left-hand vertical axis) above a given LB for that source and dividing by the number of sources whose LB is above the given LB.
If we condiser all the sources with a cumulative value above 0.9, we expect 90 of them to be genuine BLLac with a 10 contamination of genuine FSRQ. The cumulative values for FSRQs can be obtained in a similiar way.
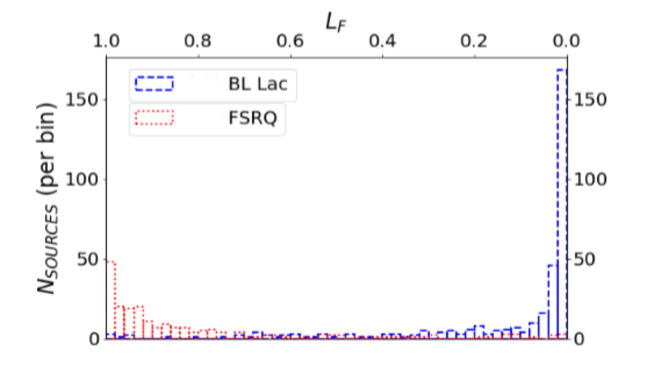
The light green area corresponds to 1 error due to differences in train-test sample selections. With 90 precision the algorithm identified 294 BLL candidates ( LB 0.639 ) and 164 FSRQs ( LB 0.254) while 125 sources remained of uncertain classification. Fig. 2 presents the histogram of classification likelihoods. Two distinct and opposite peaks for BL Lac (blue) and FSRQ (red), the former at LBLL 1, while the latter at LB 0 are visible.
3 Validation
Since optical observations represent the most rigorous and reliable test for the classification of uncertain -ray sources, to validate our ANN analysis, we compared the results with the source classes inferred by Pena-Herazo et al. (2020) optical spectroscopic observations. In that study, the authors produced optical spectra for 130 4FGL BCUs and 50 unassociated -ray sources. The majority of the observed sources are found to be BL Lacs since they show a featureless optical spectrum. Our ANN predictions show an excellent agreement with the optical results. Only 9 predictions out of 180 observed sources misclassify the targets. The misclassification relates to particularly weak and unusually soft BL Lac sources erroneously classified as FSRQ by the ANN algorithm. For completeness, we also considered the 103 3FGL sources that remained uncertain in Salvetti et al. (2017). In 4FGL catalog 78 of those sources are classified as blazar, but 25 still remained as BCUs. Applying our ANN algorithm we classified 13 of them, obtaining 11 BL Lac and 2 FSRQ, while 12 sources remained BCUs. The optical spectra in Pena-Herazo et al. (2020) confirm the ANN classifications also for the latter sources showing that our ANN algorithm provides a reliable method to classify uncertain or unidentified gamma-ray sources also without optical observations.
4 4FGLzoo
Improving the results of the previous studies (Kovacevic et al., 2020; Zhu et al., 2020; Kovacevic et al., 2019) with our UGSBCU analysis we predict a new classification (for the 4FGL -ray population 4FGLzoo) with 1095 BL Lacs candidates and 570 FSRQs candidates while the fraction of the 4FGL uncertain sources decreases from 54 to 17. In Table 1 we give a partial list of classified UGSBCU sources while the full list is available in the electronic format attached to this paper. It is also interesting to see, as shown in table 2, how the relative contribution of the two blazar classes remains almost the same in both the eight years 4FGL catalog and in the four years 3FGL. By decreasing the uncertainty and increasing the sources class prediction the ANN could be useful to the gamma-ray science community as a valid discriminant of best targets for future follow-up multi-wavelength observations. The full list of classified 4FGL BCUs sources, analyzed in Kovacevic et al. (2020), is available in electronic format at https://cdsarc.unistra.fr/viz-bin/cat/J/MNRAS/493/1926
| 4FGL name | b(deg) | l(deg) | LB | LB low | LB up |
|---|---|---|---|---|---|
| 4FGLJ0000.3-7355 | -42.73 | 307.709 | 0.882 | 0.844 | 0.92 |
| 4FGLJ0003.3+2511 | -36.411 | 109.382 | 0.947 | 0.93 | 0.963 |
| 4FGLJ0004.0+5715 | -5.023 | 116.526 | 0.097 | 0.061 | 0.137 |
| 4FGLJ0004.4-4001 | -73.845 | 336.991 | 0.627 | 0.578 | 0.679 |
| 4FGLJ0006.6+4618 | -15.87 | 114.92 | 0.39 | 0.335 | 0.442 |
| 4FGLJ0008.4+6926 | 6.886 | 119.148 | 0.335 | 0.207 | 0.466 |
| 4FGLJ0008.9+2509 | -36.725 | 110.915 | 0.016 | 0.002 | 0.039 |
| 4FGLJ0009.1-5012 | -65.545 | 319.395 | 0.236 | 0.171 | 0.297 |
| 4FGLJ0009.2+1745 | -43.965 | 108.909 | 0.23 | 0.15 | 0.312 |
| 4FGLJ0009.7-1418 | -73.912 | 83.706 | 0.37 | 0.285 | 0.454 |
| Class | 3FGLzoo | 4FGLzoo |
|---|---|---|
| Blazar | 2279 | 3672 |
| - BL Lac | 1276 (56) | 2204 (60) |
| - FSRQ | 823 (36) | 1221 (33) |
| - BCU | 180 (8) | 247 (7) |
Acknowledgments
Support for science analysis during the operation phase is gratefully acknowledged from the Fermi-LAT Collaboration for making the LAT results available in such a useful form. The authors gratefully thank Francesco Massaro Dept of Physics, Università degli Studi, Torino, Italy and his collaborators for sharing optical spectroscopic material and Kerui Zhu, Dept.of Physics, Yunnan Normal University, ROC for sharing ML UGS results. The authors would like the anonymous referee for discussion and suggestions leading to the improvement of this work.
References
- Abdo et al. (2010) Abdo A.A. et al., 2010a, ApJ, 716,1
- Abdollahi et al. (2020) Abdollahi S. et al., 2020, ApJS 247, 33
- Acero et al. (2015) Acero F. et al., 2015, ApJ, 218, 23
- Ackermann et al. (2012) Ackermann M. et al., 2012, ApJ, 753, 83
- Atwood et al. (2009) Atwood W.B. et al., 2009, ApJ, 697, 1071
- Ballet et al. (2020) Ballet J. et al., 2020, arXiv 2005.11208V3
- Chiaro et al. (2016) Chiaro et al. MNRAS, 462, 3180
- Doert et al. (2014) Doert M. et al., 2014, ApJ, 782, 41
- Gish (1990) Gish H., 1990, Proc. Acoust. Speech Signal Process., 3, 1361
- Hassan et al. (2013) Hassan T. et al, 2013, MNRAS,428, 220
- Kolmogorov (1933) Kolmogorov A. 1933, G. Ist. Ital. Attuariale 4, 83¸ 91
- Kovacevic et al. (2019) Kovacevic M. et al., 2019, MNRAS, 490,477
- Kovacevic et al. (2020) Kovacevic M. et al., 2020, MNRAS, 493,1926
- Lefaucheur et al. (2017) Lefaucheur, J. et al, 2017, AA, 602, 86
- Lee et al. (2012) Lee K.J. et al., 2012, MNRAS, 424, 2832
- Mirabal et al. (2016) Mirabal N. et al., 2016, ApJ, 825,69
- Pena-Herazo et al. (2020) Pena-Herazo H.A. et al., 2020, arxiv 2009.07905
- Richard et al. (1991) Richard M. P. et al,1991, Neural Comp., 3, 461
- Salvetti et al. (2017) Salvetti D. et al., 2017, MNRAS, 470, 1291
- Saz Parkinson et al. (2016) Saz Parkinson P. M. et al., 2016, ApJ, 820, 8
- Zhu et al. (2020) Zhu K. et al., 2020, arXiv 2001.06010