Star formation histories of massive red spiral galaxies in the local universe
Abstract
We investigate the star formation histories (SFHs) of massive red spiral galaxies with stellar mass , and make comparisons with blue spirals and red ellipticals of similar masses. We make use of the integral field spectroscopy from the SDSS-IV/DR15 MaNGA sample, and estimate spatially resolved SFHs and stellar population properties of each galaxy by applying a Bayesian spectral fitting code to the MaNGA spectra. We find that both red spirals and red ellipticals have experienced only one major star formation episode at early times, and the result is independent of the adopted SFH model. On average, more than half of their stellar masses were formed 10 Gyrs ago, and more than 90% were formed Gyrs ago. The two types of galaxies show similarly flat profiles in a variety of stellar population parameters: old stellar ages indicated by (the spectral break at around 4000Å), high stellar metallicities, large Mgb/Fe ratios indicating fast formation, and little stellar dust attenuation. In contrast, although blue spirals also formed their central regions 10 Gyrs ago, both their central regions and outer disks continuously form stars over a long timescale. Our results imply that, massive red spirals are likely to share some common processes of formation (and possibly quenching) with massive red ellipticals in the sense that both types were formed at through a fast formation process. Possible mechanisms for the formation and quenching of massive red spirals are discussed.
1 Introduction
One hundred years ago when Edwin Hubble pointed the 100-inch Hooker telescope to nearby galaxies, he discovered that the galaxies could be broadly divided into two distinct classes according to morphology: spiral and elliptical. Theoretically, it is now well accepted that the structural and kinematic properties of a galaxy is predominantly determined by the aquisition and distribution of angular momentum (e.g. Danovich et al., 2015). Generally, ellipticals form by losing angular momentum, while spirals form by preserving and redistributing angular momentum. In this case, an elliptical galaxy forms directly by efficient cooling of infalling gas and becomes red and quenched upon its formation due to the consumption of cold gas, while a spiral galaxy forms in the host dark matter halo with fixed fractions of the mass and angular momentum of the halo, and once formed the disk grows gradually through continuous in-situ star formation with longstanding gas accretion processes (e.g. Fall & Efstathiou, 1980; Mo et al., 1998; Dutton et al., 2007).
Large surveys of multiband photometry have further established that the morphology of galaxies is closely related to their colors, in the sense that spirals are usually blue and ellipticals are predominantly red (e.g. Strateva et al., 2001; Baldry et al., 2004; Bell et al., 2004; Conselice, 2006; Schawinski et al., 2014). As blue colors are indicative of ongoing/recent star formation, this relation indicates that the quenching of star formation in galaxies may be accompanied with structural transformation. Simulations have long shown that major majors of two spiral galaxies could end up with an elliptical galaxy with no/weak cold gas and star formation (e.g. Hopkins et al., 2006). On the other hand, however, major mergers of spirals could also produce a disk galaxy provided that the initial gas fraction of the progenitors is high (e.g. Springel et al., 2005; Robertson et al., 2006; Hopkins et al., 2009; Athanassoula et al., 2016; Sparre & Springel, 2017). More recent simulations have also suggested a non-merger origin of both elliptical and spiral galaxies (e.g. Dekel & Burkert, 2014; Zolotov et al., 2015), where a blue “nugget” is firstly formed by the compaction of a highly disturbed disk due to violent disk instability and then converted to a red “nugget” due to a fast quenching process, which may or may not grow a red disk or ring-like structure by dry mergers.
The existence of a population of red (passive) spiral galaxies has further complicated the situation. In contrast to the monotonic color-morphology relation, these galaxies present spiral features but are red and quenched. Since the first reported case by van den Bergh (1976), many studies have been carried out in searching for such strange galaxies and also in understanding their origins(e.g. Dressler et al., 1999; Poggianti et al., 1999; Goto et al., 2003). Thanks to large photometric and spectroscopic surveys such as the Sloan Digital Sky Survey (SDSS,York et al. 2000), our understanding of red spiral galaxies have significantly advanced in the past decade (e.g. Skibba et al., 2009; Bundy et al., 2010; Masters et al., 2010; Robaina et al., 2012; Tojeiro et al., 2013; Fraser-McKelvie et al., 2018). From these studies, it is generally established that red spiral galaxies are distinct from their blue counterparts in many aspects. Compared to blue spirals, basically, red spirals have more concentrated light distribution (Bundy et al., 2010) and an enhanced fraction of bars (Masters et al., 2010; Fraser-McKelvie et al., 2018; Guo et al., 2020), and they are found preferentially in environment of intermediate densities and dominated by LINER-like emission (Masters et al., 2010). Their red colors are real, thus truly reflecting the passive nature of the galaxy, but not due to dust reddening (e.g. Tojeiro et al., 2013).
Recently, Guo et al. (2020) selected a sample of massive red spiral galaxies from SDSS DR7(Abazajian et al., 2009) with M⊙, and made comparisons with reference samples of blue spirals and red ellipticals of similar masses. Using SDSS single-fibre spectra and optical imaging data, the authors found that the red spirals are more similar to red ellipticals than the blue spirals in many global parameters. In a companion work, Hao et al. (2019) made use of the integral field spectroscopy from the Mapping Nearby Galaxies at Apache Point Observatory (MaNGA; Bundy et al., 2015), and analyzed the spatially resolved stellar population properties for a subset of galaxies in Guo et al. (2020). The similarity between red spirals and red ellipticals was confirmed in terms of global measurements of stellar population properties including stellar age, metallicity and -element abundance, although differences are seen in stellar kinematics in the outer regions.
In this paper we extend the work of Hao et al. (2019) by estimating the star formation history (SFH) of their galaxies. Our analysis is based on the spectra fitting code, Bayesian Inference of Galaxy Spectra (BIGS, Zhou et al. 2019), which makes use of the full spectra fitting approach to constrain various stellar population properties. In our previous works, we have extensively tested the robustness of the code (Zhou et al., 2019), and successfully applied it to MaNGA data to constrain the SFHs of low-mass galaxies in the local Universe(Zhou et al., 2020). SFHs from BIGS will provide direct evidences about the origins and formations of red spiral galaxies. In addition, the spatially resolved spectroscopy from MaNGA allows us to study the spatial variations of the SFH within individual galaxies, thus providing additional constraints on how the galaxies have grown. Moreover, MaNGA galaxies have complete photometry measurements including both optical photometry from SDSS and UV fluxes from the Galaxy Evolution Explorer (GALEX, Martin et al. 2005), accompanying the NASA Sloan Atlas catalogue 111http://www.nsatlas.org/(NSA, Blanton et al. 2005). This data allows us to select truly quenched spiral galaxies, and make comparisons with the optically selected red spirals as studied in Guo et al. (2020) and Hao et al. (2019).
The paper is organised as follows. In §2 we present the data used in the analysis, including the sample selection process and a brief introduction to the MaNGA data used in this work. Our results are presented in §3, discussed in §4, and summarized in §5. A standard CDM cosmology with , and =70 km s-1Mpc-1 is assumed throughout this work.
2 data and analysis
2.1 MaNGA data
MaNGA is one of the three core programs of Sloan Digital Sky Survey IV (SDSS-IV Blanton et al., 2017)), aiming at obtaining spatially resolved spectroscopy for 10,000 galaxies in the low- Universe () . MaNGA targets are selected from the SDSS with stellar mass in the range (Yan et al., 2016a; Wake et al., 2017). Targets in the “Primary” and “Secondary” samples are each covered out to either 1.5 or 2.5 effective radius() (Law et al., 2015). The targets are observed with the Sloan 2.5 m telescope (Gunn et al., 2006) with the two dual-channel BOSS spectrographs(Smee et al., 2013), which provide high resolution (, Drory et al. 2015) spectra in the wavelength range Å. Raw data of MaNGA are reduced with the official data reduction pipeline(DRP, Law et al. 2016) to produce sky-subtracted, spectrophotometrically calibrated spectra that are ready for scientific studies. Flux calibrations of MaNGA spectra are better than for most of the wavelength ranges (Yan et al., 2016a, b). In addition, data products including stellar kinematics, emission line properties and spectral indices are provided by the MaNGA Data Analysis Pipeline (DAP, Westfall et al., 2019; Belfiore et al., 2019). The MaNGA DRP and DAP data have been released in SDSS/DR15 (Aguado et al., 2019) for 4,621 unique galaxies.
2.2 Sample selection
In a recent work, Guo et al. (2020) has constructed a sample of massive red spirals, as well as samples of massive ellipticals and blue spirals, from the SDSS main galaxy sample. We take their samples and match each sample with the sample of MaNGA. This gives rise to three samples of massive galaxies (), respectively including 22 red spirals, 49 blue spirals and 158 red ellipticals. The reader is referred to Guo et al. (2020) for details about the selection criteria of the different types. In short, massive galaxies with stellar masses larger than from the SDSS DR7 (Abazajian et al., 2009) are selected in the first place, and are divided into spirals and elliticals according to morphological classifications taken from the Galaxy Zoo I project (Lintott et al., 2011). Each galaxy in samples of both spirals and ellipticals was then classified to be blue or red according to optical color (corrected for dust attenuations), for which model magnitudes estimated from a single Sérsic profile were adopted (Blanton et al., 2011). During this selection process, galaxies either with minor-to-major axis ratio or visually inspected to be edge-on are excluded so as to minimize the effect of dust attenuation and to ensure correct disk-bulge decomposition.
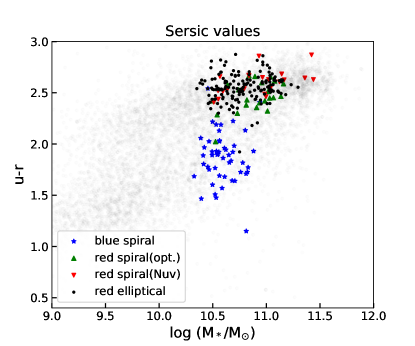
The left panel of Figure 1 displays the galaxies of the three classes in the plane of (Sérsic model) versus . To keep consistency with MaNGA which selected targets from NSA, we use model magnitudes and stellar masses also from the NSA. When compared to the official SDSS photometric catalogs, the NSA is expected to provide better measurements for sizes and luminosities of nearby large galaxies, as the SDSS imaging were reprocessed with substantial improvements in both background subtraction and de-blending (Blanton et al., 2011). The colors and stellar masses from NSA are slightly different from those used in Guo et al. (2020), where the colors were taken from the SDSS photometric catalogs and the masses were from Mendel et al. (2014). This is why the stellar mass of some galaxies fall slightly below the mass limit of , and a few red spirals/ellipticals fall in the region of blue spirals. For the majority of the galaxies, however, the color classification is consistent with Guo et al. (2020).
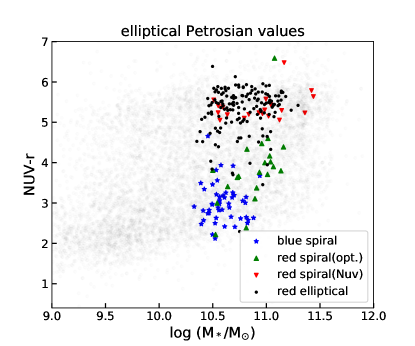
When visually inspecting the optical image of the red spirals, we found that many of them have quite significant color gradients: the outer regions generally look bluer, which hints that those galaxies may not be totally quenched. This echoes the early work by Cortese (2012) who found optically-selected passive spirals in Masters et al. (2010) presented significant star formation and emission. In the right-hand panel of Figure 1, we plot the three samples of galaxies in the plane of color versus . It is known that the color is more sensitive to the residual cold gas and weak star formation in galaxies, when compared to optical colors. It is seen that the blue spirals are mostly blue with , but some of the red ellipticals fall in the “green-valley” regime with . In agreement with Cortese (2012), all the optically-selected red spirals in our sample are actually green or even blue with in this diagram. The comparison between the and colors highlights the necessity of using near-ultraviolet instead of optical colors for selecting fully quenched galaxies. We thus select an additional sample of massive red spirals on the versus diagram. We make use of the morphology classification from Domínguez Sánchez et al. (2018), in which the morphology type of a galaxy is indicted by its -type number: with T-type0 for early-type galaxies (ETGs), T-type0 for late-type galaxies (LTGs). We also exclude edge-on galaxies by both using and visually examining the SDSS images. We obtain a sample of 20 -selected red spiral galaxies with -type0, and M. In what follows, this sample is referred as “red spirals (NUV)”, and the 22 red spirals selected above from the color is referred as “red spirals (opt.)”.
Again, to keep consistency with MaNGA, we have adopted elliptical Petrosian magnitudes instead of Sérsic magnitudes to define the color, as MaNGA uses elliptical Petrosian measurements of effective radius (Re) and flux for sample selection (see Wake et al. 2017 for details). We have examined our samples on the versus mass diagram using Sérsic magnitudes, finding the optically-selected red spirals to be slightly redder but still falling in the green-valley area. Locations of other samples of galaxies including the -selected red spirals remain unchanged. The redder with Sérsic magnitudes can be understood as a combined effect of two facts: on one hand the Sérsic model covers an effective radius () that is smaller than the Petrosian model, and on the other hand galaxies typically present a negative color gradient with redder colors at smaller radii. In addition, we have examined the morphology type from Galaxy Zoo for the -selected red spirals, and confirmed that they indeed present spiral feature in their SDSS image, though weak in most cases. Therefore, our results to be presented in the next section are not affected by the choice of magnitude definition or morphology classification method.
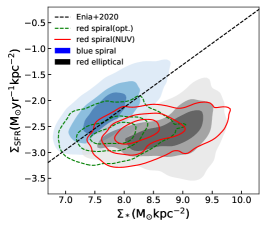
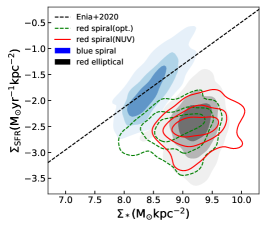
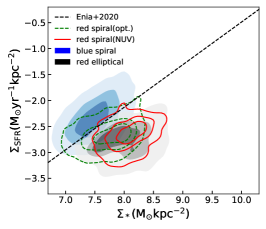
Figure 2 shows the star formation rate surface density () against stellar mass surface density () for the four samples. For this, we use H flux measurements from MaNGA DAP and a conversion factor of: from Kennicutt (1998) to estimate the current star formation rate of a given spaxel in our sample galaxies. The stellar mass measurements are estimated from the MaNGA spectra by Li et al. (2020), by applying a stellar population synthesis code with BC03 stellar population models and assuming a Chabrier IMF. Results of all spxels from the different samples are shown in the left panel of the figure. As expected, the blue spiral galaxies well follow the resolved star-forming main sequence, indicated by the black dashed line from Enia et al. (2020), while the red ellipticals mostly fall below this sequence. A non-negligible fraction of spaxels from optically selected red spirals are still forming stars, while the -selected red spirals are almost quenched entirely, occupying similar regions to the red ellipticals. These trends are well consistent with the global color as seen in the previous figure. It is remarkable that the star forming spaxels from red spirals (Opt.) are mostly from low surface mass density regions. When examining the central (0.5, the middle panel) and outer (1.0, the right panel) regions separately, we see that the low surface mass density regions are mostly located in the outer region, while the central high density regions of all types of red spirals are almost quenched. In what follows, we will investigate the underlying stellar populations and their formation histories for the different types of galaxies in more detail.
2.3 Spectral analysis
We estimate the stellar population properties of galaxies in our samples using BIGS, Bayesian Inference of galaxy spectra, which is a Python spectral fitting code developed in our previous paper Zhou et al. (2019). This code has been applied to MaNGA data to constrain stellar initial mass function (IMF) in elliptical galaxies (Zhou et al., 2019) and star formation history (SFH) of low-mass galaxies (Zhou et al., 2020). Here we briefly describe the process of applying this code to the samples of massive galaxies as selected above. We refer the reader to our previous papers for a more detailed description of the fitting algorithm and tests.
For a given galaxy, we take all the spaxels within 1.5 and divide them into five radial bins with a fixed width of 0.3, according to their elliptical annuli radii given by MaNGA DAP. Spectra in a common radial bin are then stacked following the approach in Zhou et al. (2020) to achieve enough signal-to-noise ratio (SNR) required by subsequent analysis. The correction term given by Westfall et al. (2019) is used to account for the covariance between spaxels. In our sample, the SNR (averaged over all wavelengths for a given spectrum) of the stacked spectra is typically above 100 per Å in the innermost radial bin, and decreases to around 40 per Å in the outermost bin. In addition, the SNR depends on wavelength in the sense that the SNR is highest at around 6500Å, decreasing slightly towards both shorter and longer wavelengths. Each of the stacked spectra is firstly fitted using a simple spectral fitting code developed in Li et al. (2020), giving rise to an estimate of the stellar velocity dispersion () that accounts for effects of both stellar kinematics and instrumental resolution. Emission lines in the spectrum are identified in this procedure, and are masked out in the following stellar population synthesis modelling. The wavelength range 6800-8100 Å with known mismatchments between template and observed continua is also masked out following (Zhou et al., 2020).
We then model the stellar component of each stacked spectrum with the following stellar population synthesis approach. To begin with, the stellar initial mass function of Chabrier (2003) and a specific star formation history (SFH, see below) are adopted. The SFH model is combined with the E-MILES (Vazdekis et al., 2016) SSP templates and a simple screen dust model (Charlot & Fall, 2000) to generated composited model spectra, which are then convolved with the stellar velocity dispersions derived above to account for kinematic and instrumental broadening effects. The model spectra are then compared with the observed spectrum to calculate the likelihood for a given set of model parameters ():
| (1) |
where is the flux at the -th wavelength point as predicted for the parameter set , is the flux at the same wavelength in the stacked spectrum, and the total number of wavelength points. The matrix is the covariance matrix of the data, which in this case is diagonal and specified by the error vectors produced in the stacking procedure. BIGS utilizes the MULTINEST sampler (Feroz et al., 2009, 2013) and its Python interface(Buchner et al., 2014) to sample the posterior distributions of the model parameters and derive the Bayesian evidence.
The purpose of this study is to reveal the SFH of the different types of massive galaxies. To the end, we consider three different models to characterise the SFH of our galaxies: the model, the +B model and the stepwise model, are used to characterise the SFHs of the galaxies. The model simply uses a function to describe the star formation rate as a function of cosmic time:
| (2) |
where is the present-day time, is the look back time, and . The +B model is a model plus an additional burst characterised by a SSP, where the time of the burst is a free parameter. The stepwise model describes the SFH in a non-parametric way, using the average star formation rates in 7 time intervals over the whole history of star formation. Specifically we adopt the following time intervals: , , , , , and Gyr.
In addition to the spectral fitting approach, we also make use of absorption and emission line features that are sensitive to star formation. We use (the spectral break at 4000Å), (H) (equivalent width of the H absorption line), (the Mg-to-iron abundance ratio), and (H) (equivalent width of the H emission line) derived by the MaNGA DAP. Moreover, we have derived stellar dust attenuation maps as quantified by using the method developed by Li et al. (2020) for our galaxies. These parameters provide independent and complementary probes of recent SFHs, in addition to the SFH constrains derived from the spectral fitting.
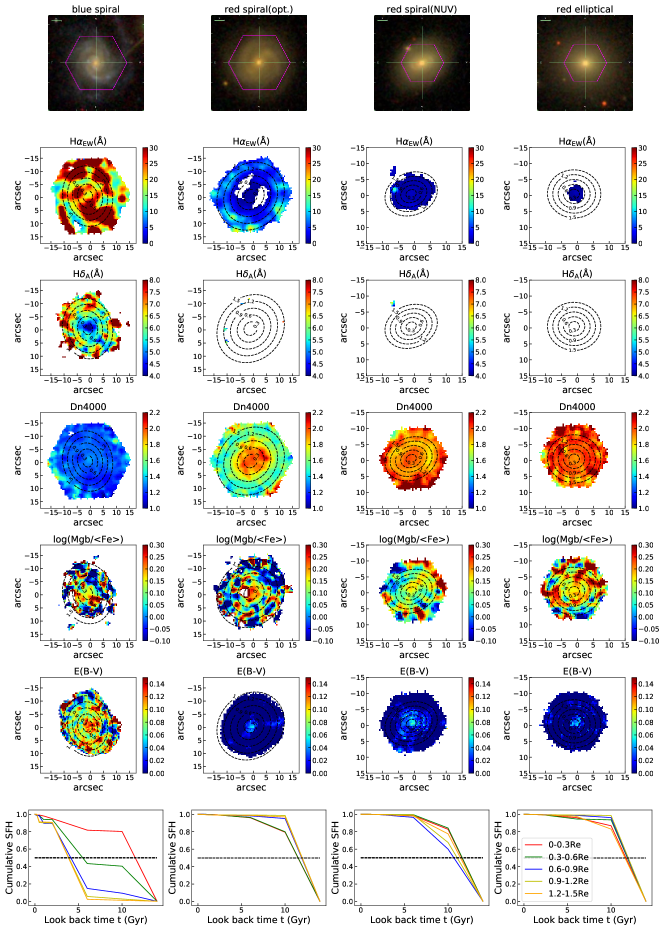
Figure 3 shows the stellar parameters and the SFH for four typical galaxies in our sample, each selected from one of the four samples. Their SDSS images are shown in the top row, with the hexagonal IFU of MaNGA indicated. The blue spiral galaxy in the left-most column shows high values of (H) and and low values of with relatively weak radial gradients, indicative of ongoing star formation and young populations across the whole galaxy. In contrast, the elliptical galaxy in the rightmost column shows no/weak H emission and H absorption, and small everywhere, indicating that the entire galaxy is fully quenched and dominated by old populations. The -selected red spiral (the third column) looks similar to the elliptical in all the parameters. The optically-selected red spiral (the second column) is similar to the blue spiral in the outskirts, while its inner region look similar to the elliptical and -selected red spiral. This is consistent with the versus mass diagram where the optically-selected red spirals fall in between the red and blue populations (see Figure 1). The bottom panels show the cumulative SFHs constrained with BIGS for the stepwise model. It is interesting to see that both the optically-selected and -selected red spirals present quite similar SFHs to the elliptical galaxy, in which a substantial fraction of the present-day stellar mass in the galaxies were formed at early times. In contrast, the blue spiral galaxy shows early formations only in the innermost region (), and the outer regions show much extended SFHs. In the following section we will present the statistical behaviors of the SFHs and stellar population parameters for our samples.
3 Results
3.1 Star formation histories
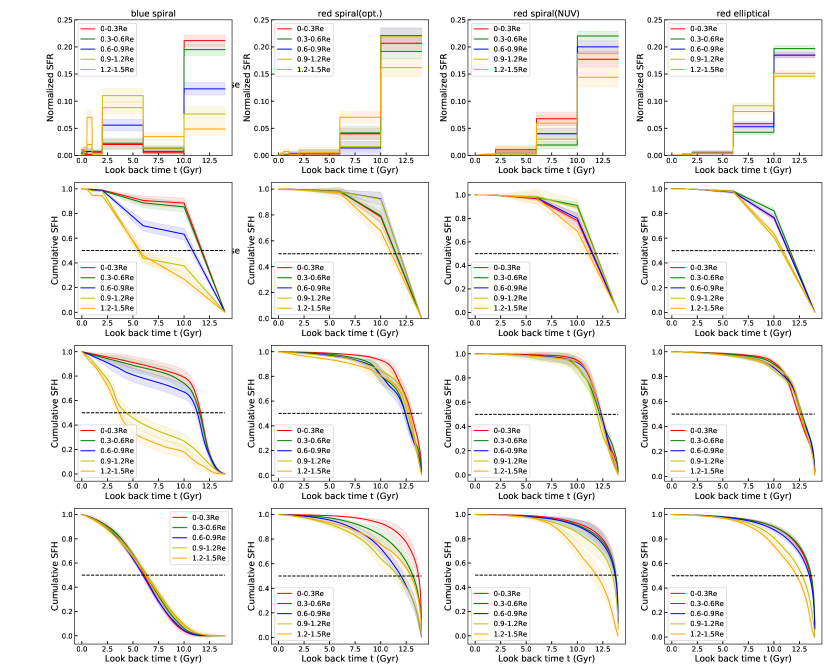
We obtain the best-fit SFH for different radial bins of each galaxy in our sample from the posterior distribution of the model parameters, produced by BIGS as described above. The results are shown in Figure 4, where we show the median SFH in each of the five radial bins for the four types of galaxies (panels from left to right): blue spirals, red spirals (opt.), red spirals (NUV) and red ellipticals. For each type, we show in the top panel the differential SFH in seven time intervals from the stepwise model, and the cumulative SFHs from the stepwise model, the +B model and the single model in the lower panels. It is seen that for red ellipticals and red spirals (both optically- and -selected), the majority of the current stellar mass were formed in the oldest time bin (Gyr), which contributed a fraction of mass as high as 80-90% at the smallest radius and % in the outskirt of galaxies. The intermediate time interval (6-10Gyr) contributes the rest % in the smallest radial bin and the rest % in the outskirt. The three types of galaxies have been almost fully quenched in the past 6Gyr, contributing at most only a few percent of the total stellar mass. The results appear to be hold regardless of SFH models. The stepwise and +B models give quite consistent results, while the single model produces similar results in the inner regions but requires slightly extended SFHs in the outer regions of the galaxies. When compared to -selected red spirals, optically-selected red spirals show subtle residual star formation in the recent 2Gyr in the outermost bin(1.2-1.5Re, see the top panels of the figure). This result is consistent with the bluer colors and weak H emissions as seen in the outer regions of their SDSS image and MaNGA datacubes (mostly in their spiral arms). Overall, one can conclude that both red spirals and ellipticals are formed at early times (), with little star formation afterwards.
In contrast to red spirals and ellipticals, blue spirals show different SFHs at different radii in both stepwise and +B models, in the sense that the inner regions formed stars at earlier times and the outer regions formed stars with multiple events over a longer timescale. It is interesting that, although the outer regions of blue spirals experience extended SFH, their central regions () behave similarly to red ellipticals and red spirals, where more than 80% of the stellar mass was accumulated more than 10 Gyrs ago. When a single model is adopted, the blue spirals appear to have formed their stars with a quite extended history that is independent of radius, with half of the total mass formed at Gyr, % in the recent 2Gyr and nearly no stars older than 10Gyr.
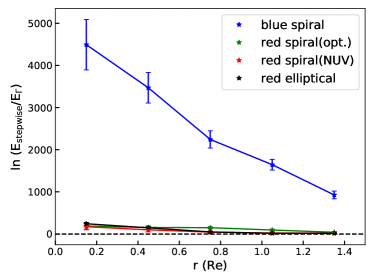
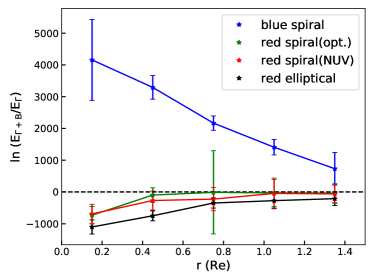
In the Bayesian context, the Bayesian evidence ratio represents the posterior probability for two competing model families, and can thus serve as a discriminator. Figure 5 shows the evidence ratio between the stepwise and models (left) and the ratio between the +B and models (right), as function of radius. The median values of the galaxies in a given radial bin are plotted to represent the global trend, with error bars estimated from the jackknife resampling method . It is found that, for red ellipticals and both optically-selected and -selected red spirals, different SFH models give rise to comparable Bayesian evidence, indicating that the inferred SFH of the three types of galaxies are robust to the assumed functional form of SFH. Blue spirals show large evidence ratios in both panels, with larger ratios at smaller radii. This strongly suggests that a single model is unacceptable in order to describe the SFH of blue spirals, and the +B or stepwise SFH model is preferred by the data.
The three SFH models, , +B and stepwise, used in our analysis have different levels of flexibility: model can describe only one major star formation event, +B would allow an additional burst happened in the SFH, while the stepwise model can catch multiple star formation events although with poor time resolutions. The model select results clearly confirm that, similar to red ellipticals, the red spirals are very likely to have only one major star formation episode, and can be characterised by a very simple SFH model, while the star formation histories of blue spirals can be quite complicated and more flexible SFH models are needed to fit the data.
In summary, the analysis of SFHs suggest that massive red galaxies, both spiral and elliptical, are mostly formed in one major star formation episode at early universe (10Gyr ago). This result is robust against the assumed SFH models. Massive blue spirals have experienced different SFHs, with more than one major star formation episodes over a long timescale, and their SFHs cannot be correctly probed with a simple model such as the model. In addition, we have seen radial variations of the SFHs in our galaxies, which is discussed below in more detail.
3.2 Radial gradients
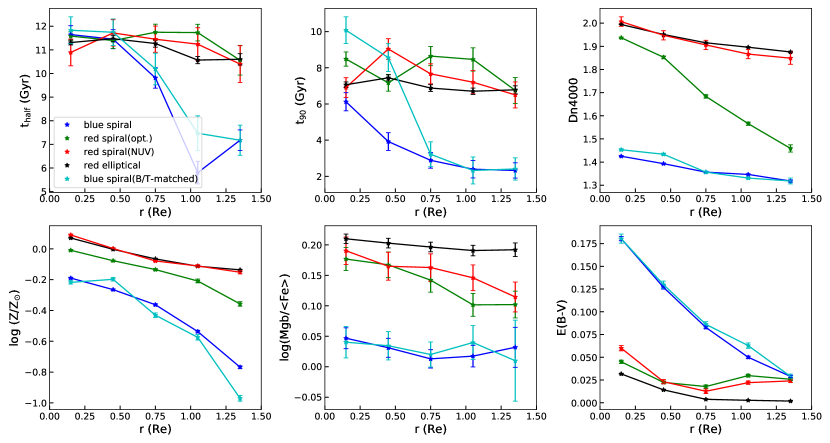
In Figure 6 we examine the radial profile of a variety of stellar population indicators. These include the half mass formation time () and 90% mass formation time (), estimated from the best-fit stepwise SFH model, as well as (the spectral break at 4000Å), stellar metallicity , (the Mgb-to-iron abundance ratio) and (the stellar attenuation as quantified by color excess). In each case, we show the median profile for each of the four types of galaxies. We see that, red spirals (both optical and ) and red ellipticals show very similar formation times, in both and and with fairly flat slopes. These galaxies form half of their mass Gyr ago, and 90% of their mass Gyr ago, consistent with what we’ve seen above from their SFHs. Differently but as expected, blue spirals show strong decrease in the formation times as one goes from inner to outer regions. The central region of blue spirals shows the same old formation time as the red galaxies, with Gyr, but slightly smaller in the same region which is Gyr compared to Gyr for the other types of galaxies.
In the top-right panel, as expected, the red ellipticals show large at all radii, with slightly negative gradient, indicative of no recent star formation over the whole galaxy area. It is interesting that the in red spirals selected in closely follows the profile of red ellipticals, while optically-selected red spirals deviate from the counterparts dramatically, showing strong decrease in with increasing radius. The index has been commonly used as an indicator of mean stellar age, and in particular a value of indicates the existence of young populations formed in the past 1-2Gyr (e.g. Kauffmann et al., 2003). As can be seen, the in optically red spirals drop below 1.6 at , implying ongoing/recent star formation in the outer regions. This is well consistent with the bluer images as seen in their color. The use of in this case provides unique constraints on the recent SFHs of our galaxies, thus is able to highlight the difference between and optical red spirals which was largely missing in the Bayesian inference of the SFHs.
The bottom left panel of Figure 6 shows the median metallicity profiles of the four types of galaxies. Similar to , the metallicity also shows high similarity between -selected red spirals and red ellipticals. Optically-selected red spirals, however, present dex lower metallicities than ellipticals and -selected red spirals at all radii up to , with an even lower metallicity at the outermost radius. Blue spirals have much lower metallicities at all radii than the other types of galaxies. This result again isolates the optically red spirals from the -selected red spirals and ellipticals. The lower metallicities in the optical red spirals but similarly old formation times may combine to imply infall of pristine gas into these galaxies which have provided fuel for recent star formation and lowered down the stellar metallicity.
Moreover, in the bottom middle panel of Figure 6 we examine the radial profiles of , a proxy of the /Fe ratio which is often used to trace timescale of the star formation process. The abundance of -elements that are produced by core-collapse supernovae can be probed by the Mgb index, while Fe5270 and Fe5335 indices trace the abundance of Fe generated in type Ia supernova (e.g. Zheng et al., 2017). As the explosion of type II supernova happens almost simultaneously with the star formation events, while low mass stars which are progenitors of type Ia supernova need longer time to evolve, the relative abundance of -elements and Fe can thus characterise the relative importance of violent star burst events and low-level continuous star formations. It is seen from the figure that red ellipticals have the largest , i.e. being -enhanced throughout the galaxy, an effect that has been known for decades (e.g. Worthey et al., 1992). This suggests a very short timescale for the formation of red ellipticals. The -selected red spirals and optically-selected red spirals have similar , in terms of both amplitudes at given radius and the radial slope. At given radius, both types of red spirals also show large values of , which are slightly smaller when compared to red ellipticals. This indicates similarly short (though slightly longer) formation timescales for red spirals, compared to red ellipticals. The negative radial gradients in red spirals imply a faster formation process in central regions than in the outskirt. Blue spirals show lowest at all radii and little gradient, consistent with the extended star formation history as inferred from the spectral fitting with BIGS.
Finally, the bottom right panel of Figure 6 shows the radial profile of the median dust attenuation parameter for the four types of galaxies. As one can see, the two types of red spirals and the red ellipticals have very little dust attenuation, with at all radii, confirming that the red colors of these galaxies are real, but not an observational effect of dust attenuation. Blue spirals show strongly negative profile in , with stronger attenuation than the other types of galaxies at all radii except the outermost bin.
In summary, all the radial profiles shown in Figure 6 point to a simple conclusion that, at least up to 1.5, both and optical red spirals are similar to red ellipticals in the sense that these galaxies form the majority of their stars at early times with relatively short formation timescales. Once formed, red ellipticals and -selected red spirals keep quenched, while optically-selected red spirals have residual star formation occurring in their outermost regions during later times. Blue spirals, in contrast, have an old center formed at similarly early times, but have been accumulating their disks over longer time-scales, with an extended star formation history.
4 Discussion
4.1 Difference between optically and -selected red spirals
We find red spirals selected by optical colors and -optical colors behave differently in terms of present-day stellar populations, with the former having significantly younger populations in the outskirts and slightly lower metallicity at fixed radius. This makes the optically-selected red spirals fall in the green-valley region or even blue-cloud region in some cases in the color-mass diagram (see Figure 1). The young populations in optically-selected red spirals imply recent/ongoing star formation, which can be seen from their SFHs (the second panel in the top row of Figure 4). This is also consistent with recent works which found a large fraction of atomic gas mass in optically-selected passive galaxies (e.g. Zhang et al., 2019; Guo et al., 2020), as well as earlier works which found optically-selected passive spirals are not truly passive, but forming stars at a significant rate (Cortese, 2012). In contrast, truly passive spirals like the -selected red spirals in our sample are expected to be gas poor, in terms of both atomic gas (e.g. Cortese, 2012; Cortese et al., 2020) and molecular gas (e.g. Luo et al., 2020). Cross-matching our samples with the ALFALFA-SDSS catalogue (Durbala et al., 2020), we found 11 blue spirals, 6 red spirals (opt.), 2 red spirals (NUV) and 1 red elliptical in our sample to have Hi detections, with a mean Hi to stellar mass ratio of 0.19, 0.15, 0.08 and 0.13 for the four types of galaxies. Although the sample sizes are rather small, these numbers are in broad agreement with previous findings that the Hi detection rate is higher in optically selected red spirals compared to truly red spirals like the -selected sample studied here.
Despite the differences in present-day stellar populations, it is interesting that the two types of galaxies are very similar in terms of star formation history: both formed the majority of stars at early times (see Figure 4). It is unclear whether the two types of galaxies have any evolutionary relationship. -selected red spirals could be evolutionary remnants of optically red spirals, or optically red spirals may be rejuvenated from the -selected ones. The latter case is preferred by our results, considering that the quenching of their star formation happened at early times, and that we do not see any residual stellar populations in recent 2 Gyrs in -selected red spirals as revealed by the index.
Apparently, the selection scheme has significant impacts on the sample properties. Selecting red spiral galaxies with optical colors, as done by Guo et al. (2020) and many other studies, may give rise to a sample extending to green or even blue colors, thus including star forming galaxies with a signficant Hi gas fraction. In contrast, the -based selection can reliably select truly red spiral galaxies, although the optically-red galaxies are interesting by themselves and deserve more dedicated studies in future.
4.2 Comparison with previous results
Due to their red colors but spiral features, the population of red spiral galaxies has attracted increasingly more attention in the past decade. Most of the previous studies have used the single-fiber spectroscopy from SDSS, thus limited to the central 1-2kpc of low-z galaxies, although the samples were selected by global colors (mostly in the optical). For instance, using morphology classifications from the Galaxy Zoo project(GZ), Masters et al. (2010) identified a sample of red spirals from SDSS according to color, and found the red spirals generally have larger and lower H compared to blue spirals, indicative of reduced recent star formations in red spirals. Tojeiro et al. (2013) investigated the star formation histories of galaxies of different morphology types, finding recent decline of star formation in red spirals. Similar results were obtained by Robaina et al. (2012) who found quiescent spirals and elliptical galaxies to present similar stellar population properties. Our estimates of the SFHs are in good agreement with these previous studies, but additionally reveal the dominating contribution of the star formation at early times as well as the radial variation out to large radii. At high redshifts, Bundy et al. (2010) studied a sample of passive spiral galaxies at from the COSMOS survey, and found the passive spirals to be unlikely the descendants of star-forming disk galaxies formed at higher redshifts. In our work, we also find that the (-selected) red spiral galaxies resemble red ellipticals in many aspects including the SFH, metallicity, -element abundance and stellar dust attenuation. On the other hand, blue spirals behave quite differently than both red spirals and ellipticals. These results strongly imply that massive red spirals have followed a distinct evolutionary path when compared to their blue counterparts, and that they may share the same formation and evolution process(s) with elliptical galaxies.
Our optically-selected samples are taken from Guo et al. (2020) who used SDSS data to study the spectroscopic and structural parameters in the central region of these galaxies. It was found that the massive red spirals have large and [Mgb/Fe] in their centers, similarly to massive red ellipticals. In addition, the central bulge of massive red spirals followed the same relation as quenched galaxies of similar masses, where is the surface mass density within central 1kpc. A large fraction (70%) of the massive red spirals had strong bars, ring or shell-like structures, or merging features in their image. A similarly high fraction of bars has also been found in other studies (e.g. Masters et al., 2010; Fraser-McKelvie et al., 2018). As pointed out in Guo et al. (2020), these results combined suggest that, like massive red ellipticals, the bulge of massive red spirals may be formed before with a short timescale, and interactions/mergers might have played an important role. In a companion paper, Hao et al. (2019) examined the radial profiles of stellar population parameters, including [Mgb/Fe] from MaNGA DAP, as well as metallicity and age estimated by Sánchez et al. (2018) from the MaNGA spectra by applying the spectral fitting pipeline Pipe3D (Sánchez et al., 2016). The massive red spirals showed profiles in those parameters similar to those of massive ellipticals.
As shown in Figure 6, the main results in Hao et al. (2019) are well reproduced using our own spectral fitting pipeline BIGS. We note that the metallicity gradients in Hao et al. (2019) appear shallower than ours for both blue and red spirals. Recently, Lacerna et al. (2020) and Lian et al. (2018) also estimated metallicity gradients using MaNGA data, respectively for massive ellipticals and disk galaxies. Our measurements are consistent with theirs. The differences between our measurements and those used in Hao et al. (2019) may likely be attributed to the different spectral fitting pipelines used in deriving the metallicities. In addition, we have selected a new red spiral sample according to instead of . It is interesting that the -selected red spirals are almost identical to the red ellipticals, not only in radial profiles (also see Figure 6) but also in SFHs (see Figure 4). This surprisingly high degree of similarity reinforces the conclusion that massive red spirals, if truly “red” (e.g. ), indeed share the same stellar populations and SFHs as massive red ellipticals. Thus, our result implies that the two types of galaxies may share some common formation and quenching processes. On the other hand, however, this implication should not be overemphasized given the limited size of our samples.
4.3 Implications for the formation of massive red spirals
The different SFHs found between massive blue spirals and massive red spirals in our sample strongly suggest that massive spirals are not formed in a simple way. Rather, they are divided into two distinct populations in terms of formation and evolution paths: massive red spirals that form at early time with a fast formation process similar to the formation process of massive ellipticals, and massive blue spirals that form their centers also early but with extended star formation occurring in the disk over a long time. One may naively assume massive red spirals are evolved remnants of massive blue spirals, an idea that can be ruled out by the totally different SFHs of the two types of galaxies as found in our work. Indeed, the results in Hao et al. (2019) and Guo et al. (2020) led to the same conclusion, while the SFHs obtained from the Bayesian analysis in the current work make it more solid and convincing.
Our analysis has revealed early formation times (10Gyr ago) for the stellar populations in both red spirals and ellipticals with . Such a high level of similarity strongly suggests that massive red spirals probably share a common formation process with massive ellipticals. In galaxy formation theories, the structural and kinematic properties of a galaxy is predominantly determined by the acquisition and distribution of angular momentum (e.g. Danovich et al., 2015). Basically, elliptical galaxies form by losing angular momentum, while disk galaxies form by preserving and redistributing angular momentum. In the later case, a disk galaxy is assumed to form in the host dark matter halo with considerable fractions of the mass and angular momentum of the halo, and once formed the disk will grow continuously by converting gas into stars, a secular evolution process that extends over a long timescale and is not associated with mergers (e.g. Fall & Efstathiou, 1980; Mo et al., 1998; Dutton et al., 2007). Massive blue spirals seem to follow this scenario for their extended SFH in the outer disk. However, the early formation time of their central region implies that massive blue spirals may also form the majority of their stars at the same times as their red counterparts, but continuous gas infall and star formation (especially in the disk) at later times have made the whole galaxy blue, dusty, and dominated by young and metal-poor stars that have relatively small amount of elements. In this case, our results appear to reveal a simple picture for massive galaxies as a whole, in which most (if not all) of the massive galaxies in the local Universe formed the majority of their stars at early times (Gyr ago, or ) with a short formation process, although the formation process may or may not be the same for different types of massive galaxies.
In fact, the formation of disk galaxies at early times has been well established with the help of hydro-dynamic simulations, which can be mainly divided into two distinct cases. In one case, major mergers of disk systems may produce both ellipticals or spirals, depending on the gas fraction of the progenitors (e.g. Springel et al., 2005; Robertson et al., 2006; Hopkins et al., 2009; Athanassoula et al., 2016; Sparre & Springel, 2017). In this case, mergers of disk galaxies with a small gas fraction produce elliptical galaxies. In case of gas-rich mergers, a rotating bulge is formed in the first place by rapid gas infall and star formation as driven by tidal torques, followed by the formation of a star-forming disk through cooling and settling of the remaining gas, which typically takes a timescale of Gyr (e.g. Springel et al., 2005). The slightly negative [Mgb/Fe] gradient as seen in the massive spirals in our sample supports a later formation time of the disk compared to the central region (see the bottom-middle panel in Figure 6). Gas-rich mergers are expected to happen frequently only at high redshifts when cold gas is substantially locked in/around galaxies. The formation redshift of or higher as suggested by our analysis is known to be the cosmic epoch with highest densities of star formation rate and black hole accretion rate, which are largely triggered by galaxy-galaxy mergers.
On the other hand, however, simulations have also suggested a non-merger origin of elliptical and red spiral galaxies at high redshift (e.g. Dekel & Burkert, 2014; Zolotov et al., 2015). In this case, a gas-rich, star-forming but highly perturbed disc is formed in the first place, and the dissipative, quick compaction of the gas disc leads to the formation of a compact, blue “nugget”, which is quickly converted into a compact, red “nugget” due to fast quenching of star formation. Later on, the galaxy may gradually grow and extend by dry mergers, possibly developing a new disc or a surrounding ring-like structure. The galaxy formed this way should have an old center and a late-type morphology, with either red or blue colors depending on how dry the gradual growth process is. This formation process may be applicable to the massive red spirals in our sample, as long as the outer disk is quenched also quickly so as to have similar SFHs across the whole galaxy. In Zolotov et al. (2015), however, although high-mass galaxies tend to compactify and quench rather efficiently, their overall SFR quenching rate within 10kpc is slower than the inner quenching during the post-compaction phase. This appears to imply that the picture of compaction formation is unlikely the best model for massive red spirals. On the other hand, however, as one can see from Figure 4, the SFH indeed vary from radius to radius, and the outer regions get fully quenched later than the central region by a few Gyr. Therefore, there is still room for the compaction model and measurements of SFH with better time resolution would be needed if one were to discriminate the model.
Guo et al. (2020) suggested that massive ellipticals were formed through compaction of gas-rich disks, while massive red spirals were formed by gas-rich major mergers. The progenitors in both processes are gas-rich disk galaxies which dominate the galaxy population at high redshifts. Therefore, the scenario suggested by Guo et al. (2020) provides a plausible picture, considering our result that both types of galaxies were formed at early times. As discussed above, however, ellipticals could also be formed by relatively gas-poor major mergers, while red spirals could also be formed by compaction of gas-rich disks followed by growth of a surrounding disk during the post-compaction phase. These cases may not play dominating roles, but none of them can be simply ruled out by current data. It is thus likely that, the different formation mechanisms work together, but contributing to varying degrees depending on the detailed properties of the progenitor galaxies (e.g. gas content, angular momentum, merger rate, etc.). More works are needed in future to better determine the relative roles of different mechanisms for different types of galaxies.
Our SFH measurements have revealed little evolution in both ellipticals and red spirals in the past Gyr, and relatively weak evolution at intermediate times (Gyr ago, see Figure 4). It is natural to ask how those red spirals have been able to keep themselves quenched ever since formation. In the literature a number of quenching mechanisms have been suggested, such as morphology quenching as originally proposed by Martig et al. (2009), bar quenching as recently studied in detail with numerical simulations (e.g. Spinoso et al., 2017; Khoperskov et al., 2018), quenching due to high angular momentum of infalling gas (e.g. Peng & Renzini, 2020), and AGN feedback (e.g. Luo et al., 2020). It is beyond the scope and capability of our work to discriminate these mechanisms, but we have done a simple test on the mechanism of morphology quenching. We select a subset of the blue spirals in our sample by requiring the distribution of bulge-to-total stellar mass ratio () to be closely matched with that of the optically selected red spirals, and we show the radial profiles of stellar population properties of this subsample as cyan lines/symbols in Figure 6. As one can see, when matched in with the red spirals, the blue spirals remain unchanged in all the profiles except the profile of (the 90%-mass formation time), which becomes significantly steeper within Re, with early formation times in the galactic center that are comparable to the red galaxies. This indicates that the early formation times found in the center of blue spirals as a whole are largely contributed by the subset of galaxies with early-formed bulges. The different formation times and populations in the outer regions between blue and red spirals, which are held even when is closely matched, imply that the central bulge is unlikely to take effect in all systems. On the other hand, however, the median result presented here can not rule out the possibility that some of those systems have been affected by their central bulges. Obviously, more investigations are needed, both observationally and theoretically, to fully understand the quenching mechanism for massive red spiral galaxies.
Finally, environment effects cannot be ignored when studying galaxy evolution. For red spirals, Masters et al. (2010) found that the fraction of red spirals peaks in intermediate density regimes, but environment alone is not enough to make the galaxies red. Here, we have made use of the Galaxy Environment for MaNGA Value Added Catalog (GEMA-VAC,Argudo-Fernández et al. 2015) to examine the environment of our sample galaxies. For each galaxy in the MaNGA, the GEMA-VAC adopts the SDSS galaxy group catalogues from Yang et al. (2007) to classify the galaxy as either the central and a satellite galaxy in its host group, and also provides the average local density within 1Mpc of the galaxy. We find the different types of galaxies in our sample to show similar central/satellite fractions, as well as similar dentities of the local environment. This implies that environment is unlikely to play important roles in regulating the SFHs of our galaxies. However, again, this result should not be overemphasized due to the relatively small size of our samples. More works with larger samples are needed in future.
5 Summary
In this paper we investigate the SFH of massive red spiral galaxies with stellar mass by analyzing the MaNGA spectra with our Bayesian inference code BIGS. We consider two sample of red spirals, selected by color index of or , as well as comparison samples of blue spirals and red ellipticals that have similar masses to the red spiral galaxies. The spatially resolved spectra from MaNGA of each galaxy are divided into five radial bins, and those in each radius are stacked to achieve high enough SNR. We apply BIGS to fit the staked spectra, using three different functional forms to model the star formation history, as well as constraining their present-day stellar population properties.
Our main results can be summarized as follows:
-
•
Our best-fit SFHs reveal that massive red spirals and red ellipticals have very similar star formation histories : they formed more than half of their stellar mass at least 10 Gyr ago and more than 90% of their stellar masses at least 6 Gyr ago. -selected red spirals and red ellipticals quenched almost entirely since then, but residual star formations are seen in the outer regions of optically selected red spirals. The centres of blue spirals also already formed before 10 Gyr ago, but the outer disk formed significantly latter through extended star formation over a long timescale.
-
•
The derived SFHs are robust against the variation of the assumed SFH models. Using Bayesian model selection approaches, we confirm that the star formation history of massive red spirals and massive red ellipticals can be characterised by a simple model, which indicates that they have experienced only one major star formation episode. For massive blue spirals, in contrast, the model behaves significantly worse than the +B and stepwise models and give a very biased result, indicating more complex SFHs in those galaxies.
-
•
SFHs constrained from spectral fitting are in good agreement with those indicated by spectra features. High values and weak/no H emission are found in both -selected red spirals and red ellipticals, indicating that both types of galaxies have quenched their star formations throughout the galaxy. Optically selected red spirals have similarly high at galactic centres, but relatively low associated with detectable H emissions in the outer regions, suggesting a resident level of star formations. Massive blue spirals present low and strong H emission at all radii, indicating ongoing/recent star formation. High values are found in both red ellipticals and red spirals, consistent with their early formation and fast quenching, while the opposites are found for blue spirals.
-
•
Our results clearly show that the majority of massive red spirals, especially those selected by their color, are unlikely evolutionary remnants of massive blue spirals due to the completely different formation times and SFHs. The similar SFHs and stellar populations in massive red spirals and ellipticals imply that the stellar contents in those systems could have formed through similar processes, but more investigations with larger samples are needed in order to pin down the exact formation and evolution paths.
The success of our analysis relies on both the Bayesian inference of full spectral fitting and the integral field spectroscopy from MaNGA. However, as pointed out several times, the relatively small samples should be kept in mind when interpretating our results. Due to the small sample size, some rare but important populations may be under-represented in our samples, and environment- and gas-related quenching processes could not be examined in depth. We expect to significantly enlarge our samples by using the full MaNGA sample which will include 10,000 galaxies, thus more than two times larger than the DR15 samples used in the current work. In addition, single-fiber spectroscopy from even larger surveys such as SDSS may also help to validate our conclusions, at least on the SFH of the central region of galaxies. With much larger samples, one will be able to additionally take into account the environment and HI gas content, thus disentangle the relative roles of all potential effects. Moreover, next-generate surveys will provide large samples of spectra for studies of SFH of galaxies at , which will enble the early star formation and quenching phases of the massive red spirals to be better diagnosed. In fact, Carnall et al. (2019) have made a step forward along this line by studying a sample of massive quiescent galaxies at observed by the VANDELS survey (McLure et al., 2018). Some of those early quiescent galaxies are found to form in extreme starbursts and quenched at , consistent with the merger origin as discussed above.
References
- Abazajian et al. (2009) Abazajian, K. N., Adelman-McCarthy, J. K., Agüeros, M. A., et al. 2009, ApJS, 182, 543, doi: 10.1088/0067-0049/182/2/543
- Aguado et al. (2019) Aguado, D. S., Ahumada, R., Almeida, A., et al. 2019, ApJS, 240, 23, doi: 10.3847/1538-4365/aaf651
- Argudo-Fernández et al. (2015) Argudo-Fernández, M., Verley, S., Bergond, G., et al. 2015, A&A, 578, A110, doi: 10.1051/0004-6361/201526016
- Athanassoula et al. (2016) Athanassoula, E., Rodionov, S. A., Peschken, N., & Lambert, J. C. 2016, ApJ, 821, 90, doi: 10.3847/0004-637X/821/2/90
- Baldry et al. (2004) Baldry, I. K., Glazebrook, K., Brinkmann, J., et al. 2004, ApJ, 600, 681, doi: 10.1086/380092
- Belfiore et al. (2019) Belfiore, F., Westfall, K. B., Schaefer, A., et al. 2019, AJ, 158, 160, doi: 10.3847/1538-3881/ab3e4e
- Bell et al. (2004) Bell, E. F., Wolf, C., Meisenheimer, K., et al. 2004, ApJ, 608, 752, doi: 10.1086/420778
- Blanton et al. (2011) Blanton, M. R., Kazin, E., Muna, D., Weaver, B. A., & Price-Whelan, A. 2011, AJ, 142, 31, doi: 10.1088/0004-6256/142/1/31
- Blanton et al. (2005) Blanton, M. R., Schlegel, D. J., Strauss, M. A., et al. 2005, AJ, 129, 2562, doi: 10.1086/429803
- Blanton et al. (2017) Blanton, M. R., Bershady, M. A., Abolfathi, B., et al. 2017, AJ, 154, 28, doi: 10.3847/1538-3881/aa7567
- Buchner et al. (2014) Buchner, J., Georgakakis, A., Nandra, K., et al. 2014, A&A, 564, A125, doi: 10.1051/0004-6361/201322971
- Bundy et al. (2010) Bundy, K., Scarlata, C., Carollo, C. M., et al. 2010, ApJ, 719, 1969, doi: 10.1088/0004-637X/719/2/1969
- Bundy et al. (2015) Bundy, K., Bershady, M. A., Law, D. R., et al. 2015, ApJ, 798, 7, doi: 10.1088/0004-637X/798/1/7
- Carnall et al. (2019) Carnall, A. C., McLure, R. J., Dunlop, J. S., et al. 2019, MNRAS, 490, 417, doi: 10.1093/mnras/stz2544
- Chabrier (2003) Chabrier, G. 2003, PASP, 115, 763, doi: 10.1086/376392
- Charlot & Fall (2000) Charlot, S., & Fall, S. M. 2000, ApJ, 539, 718, doi: 10.1086/309250
- Conselice (2006) Conselice, C. J. 2006, MNRAS, 373, 1389, doi: 10.1111/j.1365-2966.2006.11114.x
- Cortese (2012) Cortese, L. 2012, A&A, 543, A132, doi: 10.1051/0004-6361/201219443
- Cortese et al. (2020) Cortese, L., Catinella, B., Cook, R. H. W., & Janowiecki, S. 2020, MNRAS, 494, L42, doi: 10.1093/mnrasl/slaa032
- Danovich et al. (2015) Danovich, M., Dekel, A., Hahn, O., Ceverino, D., & Primack, J. 2015, MNRAS, 449, 2087, doi: 10.1093/mnras/stv270
- Dekel & Burkert (2014) Dekel, A., & Burkert, A. 2014, MNRAS, 438, 1870, doi: 10.1093/mnras/stt2331
- Domínguez Sánchez et al. (2018) Domínguez Sánchez, H., Huertas-Company, M., Bernardi, M., Tuccillo, D., & Fischer, J. L. 2018, MNRAS, 476, 3661, doi: 10.1093/mnras/sty338
- Dressler et al. (1999) Dressler, A., Smail, I., Poggianti, B. M., et al. 1999, ApJS, 122, 51, doi: 10.1086/313213
- Drory et al. (2015) Drory, N., MacDonald, N., Bershady, M. A., et al. 2015, AJ, 149, 77, doi: 10.1088/0004-6256/149/2/77
- Durbala et al. (2020) Durbala, A., Finn, R. A., Crone Odekon, M., et al. 2020, AJ, 160, 271, doi: 10.3847/1538-3881/abc018
- Dutton et al. (2007) Dutton, A. A., van den Bosch, F. C., Dekel, A., & Courteau, S. 2007, ApJ, 654, 27, doi: 10.1086/509314
- Enia et al. (2020) Enia, A., Rodighiero, G., Morselli, L., et al. 2020, MNRAS, 493, 4107, doi: 10.1093/mnras/staa433
- Fall & Efstathiou (1980) Fall, S. M., & Efstathiou, G. 1980, MNRAS, 193, 189, doi: 10.1093/mnras/193.2.189
- Feroz et al. (2009) Feroz, F., Hobson, M. P., & Bridges, M. 2009, MNRAS, 398, 1601, doi: 10.1111/j.1365-2966.2009.14548.x
- Feroz et al. (2013) Feroz, F., Hobson, M. P., Cameron, E., & Pettitt, A. N. 2013, ArXiv e-prints. https://arxiv.org/abs/1306.2144
- Fraser-McKelvie et al. (2018) Fraser-McKelvie, A., Brown, M. J. I., Pimbblet, K., Dolley, T., & Bonne, N. J. 2018, MNRAS, 474, 1909, doi: 10.1093/mnras/stx2823
- Goto et al. (2003) Goto, T., Yamauchi, C., Fujita, Y., et al. 2003, MNRAS, 346, 601, doi: 10.1046/j.1365-2966.2003.07114.x
- Gunn et al. (2006) Gunn, J. E., Siegmund, W. A., Mannery, E. J., et al. 2006, AJ, 131, 2332, doi: 10.1086/500975
- Guo et al. (2020) Guo, R., Hao, C.-N., Xia, X., et al. 2020, ApJ, 897, 162, doi: 10.3847/1538-4357/ab9b75
- Hao et al. (2019) Hao, C.-N., Shi, Y., Chen, Y., et al. 2019, ApJ, 883, L36, doi: 10.3847/2041-8213/ab42e5
- Hopkins et al. (2009) Hopkins, P. F., Cox, T. J., Younger, J. D., & Hernquist, L. 2009, ApJ, 691, 1168, doi: 10.1088/0004-637X/691/2/1168
- Hopkins et al. (2006) Hopkins, P. F., Hernquist, L., Cox, T. J., et al. 2006, ApJS, 163, 1, doi: 10.1086/499298
- Kauffmann et al. (2003) Kauffmann, G., Heckman, T. M., White, S. D. M., et al. 2003, MNRAS, 341, 33, doi: 10.1046/j.1365-8711.2003.06291.x
- Kennicutt (1998) Kennicutt, Jr., R. C. 1998, ARA&A, 36, 189, doi: 10.1146/annurev.astro.36.1.189
- Khoperskov et al. (2018) Khoperskov, S., Haywood, M., Di Matteo, P., Lehnert, M. D., & Combes, F. 2018, A&A, 609, A60, doi: 10.1051/0004-6361/201731211
- Lacerna et al. (2020) Lacerna, I., Ibarra-Medel, H., Avila-Reese, V., et al. 2020, arXiv e-prints, arXiv:2001.05506. https://arxiv.org/abs/2001.05506
- Law et al. (2015) Law, D. R., Yan, R., Bershady, M. A., et al. 2015, AJ, 150, 19, doi: 10.1088/0004-6256/150/1/19
- Law et al. (2016) Law, D. R., Cherinka, B., Yan, R., et al. 2016, AJ, 152, 83, doi: 10.3847/0004-6256/152/4/83
- Li et al. (2020) Li, N., Li, C., Mo, H., et al. 2020, ApJ, 896, 38, doi: 10.3847/1538-4357/ab92a1
- Lian et al. (2018) Lian, J., Thomas, D., Maraston, C., et al. 2018, MNRAS, 476, 3883, doi: 10.1093/mnras/sty425
- Lintott et al. (2011) Lintott, C., Schawinski, K., Bamford, S., et al. 2011, MNRAS, 410, 166, doi: 10.1111/j.1365-2966.2010.17432.x
- Luo et al. (2020) Luo, Y., Li, Z., Kang, X., Li, Z., & Wang, P. 2020, MNRAS, 496, L116, doi: 10.1093/mnrasl/slaa099
- Martig et al. (2009) Martig, M., Bournaud, F., Teyssier, R., & Dekel, A. 2009, ApJ, 707, 250, doi: 10.1088/0004-637X/707/1/250
- Martin et al. (2005) Martin, D. C., Fanson, J., Schiminovich, D., et al. 2005, ApJ, 619, L1, doi: 10.1086/426387
- Masters et al. (2010) Masters, K. L., Mosleh, M., Romer, A. K., et al. 2010, MNRAS, 405, 783, doi: 10.1111/j.1365-2966.2010.16503.x
- McLure et al. (2018) McLure, R. J., Pentericci, L., Cimatti, A., et al. 2018, MNRAS, 479, 25, doi: 10.1093/mnras/sty1213
- Mendel et al. (2014) Mendel, J. T., Simard, L., Palmer, M., Ellison, S. L., & Patton, D. R. 2014, ApJS, 210, 3, doi: 10.1088/0067-0049/210/1/3
- Mo et al. (1998) Mo, H. J., Mao, S., & White, S. D. M. 1998, MNRAS, 295, 319, doi: 10.1046/j.1365-8711.1998.01227.x
- Peng & Renzini (2020) Peng, Y.-j., & Renzini, A. 2020, MNRAS, 491, L51, doi: 10.1093/mnrasl/slz163
- Poggianti et al. (1999) Poggianti, B. M., Smail, I., Dressler, A., et al. 1999, ApJ, 518, 576, doi: 10.1086/307322
- Robaina et al. (2012) Robaina, A. R., Hoyle, B., Gallazzi, A., et al. 2012, MNRAS, 427, 3006, doi: 10.1111/j.1365-2966.2012.21804.x
- Robertson et al. (2006) Robertson, B., Bullock, J. S., Cox, T. J., et al. 2006, ApJ, 645, 986, doi: 10.1086/504412
- Sánchez et al. (2016) Sánchez, S. F., Pérez, E., Sánchez-Blázquez, P., et al. 2016, Rev. Mexicana Astron. Astrofis., 52, 171. https://arxiv.org/abs/1602.01830
- Sánchez et al. (2018) Sánchez, S. F., Avila-Reese, V., Hernandez-Toledo, H., et al. 2018, Rev. Mexicana Astron. Astrofis., 54, 217. https://arxiv.org/abs/1709.05438
- Schawinski et al. (2014) Schawinski, K., Urry, C. M., Simmons, B. D., et al. 2014, MNRAS, 440, 889, doi: 10.1093/mnras/stu327
- Skibba et al. (2009) Skibba, R. A., Bamford, S. P., Nichol, R. C., et al. 2009, MNRAS, 399, 966, doi: 10.1111/j.1365-2966.2009.15334.x
- Smee et al. (2013) Smee, S. A., Gunn, J. E., Uomoto, A., et al. 2013, AJ, 146, 32, doi: 10.1088/0004-6256/146/2/32
- Sparre & Springel (2017) Sparre, M., & Springel, V. 2017, MNRAS, 470, 3946, doi: 10.1093/mnras/stx1516
- Spinoso et al. (2017) Spinoso, D., Bonoli, S., Dotti, M., et al. 2017, MNRAS, 465, 3729, doi: 10.1093/mnras/stw2934
- Springel et al. (2005) Springel, V., White, S. D. M., Jenkins, A., et al. 2005, Nature, 435, 629, doi: 10.1038/nature03597
- Strateva et al. (2001) Strateva, I., Ivezić, Ž., Knapp, G. R., et al. 2001, AJ, 122, 1861, doi: 10.1086/323301
- Tojeiro et al. (2013) Tojeiro, R., Masters, K. L., Richards, J., et al. 2013, MNRAS, 432, 359, doi: 10.1093/mnras/stt484
- van den Bergh (1976) van den Bergh, S. 1976, ApJ, 206, 883, doi: 10.1086/154452
- Vazdekis et al. (2016) Vazdekis, A., Koleva, M., Ricciardelli, E., Röck, B., & Falcón-Barroso, J. 2016, MNRAS, 463, 3409, doi: 10.1093/mnras/stw2231
- Wake et al. (2017) Wake, D. A., Bundy, K., Diamond-Stanic, A. M., et al. 2017, AJ, 154, 86, doi: 10.3847/1538-3881/aa7ecc
- Westfall et al. (2019) Westfall, K. B., Cappellari, M., Bershady, M. A., et al. 2019, AJ, 158, 231, doi: 10.3847/1538-3881/ab44a2
- Worthey et al. (1992) Worthey, G., Faber, S. M., & Gonzalez, J. J. 1992, ApJ, 398, 69, doi: 10.1086/171836
- Yan et al. (2016a) Yan, R., Bundy, K., Law, D. R., et al. 2016a, AJ, 152, 197, doi: 10.3847/0004-6256/152/6/197
- Yan et al. (2016b) Yan, R., Tremonti, C., Bershady, M. A., et al. 2016b, AJ, 151, 8, doi: 10.3847/0004-6256/151/1/8
- Yang et al. (2007) Yang, X., Mo, H. J., van den Bosch, F. C., et al. 2007, ApJ, 671, 153, doi: 10.1086/522027
- York et al. (2000) York, D. G., Adelman, J., Anderson, Jr., J. E., et al. 2000, AJ, 120, 1579, doi: 10.1086/301513
- Zhang et al. (2019) Zhang, C., Peng, Y., Ho, L. C., et al. 2019, ApJ, 884, L52, doi: 10.3847/2041-8213/ab4ae4
- Zheng et al. (2017) Zheng, Z., Wang, H., Ge, J., et al. 2017, MNRAS, 465, 4572, doi: 10.1093/mnras/stw3030
- Zhou et al. (2020) Zhou, S., Mo, H. J., Li, C., Boquien, M., & Rossi, G. 2020, MNRAS, 497, 4753, doi: 10.1093/mnras/staa2337
- Zhou et al. (2019) Zhou, S., Mo, H. J., Li, C., et al. 2019, MNRAS, 485, 5256, doi: 10.1093/mnras/stz764
- Zolotov et al. (2015) Zolotov, A., Dekel, A., Mandelker, N., et al. 2015, MNRAS, 450, 2327, doi: 10.1093/mnras/stv740