figurec \newwatermark[firstpage,color=gray!60,angle=90,scale=0.32, xpos=-4.05in,ypos=0]Publication doi \newwatermark[firstpage,color=gray!60,angle=90,scale=0.32, xpos=3.9in,ypos=0]Preprint doi \newwatermark[firstpage,color=gray!90,angle=0,scale=0.28, xpos=0in,ypos=-5in]*correspondence: email@institution.edu
Design and Evaluation of A Cyber-Physical Resilient Power System Testbed
Abstract
A power system is a complex cyber-physical system whose security is critical to its function. A major challenge is to model and analyze its communication pathways with respect to cyber threats. To achieve this, the design and evaluation of a cyber-physical power system (CPPS) testbed called Resilient Energy Systems Lab (RESLab) is presented that captures realistic cyber, physical, and protection system features. RESLab is architected to be a fundamental tool for studying and improving the resilience of complex CPPS to cyber threats. The cyber network is emulated using Common Open Research Emulator (CORE) that acts as a gateway for the physical and protection devices to communicate. The physical grid is simulated in the dynamic time frame using PowerWorld Dynamic Studio (PWDS). The protection components are modeled with both PWDS and physical devices including the SEL Real-Time Automation Controller (RTAC). Distributed Network Protocol 3 (DNP3) is used to monitor and control the grid. Then, exemplifying the design and validation of these tools, this paper presents four case studies on cyber-attack and defense using RESLab, where we demonstrate false data and command injection using Man-in-the-Middle and Denial of Service attacks and validate them on a large-scale synthetic electric grid.
1 Introduction
The electric grid is transitioning to a smarter grid that employs advanced communication technologies. With advanced computing and communications, cyber-security has proven to be a critical issue in power transmission, generation, and distribution systems. Cyber adversaries can modify or create data that can impact the grid’s normal operation and potentially destabilize its operating point causing cascading failures. Earlier this year, an unidentified threat successfully compromised the administrative systems of the European Network of Transmission System Operators for Electricity (ENTSO-E), with the potential to compromise 42 transmission system operators (TSOs) across 35 member states in Europe [1]. Other attacks are also widely known such as the Ukraine attacks [2], where an attacker targeted three distribution units to cause a power outage after intruding into the Supervisory Control and Data Acquisition (SCADA) system. Attacks like Pivnichna [3] caused a power outage, while Stuxnet [4] allowed control of programmable logic controllers (PLCs), by overspeeding the centrifuges in a nuclear plant.
It is necessary to propose defense mechanisms for such zero-day attacks. The use of firewalls, intrusion detection systems, and intrusion prevention systems is important, but these tools may not work efficiently on stealthy coordinated attacks. Hence, we need to employ the latest tools and techniques to make solutions that are more intelligent and capable of detecting complex attacks. Machine learning, including deep learning, or even artificial intelligence, offer advantages that can aid cyber and physical attack detection and localization. These techniques are data-intensive, where more data typically provides a better solution. One way to generate those real-time data sets is to mimic those attacks and defense mechanisms using a testbed.
This paper presents our Resilient Energy Systems Laboratory (RESLab) testbed that forms an environment for researchers and stakeholders to understand the impact of cyber-attacks and validate their defenses. It provides a platform to evaluate how the power and communication networks perform together based on real-world systems and events, including communication protocols, operations, and latency requirements. It allows other researchers to develop and test intrusion detection tools for defending and mitigating real cyber attacks.
These are the major contributions of this paper:
-
1.
To introduce RESLab, a cyber-physical power system testbed that is designed to study resilience problems and solutions in large-scale power systems RESLab is a mix of emulators, simulators, and real devices that allow us to evaluate multi-stage cyber threats to the power system.
-
2.
To model realistic data flows in the RESLab testbed using a large-scale exemplar power system based on utility architecture. This enables us to implement and validate scenarios impacting grid resilience such as false data and command injection uses cases.
-
3.
To compare RESLab with other testbeds and present how RESLab is able to implement and validate realistic use cases for grid cyber-resilience.
-
4.
To implement Denial of Service (DoS) and Man-in-the-Middle (MiTM) attacks and validate them by studying their impacts on the normal power system operation.
-
5.
To provide a platform for data collection and visualization by integrating monitoring tools such as Packetbeat and Zabbix, Snort for intrusion detection, and a cyber-physical energy management system application.
This paper is organized as follows. In Section 2, we evaluate testbeds that model a cyber-physical power system and allow real-time experiments. Section 3 presents the architecture and components of RESLab. The threat model for this work is presented in Section 4. Section 5 demonstrates its implementation in RESLab with four use cases. Then, we present the analysis of the attacks and their impacts on the physical system. The results are analyzed in Section 6.
2 Cyber-Physical Power System Testbeds
In this section, we first review testbeds that focus on investigating vulnerability of power critical infrastructure, including their challenges and limitations. Previous works range from applications in wide-area protection and monitoring in transmission and generation, to distributed energy resources (DERs), to microgrids and distribution systems, and to operation domains such as Energy Management Systems (EMS) and Distribution Management Systems (DMS). The comparisons in this section consider ease of deployment and troubleshooting, design complexity, and cost of implementation. Then, we motivate RESLab, outlining its contributions, unique features, and how it fills existing gaps.
2.1 Testbeds and platforms
A cyber-physical testbed architecture is implemented by networking together simulators, emulators, and hardware. The quality of a cyber-physical testbed is measured by its success in advancing the research and applications that it supports. It includes a platform enabling communication between components, a system for data collection, aggregation, visualization, and a way of executing and evaluating cyber security incidents against the system under study.
We present all the reviewed testbeds in Table 1 based on the power and cyber simulators, communication protocols, software and devices, system level, intrusions type, and the application of DERs.
2.2 Network representation
Various testbeds such as [5, 6, 7, 8, 9, 10] focus on evaluating impact for physical use cases (e.g., cyber-attacks on power flows, loss of load or synchronism, protection systems, and microgrids) while using networking hardware. Other testbeds [11, 12, 13, 14, 15] use network simulators, but the network simulator’s primarily focus is on communication algorithms such as congestion control or bandwidth allocation schemes. For performing cyber-physical studies in a testbed, network emulation is the preferred alternative to simulation. While a simulator demonstrates the behavior of a network, an emulator functionally replicates the behavior of the network. Though some simulators provide features such as System-in-The Loop (SITL) [11, 16] and Tap bridge [15] to integrate external devices or virtual machines (VMs), those features are not scalable to large systems.
Virtualization and emulation enable scalability. In [17], the vSphere ESXi virtualization environment is used to simulate network-based attacks; however, these scenarios are not specific to SCADA and focus on web browsing and file transfers. The vSphere environment is reset before each simulation test run; this provides built-in mitigation against any damage resulting from an attack simulations.
The selection of a specific platform requires design decisions that are based on trade-offs in cost and accuracy. Network devices such as firewalls and routers can be included in the design, but are expensive for a large scale CPS. Network simulators such as Opnet, Omnet, and Network Simulator-3 (NS-3) can be cost-effective, but they do not provide a platform for real-time data processing of industrial protocols such as IEC 61850, Distributed Network Protocol version 3 (DNP3), inter-control center communications protocol (ICCP), and Modbus.
The Common Open Research Emulator (CORE) provides a platform to run different applications, such as iptables for firewall, Snort for intrusion detection, and services such as Secure Shell (SSH) for remote access. CORE is used for emulating smart grid networks in [18], where the authors compare existing works of co-simulation and discover CORE to be suitable for large-scale simulations. Similarly, in [19] an Army microgrid is simulated, and its communication network is emulated with CORE, where results demonstrate the ability to implement cyber intrusions and evaluate the impact on the microgrid. However, testbeds that use CORE have not yet integrated network monitoring tools.
Sandia National Laboratories (SNL) offers a tool for launching and managing virtual machines (VMs) to emulate large scale networks [20] called Minimega. It supports Virtual Local Area Networks (VLANs) with configurable bandwidth and quality of service (QoS); thus, it can be used with a router’s operating system and Linux kernels to emulate a communication network. Additionally, a power system and cyber co-simulation environment called SCEPTRE [21] is being developed by SNL to allow high-fidelity simulation of SCADA protocols with hardware-in-the-loop such as PLCs and remote terminal units (RTUs), using Minimega to manage the VMs.
A Hierarchical Engine for Large-scale Infrastructure Co-Simulation (HELICS) is developed by National Renewable Energy Laboratory for large-scale co-simulation, using off-the-self power system, and communication markets [22]. This framework integrates discrete-event simulators, such as NS-3, and time-series simulations such as for power flows.
2.3 Power system representation
Power system simulators such as real-time digital simulator (RTDS), OpalRT, or Typhoon have been used in several testbeds [23, 24, 25, 11, 7, 6, 26, 27, 8, 10, 28]. These expensive hardware solutions are essential for experiments on electromagnetic transients or power electronics, DERS, or microgrids. PowerWorld Simulator and Dynamic Studio (PWDS) provide solutions for large-scale power system modeling in the steady state and transient stability time frames [29, 30, 31]. The testbeds that use hardware devices such as SEL relays, phasor measurement units (PMUs), or RTACs for their experiments face challenges in understanding vendor-specific industrial control system (ICS) protocols. The testbed solutions in [23, 24, 25, 32, 9, 27] use physical hardware and consider ICS protocols such as IEC 61850, C37.118 in their experiments.
2.4 Operational technology protocols
Widely-known tools in information technology (IT) security, such as Ettercap and Metasploit frameworks, are not tailored to operational technology (OT) or attacks to power systems. For example, a MiTM attack would need to be specific to SCADA protocols, and representing such attacks is imperative for defense. Incorporating attacks and defense into a testbed requires knowledge of the protocols as it involves inspecting and modifying packets. Vendor-specific protocols that are not open source are challenging to incorporate and evaluate in such environments.
2.5 Constraints on use cases
Existing testbeds often lack strong demonstrations of cyber intrusions. Several existing testbeds [23, 32, 33, 34, 35, 12, 36, 37] mention implementation of cyber intrusions in their platforms but do not clearly demonstrate specific use cases including how the intrusions are performed. Some testbeds that use MiTM attacks [25, 7, 26, 6, 8] do not show how those attacks are incorporated. For example, a MiTM attack can be performed in different ways such as address resolution protocol (ARP) cache poisoning, internet protocol (IP) spoofing, or hypertext transfer protocol (HTTP) session hijacking. Some testbeds such as [11, 38] use Ettercap or Metasploit frameworks but have limitations in carrying out goal-oriented MiTM cyber-attacks.
Realistic use case support is a major feature of a testbed. For example, extensive research has been proposed on defense against FDI attacks, where state-of-the-art methods adopt linear algebra and deep learning [39, 40]. However, works that address FDI attacks tend to make unrealistic assumptions on the adversary’s knowledge and capabilities.
2.6 Motivation for RESLab
RESLab aims to facilitate academic research and to bridge theory to practice through collaboration with industry and academia. Therefore, it must exemplify these qualities: (1) Ability to validate domain-specific use cases; (2) Ability to mimic and reflect the real-world complexity of industrial systems by incorporating hardware devices; (3) Support high-impact research activities; (4) Cost effectiveness; (5) Design for fast verification of results; (6) Ability to transfer results to power system industry; (7) Ability to transfer the testbed itself to industry or other researchers; and (8) Ability to serve as an educational platform.
Because RESLab is a cyber-physical testbed, these features are also important: (1) It is imperative that the testbed allows the development and evaluation of cross domain (e.g., cyber, physical, protection system) analyses including identification of cyber threats that impact power systems; (2) Ability to implement and validate realistic threats using real-time simulated models and data as well as offline models; (3) Ability to evaluate cyber-physical contingency analysis involving simulating and patching vulnerabilities and their impact on risk; (4) Ability to connect simulators, emulators, and physical components.
These RESLab features fulfill the gaps in existing testbeds:
-
1.
Virtualization and emulation: RESLab uses vSphere and CORE for virtualization, including power system simulation in a dedicated VM, and to operate network components such as an IDS and firewalls.
-
2.
Open source protocols and industry integration: RESLab’s implementation of OpenDNP3 follows the IEEE 1815 standard [41], hence convenient for other researchers to replicate the experiments. RESLab uses PWDS [29] to emulate the DNP3 outstations in real-time, making the solution easily deployable to industry.
-
3.
Use case realism support: RESLab addresses use case shortcomings by supporting multi-phase cyber intrusions as presented by the joint report of NERC, E-ISAC, and SANS-ICS [42]. Other solutions fail to address early attack stages. Our testbed enables a complete representation of FDI and FCI attack vectors in a realistic environment from early-stage environment.
-
4.
Large scale system cyber-physical analysis: RESLab enables research to develop entirely new systems. For example, it is supporting the use case of a cyber-physical EMS. Such a new system needs to support algorithms that enable cyber-physical state estimation. Its integration and application of large-scale realistic cyber-physical models, including a synthetic test case on the Texas footprint that includes power [43] and communication [44] systems, with balancing authorities and market participants strengthens the test case to mimic a realistic cyber-physical power system.
-
5.
Transferability and interoperability: The virtualization in RESLab makes the migration to other platforms such as VirtualBox and VMware simple. This approach makes the testbed cost-effective compared to testbeds that use RTDS or OpalRT.
-
6.
Dataset management: Few datasets for cyber physical testbeds are publicly available. RESLab provides such a platform that aggregates real-time traffic and power data along with IDS alerts and enables integration of third-party tools including visualization and data analytics.
Ref Power Simulators Cyber Simulators Communication Protocols Devices and Softwares System Level Intrusions DER [23] RTDS No IEC 61850 Relays, IEDs, Gateway Substation No No [24] RTDS Network Simulator-3/DeterLab PMU/C37.118 PMUs, phasor data concentrator (PDC), GPS clock Transmission DoS, MiTM No [25] RTDS, Opal-RT Wide Area Communication Emulator C37.118 PMUs, SDN, RTAC, PDC, Industry-grade SCADA Transmission MiTM No [7] OPAL-RT Real Network/SDN DNP3 SEL 351 Transmission DoS and coordinated physical control No [5, 6] RTDS Real Network/SDN MODBUS/TCP, IEEE C37.118 PMU, PDC, relay, Industry software from SEL, GE, Snort, Wireshark Transmission Aurora, DoS No [26] RTDS DNP3 Scapy Transmission MiTM No [32] Typhoon HIL 602 No IEC 61850 Digitl Signal Processor (DSP), FPGA, SunSpec System Validation Platform, Inverter and converter Distribution No Yes [33] Powersim Dynamic Link Library (DLL) Wifi with MODBUS register, SSH IoT, relay Distribution No Yes [34] PowerWorld, MATLAB, RT-LAB, OP5600 Relay Distribution No Yes [27] RTDS No PLC, Relays Distribution No Yes [37] Opal-RT and FPGA No C37.118, Precision time protocol (PTP) Distribution No No [11] RTDS Opnet MODBUS LibModbus, OPNET, RTLAB Transmission (Attack on Static Var compensator controller) MiTM No [8] RTDS real network IEC 61850 ITACA IDS tool Transmission (Attack on Static Var compensator controller) 32 types of attacks, MiTM No [35] Power World DS Wide area communication Emulation DNP3 and GOOSE NI CRIO, SEL 421, SEL 651R, SEL 734B Transmission No No [10] RTDS SDN based switch, firewall IEC C37.118, IEC 61850, DNP3 Self developed SCANVILLE, RADICL No specific use case RADICL for cyber attacks No [9] Real hardware Real hardware No specific use case RADIUS DoS, ICT Worm infection, MALWARE infection, Phishing attack, DNS poisoning No [13] PowerWorld, MATLAB, RT-LAB, OP5600 OPNET MODBUS- RSIm No specific use case DoS (compromised HMI), SYN ACK flooding No [45] PowerWorld RINSE (network emulator) MODBUS-TCP Transmission DDoS attack No [12] OPAL-RT OMNET++ MODBUS Ametek MX-45 bi-directional grid simulator for amplification Microgrid (IEEE 13) No No [14] OPAL-RT No simulator or emulator DNP3 and MODBUS, C37.118 Labview CRIO, OSIsoft’s PI-Server No No No [36] OPAL RT and Typhoon HIL No Xilinx Virtex 6 FPGAs microgrid: specific to generator control No No RESLab PowerWorld DS CORE DNP3 RTAC, Snort, Packetbeat, OpenDNP3 Transmission MiTM and DoS No
3 RESLab Cyber-Physical Testbed Architecture
RESLab is designed to reflect realistic power and cyber components based on the synthetic electric grid model on the Texas footprint [43], where its communication model is introduced in [44]. Fig. 1 presents a high-level view of the RESLab architecture, showing an example of one substation and one utility control center (UCC), with their power system cyber-physical components and data flows. More detailed data flows which include balancing authorities and demilitarized zones (DMZs) are presented in our prior work on firewall policies that follow NERC standards [46].
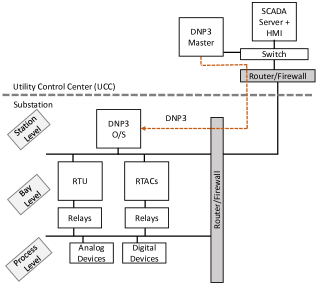
In the simplified model of Fig. 1, the main data flow depicted is DNP3 traffic, which is initiated at the UCC, where there is a DNP3 master and a SCADA server that act as our central control and human machine interface (HMI) applications. At the substation level, there is a DNP3 outstation (DNP3 O/S) which has the data from the field devices that the UCC needs to monitor.
The RTUs, RTACs, and relays monitor the system status, collect data, and control physical devices such as circuit breakers, which we call digital devices as they have only two states, or generators and load which we call analog devices. The RTUs and RTACs can control generators’ output and affect loads. The relays can trip a circuit breaker to isolate a faulted circuit. The data from the Process Level is concentrated in RTUs and RTACs and then transferred to the Substation Level. Within the UCC, the DNP3 master collects the information from each substation for a complete view to understand and control the system. In [47], a typical structure of data concentration and engineer access is presented using the SEL RTAC in SCADA systems, where the RTACs in substations communicate with RTACs in UCC and EMS for data collection and control.
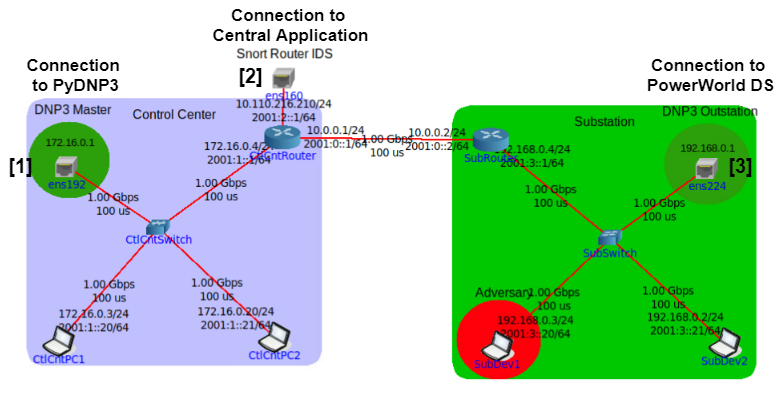
The UCC and substations are in different locations, and in RESLab they are interconnected by an IP network, but they can also be connected through a serial link. At each location we have one router: the substation router and the UCC router, which also act as firewalls because they are configured to allow only DNP3 packets and block unwanted traffic. Fig. 2 illustrates how RESLab follows this data flow pipeline and incorporates real-time power system simulation using PWDS, a physical SEL RTAC, an OpenDNP3 master application, and an emulated communication network using CORE.
In the testbed, PWDS acts as a collection of DNP3 outstations connected to the substation’s control network (shown as Sub LAN in Fig. 2). The emulated DNP3 master and SEL RTAC are housed in a control center network to represent software- and hardware-based control platforms. Each of the emulated components are hosted in a virtual machine management environment, named vSphere. The vSphere environment allows for the creation and management of a large number of VMs. In RESLab, connections between emulated and physical components are made to scale the network depending on the use case. Next, the purpose and functionality of each testbed component is analyzed.
3.1 Cyber network emulation: CORE
RESLab uses CORE, which is an open source network emulator published by the U.S. Naval Research Laboratory. The software allows the creation of several BSD jails, which are similar to Linux containers, that can be connected to emulate realistic communication networks. These containers are used to emulate routers, firewalls, personal computers, and Linux servers in the communication network. CORE can also tap into the hosts’ Ethernet connections to connect with external networking devices and VMs housed within vSphere.
In our testbed, CORE is hosted as one of the VMs, with each of its virtual network interfaces connected to different VLANs, such the Sub LAN and Utility LAN shown in Fig. 2, to emulate a wide-area-network (WAN) between substations and UCC. CORE also has a bridge connecting the cyber-physical EMS application (Section 3.5) that monitors real-time traffic from PWDS as well as network traffic in CORE. The WAN setup has direct connections between the gateway routers of the UCC and substation subnets. The routes within this architecture are created by running Quagga [48] services in the routers which employ open shortest path first (OSPF) [49] as the routing protocol.
From left to right in Fig. 2, the connections are: (1) VM hosting DNP3 master, (2) VM running CORE, (3) VM running a centralized cyber-physical EMS application, and (4) the PWDS VM. To show the emulated network, Fig. 3 details the network topology: the DNP3 master and SEL-RTAC are connected to the CORE through virtual interface [1]; interface [2] forwards Snort IDS alerts from control center router to the EMS application; the VM running the large-scale synthetic electric case in PWDS is connected through interface [3].
3.2 Power system simulation: PWDS
In RESLab, PWDS models the dynamic behavior of an electric power system in the transient stability time frame. It does interactive control [43], and serves as a general interface for DNP3 outstations [29, 30]. An outstation, as defined from a power system operational point of view, typically includes one substation and its devices, including branch breakers, generators, load breakers, and shunts. The DNP3 tags generate binary data, such as the status of all devices, and allow the devices to be controlled by other DNP3 masters/clients. The DNP3 tags can also be set to send analog data, such as measurements of generator real and reactive output, branch power flow, and bus voltage, as well as allowing DNP3 masters to change generator setpoints. A DNP3 master is hosted in a VM running OpenDNP3. Another VM is running SEL acSELerator software [50] and is used to configure the RTAC as a DNP3 master.
PWDS also serves as a simulation engine with a generic interface for integration into other applications [31]. In our experiments , PWDS simulates the power system in a real-time environment in which cyber threats and defense mechanisms are implemented. The large-scale test case on the Texas footprint [43, 44] is implemented as our exemplar power system and is being maintained at Texas A&M. CORE’s WAN is being used to forward breaker status and control commands between VMs.
3.3 DNP3 and master application
DNP3 is extensively used by electric utility companies in North America for communication between equipment [51]. The protocol utilizes the master/outstation architecture. A network can be configured to have one DNP3 master communicate with more than one DNP3 outstation, referred to as a multi-drop network. Alternatively, there can be one DNP3 master that communicates with one DNP3 outstation, or a one-on-one network, as implemented in this paper.
DNP3 messages contain a 10-octet DNP3 header and a maximum 292-octet DNP3 payload, which are carried over TCP/IP packets. The DNP3 header contains sync, length, link control, destination, and source address fields with a cyclic redundancy check (CRC) to ensure data integrity. The DNP3 payload is comprised of many 16-octet data blocks, with a 2-octet CRC for each block.
The purpose of the CRC is to ensure that bits have not been changed accidentally during its journey from source to end node. Some intruders may modify the traffic yet fail to modify the CRC which can be easily detected at the receiver or by implementing DNP3 specific decoders in IDS. Inside the DNP3 payload, function codes identify the operation the outstation performs. The index identifies the device in the outstation the master is asking to perform the operation on or retrieve data from. These are the function codes used in our simulations: Confirm (0x00), Read (0x01), Read (0x2), Select (0x03), Operate (0x04) Direct Operate with Acknowledge (0x05), Solicited Response (0x81), and Unsolicited Response (0x82).
The DNP3 master application in RESLab uses the PyDNP3 library, a Python wrapper for the C++ based OpenDNP3 module, to run the master as a console and a graphical user interface (GUI) application. The purpose of the master application is to continuously monitor the status of the circuit breakers, generators, and loads in the DNP3 outstations that are running in PWDS. The application also forwards the response of DNP3 outstations, as well as connection status, to the central application via CORE’s WAN. This application is configurable to change the polling rates and visualize real-time traffic. It runs in an isolated VM but exists in the UCC LAN with its default gateway set to 172.16.0.4, which is the UCC router (see Fig. 3).
3.4 RTAC integration
RESLab also incorporates the SEL-3530 RTAC to explore different variants of DNP3 master. The RTAC provides flexible system control with integrated management of security, configuration, and logic. It supports multiple communication protocols, such as DNP3, Modbus, and IEC 61850, and comes with an embedded IEC 61131 logic engine [52]. RTAC has been utilized in several hardware-in-the-loop testbeds for data collection and signal conversion [25, 35], but they do not use it for communication studies or to emulate cyber adversaries associated with specific hardware.
Within RESLab, for each substation there is a DNP3 master in the RTAC to collect analog input data, such as power flow, current, and generator output, in addition to binary input data, such as the status of branches, generators, loads, and shunts from PWDS. Furthermore, each client in the RTAC can control the corresponding devices through analog and binary outputs such as to change generator setpoint in Mega Watts (MW) and device status (on/off). Thus, the integration of an industrial standard control device in RESLab allows researchers to gain a deeper understanding of how cyber adversaries can impact the devices and the system as well as develop more practical detection and defense logic in the field.
3.5 Cyber-physical energy management system
A centralized cyber-physical energy management application that our team developed named Cyber-Physical Resilient Energy Systems (CYPRES) is designed to house algorithms for monitoring and analysis, run SCADA applications, and visualize the system. CYPRES is developed and deployed in RESLab as an exemplar use case for the testbed. CYPRES aggregates information from the cyber side CORE emulation environment, the power side from PWDS, as well as from the DNP3 masters regarding DNP3 communication status. CYPRES is used to visualize the control network of the synthetic utilities and their substations in the synthetic power grid. To detect instrusions, it also probes real-time traffic, where CYPRES then performs data fusion from multiple sensors in the synthetic network. The CYPRES application is currently envisioned to be housed at a central location (i.e., at a balancing authority or utility) and used to analyze the system with respect to cyber intrusions. Furthermore, CYPRES provides cyber-physical situational awareness in RESLab using attack tree visualizations. These visualizations can be tailored to network administrators or to power system operators to provide an actionable map of risk related to cyber and physical assets and impact, and to recommend mitigation actions for the identified risks within a network, e.g., by informing how to protect against cascading failures.
3.6 Intrusion detection system
The role of an IDS is to detect cyber intrusions. Rule-based and anomaly-based IDS’s are predominantly used in industry, but they lack the capability of detecting zero-day attacks. As an initial approach, RESLab integrates the Snort IDS which is used to detect and generate alerts for cyber intrusions. Snort tutorials [53] are followed to define rule sets, preprocessors, decoders and change configuration. Currently in RESLab, Snort is protecting the control center and substation LANs by running as a service within the routers. The alerts are forwarded to the CYPRES application in real-time.
For the synthetic power system case, the dataset from the attacks comprises packets with a destination port of 20,000, which is the default DNP3 port. From the filtered dataset, the frequency of communication between the master and outstation is analyzed in Section 6 to show to the effectiveness of the exemplar cyber intrusion scenario in impeding DNP3 communications.
3.7 Storage and visualization
RESLab implements a platform that the team has created to probe the traffic at all the network interfaces inside CORE, to collect the traffic, to use Elasticsearch Logstash Kibana (ELK) stack to store the traffic in an Elasticsearch index, and to visualize them using Kibana dashboard with the Packetbeat plugin [54]. One can configure the Packetbeat plugin to modify the number of interfaces and the type of traffic to probe. Kibana provides a platform to write Lucene queries to filter out a search in the Elasticsearch index. RESLab uses Logstash to collect Snort alerts to visualize in Kibana. In addition to ELK stack, RESLab also integrates Zabbix [55] for network monitoring, as it provides a platform to configure custom alert rules and triggers. We have configured a Zabbix server in the base operating system hosting CORE, and the Zabbix agents in all the routers in CORE. The agents within CORE use the CORE control network to interact with the server using ZBX protocol [55].
4 Threat Model
Widely-known cyber threats such as the Ukranian and Stuxnet attacks have been multi-stage attacks, which are a serious concern. However, due to the nature of these attacks, and the wide range of time scales involved at each stage, they are challenging to plan and study. Hence, RESLab is intended to mimic an electrical utility environment allowing for experimentation of individual threats, which enables us to develop and test solutions at each step in the attack vector.
The threat model we present and implement in this paper is based on emulating a multi-stage attack in the large-scale synthetic test system’s communication model. In the first stage, the adversary gains Secure Shell (SSH) access to a machine in the substation LAN. In the second stage, the adversary performs steps that are tailored to the system under study and to power system protocols, allowing the adversary to achieve MiTM and DoS attacks that cause physical impact. The RESLab framework can not only support MiTM and DOS, but can also integrate other attack vectors.
4.1 Man-in-The-Middle (MiTM) attack
MiTM is one of the oldest forms of cyber intrusion, where a perpetrator positions itself in a conversation between two end points, to either passively eavesdrop or to impersonate one of the endpoints, making it appear to be a normal exchange of information. MiTM encompasses different techniques and potential outcomes, depending on the threat model. During the second stage of our presented threat model, we compromise the target outstation and its router through performing an ARP spoof attack by poisoning the ARP cache of both the substation’s gateway and DNP3 outstation [56]. Then, in the third stage, we modify control and monitoring traffic to have different implications on the electric grid.
Such tampering of commands and measurements would normally go undetected by the outstation using CRC error checking, since the data chunk in the DNP3 payload’s has its CRC recalculated by the adversary before the modified packet is forwarded to the outstation. The intruder causes false command injection (FCI) and false data injection (FDI) attacks by first storing the DNP3 polling response for the targeted outstations, then manipulating measurements in some cases, and commands in other cases, as well as manipulating a mix of both to carry out one of the most critical contingencies presented in our N-x contingency discovery paper [57]. Such an attack is hard to be detected by an IDS such as Snort, if the intruder not only tampers the command and takes care of the CRCs.
In RESLab, the MiTM attack is developed and implemented to change binary and analog commands sent by the DNP3 master to the outstation as well as the polled response from DNP3 outstations. The intruder not only modifies commands but also eavesdrops and then modifies the current state of the system by tampering its real-time measurements. In Table 2, the procedure for performing a MiTM attack in RESLab is listed. The details on the various combination of attacks that are performed in the third stage of the threat model is presented through four use cases detailed in Section 5.
| Seq. | Description |
|---|---|
| 1 | Start the CORE, PWDS, OpenDNP3 master.Allow time for DNP3 communication between master and outstation to be established. |
| 2 | Start CYPRES app. to monitor cyber data.Start running Snort in substation router. Run the ELK services and Packetbeat . |
| 3 | ARP cache poisoning of substation’s gateway and outstation. |
| 4 | Sniff traffic to and from the outstation.Forward non DNP3 traffic to/from outstation. |
| 5 | Send command from master to outstation. Modify command and forward to outstation. |
| 6 | Modify TCP acknowledgement (ACK) from outstation. |
4.2 Denial of Service (DoS) attack
As another attack vector, we implement a DoS attack to exhaust victim nodes’ processing capability and link bandwidth. There are many different methods of DoS attacks that can be used, which include but are not limited to: user datagram protocol (UDP) flood, internet control message protocol (ICMP) flood, and Ping of Death (PoD) [58]. While each of these DoS attack types use different Open Systems Interconnection (OSI) layers such as application, presentation, session, transport, network, data link or even at physical layer protocols to carry out the attack, all DoS methods attempt to disrupt the communication channels of the targeted node. In our threat model, the intruder within the substation LAN targets routers at the substation and at the control center by flooding the routers with ICMP traffic. The impact of these DoS attacks is then observed and analyzed based on round trip times (RTT) and throughput of the communication channel by varying the strength of the attacks such as the length and delay between the ICMP packets infused to disrupt the DNP3 session.
5 Impact of Cyber Threats on Power Operation
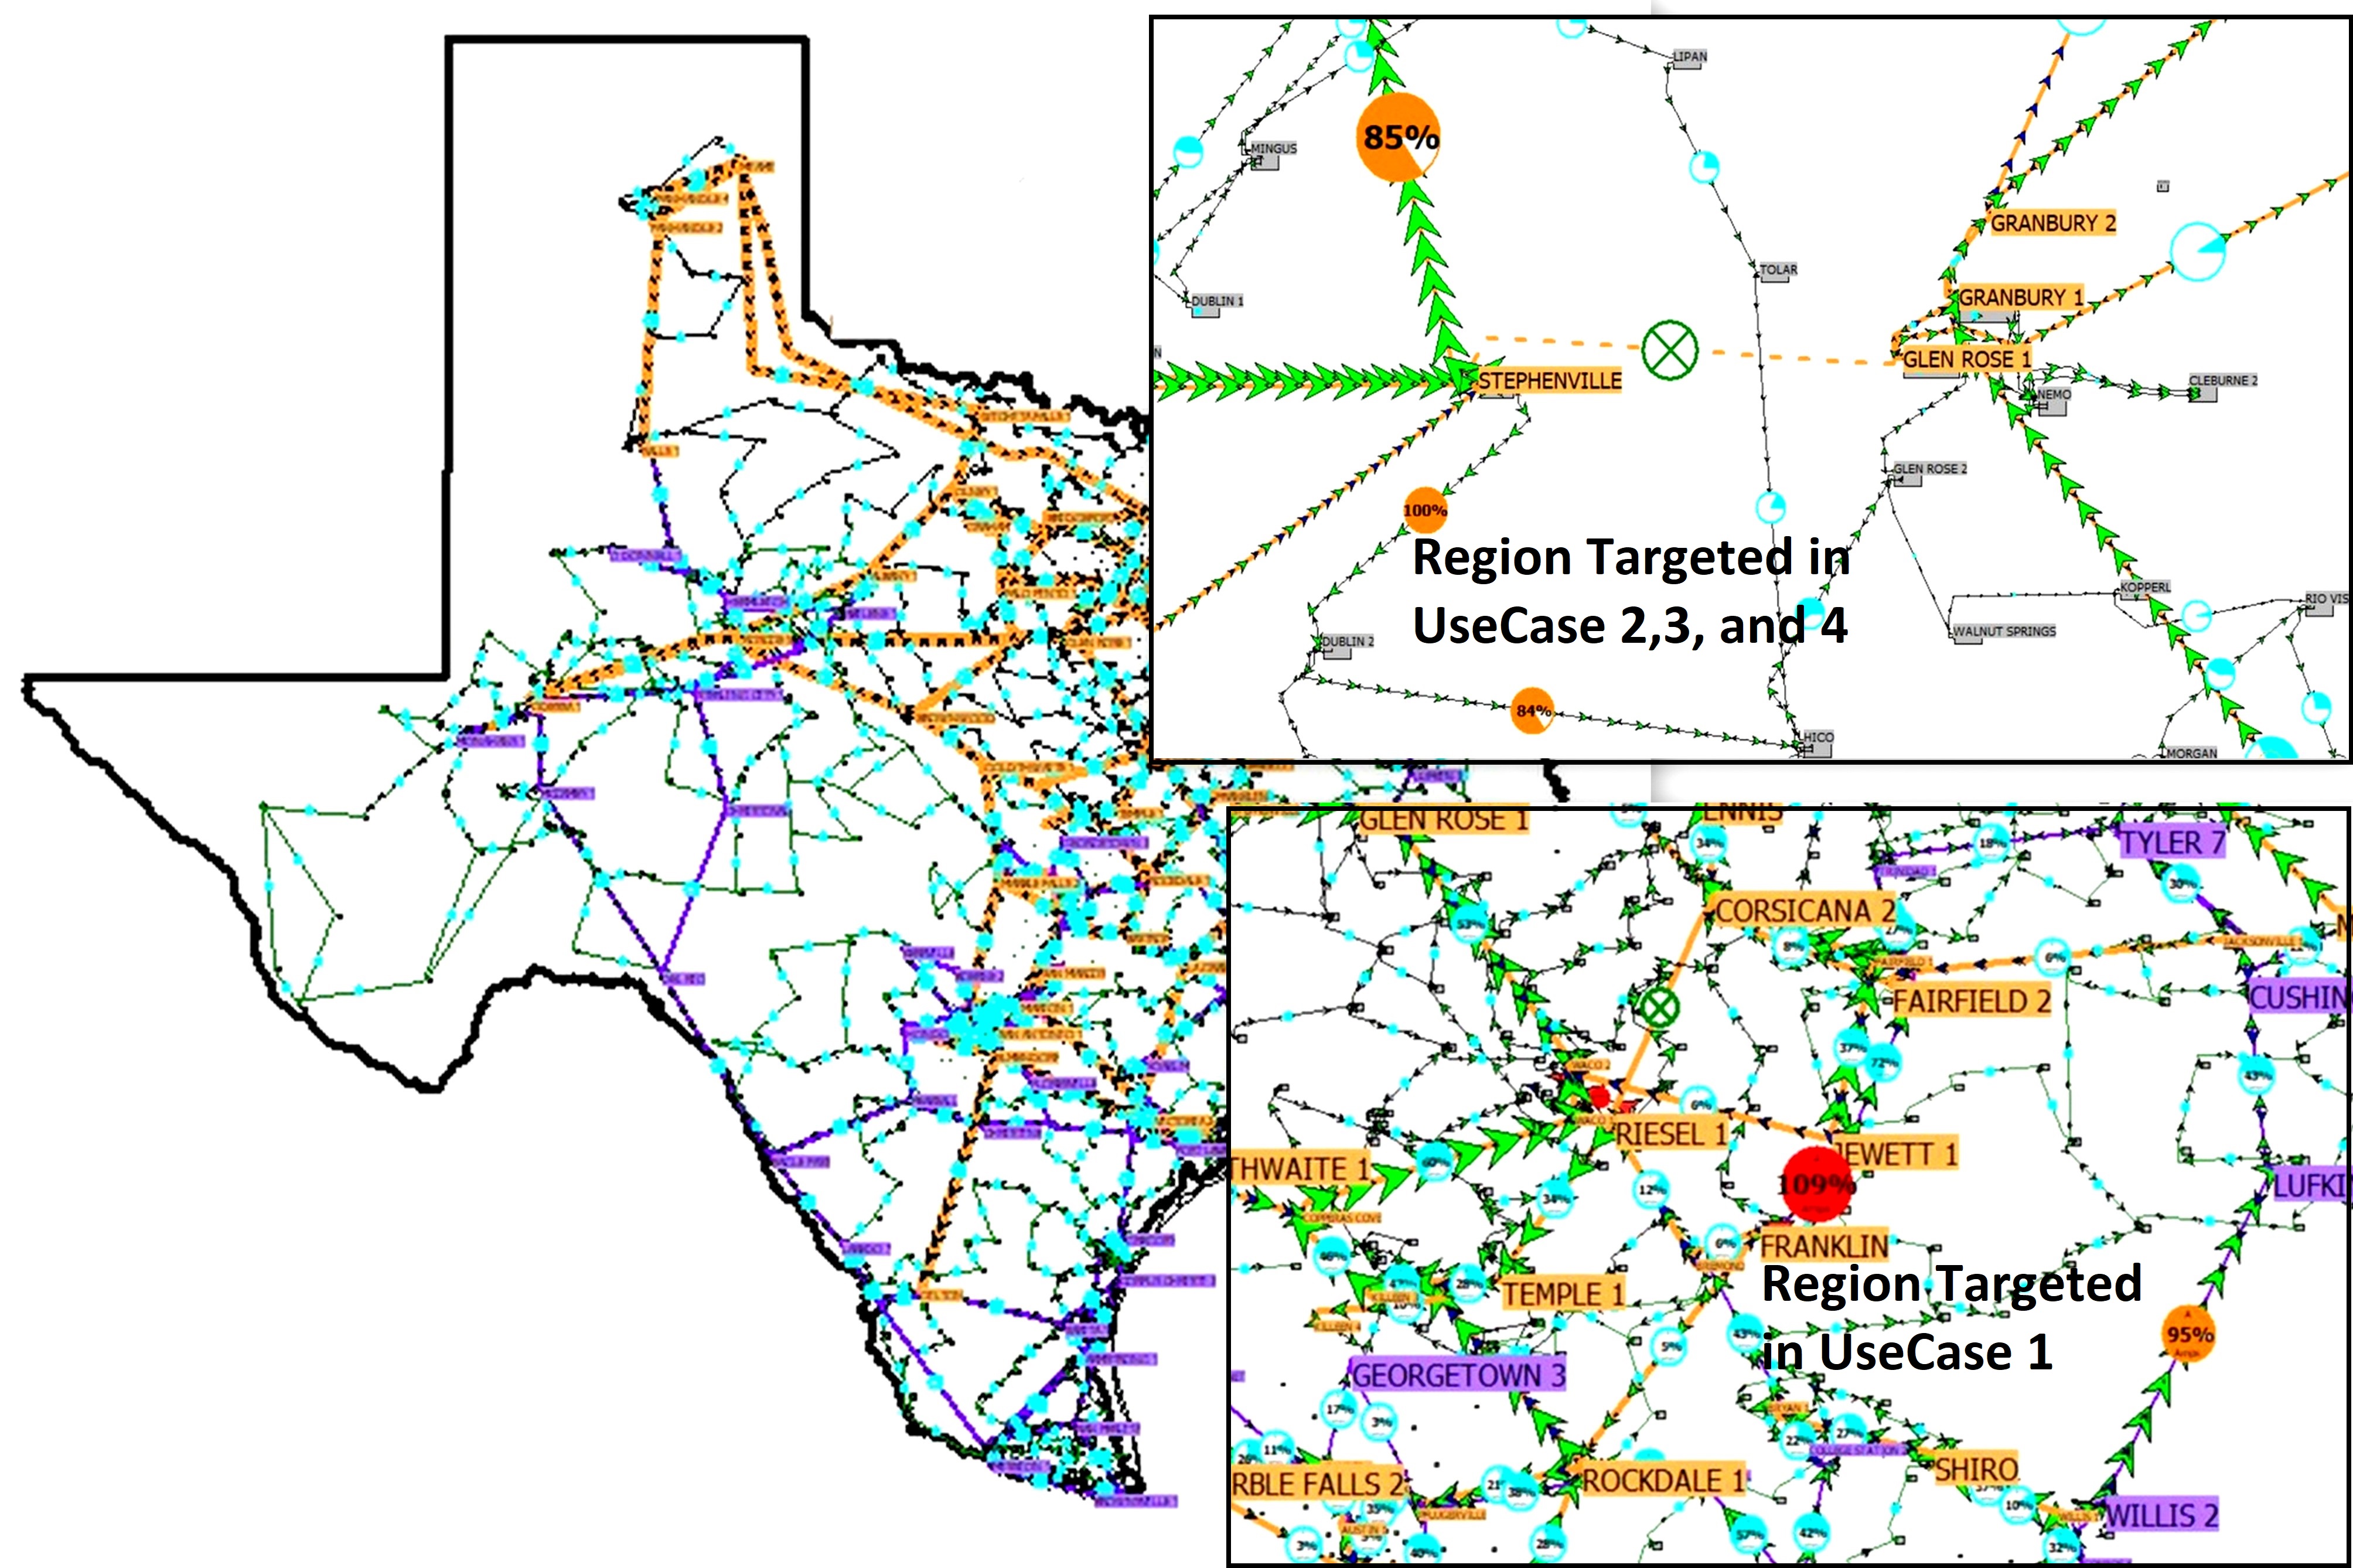
The synthetic Texas 2000-bus case [43, 44] is a publicly available power system test case. This system is N-1 secure, which means the system can still operate securely with one device is out, and it is difficult to cause disruption by exploring N-2 contingencies. Hence, the use cases in RESLab leverage results from our prior work [57] on identifying the most critical multiple-element contingencies based on graph theory and line outage distribution factors (LODFs), which are located in the regions targeted in our use cases (Fig. 4).
Assume branch (x,y) means from Bus x to Bus y in the Texas 2000-bus model. To illustrate the contingencies, if branches (5262,5260), (5263,5260), (5317,5260), (5358,5179) are open, there will be four overflow branches in the system, which are branches (5071,5359), (5138,5071), (8086,8083), (8084,8083). Branch (5262,5260) and (5263,5260) are located in Substation GLEN ROSE 1 (560), Branch (5317, 5260) is at Substation GRANBURY 1 (601), and Branch (5358, 5260) is at Substation RIESEL 1 (631). The overflow branches are at Substation WACO3 (399), JEWETT1 (1195) and FRANKLIN (1200).
Besides, in those substations there are several generators. We have studied that if those generators are compromised, there will also be a contingency in the system. These generators are Gen 5262, 5263, 5319, 5321, 5360, 7098, 7099. Gen 5262 and 5263 are at Substation GLEN ROSE 1 (399), Gen 5319 and 5321 are at Substation GRANBURY 1 (601), Gen 6360 is at Substation RIESEL 1 (631), and Gen 7098 and 7099 are at Substation WADSWORTH (968). When these generators reduce their output and the Branch (5260,5045) in Substation STEPHENVILLE (390) is open, there will be another overflow in Branch (5286, 5046) at Substation STEPHENVILLE (390).
Thus we assume that the adversary has the intent and the resources to target the most critical branches and generators, where disrupting their control causes severe impact. Specifically, we present four use cases to show how cyber threats can compromise a resilient power system. These use cases involve binary and analog command modification, measurement and status modification. Before exploring the scenarios, we present RESLab’s experimental setup which allows us to collect data at various locations and analyze them from a cyber-physical perspective.
5.1 Experimental setup
The DoS and the MiTM attacks for the scenarios are performed while running RTAC and OpenDNP3 applications as the DNP3 masters. The resources used to perform all the experiments are illustrated in Table 3. Virtual LANs (VLANs) are used to ensure that traffic is forwarded by the emulated routers in CORE and to segregate the substation network from the control center network.
| Virtual machine allocations in vSphere | ||||
| VM Name | Mem. | CPU Cores | VLANs | OS |
| CORE | 12G | 4 | 1,2,3,4 | Ubuntu |
| DNP3_Master | 12G | 4 | 1,2,3 | Ubuntu |
| PWDS | 10G | 2 | 1,2,4 | Windows 10 |
| Central_App | 16G | 8 | 1,2 | Windows 10 |
| RTAC | 4G | 2 | 1,2,3 | Windows 10 |
In these simulations, we use a multi-master architecture where each master monitors and controls a substation separately. While the master monitors and controls outstations, the adversary sniffs all the measurement traffic (requests and responses) from the substations. We capture network traffic at four locations in the network (outstation, master, adversary and substation router) to evaluate the impact of MiTM attacks on these four use cases. Since the adversary acts as the middle man between the substation router and outstation, we validate the MiTM by checking if the DNP3 packets received at the substation router and at the master are identical, and if the DNP3 packets at the outsation and adversary are identical. To test the detection of DoS and MiTM attacks, we operate Snort at the substation and control center routers in a Network Intrusion Detection System (NIDS) mode by enabling preprocessors and decoders and including custom rules for ARP, DNP3, and ICMP traffic. Then, we present the alerts along with the physical traffic to correlate the alerts with the measurements and command tampering.
5.2 Class 1: False Command Injection (FCI)
A MiTM attack that modifies binary control commands using relay control blocks can cause line overloading [59]. To achieve this, the adversary first parses the measurements by sniffing the DNP3 responses from the outstation. Then, it sniffs the DNP3 binary OPERATE command and forges them. The adversary modifies commands with function codes of 3 and 4 (SELECT and OPERATE command) from the RTAC, and it modifies commands with function code 5 (DIRECT OPERATE command) from the OpenDNP3 master application. The adversary modifies all the CLOSE commands to TRIP, forcing to open the critical branches identified and causing line overloads in four other branches, shown in the data from the scenario in Fig. 5. This scenario is referred as use case 1 (UC1).
The intruder can also modify analog control commands to change the setpoints in generators along with a binary command to control a branch to cause line overloads. The intruder first inspects the DNP3 packets, changes a collection of generator setpoints from the real value to 0, and alters the binary control command as in UC1. This scenario compromises seven generators and one branch, referred as use case 2 (UC2).
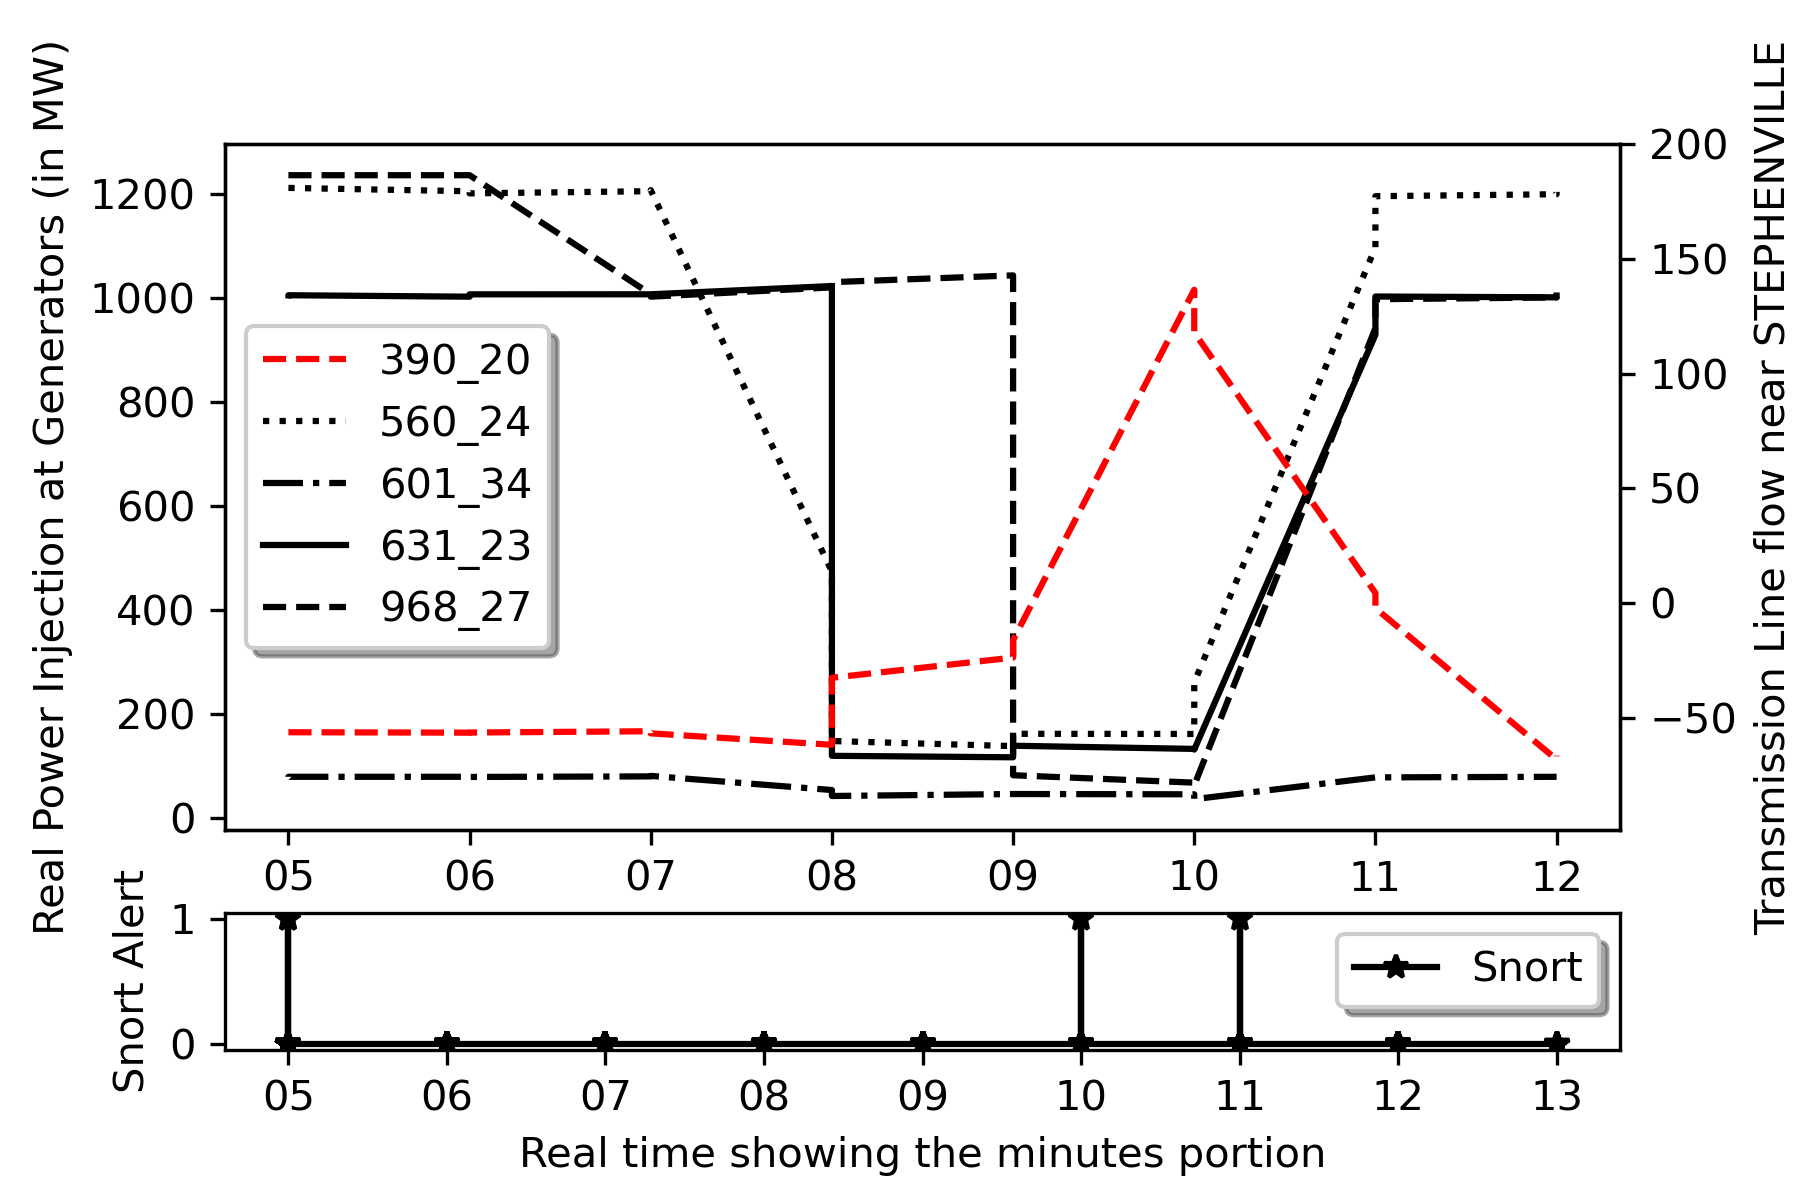
Fig. 6 shows the actual generation output in each substation WADSWORTH, RIESEL, GRANBURY, and GLEN ROSE along with the Snort alerts during 5th, 10th, and 11th mins of the scenario. The intrusion in these substations takes place during the 8th and 9th mins. The intruder’s goal is to overload the transmission line near substation STEPHENVILLE, accomplished by tampering of the analog set points, as observed in the interval 9-11th minute in Fig. 6.
5.3 Class 2: False Data Injection (FDI) with FCI
The MiTM intruder can also perform FDI with the FCI to create more difficult-to-detect attacks. First, the intruder falsifies polled measurements, causing the operator to re-send a control command to the field device. Then, the intruder modifies the control command, as in the previous use cases, by changing the generator setpoint. The actual generation measurements for the same seven generators in UC2 are falsified to 20 MW, and the flow measurement coming from branch [5260, 5045] is changed to 3000 MW, which is above its capacity. Based on these observations, the operators or a pre-defined control logic within devices such as an SEL RTAC, would re-send the control command to increase the generators’ output and open the branch. However, once sending those commands, the intruder modifies the setpoints to 20 MW, making the physical system unreliable. This scenario is referred as use case (UC3).
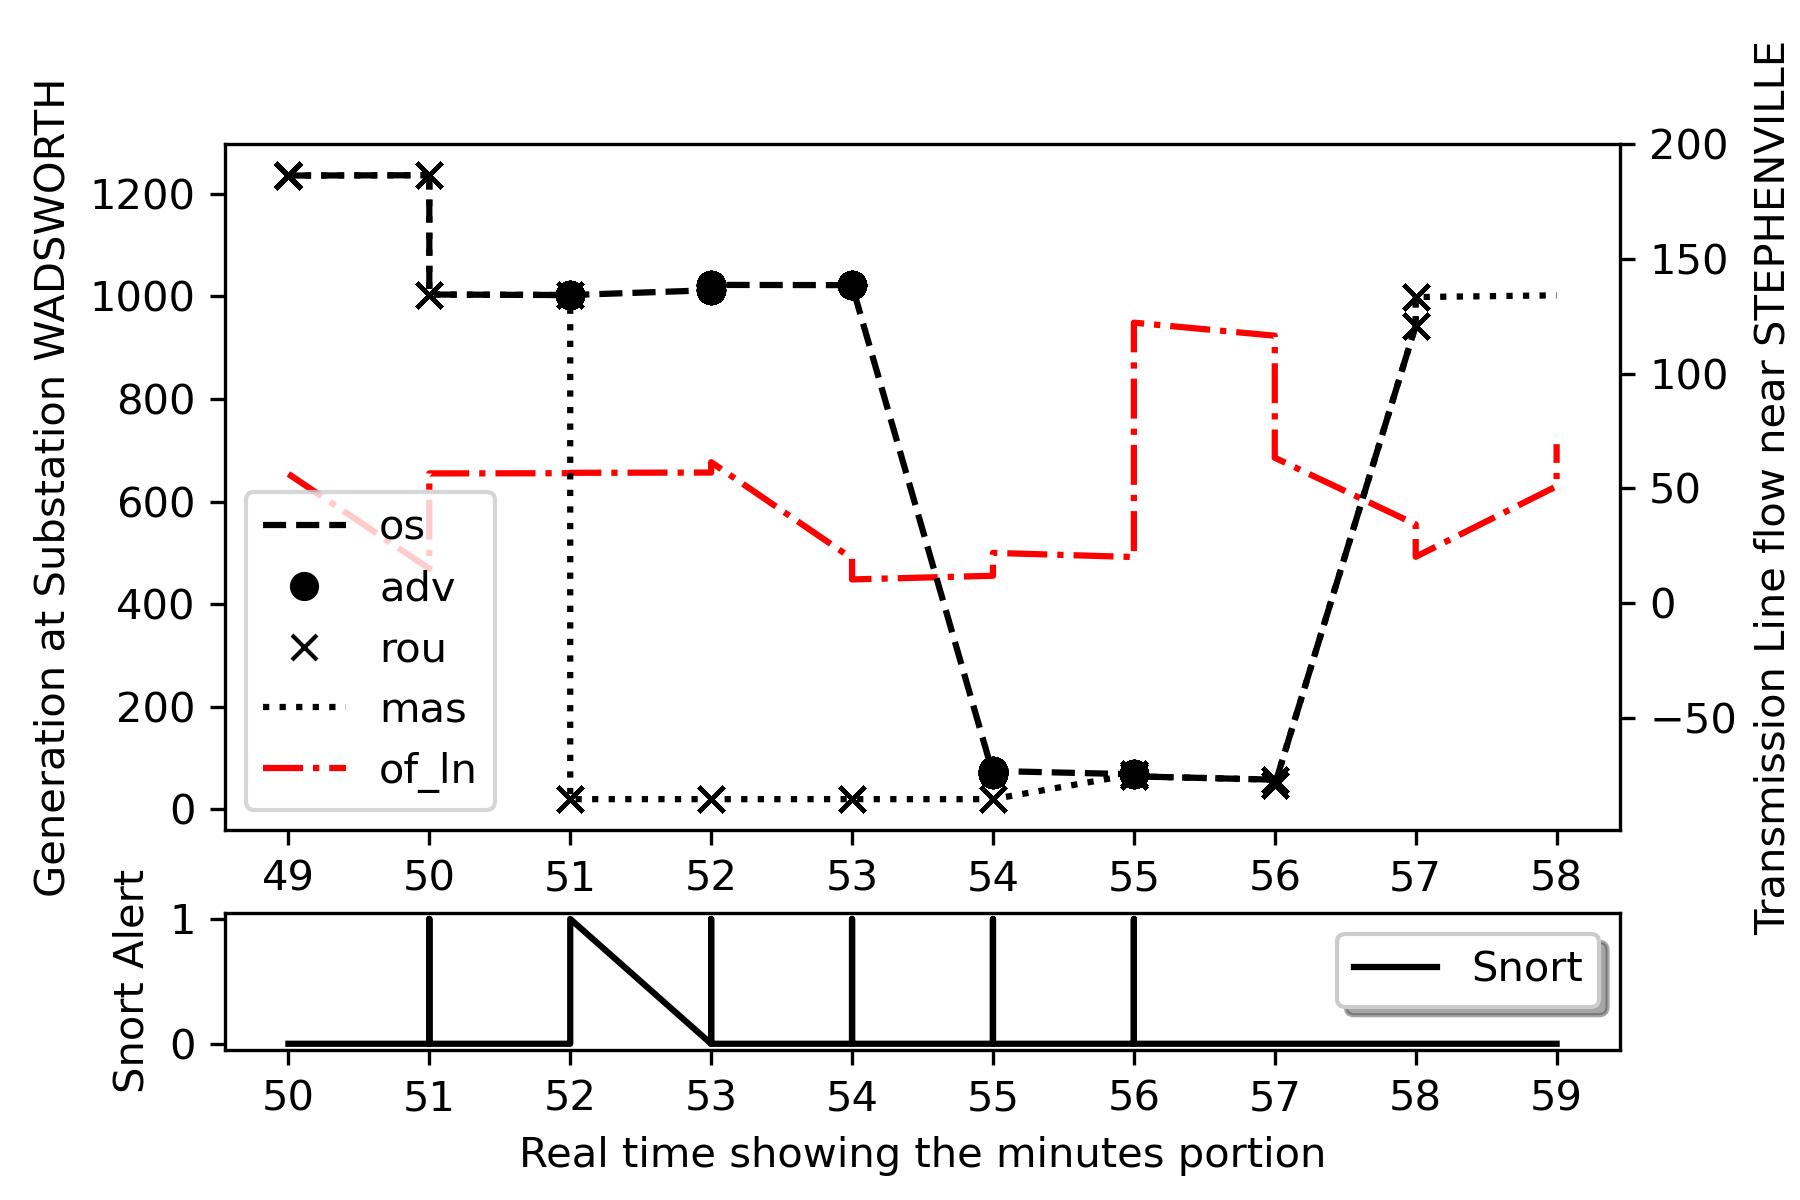
Fig. 7 shows the system after the output of a generator in substation WADSWORTH is changed in the polled measurements by the intruder from 1000 MW to 20 MW as observed in the master and the router during 52nd to 55th min. The Snort alerts are observed from the 53rd to 56th mins. The alerts at 50th and 51st min are due to an attack in other targeted substations such as GLEN ROSE, RIESEL, GRANBURY, whose generation set points are tampered.
Another example of a three-stage attack is referred as use case 4 (UC4), where the intruder first changes the measurements polled by the DNP3 master, as in UC3. Once the operator re-sends the control command, the intruder changes the setpoints from the real value to a low value, as in UC2, but the intruder also falsifies the measurement packets, masking the true measurements but showing the original setpoint values. The result is that the operator believes his/her command has been successfully received and committed. However, in the true physical system, the generators’ outputs are decreasing, and opening a line will then cause an overload.
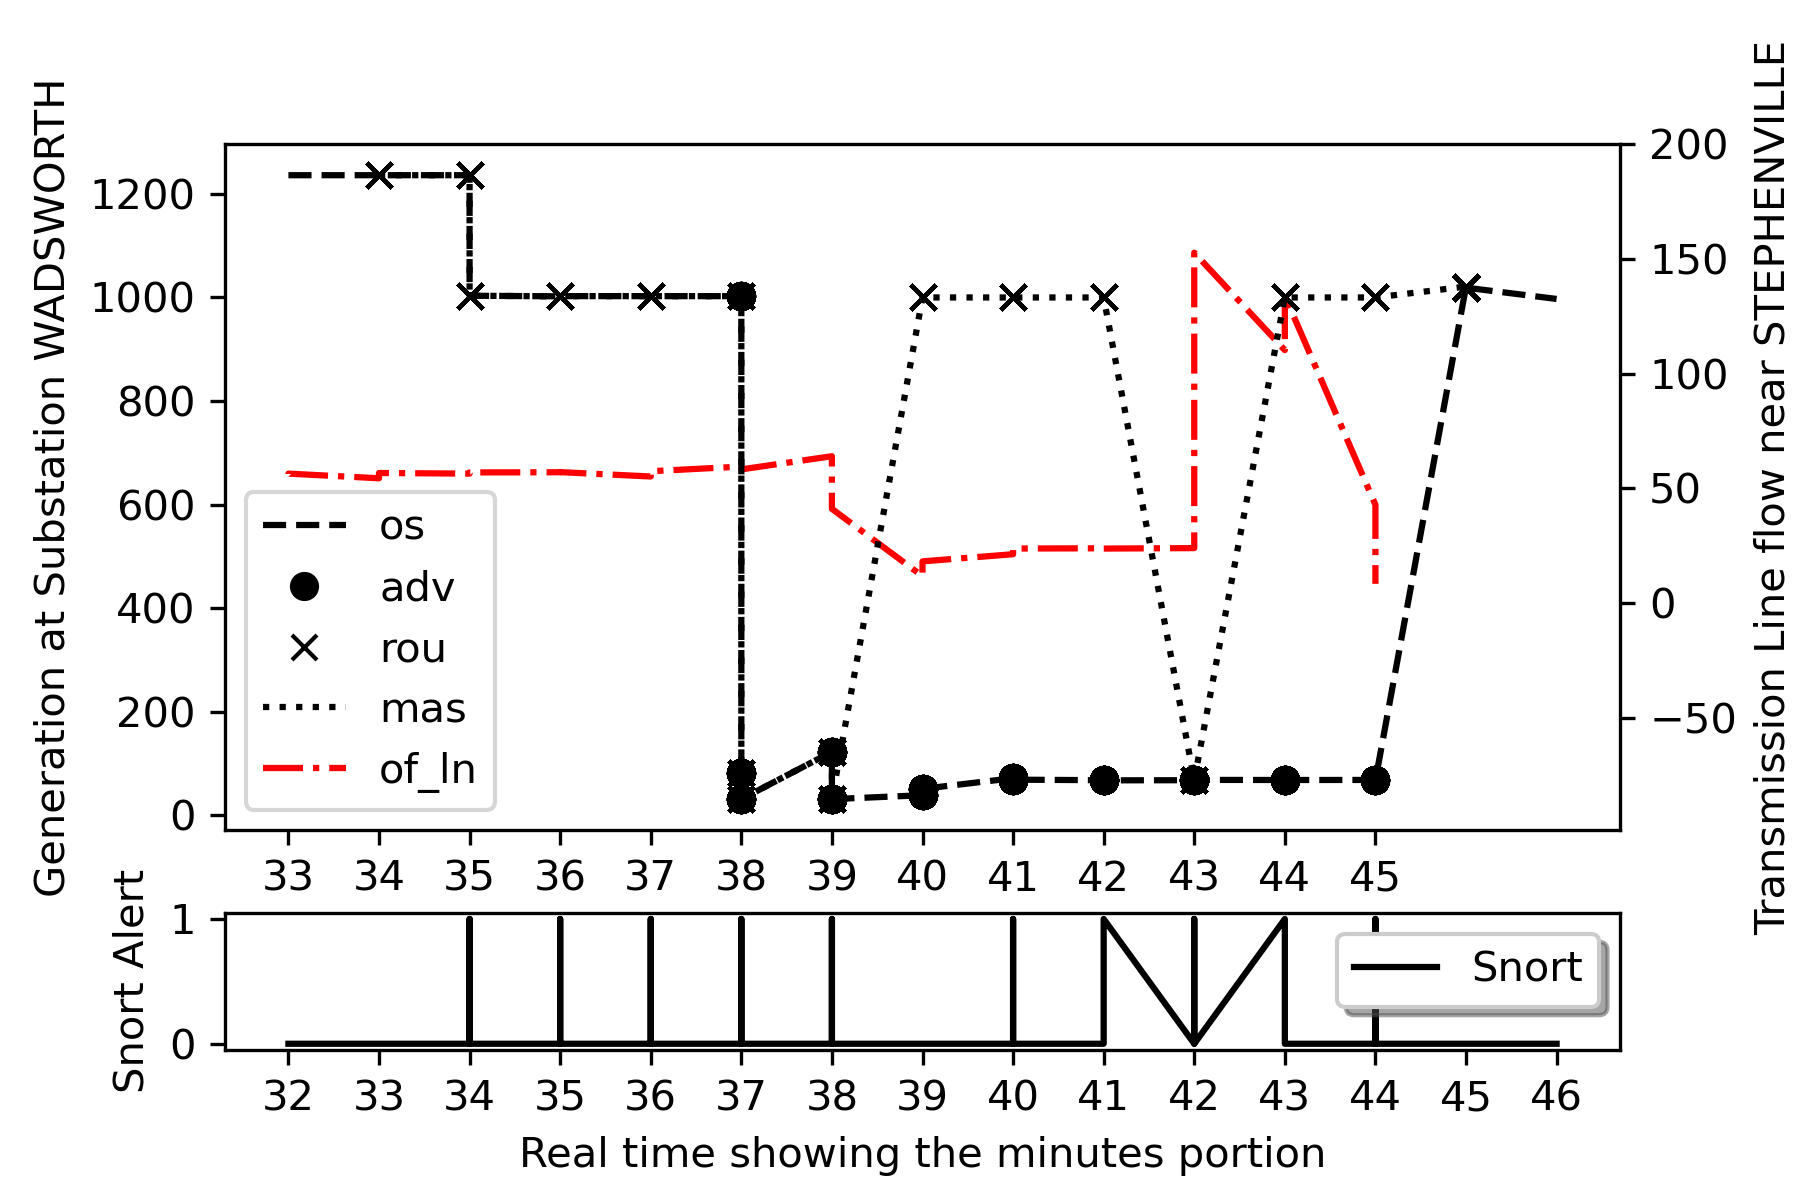
Fig. 8 shows the generation output at substation WADSWORTH as observed at four locations. During the intrusion on WADSWORTH, within the 34th and 44th mins, the adversary first forces the master to take a wrong action to change the generation output to 1000 MW once the master observes low generation output at the 34th minute due to modification of the measurements of generation output. Further, when the operator takes this action to address the low generation output, the intruder changes the command from 1000 MW to 0 MW to cause contingency. To be stealthier, the intruder also modifies the polled response from outstation with the same setpoint value of 1000 MW from the interval 39 to 44 min except at 42nd min, as set by the operator, to prevent the master from observing the contingency caused by the intruder in first two stages. The snort alerts generated in this interval are shown in Fig. 8.
6 Results and Analysis
In this section, DoS and MiTM attacks are performed and analyzed on the DNP3 sessions between the masters and outstations based on the four use cases, which are summarized in Table 4. The effectiveness of the DoS attack is evaluated by varying attack strength and studying its impact on the RTT and throughput of DNP3 traffic. The time frame of power system operations compared with the attack time frame plays a major role; for example, the time frame of inverter and stator transient control are in the order of milliseconds, while control of voltage stability, power flow, and unit dispatch range from 10 to 1000 seconds. Hence, it is essential to minimize RTT to ensure that the control commands are processed by the field devices on time.
The use cases for MiTM attacks are tested with the RTAC and OpenDNP3 master. Experiments are conducted by varying the number of DNP3 masters, as well as the polling interval. Each master communicates with its substation, and we assume that 5 or 10 master are connected with their respective outstations. These experiments are performed to study the success rates of the attacker in causing the desired contingency of each use case. The adversary is restricted by the available resources in the Linux containers in CORE, thus the attacks are stochastic in nature. As the number of masters increases, the amount of traffic an intruder processes increases, which results in higher attack miss rates, i.e., the probability that the attacker fails to modify a sniffed packet. The results demonstrate the effective implementation of the use cases by observing the real-time physical side data at different locations in the testbed.
We also study the number of active TCP connections as impacted by retransmission during the progression of the attack based on different polling rates and varying DNP3 masters. The adversary success probability, the average retransmission rates, the packet processing times, and the average RTT for performing each FCI and FDI attack, and the Snort alert statistics are key characteristics for detection. Snort IDS is used to detect the ICMP flood attack as well as the ARP spoof attack (Section 4) that reroutes packets to the adversary and allows modifications to take place.
6.1 DoS attack evaluation
The DoS attack is performed by increasing the ICMP payload size for a fixed interval rate, as well as by varying the interval rate with the fixed payload size, to determine their impact on the RTT and throughput of DNP3 traffic. For all the experiments, the virtual Ethernet communication links in the network have a fixed bandwidth of 10 Mbps, with a 160 transmission delay.
We first run polling at an interval of 30 and 60 s and DIRECT OPERATE commands from the DNP3 master without any attack, to verify the network performance. Then, either the delay interval or payload length of DoS traffic is altered, and the same polling and control operations are performed.
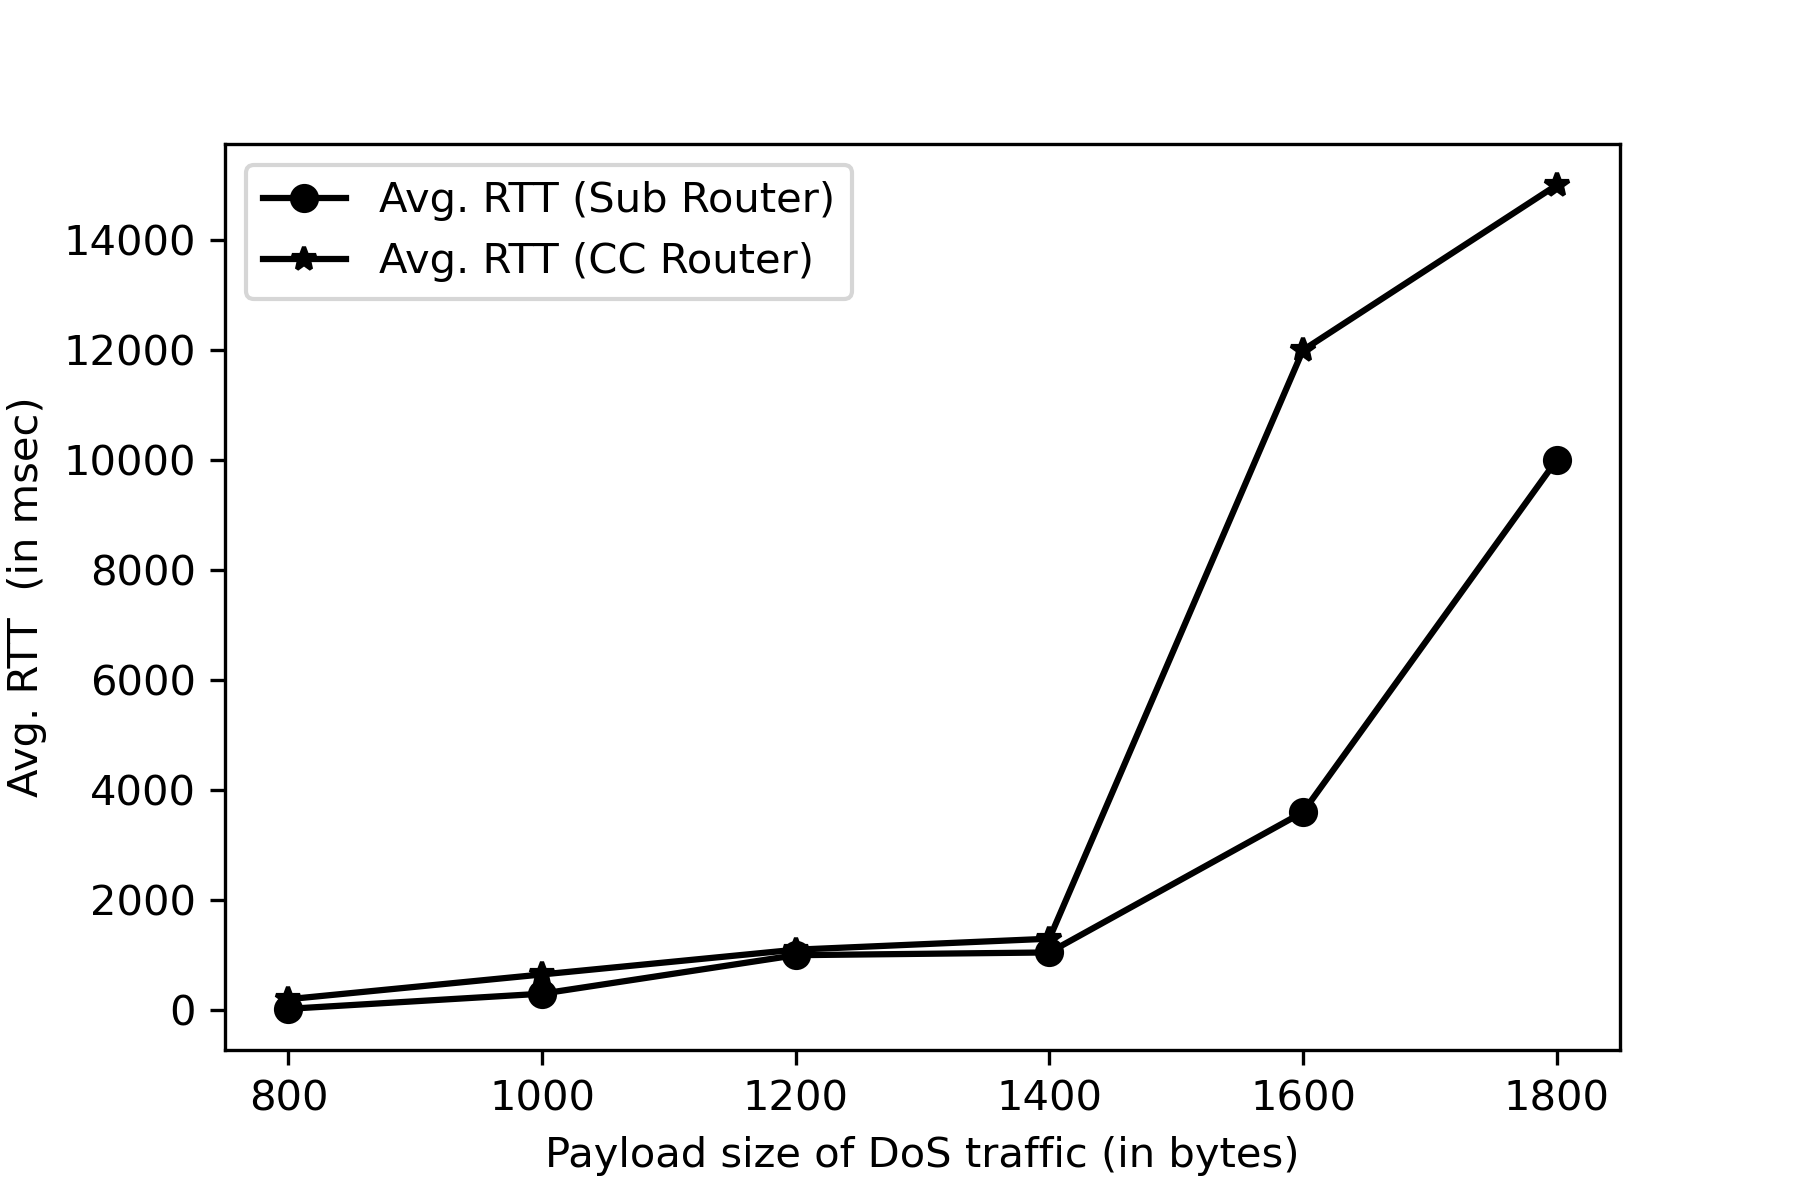
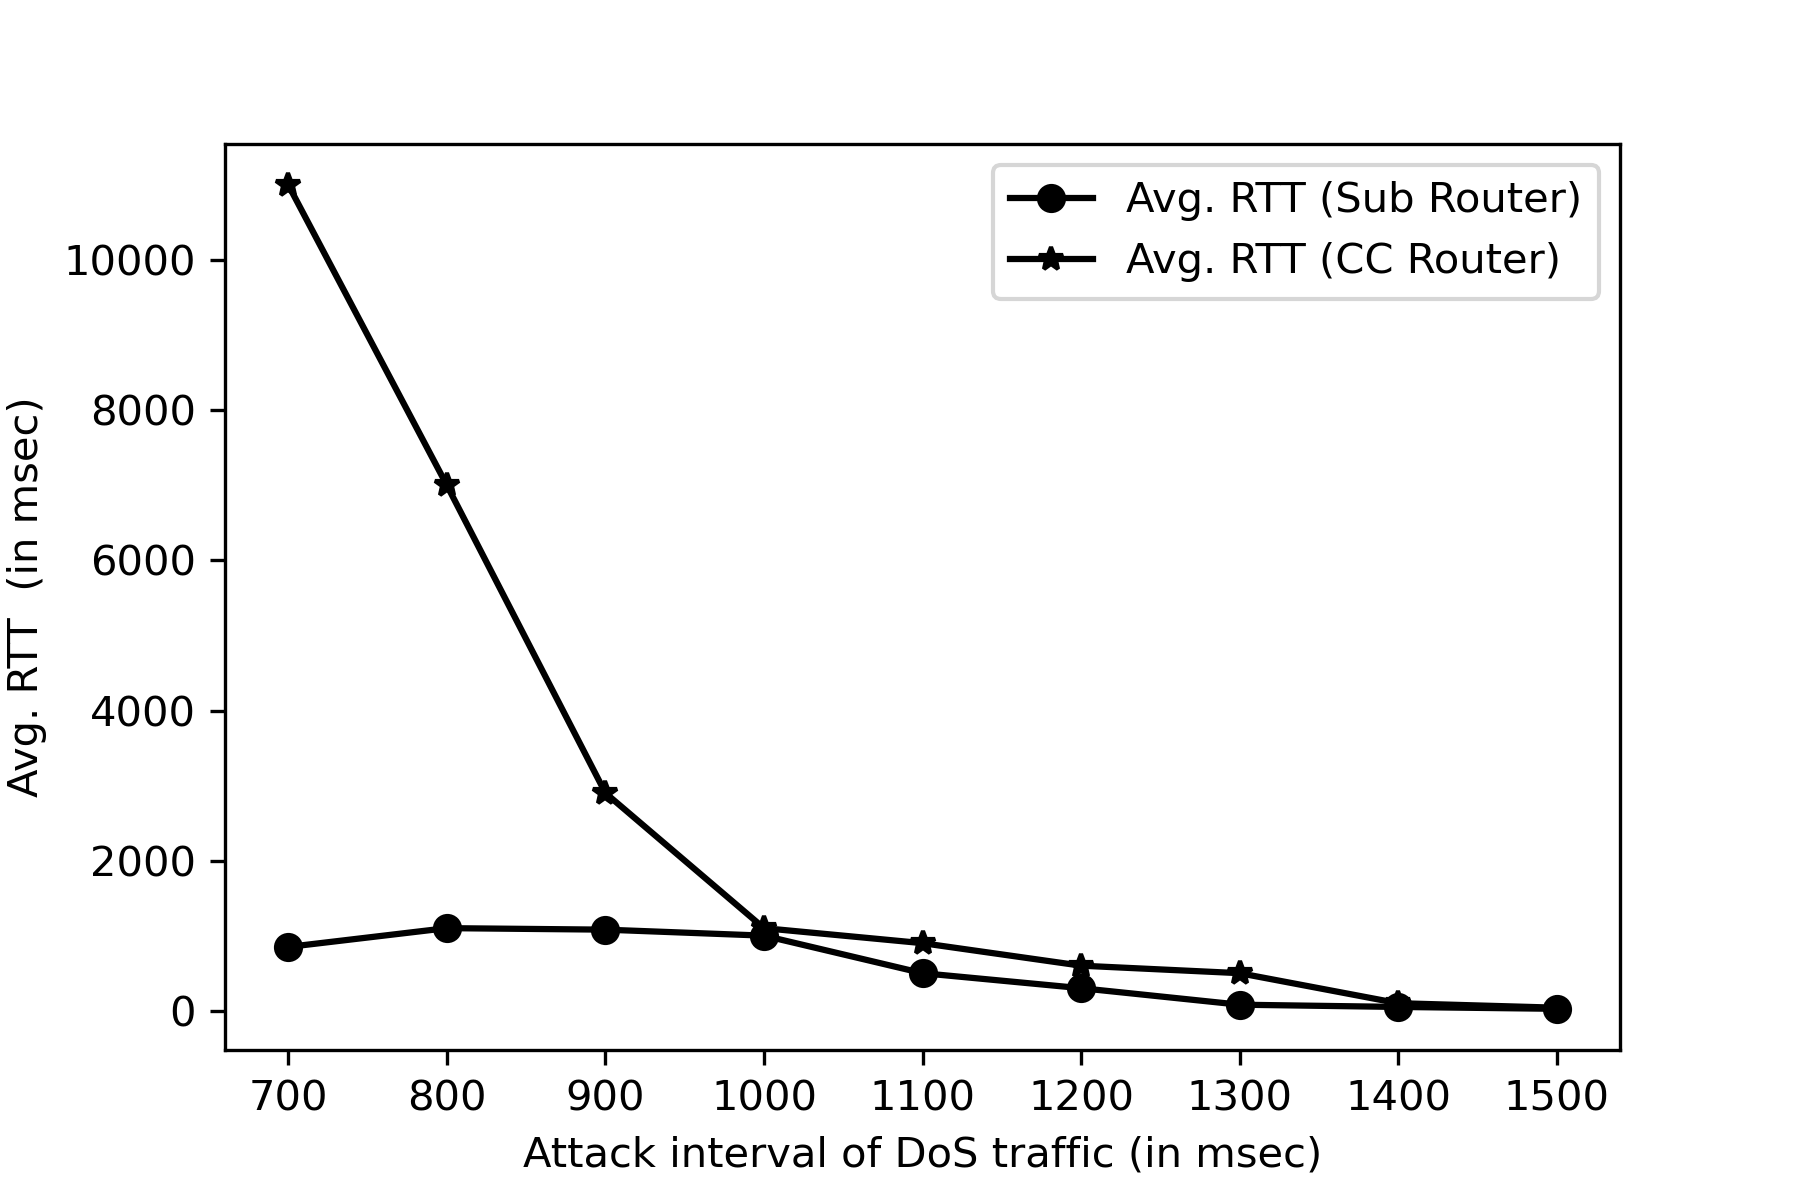
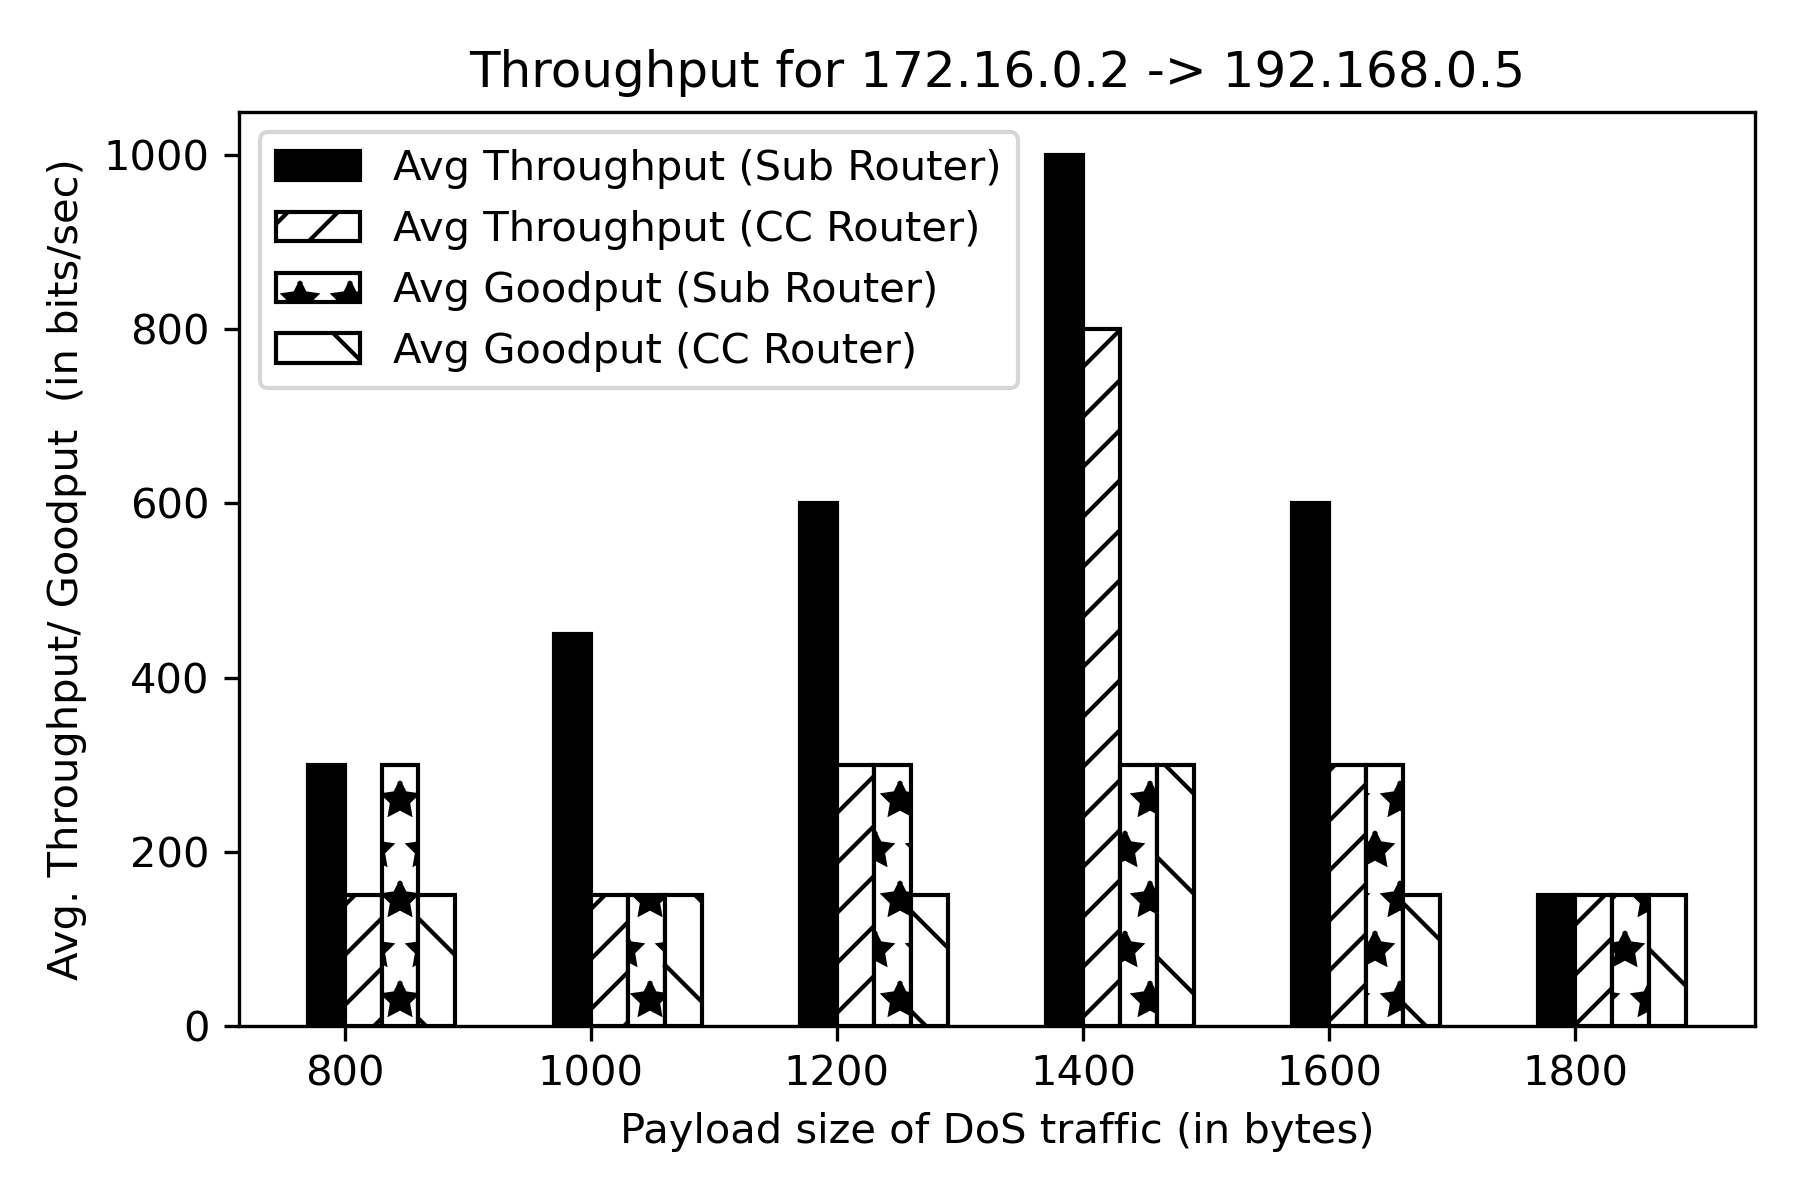
The DoS attack is performed by the compromised device in the substation, encircled in red, as shown in Fig. 3. The DoS attack is directed at two targets: the substation router and the control center router, and we seek to determine which device is impacted more by a DoS event. From the DoS trials directed at the substation router, we observe that only the broadcast domain of the substation LAN is exhausted. However, if the attack is directed at the control center router, the link between the two routers as well as the broadcast domain of the substation LAN are exhausted. Both DoS attacks are performed using [60] while keeping a fixed interval rate of 1000 ms and increasing the payload size of the ICMP packets from 800 bytes to 1800 bytes in increments of 200 bytes for each trial. It can be observed from Fig. 9 that average RTT increases with payload size, and that the attack on the control center router has a higher impact in comparison to substation router.
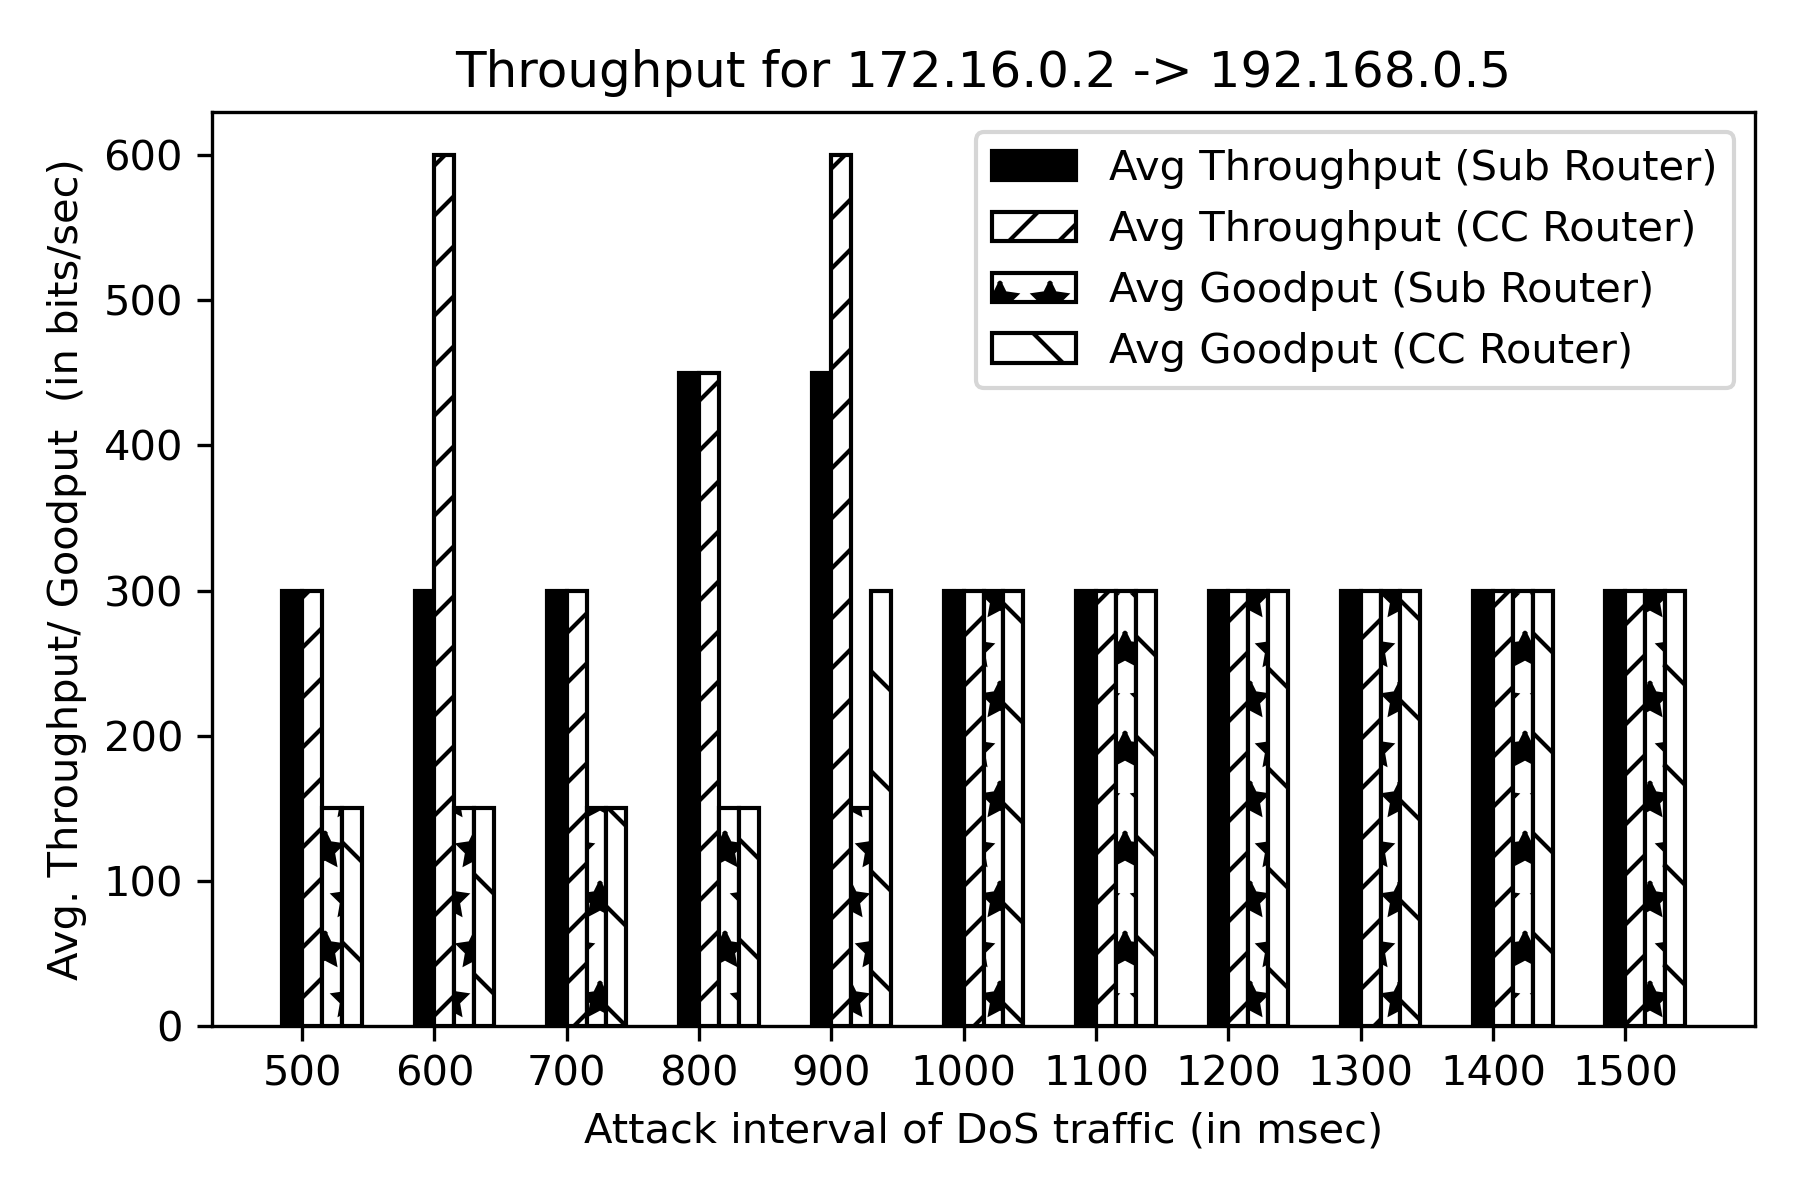
Further, DoS attacks are performed by keeping the payload size of the ICMP packet fixed at 1000 bytes while decreasing the ICMP packet arrival rate from 1500 ms to 500 ms in step decrements of 100 ms for each consecutive trial. Fig. 10 shows that the average RTT decreases with increase in attack interval as well as the lower attack interval has higher impact on the control center router in comparison to the substation router.
A DoS attack primarily affects the target’s downstream bandwidth. Hence, the average throughput will be affected as the bandwidth of the link is affected. The average throughput for the substation router is calculated using the transmission time of DNP3 packets, as per Eq. 1:
| (1) |
The average throughput depends on the command type from the DNP3 master. For example, the response payload size for the polling will be quite high compared to the response of the OPERATE commands. The goodput is equal to the throughput if there are no retransmissions.
In Fig. 11, we observe that the throughput and goodput increase as the payload size increases up to certain extent, then they decrease due to congestion in the network. It can also be observed that the difference between throughput and goodput increases as the payload size increases due to high retransmission caused by the congestion. Similarly, reduced goodput is also observed when the attack interval is lowered from 1500 ms to 500 ms as seen in Fig. 12.
6.2 MiTM attack evaluation
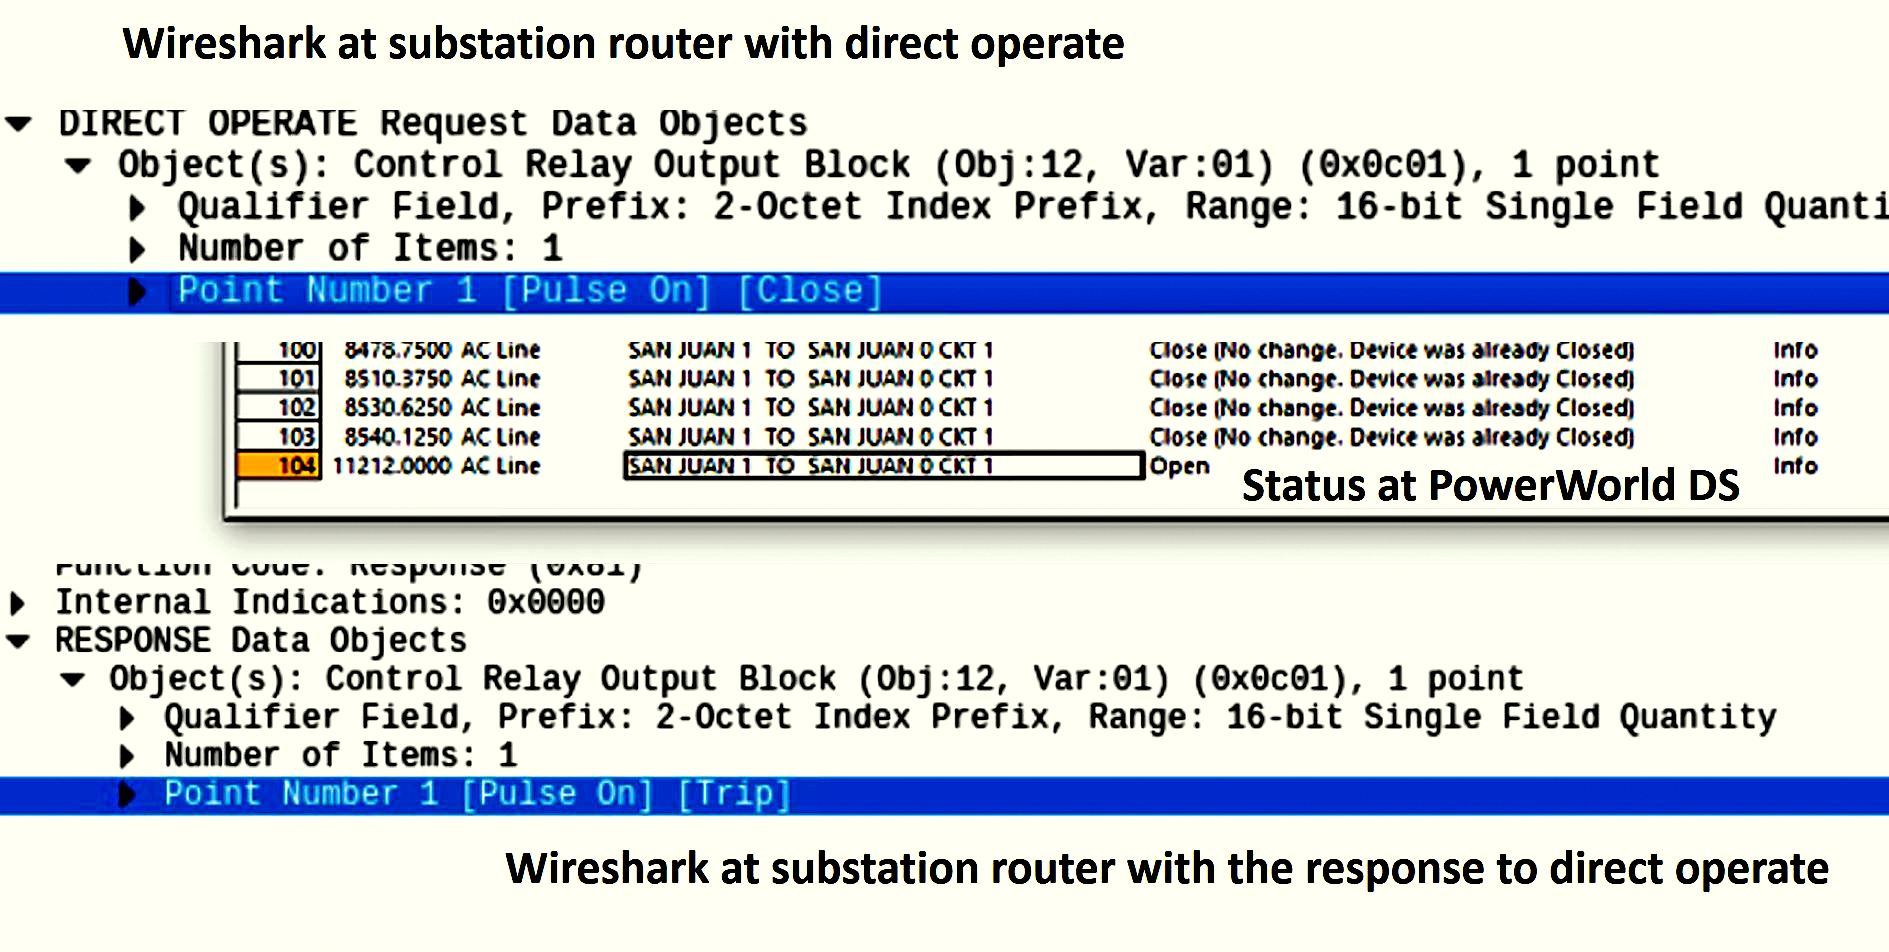
In the MiTM attacks, both master and outstation DNP3 packets are captured at the adversary’s machine located in substation LAN. Fig. 13 shows Wireshark sniffing the DNP3 DIRECT OPERATE command from the master in addition to the response from outstation. As described in Section 5, the CLOSE command is replaced by the TRIP command as observed from the response, as well as the DNP3 log of PWDS as seen in Fig. 13.
The RTT for MiTM attacks is small compared to the RTT for a DoS attack. In a DoS attack, the RTT depends on the number of retransmissions, but in a MiTM attack, the RTT depends on how much time the attacker takes to parse the packet, modify the payload, recalculate the checksum and CRCs, and to forward the packet to the target. There is no substantial retransmission in the case of MiTM attacks, if the intrusion is stealthy.
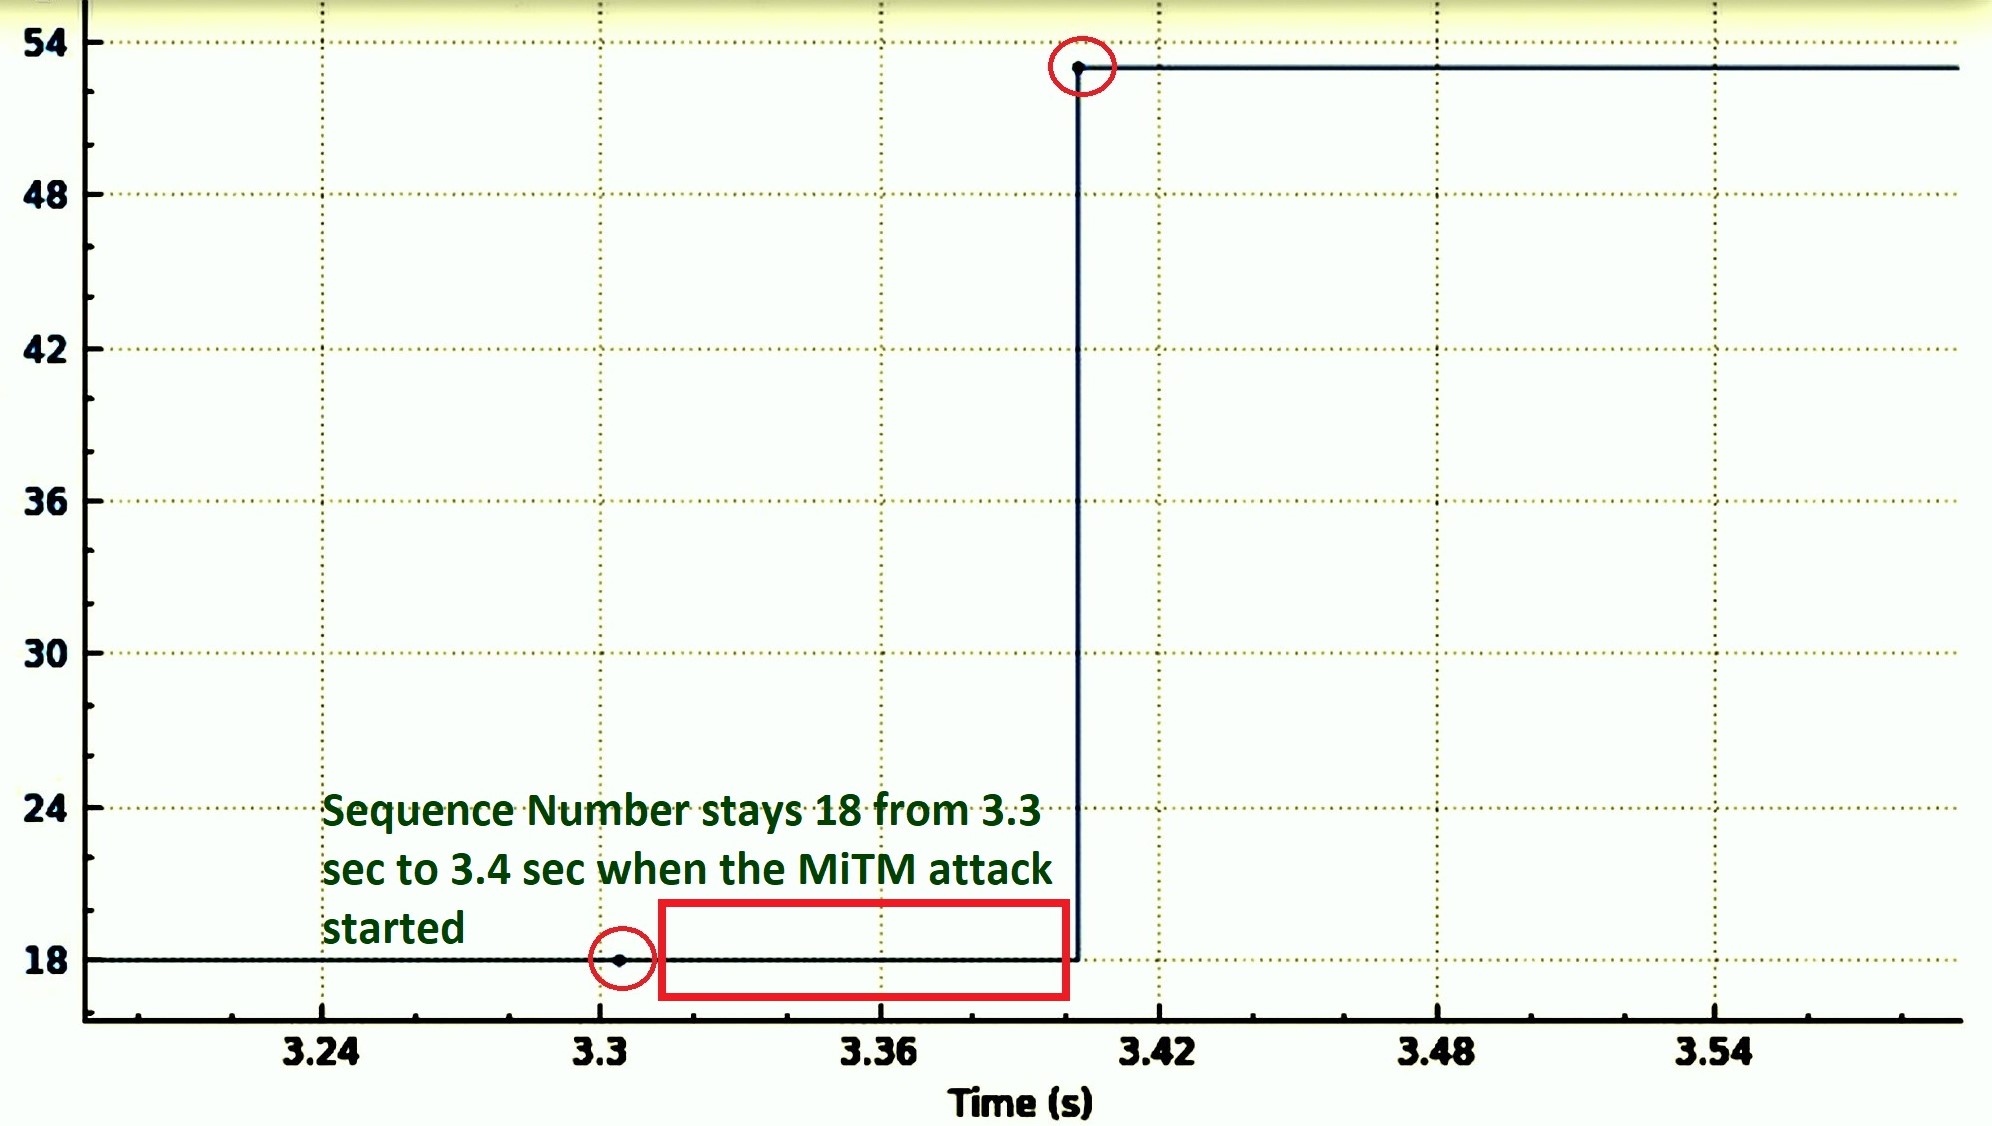
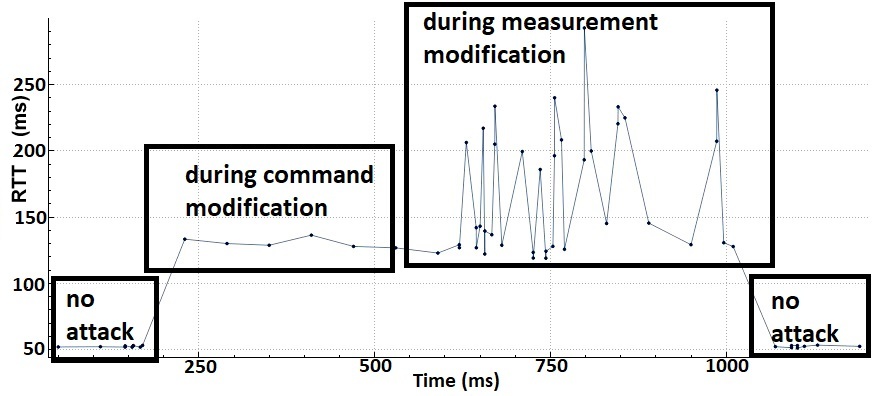
The occurrence of a MiTM attack is validated both by observing a rise in RTT compared to the normal operation in Fig. 15 and from its sequence number graph Fig. 14. Specifically, in Fig. 15, the MiTM attack is performed from 200 s to 1000 s, and the RTT is observed to increase to almost 150 ms during sniffing and FCI attack and to almost 200 ms during FDI attacks on measurement, indicating the time taken by the adversary’s machine for parsing and modification affects the overall RTT. Additionally, as the sequence number remains at 18 from 3.3 s to 3.4 s in Fig. 14, it indicates the attacker used the same sequence number to forward the modified packet.
6.3 Use case specific physical impact evaluation
| FCI | FCI with FDI | ||
|---|---|---|---|
| UC1 | UC2 | UC3 | UC4 |
| Bin. Commands | Alg.,Bin. Commands | Measurements=Commands | Measurements= Commands=Measurements |
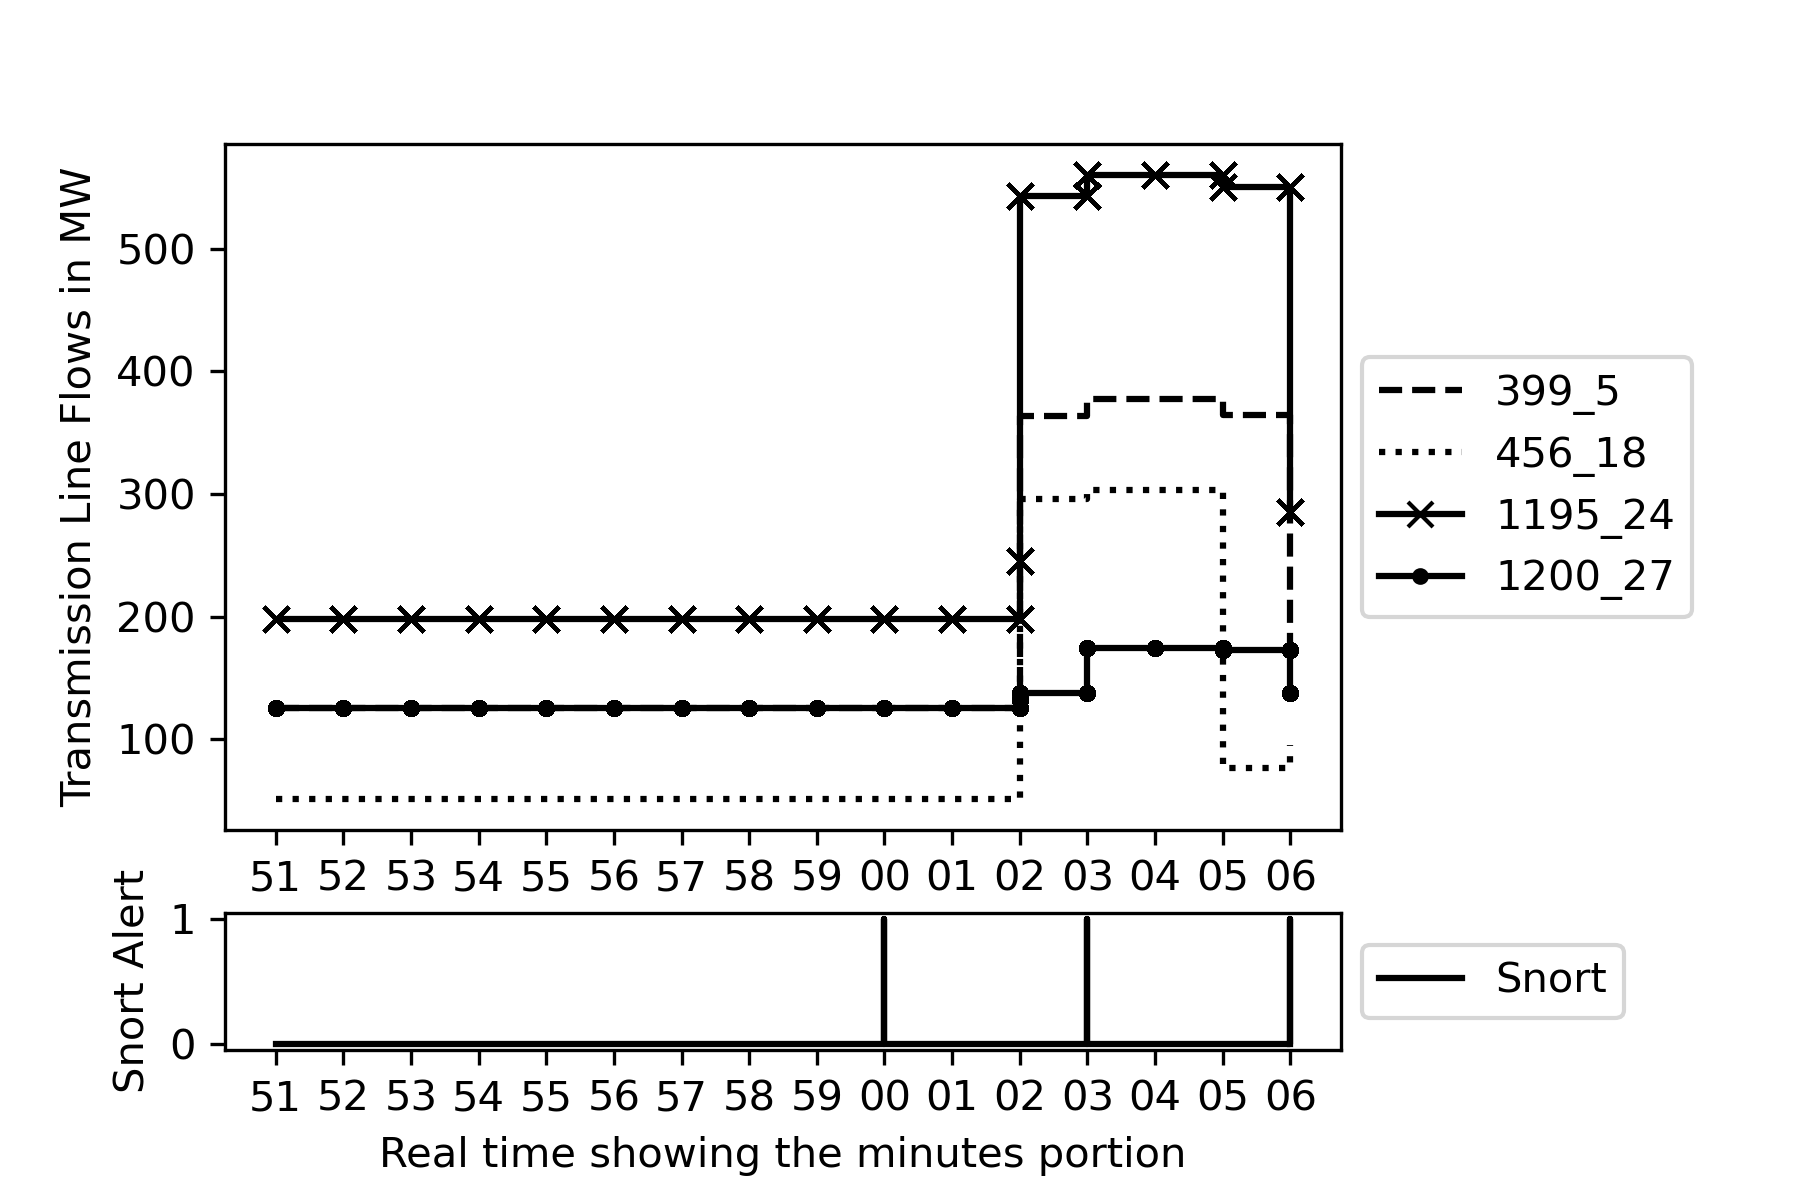
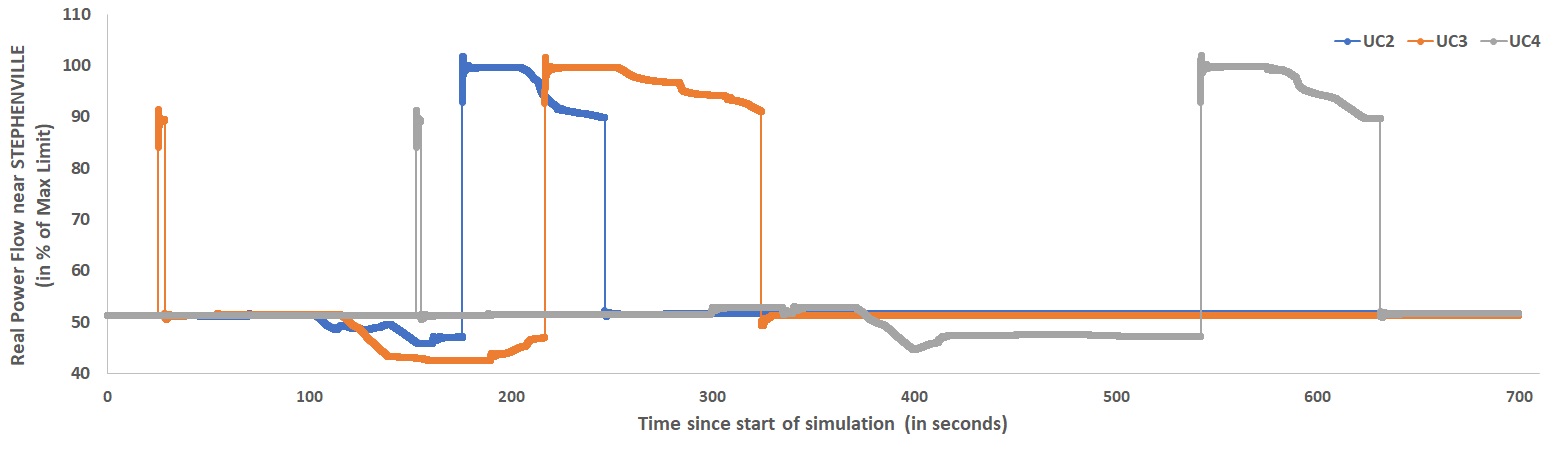
The physical impact is evaluated based on the four use cases shown in Table 4, described in detail in Section 5. The target of the MiTM intruders in UC2, UC3, and UC4 is the same but they adopt different strategies to accomplish it. These use cases detailed in Section 5 demonstrate increasing complexity. The time to cause the same overload in branch [5286, 5046] differs based on the strategy in each use case, as illustrated in Fig. 16. For Use Cases 2, 3, and 4, the overload occurs at 173 s, 216 s and 541 s, respectively. The differences in time as well as the system dynamics are due to the amount and sequence of intrusions in these three strategies.
6.4 Evaluation of MiTM attack practicality
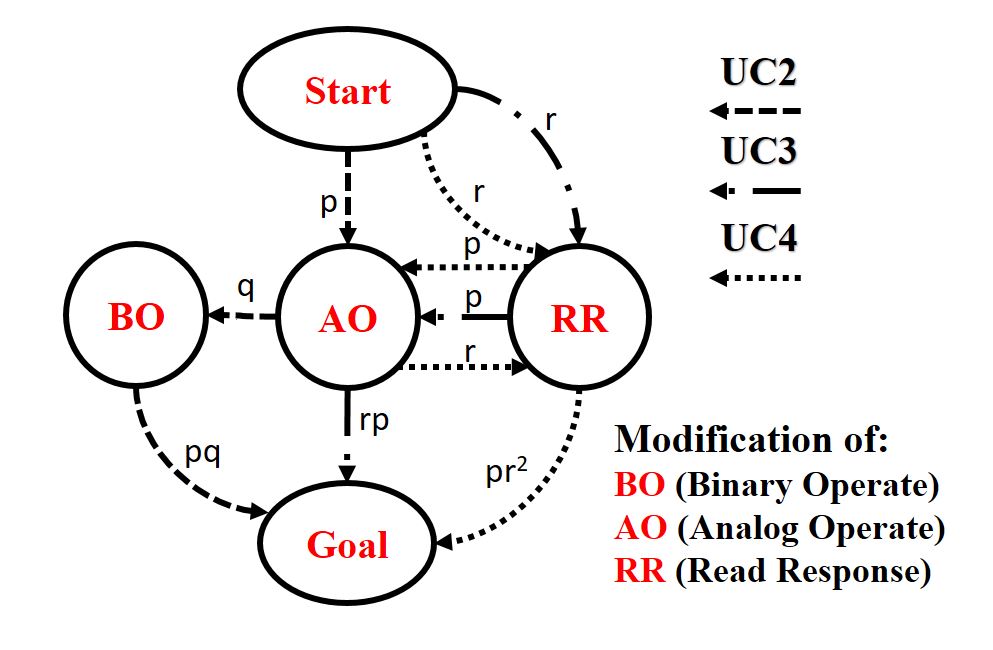
The successful implementation of the attack use cases requires the intruder to cause the binary operate (BO) and analog operate (AO) FCIs and read response (RR) FDIs in a particular sequence as shown in Fig 17. Due to the resource limitations at the attacker, such as sniffing from a single network buffer, it can only accomplish the modification operations with a success probability of , , and for BO, AO, and RR packets separately. Assuming the number of BO, AO and RR operations to be , and , the expected number of steps that the intruder has to take to reach its goal is inverse of the success probabilities, which is for UC2, for UC3, and for UC4.
The intruder continues the attack until it reaches its goal to overload the branch [5285,5046]. Hence, we evaluate the average minimum number of FCI and FDI modifications the intruder has to perform to reach its target. The success probability depends on the available resources of the intruder, the master polling rate, as well as the number of masters polling the measurements.
For UC4, the number of FDI attempts is higher because the processing time of an FDI is higher than for an FCI, as it involves parsing the DNP3 response from outstations that usually have large payloads. This higher processing time reduces the success probability of the FDI attack. For UC3, in the RTAC case, an exception of higher FCIs are observed due to the automated generation protection control logics incorporated in the RTAC. The protection logic ensured that the generation setpoint increases when the generation output reading goes below a certain threshold.
Table 5 shows the minimum number of FCI and FDI attempts on average that are required to accomplish the final goal of the intruder for each use case with both RTAC and OpenDNP3 master.
| Type | OpenDNP3 Master | RTAC Master | ||||
|---|---|---|---|---|---|---|
| UC2 | UC3 | UC4 | UC2 | UC3 | UC4 | |
| FDI | N/A | 25.5 | 27.25 | N/A | 17.7 | 30.3 |
| FCI | 16.75 | 15.5 | 18.6 | 27.3 | 54.7 | 17.4 |
average by the intruder for accomplishing its goal in UC2, UC3, and UC4.
From queueing theory, we know that the traffic intensity is computed based on the packet arrival rate and the service rate as [61]. From intruder reference, the arrival rate is determined by the polling rates from the master as well as the number of DNP3 masters. The service rate is fixed since it is the single intrusion node that processes the incoming traffic. The higher the , the lower is the success probability for the intruder to modify the traffic. In literature, the arrival rate distribution can be deterministic or random. In our simulation, since we observe polled traffic as well as commands, it can be considered a random distribution. Every payload that the intruder fails to forward results in drop of the packet, and that triggers retransmissions from the sender. The algorithms developed and utilized for FDI and FCI attacks affect the processing time.
6.5 ELK stack visualization
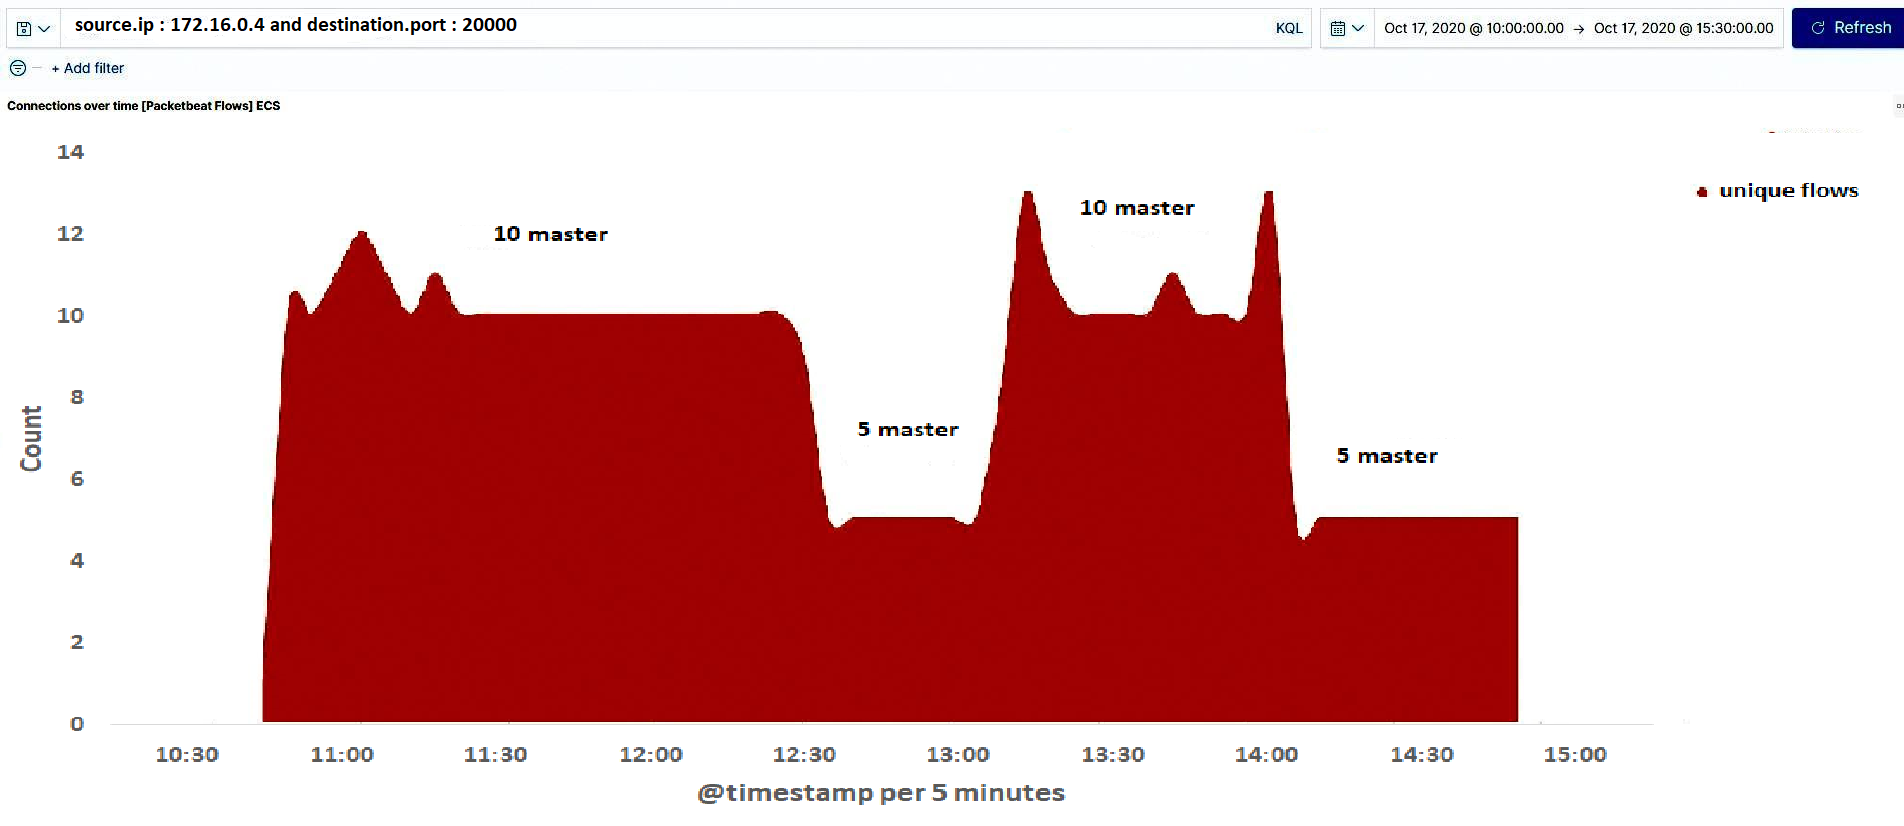
RESLab visualizes the results using ELK stack, where Fig. 18 shows a real-time count of the number of active TCP flows while the experiments are being performed for the four use cases with 5 and 10 DNP3 masters. Since the number of active TCP flows is an indicator of the number of connected clients, it helps us to detect if there are more than intended number of clients. At certain times, we observe more than 10 active connections, as some clients lose connection and re-initate a new connection with a different source port number due to the MiTM attacks. The number of active TCP flows are the indicator of number of masters connected. Higher variance of connections are observed in 10 master cases due to higher retransmissions.
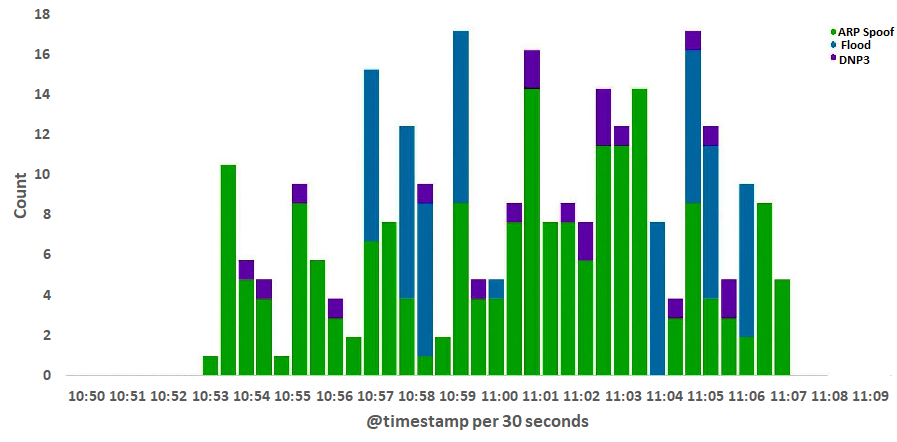
The Kibana Query Language (KQL) filters helps us to filter traffic, based on the source IP of the DNP3 master (i.e., 172.16.0.2) and the destination port in the DNP3 outstations (i.e., 20000) as shown in Fig. 18. A separate Logstash index is created in Elasticsearch to store real-time snort alerts. Fig. 19 shows the histogram created with Kibana for different types of snort alerts (ICMP flood, ARP spoof, DNP3 operate) during one of the scenarios from the use cases.
6.6 Discussion
These results validate the integration of emulators, simulators, hardware, and software tools including visualization and IDS in RESLab by performing DoS and MiTM attacks on the power system. Through four use cases, RESLab shows how such attacks can impact the electric grid.
To understand the dynamics of the DoS attack, results present the impact on RTT and throughput due to different attack intervals and payload sizes of ICMP injections in DoS. For understanding the dynamics of the MiTM attack, we analyze strategies adopted by the intruder to cause the desired contingencies. We also explore the MiTM attacks with different polling intervals and number of master applications, which impacts on retransmission rates, RTT, and packet processing time. The intrusions performed in UC3 and UC4 provide the platform to create and mitigate FDI attacks on state estimation which involves an intruder tampering the measurements.
The simulations performed for the substation network in CORE consisted of one broadcast domain. This causes the intruder to observe the traffic related to all the substations. The number of DNP3 masters are limited to 5 or 10 in our scenarios which is enough to enable the intruder to accomplish its contingencies such that its components are in these 5 or 10 substations. However, they are modeled through a single substation network in CORE. Hence, the intruder’s capacity to inject modified traffic is resource-limited due to having a single substation LAN in CORE, as the intruder can only process traffic on the single network buffer.
7 Conclusion
A cyber-physical testbed provides a platform to understand security threat events and their impact on the power grid. This will help to facilitate grid resiliency to cyber intrusions. In this work, we present our testbed RESLab, where its architecture makes use of components such as vSphere, CORE, PWDS, Snort, among others, to successfully emulate the physical and cyber component of a synthetic large scale electric grid, and we demonstrate the use of DNP3 based control and measurement traffic to and from substation field devices. The methodology and mechanics behind our testbed are demonstrated through four use cases utilizing two types of cyber intrusion experiments: DoS and MiTM. The dynamics of the intrusions are validated by implementing use cases targeting specific parts of the grid. These intrusion events are evaluated from their respective characteristic features, including latency (RTT), throughput, and goodput in the emulated WAN network.
By providing a safe proving ground for cyber-attack experimentation, RESLab is a platform to study defense mechanisms, where its ability to generate real-time datasets and customize monitoring, visualization, and detection will play a major role in developing cyber-physical state estimation, situational awareness, optimal response, etc. to prevent impending contingencies.
8 Acknowledgements
This research is supported by the US Department of Energy’s (DoE) Cybersecurity for Energy Delivery Systems program under award DE-OE0000895.
References
- E. Targett [2020] E. Targett. High Voltage Attack: EU’s Power Grid Organisation Hit by Hackers, March 2020. URL https://www.cbronline.com/news/eu-power-grid-organisation-hacked.
- Alert [2016] D Alert. Analysis of the cyber attack on the ukrainian power grid, 2016.
- Streltsov [2017] Lev Streltsov. The system of cybersecurity in ukraine: principles, actors, challenges, accomplishments. European Journal for Security Research, 2(2):147–184, 2017.
- Langner [2011] Ralph Langner. Stuxnet: Dissecting a cyberwarfare weapon. IEEE Security & Privacy, 9(3):49–51, 2011.
- Pan et al. [2015] Shengyi Pan, Thomas Morris, and Uttam Adhikari. Developing a hybrid intrusion detection system using data mining for power systems. IEEE Transactions on Smart Grid, 6(6):3104–3113, 2015.
- Adhikari et al. [2016] Uttam Adhikari, Thomas Morris, and Shengyi Pan. Wams cyber-physical test bed for power system, cybersecurity study, and data mining. IEEE Transactions on Smart Grid, 8(6):2744–2753, 2016.
- Poudel et al. [2017] Shiva Poudel, Zhen Ni, and Naresh Malla. Real-time cyber physical system testbed for power system security and control. International Journal of Electrical Power & Energy Systems, 90:124–133, 2017.
- Yang et al. [2017] Y. Yang, H. Xu, L. Gao, Y. Yuan, K. McLaughlin, and S. Sezer. Multidimensional intrusion detection system for iec 61850-based scada networks. IEEE Transactions on Power Delivery, 32(2):1068–1078, 2017.
- Fovino et al. [2010] I. N. Fovino, M. Masera, L. Guidi, and G. Carpi. An experimental platform for assessing scada vulnerabilities and countermeasures in power plants. In 3rd International Conference on Human System Interaction, pages 679–686, 2010.
- Oyewumi et al. [2019] I. A. Oyewumi, A. A. Jillepalli, P. Richardson, M. Ashrafuzzaman, B. K. Johnson, Y. Chakhchoukh, M. A. Haney, F. T. Sheldon, and D. C. de Leon. Isaac: The idaho cps smart grid cybersecurity testbed. In 2019 IEEE Texas Power and Energy Conference (TPEC), pages 1–6, 2019.
- Chen et al. [2014] B. Chen, K. L. Butler-Purry, A. Goulart, and D. Kundur. Implementing a real-time cyber-physical system test bed in rtds and opnet. In 2014 North American Power Symposium (NAPS), pages 1–6, 2014.
- Nelson et al. [2016] A. Nelson, S. Chakraborty, Dexin Wang, P. Singh, Qiang Cui, Liuqing Yang, and S. Suryanarayanan. Cyber-physical test platform for microgrids: Combining hardware, hardware-in-the-loop, and network-simulator-in-the-loop. In 2016 IEEE Power and Energy Society General Meeting (PESGM), pages 1–5, 2016.
- Mallouhi et al. [2011] M. Mallouhi, Y. Al-Nashif, D. Cox, T. Chadaga, and S. Hariri. A testbed for analyzing security of scada control systems (tasscs). In ISGT 2011, pages 1–7, 2011.
- Aghamolki et al. [2015] H. G. Aghamolki, Z. Miao, and L. Fan. A hardware-in-the-loop scada testbed. In 2015 North American Power Symposium (NAPS), pages 1–6, 2015.
- Sahu et al. [2016] A. Sahu, A. Goulart, and K. Butler-Purry. Modeling ami network for real-time simulation in ns-3. In 2016 Principles, Systems and Applications of IP Telecommunications (IPTComm), pages 1–8, 2016.
- Yafen et al. [2011] S. Yafen, C. Jiaxi, Y. Jing, and H. Ning. Reliability analysis of system-in-the-loop network platform based on delays. In 2011 Seventh International Conference on Computational Intelligence and Security, pages 750–753, 2011.
- van Heerden et al. [2013] R. van Heerden, H. Pieterse, I. Burke, and B. Irwin. Developing a virtualised testbed environment in preparation for testing of network based attacks. In 2013 International Conference on Adaptive Science and Technology, pages 1–8, 2013.
- Tan et al. [2012] S. Tan, W. Song, Qifen Dong, and L. Tong. Score: Smart-grid common open research emulator. In 2012 IEEE Third International Conference on Smart Grid Communications (SmartGridComm), pages 282–287, Nov 2012. doi: 10.1109/SmartGridComm.2012.6485997.
- Venkataramanan et al. [2016] V. Venkataramanan, A. Srivastava, and A. Hahn. Real-time co-simulation testbed for microgrid cyber-physical analysis. In 2016 Workshop on Modeling and Simulation of Cyber-Physical Energy Systems (MSCPES), pages 1–6, April 2016. doi: 10.1109/MSCPES.2016.7480220.
- Raybourn et al. [2018] Elaine M Raybourn, Michael Kunz, David Fritz, and Vince Urias. A zero-entry cyber range environment for future learning ecosystems. In Cyber-Physical Systems Security, pages 93–109. Springer, 2018.
- Johnson [2017] Jay Johnson. Sceptre: Power system and networking co-simulation environment, 07 2017.
- Palmintier et al. [2017] B. Palmintier, D. Krishnamurthy, P. Top, S. Smith, J. Daily, and J. Fuller. Design of the helics high-performance transmission-distribution-communication-market co-simulation framework. In 2017 Workshop on Modeling and Simulation of Cyber-Physical Energy Systems (MSCPES), pages 1–6, 2017.
- Hong et al. [2015] Junho Hong, Reynaldo Nuqui, Dmitry Ishchenko, Zhenyuan Wang, Tao Cui, Anil Kondabathini, David Coats, and S Kunsman. Cyber-physical security test bed: A platform for enabling collaborative cyber defense methods. In PACWorld Americas Conference, 2015.
- Liu et al. [2015] Ren Liu, Ceeman Vellaithurai, Saugata S Biswas, Thoshitha T Gamage, and Anurag K Srivastava. Analyzing the cyber-physical impact of cyber events on the power grid. IEEE Transactions on Smart Grid, 6(5):2444–2453, 2015.
- Kezunovic et al. [2017] Mladen Kezunovic, Ahad Esmailian, Manimaran Govindarasu, and Ali Mehrizi-Sani. The use of system in the loop, hardware in the loop, and co-modeling of cyber-physical systems in developing and evaluating new smart grid solutions. In Proceedings of the 50th Hawaii International Conference on System Sciences, 2017.
- Ashok et al. [2015] Aditya Ashok, Pengyuan Wang, Matthew Brown, and Manimaran Govindarasu. Experimental evaluation of cyber attacks on automatic generation control using a cps security testbed. In 2015 IEEE Power & Energy Society General Meeting, pages 1–5. IEEE, 2015.
- Papaspiliotopoulos et al. [2015] Vasileios A Papaspiliotopoulos, George N Korres, Vasilis A Kleftakis, and Nikos D Hatziargyriou. Hardware-in-the-loop design and optimal setting of adaptive protection schemes for distribution systems with distributed generation. IEEE Transactions on Power Delivery, 32(1):393–400, 2015.
- Ashok et al. [2015] A. Ashok, Pengyuan Wang, M. Brown, and M. Govindarasu. Experimental evaluation of cyber attacks on automatic generation control using a cps security testbed. In 2015 IEEE Power Energy Society General Meeting, pages 1–5, 2015.
- Overbye et al. [2019] T. J. Overbye, Z. Mao, A. Birchfield, J. D. Weber, and M. Davis. An Interactive, Stand-Alone and Multi-User Power System Simulator for the PMU Time Frame. In 2019 IEEE Texas Power and Energy Conference (TPEC), pages 1–6, 2019.
- Overbye et al. [2017] Thomas J Overbye, Zeyu Mao, Komal S Shetye, and James D Weber. An interactive, extensible environment for power system simulation on the pmu time frame with a cyber security application. In 2017 IEEE Texas Power and Energy Conference (TPEC), pages 1–6. IEEE, 2017.
- Mao et al. [2020] Zeyu Mao, Hao Huang, and Katherine Davis. W4ips: A web-based interactive power system simulation environment for power system security analysis. In Proceedings of the 53rd Hawaii International Conference on System Sciences, 2020.
- Johnson et al. [2018] Jay Johnson, Ron Ablinger, Roland Bruendlinger, Bob Fox, and Jack Flicker. Interconnection standard grid-support function evaluations using an automated hardware-in-the-loop testbed. IEEE Journal of Photovoltaics, 8(2):565–571, 2018.
- Thornton et al. [2017] Matsu Thornton, Mahdi Motalleb, Holm Smidt, John Branigan, Pierluigi Siano, and Reza Ghorbani. Internet-of-things hardware-in-the-loop simulation architecture for providing frequency regulation with demand response. IEEE Transactions on Industrial Informatics, 14(11):5020–5028, 2017.
- Piesciorovsky and Schulz [2017] Emilio C Piesciorovsky and Noel N Schulz. Fuse relay adaptive overcurrent protection scheme for microgrid with distributed generators. IET Generation, Transmission & Distribution, 11(2):540–549, 2017.
- Becejac et al. [2020] T. Becejac, C. Eppinger, A. Ashok, U. Agrawal, and J. O’Brien. Prime: a real-time cyber-physical systems testbed: from wide-area monitoring, protection, and control prototyping to operator training and beyond. IET Cyber-Physical Systems: Theory Applications, 5(2):186–195, 2020.
- Azimian et al. [2019] B. Azimian, P. M. Adhikari, L. Vanfretti, and H. Hooshyar. Cross-platform comparison of standard power system components used in real time simulation. In 2019 7th Workshop on Modeling and Simulation of Cyber-Physical Energy Systems (MSCPES), pages 1–6, 2019.
- Stifter et al. [2018] Matthias Stifter, Jose Cordova, Jawad Kazmi, and Reza Arghandeh. Real-time simulation and hardware-in-the-loop testbed for distribution synchrophasor applications. Energies, 11(4):876, 2018.
- Yang et al. [2012] Y. Yang, K. McLaughlin, T. Littler, S. Sezer, E. G. Im, Z. Q. Yao, B. Pranggono, and H. F. Wang. Man-in-the-middle attack test-bed investigating cyber-security vulnerabilities in smart grid scada systems. In International Conference on Sustainable Power Generation and Supply (SUPERGEN 2012), pages 1–8, 2012.
- Kundu et al. [2020] Arnav Kundu, Abhijeet Sahu, Erchin Serpedin, and Katherine Davis. A3d: Attention-based auto-encoder anomaly detector for false data injection attacks. Electric Power Systems Research, 189:106795, 2020. ISSN 0378-7796. doi: https://doi.org/10.1016/j.epsr.2020.106795. URL http://www.sciencedirect.com/science/article/pii/S0378779620305988.
- Ozay et al. [2016] Mete Ozay, Inaki Esnaola, Fatos Tunay Yarman Vural, Sanjeev R Kulkarni, and H Vincent Poor. Machine learning methods for attack detection in the smart grid. IEEE Transactions on Neural Networks and Learning Systems, 27(8):1773–1786, 2016.
- [41] Open dnp3 documentation. https://dnp3.github.io/.
- cyb [2016] Analysis of the cyber attack on the ukrainian power grid: Defense use case. https://ics.sans.org/media/E-ISAC_SANS_Ukraine_DUC_5.pdf, 2016.
- Birchfield et al. [2017] A. B. Birchfield, T. Xu, K. M. Gegner, K. S. Shetye, and T. J. Overbye. Grid structural characteristics as validation criteria for synthetic networks. IEEE Transactions on Power Systems, 32(4), July 2017. ISSN 0885-8950.
- Wlazlo et al. [2019] P. Wlazlo, K. Price, C. Veloz, A. Sahu, H. Huang, A. Goulart, K. Davis, and S. Zounouz. A cyber topology model for the texas 2000 synthetic electric power grid. In 2019 Principles, Systems and Applications of IP Telecommunications (IPTComm), pages 1–8, 2019.
- Davis et al. [2006] C. M. Davis, J. E. Tate, H. Okhravi, C. Grier, T. J. Overbye, and D. Nicol. Scada cyber security testbed development. In 2006 38th North American Power Symposium, pages 483–488, 2006.
- Gaudet et al. [2020] N. Gaudet, A. Sahu, A. E. Goulart, E. Rogers, and K. Davis. Firewall configuration and path analysis for smartgrid networks. In 2020 IEEE International Workshop Technical Committee on Communications Quality and Reliability (CQR), pages 1–6, 2020.
- Huang and Davis [2018] Hao Huang and Katherine Davis. Extracting substation cyber-physical architecture through intelligent electronic devices’ data. In 2018 IEEE Texas Power and Energy Conference (TPEC), pages 1–6. IEEE, 2018.
- Schroder [2018] Carla Schroder. Dynamic linux routing with quagga. https://www.linux.com/topic/networking/dynamic-linux-routing-quagga/, 2018.
- [49] Core services. http://coreemu.github.io/core/services.html.
- rta [2018] Acselerator rtac sel-5033 software instruction manual. https://selinc.com/products/5033/, 2018.
- East et al. [2009] Samuel East, Jonathan Butts, Mauricio Papa, and Sujeet Shenoi. A taxonomy of attacks on the dnp3 protocol. volume 311, 03 2009. doi: 10.1007/978-3-642-04798-5_5.
- Schweitzer Engineering Laboratories. Inc [2020] Schweitzer Engineering Laboratories. Inc, Oct 2020. URL https://selinc.com/products/3530/.
- Orebaugh et al. [2005] Angela D. Orebaugh, Simon Biles, and Jacob Babbin. Snort Cookbook. O’Reilly Media, Inc., 2005. ISBN 0596007914.
- [54] Packetbeat in elk stack. https://www.elastic.co/beats/packetbeat.
- [55] Zabbix for network monitoring. https://www.zabbix.com/network_monitoring.
- Ortega et al. [2009] A. P. Ortega, X. E. Marcos, L. D. Chiang, and C. L. Abad. Preventing arp cache poisoning attacks: A proof of concept using openwrt. In 2009 Latin American Network Operations and Management Symposium, pages 1–9, 2009. doi: 10.1109/LANOMS.2009.5338799.
- Narimani et al. [2020] Mohammad Narimani, Hao Huang, Amarachi Umunnakwe, Zeyu Mao, Abhijeet Sahu, Saman Zonouz, and Kate Davis. Generalized contingency analysis based on graph theory and line outage distribution factor, 07 2020.
- Kalluri et al. [2016] R. Kalluri, L. Mahendra, R. K. S. Kumar, and G. L. G. Prasad. Simulation and impact analysis of denial-of-service attacks on power scada. In 2016 National Power Systems Conference (NPSC), pages 1–5, 2016. doi: 10.1109/NPSC.2016.7858908.
- Day [2015] Timothy Day. Dnp3, distributed network protocol v3 an introduction. https://na.eventscloud.com/file_uploads/b68188f3ce5b22895a67b1afe5e51b6a_DNP3IntroductionHORS.PDF, 2015.
- [60] Salvatore Sanfilippo. Dos attack tool. URL http://www.hping.org/hping3.html.
- Bertsekas and Gallager [1992] Dimitri Bertsekas and Robert Gallager. Data Networks (2nd Ed.). Prentice-Hall, Inc., USA, 1992. ISBN 0132009161.