On the Applicability of PEBS based Online Memory Access Tracking for Heterogeneous Memory Management at Scale
Abstract.
Operating systems have historically had to manage only a single type of memory device. The imminent availability of heterogeneous memory devices based on emerging memory technologies confronts the classic single memory model and opens a new spectrum of possibilities for memory management. Transparent data movement between different memory devices based on access patterns of applications is a desired feature to make optimal use of such devices and to hide the complexity of memory management to the end user. However, capturing memory access patterns of an application at runtime comes at a cost, which is particularly challenging for large-scale parallel applications that may be sensitive to system noise.
In this work, we focus on the access pattern profiling phase prior to the actual memory relocation. We study the feasibility of using Intel’s Processor Event-Based Sampling (PEBS) feature to record memory accesses by sampling at runtime and study the overhead at scale. We have implemented a custom PEBS driver in the IHK/McKernel lightweight multi-kernel operating system, one of whose advantages is minimal system interference due to the lightweight kernel’s simple design compared to other OS kernels such as Linux. We present the PEBS overhead of a set of scientific applications and show the access patterns identified in noise sensitive HPC applications. Our results show that clear access patterns can be captured with a 10% overhead in the worst-case and 1% in the best case when running on up to 128k CPU cores (2,048 Intel Xeon Phi Knights Landing nodes). We conclude that online memory access profiling using PEBS at large-scale is promising for memory management in heterogeneous memory environments.
©2018 Association for Computing Machinery. This is the author’s version of the work. It is posted here for your personal use. Not for redistribution. The definitive Version of Record was published in https://dl.acm.org/citation.cfm?id=3286477 https://doi.org/10.1145/3286475.3286477
1. Introduction
The past decade has brought an explosion of new memory technologies. Various high-bandwidth memory types, e.g., 3D stacked DRAM (HBM), GDDR and multi-channel DRAM (MCDRAM) as well as byte addressable non-volatile storage class memories (SCM), e.g., phase-change memory (PCM), resistive RAM (ReRAM) and the recent 3D XPoint, are already in production or expected to become available in the near future.
Management of such heterogeneous memory types is a major challenge for application developers, not only in terms of placing data structures into the most suitable memory but also to adaptively move content as application characteristics changes in time. Operating system and/or runtime level solutions that optimize memory allocations and data movement by transparently mapping application behavior to the underlying hardware are thus highly desired.
One of the basic requirements of a system level solution is the ability to track the application’s memory access patterns in real-time with low overhead. However, existing solutions for access pattern tracking are often based on dynamic instrumentation, which have prohibitive overhead for an online approach (Luk et al., 2005). Consequently, system level techniques targeting heterogeneous memory management typically rely on a two-phase model, where the application is profiled first, based on which the suggested allocation policy is then determined (Dulloor et al., 2016; Peng et al., 2017).
Intel’s Processor Event-Based Sampling (PEBS) (Corporporation, 2018) is an extension to hardware performance counters that enables sampling the internal execution state of the CPU (including the most recent virtual address accessed) and periodically storing a snapshot of it into main memory. The overhead of PEBS has been the focus of previous works (Larysch, 2016; Akiyama and Hirofuchi, 2017), however, not in the context of large-scale high-performance computing (HPC).
The hardware PEBS support provides a number of configuration knobs that control how often PEBS records are stored and how often the CPU is interrupted for additional background data processing. Because such disruption typically degrades performance at scale (Hoefler et al., 2010; Ferreira et al., 2008), it is important to characterize and understand this overhead to assess PEBS’ applicability for heterogeneous memory management in large-scale HPC. Indeed, none of the previous studies focusing on PEBS’ overhead we are aware of have addressed large-scale environments.
We have implemented a custom PEBS driver in the IHK/McKernel lightweight multi-kernel operating system (Gerofi et al., 2013; Gerofi et al., 2016). Our motivation for a lightweight kernel (LWK) is threefold. First, lightweight kernels are known to be highly noise-free and thus they provide an excellent environment for characterizing PEBS’ overhead. Second, McKernel has a relatively simple code-base that enables us to rapidly prototype kernel level features for heterogeneous memory management and allow direct integration with our PEBS driver. Our custom driver can be easily configured and enables fine-grained tuning of parameters that are otherwise not available in the Linux driver (see Section 3 for more details). Finally, the Linux PEBS driver on the platform we used in this study, i.e., the Oakforest-PACS machine (Joint Center for Advanced HPC (JCAHPC), 2017) based on Intel’s Xeon Phi Knight’s Landing chip, was not available.
As the baseline for OS level hierarchy memory management, we aimed at answering the following questions. What is the overhead of real-time memory accesses tracking at scale? What is the trade-off between sampling granularity and the introduced overhead? Is it feasible to rely on PEBS for collecting such information online?
Specifically, in this paper we make the following contributions:
-
•
An implementation of a custom PEBS driver in an LWK with the ability of fine-tuning its parameters
-
•
Systematic evaluation of PEBS’ overhead on a number of real HPC applications running at large scale
-
•
Demonstration of captured memory access patterns as the function of different PEBS parameters
Previous studies have reported PEBS failing to provide increased accuracy with reset values (see Section 2.1) lower than 1024 (Larysch, 2016; Akiyama and Hirofuchi, 2017) as well as the Linux kernel becoming unstable when performing PEBS based sampling on high frequency (Olson et al., 2018). On up to 128k CPU cores (2,048 Xeon Phi KNL nodes), we find that our custom driver captures increasingly accurate access patterns reliably even with very low reset values. Across all of our workloads, PEBS incurs an overhead of 2.3% on average with approximately 10% and 1% in the worst and best cases, respectively.
The rest of this paper is organized as follows. We begin by explaining the background and motivations in Section 2. We describe the design and implementation of our custom PEBS driver in Section 3. Our large-scale evaluation is provided in Section 4. Section 5 discusses related work, and finally, Section 6 concludes the paper.
2. Background and Motivation
This section lays the groundwork for the proposed driver architecture by providing background information on Intel’s Processor Event-Based Sampling facility (Corporporation, 2018) and the IHK/McKernel lightweight multi-kernel OS (Gerofi et al., 2013; Gerofi et al., 2016, pear).
2.1. Processor Event-Based Sampling
Processor Event-Based Sampling (PEBS) is a feature of some Intel microarchitectures that builds on top of Intel’s Performance Counter Monitor (PCM).
The PCM facility allows to monitor a number of predefined processor performance parameters (hereinafter called "events") by counting the number of occurrences of the specified events111The exact availability of events depends on the processor’s microarchitecture. However, a small set of ”architectural performance events” remain consistent starting from the Intel Core Solo and Intel Core Duo generation. in a set of dedicated hardware registers. When a PCM counter overflows an interrupt is triggered, which eases the process of sampling.
PEBS extends the idea of PCM by transparently storing additional processor information while monitoring a PCM event. However, only a small subset of the PCM events actually support PEBS. A "PEBS record" is stored by the CPU in a user-defined memory buffer when a configurable number of PCM events, named "PEBS reset counter value" or simply "reset", occur. The actual PEBS record format is microarchitecture dependent, but it generally includes the set of general-purpose registers.
A "PEBS assist" in Intel nomenclature is the action of storing the PEBS record into the CPU buffer. When the record written in the last PEBS assist reaches a configurable threshold inside the CPU PEBS buffer, an interrupt is triggered. The interrupt handler should process the PEBS data and clear the buffer, allowing the CPU to continue storing more records. The PCM’s overflow interrupt remains inactive while a PCM event is being used with PEBS.
2.2. Lightweight Multi-kernels
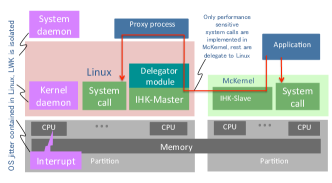
Lightweight multi-kernels emerged recently as a new operating system architecture for HPC, where the basic idea is to run Linux and a LWK side-by-side in compute nodes to attain the scalability properties of LWKs and full compatibility with Linux at the same time. IHK/McKernel is a multi-kernel OS developed at RIKEN, whose architecture is depicted in Figure 1. A low-level software infrastructure, called Interface for Heterogeneous Kernels (IHK) (Shimosawa et al., 2014), provides capabilities for partitioning resources in a many-core environment (e.g., CPU cores and physical memory) and it enables management of lightweight kernels. IHK is capable of allocating and releasing host resources dynamically and no reboot of the host machine is required when altering its configuration. The latest version of IHK is implemented as a collection of Linux kernel modules without any modifications to the Linux kernel itself, which enables relatively straightforward deployment of the multi-kernel stack on a wide range of Linux distributions. Besides resource and LWK management, IHK also facilitates an Inter-kernel Communication (IKC) layer.
McKernel is a lightweight co-kernel developed on top of IHK. It is designed explicitly for HPC workloads, but it retains a Linux compatible application binary interface (ABI) so that it can execute unmodified Linux binaries. There is no need for recompiling applications or for any McKernel specific libraries. McKernel implements only a small set of performance sensitive system calls and the rest of the OS services are delegated to Linux. Specifically, McKernel provides its own memory management, it supports processes and multi-threading, it has a simple round-robin co-operative (tick-less) scheduler, and it implements standard POSIX signaling. It also implements inter-process memory mappings and it offers interfaces for accessing hardware performance counters.
For more information on system call offloading, refer to (Gerofi et al., 2013), a detailed description of the device driver support is provided in (Gerofi et al., 2016). Recently we have demonstrated that lightweight multi-kernels can indeed outperform Linux on various HPC mini-applications when evaluated on up to 2,048 Intel Xeon Phi nodes interconnected by Intel’s OmniPath network (Gerofi et al., pear). As mentioned earlier, with respect to this study, one of the major advantages of a multi-kernel LWK is the lightweight kernel’s simple codebase that enables us to easily prototype new kernel level features.
3. Design and Implementation
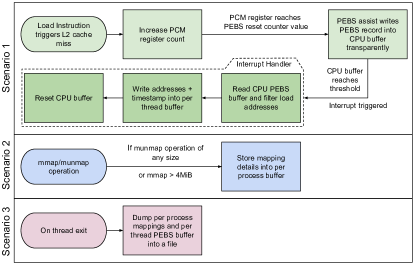
This section describes the design and implementation of the McKernel PEBS driver. Figure 2 shows a summary of the entire PEBS records lifecycle.
McKernel uses PEBS as a vehicle to keep track of memory addresses issued by each monitored system thread. Ideally, McKernel would keep track of all load and store instructions. However, this is not supported by all Intel microarchitectures. In particular, our test environment powered by the Intel Knights Landing processor only supports recording the address of load instructions that triggered some particular event. PEBS records are always associated with a PCM event. The most general KNL PCM events that support load address recording are L2_HIT_LOADS and L2_MISS_LOADS which account for L2 hits and L2 misses, respectively.
Both the count of L2 misses and L2 hits in a page boundary for a given time frame can be used as a metric that determines how likely is the page to be accessed in the future. A page with a high count of either L2 misses or L2 hits reveals that the page is under memory pressure. In the case of misses, we additionally know that the cache is not able to hold the pages long enough to be reused. And in the case of hits, we know that either pages are accessed with high enough frequency to remain in the cache or simply the whole critical memory range fits into the cache.
In principle, a page with a high L2 miss ratio seems to be a good candidate for being moved into a faster memory device because missing the L2 in the case of KNL means that data must be serviced from either main memory or the L2 of another core. However, the same page might actually have a higher ratio of L2 hits, indicating that another page with a lower hit ratio might benefit still more from being moved. In consequence, fair judgment should take into consideration both events. Unfortunately, KNL features a single PCM counter with PEBS support, which means that sampling both events requires to perform dynamic switching at runtime. Nonetheless, the purpose of this work is just a step behind. Our objective is to focus on the study of a single PEBS enabled PCM counter at scale. Therefore, for simplicity, we decided to rely on the L2_MISS_LOADS event to record the load addresses.
McKernel initializes the PEBS CPU data structures at boot time on each CPU. Processes running in McKernel will enable PEBS on all the CPUs where its threads are running as soon as they start. As long as the threads are being run, PEBS assists will write PEBS records into the CPU’s buffer transparently regardless of their execution context (user or kernel space).
The PEBS record format for the Knights Landing architecture consists of (among others) the set of general-purpose registers and the address of the load instruction causing the record dump (PEBS assist) if applicable. In total, 24 64-bit fields are stored, adding up to a total of 192 bytes for each PEBS record. There is no timestamp information stored in each PEBS record so it is not possible to know exactly when the record took place.
When the PEBS remaining capacity reaches the configured threshold, an interrupt is triggered. The PEBS interrupt handler filters all fields in the PEBS records but the load address and saves them into a per-thread circular buffer. Then, the CPU PEBS buffer is reset, allowing the CPU to continue storing records. Altogether with the load addresses, a timestamp is saved at the time the interrupt handler is running. This timestamp tags all the PEBS records processed in this interrupt handler execution for posterior analysis.
When each of the application’s threads exit, the entire contents of the per-thread buffer is dumped into a file. We have developed a small python visualization tool to read and generate plots based on the information provided.
The registered load addresses might not belong to application-specific user buffers but from anywhere in the address space. For offline visualization purposes we are mostly interested in profiling the application’s buffers and hence, it is convenient to provide some means to filter the undesired addresses. Load addresses can be sparse, and visualizing the entire address space of an application to detect patterns might be difficult. It is important to notice that filtering is not a requirement for online monitoring of high demanded pages, this is only necessary for visualization.
A simple heuristic to do so is to filter out all addresses of small mappings. To minimize the impact of filtering, the postprocessing is done offline in our visualization script. Hence, McKernel only keeps track of all mappings greater than four megabytes by storing its start addresses, the length and the timestamp at which the operation completed. All munmap operations are also registered regardless of its size because they might split a bigger tracked area. The mappings information are stored into a per-process buffer, shared by all threads using a lock-free queue. The per-process mappings buffer is also dumped into the PEBS file at each thread’s termination time.
Our PEBS addresses viewer loads the file and reconstructs the processes virtual memory mappings history based on the mmap and munmap memory ranges and timestamps. Then, it reads all the registered PEBS load addresses and classifies them into the right spatial and temporal mapping or discards them if no suitable mapping is found. Finally, individual plots are shown per mapping.
The PEBS data acquisition rate is controlled by the configurable number of events that trigger a PEBS assist and the size of the CPU PEBS buffer (which indirectly controls the threshold that triggers an interrupt). We have added a simple interface into McKernel to dynamically configure these parameters at application launch time by resizing the CPU buffer and reconfiguring the PEBS MSR registers as requested. This differs from the current Linux Kernel driver in which it is only possible to configure the reset counter value but not the PEBS buffer size.
It would be ideal to have a big enough CPU buffer to hold all load addresses the application generates to both reduce the memory movements between buffers and to suppress the interrupts overhead. However, having a small interrupt rate also diffuses the time perception of memory accesses because timestamps are associated with PEBS records in the interrupt handler. Therefore, this implementation actually requires to set up a proper interrupt rate to understand the evolution of memory accesses in time. Note that instead of relying on the interrupt handler to harvest the PEBS CPU buffer, another option is to dedicate a hardware thread to this task. We plan to implement this option in the near future.
4. Evaluation
4.1. Experimental Environment
All of our experiments were performed on Oakforest-PACS (OFP), a Fujitsu built, 25 petaflops supercomputer installed at JCAHPC, managed by The University of Tsukuba and The University of Tokyo (Joint Center for Advanced HPC (JCAHPC), 2017). OFP is comprised of eight-thousand compute nodes that are interconnected by Intel’s Omni Path network. Each node is equipped with an Intel® Xeon Phi™ 7250 Knights Landing (KNL) processor, which consists of 68 CPU cores, accommodating 4 hardware threads per core. The processor provides 16 GB of integrated, high-bandwidth MCDRAM and it also is accompanied by 96 GB of DDR4 RAM. The KNL processor was configured in Quadrant flat mode; i.e., MCDRAM and DDR4 RAM are addressable at different physical memory locations and are presented as separate NUMA nodes to the operating system.
The software environment was as follows. Compute nodes run CentOS 7.4.1708 with Linux kernel version 3.10.0-693.11.6. This CentOS distribution contains a number of Intel supplied kernel level improvements specifically targeting the KNL processor that were originally distributed in Intel’s XPPSL package. We used Intel MPI Version 2018 Update 1 Build 20171011 (id: 17941) in this study.
For all experiments, we dedicated 64 CPU cores to the applications (i.e., to McKernel) and reserved 4 CPU cores for Linux activities. This is a common scenario for OFP users where daemons and other system services run on the first four cores even in Linux only configuration.
4.2. Mini-applications
We used a number of mini-applications from the CORAL benchmark suite (CORAL, 2013) and one developed at the The University of Tokyo. Along with a brief description, we also provide information regarding their runtime configuration.
-
•
GeoFEM solves 3D linear elasticity problems in simple cube geometries by parallel finite-element method (Nakajima, 2003). We used weak-scaling for GeoFEM and ran 16 MPI ranks per node, where each rank contained 8 OpenMP threads.
-
•
HPCG is the High Performance Conjugate Gradients, which is a stand-alone code that measures the performance of basic operations in a unified code for sparse matrix-vector multiplication, vector updates, and global dot products (Dongarra et al., 2015). We used weak-scaling for HPCG and ran 8 MPI ranks per node, where each rank contained 8 OpenMP threads.
-
•
Lammps is a classical molecular dynamics code, an acronym for Large-scale Atomic/Molecular Massively Parallel Simulator (Plimpton, 1995). We used weak-scaling for Lammps and ran 32 MPI ranks per node, where each rank contained four OpenMP threads.
-
•
miniFE is a proxy application for unstructured implicit finite element codes (Heroux et al., 2009). We used strong-scaling for miniFE and ran 16 MPI ranks per node, where each rank contained four OpenMP threads.
-
•
Lulesh is the Livermore Unstructured Lagrangian Explicit Shock Hydrodynamics code which was originally defined and as one of five challenge problems in the DARPA UHPC program (Karlin et al., 2013). We used weak-scaling for Lulesh and ran 8 MPI ranks per node, where each rank contained 16 OpenMP threads.
-
•
AMG2013 is a parallel algebraic multigrid solver for linear systems arising from problems on unstructured grids (Henson and Yang, 2002). We used weak-scaling for AMG and ran 16 MPI ranks per node, where each rank contained 16 OpenMP threads.
4.3. Results
For each workload described above, we use nine different PEBS configurations. We scale the PEBS reset value from 256, through 128 to 64 and used PEBS per-CPU buffer sizes of 8kB, 16kB and 32kB. As mentioned earlier, the reset value controls the sampling granularity while the PEBS buffer size impacts the PEBS IRQ frequency. We emphasize again that contrary to previous reports on PEBS’ inability to provide increased accuracy with reset values lower than 1024 (Larysch, 2016; Akiyama and Hirofuchi, 2017; Olson et al., 2018), we find very clear indications that obtaining increasingly accurate samples with lower reset values is possible, for which we provide more information below.
We ran each workload for all configurations scaling from 2,048 to 128k CPU cores, i.e., from 32 to 2,048 compute nodes, respectively. We compare individually the execution time of each benchmark run on McKernel with and without memory accesses tracking enabled. We report the average value of three executions, except for a few long-running experiments, where we took only two samples (e.g., for GeoFEM). Note that all measurements were taken on McKernel and no Linux numbers are provided. For a detailed comparison between Linux and McKernel, refer to (Gerofi et al., pear).
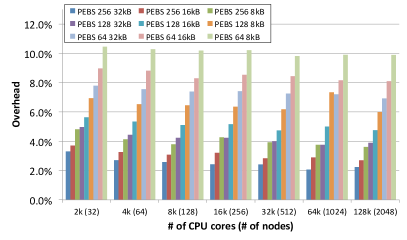
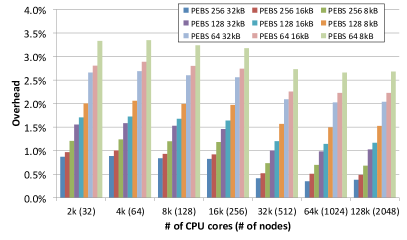
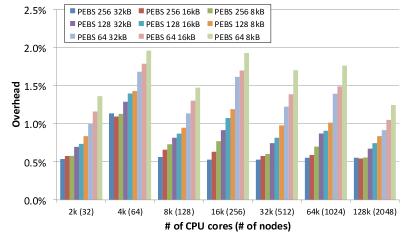
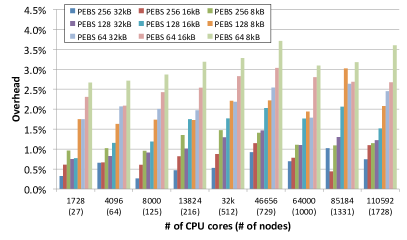
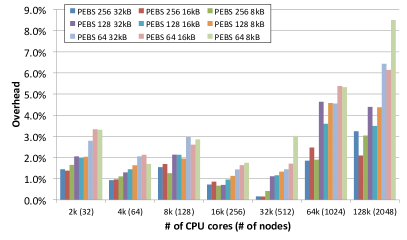
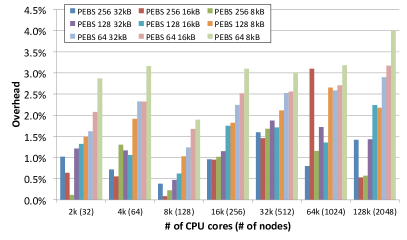
Figure 3 summarizes our application level findings. The X-axis represents node counts while the Y-axis shows relative overhead compared to the baseline performance. For each bar in the plot, the legend indicates the PEBS reset value and the PEBS buffer size used in the given experiment. The general tendency of overhead for most of the measurements matched our expectations, i.e., the most influential factor in performance overhead is the PEBS reset value, whose impact can be relaxed to some extent by adjusting the PEBS buffer size.
Across all workloads, we observe the largest overhead on GeoFEM (shown in Figure 3a) when running with the lowest PEBS reset value of 64 and the smallest PEBS buffer of 8kB, where the overhead peaked at 10.2%. Nevertheless, even for GeoFEM a less aggressive PEBS configuration, e.g., a reset value of 256 with 32kB PEBS buffer size induces only up to 4% overhead.
To much of our surprise, on most workloads PEBS’s periodic interruption of the application does not imply additional overhead as we scale out with the number of compute nodes. In fact, on some of the workloads, e.g., HPCG (shown in Figure 3b) and Lammps (shown in Figure 3c) we even observe a slight decrease in overhead for which we have currently no precise explanation and for which identifying its root cause further investigation is required. Note that both of these workloads were weak scaled and thus are presumed to compute on a quasi-constant amount of per-process data irrespective of scale.
One particular application that did experience growing overhead as the scale increased is MiniFE, shown in Figure 3e. MiniFE was the only workload we ran in strong-scaled configuration and our previous experience with MiniFE indicates that it is indeed sensitive to system noise (Gerofi et al., pear). Despite the expectation that due to the decreasing amount of per-process data at larger node counts the PEBS’ overhead would gradually diminish, the disruption from constant PEBS interrupts appears to amplify its negative impact.
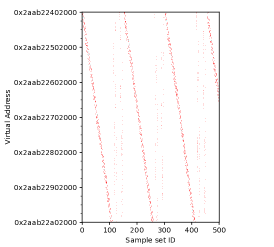
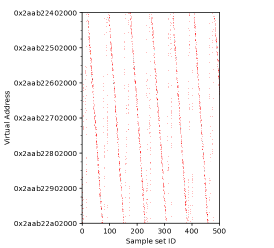
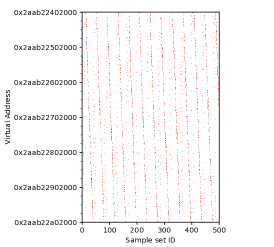
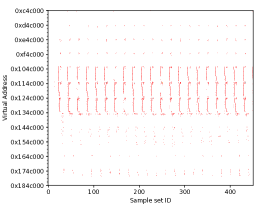
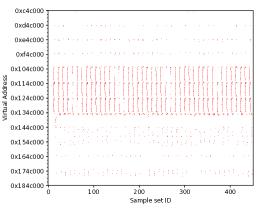
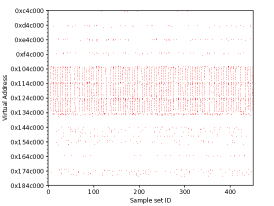
To demonstrate the impact of PEBS’ reset value on the accuracy of memory access tracking we provide excerpts on memory access patterns using different reset values. We have been able to observe similar memory access patterns for all benchmarks tested, but we present the results for MiniFE and Lulesh as an example. Figure 4 and Figure 5 show the heatmaps of the access patterns captured on 32 nodes for three reset values, 64, 128 and 256. The X-axis represents the sample set ID, i.e., periods of time between PEBS interrupts, while the Y-axis indicates the virtual address of the corresponding memory pages. Although PEBS addresses are captured at byte granularity, page size is the minimum unit the OS’ memory manager works with. In fact, for better visibility, we show the heatmap with higher unit sizes, i.e., in blocks of 4 pages.
One of the key observations here is the increasingly detailed view of the captured access pattern as we decrease the PEBS reset counter. As seen, halving the reset value from 128 to 64 gives a 2X higher granularity per sample set, e.g., the stride access of MiniFE is stretched with respect to the sample IDs. Note that one iteration of MiniFE’s buffer presented in the plot corresponds to approximately 330ms. To put the accuracy into a more quantitative from the 1536 pages of the buffer shown in the figure, PEBS with 64 reset value reports 1430 pages touched, while using reset values of 128 and 256 report 1157 and 843, respectively. To the contrary, Lulesh’s plots indicate that access patterns that do not significantly change in time can be captured also with lower granularity and thus the reset value should be adjusted dynamically based on the application. Note that the number of computational nodes used affects the amount of memory each node works with and might alter the visible pattern. However, as long as the memory share per core does not fit in the L2 the patterns will generally remain similar.
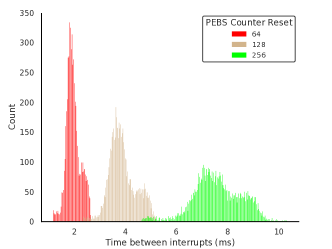
The implicit effect of altering the PEBS reset counter is the increase or decrease rate of the PEBS interrupt frequency, assuming a constant workload. The capacity of controlling the interrupt rate should have a clear impact on the expected overhead, at least in noise sensitive applications such as minife. We have presented the relationship between overhead and PEBS reset counter in Figure 3 and we now show the relationship between PEBS reset counter and interrupt frequency in Figure 6. The elapsed time between interrupts is shown for three executions of MiniFE with 64, 128 and 256 values. As expected, we can see a clear correlation between the average duration and the reset counter value being the former smaller when the later decreases. We also note that the duration of the interrupt handler itself took approximately 20 thousand cycles. It is also interesting to observe the formation of two close peaks per execution. This tendency identifies two different access patterns within the application that lead to a different L2 miss generation scheme.
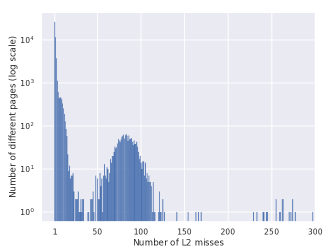
The presence of particularly hot pages can be easily localized by inspecting the histogram of aggregated L2 misses shown in Figure 7. The plot shows the number of different pages that had N number of L2 misses on the Y-axis, where N is shown on the X-axis. We can easily see that most of the pages in MiniFE had a small number of misses at the leftmost side of the histogram. However, the plot reveals an important group of pages above the 50 L2 misses that could be tagged as movable targets.
In summary, we believe that our large-scale results well demonstrate PEBS’ modest overhead to online memory access tracking and we think that a PEBS based approach to heterogeneous memory management is worth pursuing.
5. Related Work
This section discusses related studies in the domains of heterogeneous memory management and memory access tracking.
Available tools that help to determine efficient data placement in heterogeneous memory systems typically require developers to run a profile phase of their application and modify their code accordingly. Dulloor et al. proposed techniques to identify data objects to be placed into DRAM in a hybrid DRAM/NVM configuration (Dulloor et al., 2016). Peng et al. considered the same problem in the context of MCDRAM/DRAM using the Intel Xeon Phi processor (Peng et al., 2017). In order to track memory accesses, these tools often rely on dynamic instrumentation (such as PIN (Luk et al., 2005)), which imposes significant performance overhead that makes it impractical for online access tracking.
Larysch developed a PEBS system to assess memory bandwidth utilization of applications and reported low overheads, but the authors did not provide a quantitative characterization of using PEBS for this purpose (Larysch, 2016). Akiyama et al. evaluated PEBS overhead on a set of enterprise computing workloads with the aim of finding performance anomalies in high-throughput applications (e.g., Spark, RDBMS) (Akiyama and Hirofuchi, 2017). PEBS has been also utilized to determine data placement in emulated non-volatile memory based heterogeneous systems (Wu et al., 2017). None of these works, however, have focused on exclusively studying PEBS overhead on large-scale configurations. To the contrary, we explicitly target large-scale HPC workloads to assess the scalability impacts of PEBS based memory access tracking.
Olson et al. reported in a very recent study that decreasing the PEBS reset value below 128 on Linux caused the system to crash (Olson et al., 2018). While they disclosed results only for a single node setup, we demonstrated that our custom PEBS driver in McKernel performs reliably and induces low overheads even when using small PEBS reset values in a large-scale deployment.
6. Conclusion and Future Work
This paper has presented the design, implementation and evaluation of a PEBS driver for the IHK/McKernel which aims to provide the groundwork for an OS level heterogeneous memory manager. We have shown the captured access patterns of two scientific applications and demonstrated the evolution of their resolution as we change the PEBS profiling parameters. We have analyzed the overhead impact associated with the different recording resolutions in both timing and interrupt domains at scale up to 128k CPUs (or 2,048 computer nodes) for six scientific applications. We observed overheads highly dependent on both the application behavior and the recording parameters which range between 1% and 10.2%. However, we have been able to substantially reduce the overhead of our worst-case scenario from 10.2% to 4% by adjusting the recording parameters while still achieving clearly visible access patterns. Our experience contrast with the current Linux kernel PEBS implementation which is not capable of achieving very fine-grained sample rates. We conclude that PEBS efficiency matches the basic requirements to be feasible for heterogeneous memory management but further work is necessary to quantify the additional overhead associated with using the recorded data at runtime.
Our immediate future work is to address the challenge of properly using the recorded addresses at runtime to reorganize memory pages on memory devices based on access patterns. We will study the benefits of dedicating a hardware thread to periodically harvest the CPU PEBS buffer instead of relying on interrupts that constantly pause the execution of the user processes. We also intend to deeply analyze the difference between the IHK/McKernel PEBS driver and the Linux kernel driver to better quantify the observed limitations.
Acknowledgment
This work has been partially funded by MEXT’s program for the Development and Improvement of Next Generation Ultra High-Speed Computer Systems under its subsidies for operating the Specific Advanced Large Research Facilities in Japan. This project has received funding from the European Union’s Horizon 2020 research and innovation programme under the Marie Sklodowska-Curie grant agreement No 708566 (DURO) and agreement No 754304 (DEEP-EST).
References
- (1)
- Akiyama and Hirofuchi (2017) Soramichi Akiyama and Takahiro Hirofuchi. 2017. Quantitative Evaluation of Intel PEBS Overhead for Online System-Noise Analysis. In Proceedings of the 7th International Workshop on Runtime and Operating Systems for Supercomputers ROSS 2017 (ROSS ’17). ACM, New York, NY, USA, Article 3, 8 pages.
- CORAL (2013) CORAL. 2013. Benchmark Codes. https://asc.llnl.gov/CORAL-benchmarks/. (Nov. 2013).
- Corporporation (2018) Intel Corporporation. 2018. Intel 64 and IA-32 Architectures Software Developer Manuals. https://software.intel.com/articles/intel-sdm. (2018).
- Dongarra et al. (2015) Jack Dongarra, Michael A. Heroux, and Piotr Luszczek. 2015. HPCG Benchmark: A New Metric for Ranking High Performance Computing Systems. Technical Report UT-EECS-15-736. University of Tennessee, Electrical Engineering and Computer Science Department.
- Dulloor et al. (2016) Subramanya R. Dulloor, Amitabha Roy, Zheguang Zhao, Narayanan Sundaram, Nadathur Satish, Rajesh Sankaran, Jeff Jackson, and Karsten Schwan. 2016. Data Tiering in Heterogeneous Memory Systems. In Proceedings of the Eleventh European Conference on Computer Systems (EuroSys ’16). ACM, New York, NY, USA, Article 15, 16 pages. http://doi.acm.org/10.1145/2901318.2901344
- Ferreira et al. (2008) Kurt B. Ferreira, Patrick Bridges, and Ron Brightwell. 2008. Characterizing Application Sensitivity to OS Interference Using Kernel-level Noise Injection. In Proceedings of the 2008 ACM/IEEE Conference on Supercomputing (SC ’08). IEEE Press, Piscataway, NJ, USA, Article 19, 12 pages.
- Gerofi et al. (pear) Balazs Gerofi, Rolf Riesen, Masamichi Takagi, Taisuke Boku, Yutaka Ishikawa, and Robert W. Wisniewski. 2018 (to appear). Performance and Scalability of Lightweight Multi-Kernel based Operating Systems. In 2018 IEEE International Parallel and Distributed Processing Symposium (IPDPS).
- Gerofi et al. (2013) Balazs Gerofi, Akio Shimada, Atsushi Hori, and Yutaka Ishikawa. 2013. Partially Separated Page Tables for Efficient Operating System Assisted Hierarchical Memory Management on Heterogeneous Architectures. In 13th Intl. Symposium on Cluster, Cloud and Grid Computing (CCGrid).
- Gerofi et al. (2016) B. Gerofi, M. Takagi, A. Hori, G. Nakamura, T. Shirasawa, and Y. Ishikawa. 2016. On the Scalability, Performance Isolation and Device Driver Transparency of the IHK/McKernel Hybrid Lightweight Kernel. In 2016 IEEE International Parallel and Distributed Processing Symposium (IPDPS). 1041–1050.
- Henson and Yang (2002) V. E. Henson and U. M. Yang. 2002. BoomerAMG: A Parallel Algebraic Multigrid Solver and Preconditioner. https://codesign.llnl.gov/amg2013.php. Appl. Num. Math. 41 (2002), 155–177.
- Heroux et al. (2009) Michael A Heroux, Douglas W Doerfler, Paul S Crozier, James M Willenbring, H Carter Edwards, Alan Williams, Mahesh Rajan, Eric R Keiter, Heidi K Thornquist, and Robert W Numrich. 2009. Improving Performance via Mini-applications. Technical Report SAND2009-5574. Sandia National Laboratories.
- Hoefler et al. (2010) Torsten Hoefler, Timo Schneider, and Andrew Lumsdaine. 2010. Characterizing the Influence of System Noise on Large-Scale Applications by Simulation. In Proceedings of the 2010 ACM/IEEE International Conference for High Performance Computing, Networking, Storage and Analysis (SC ’10). IEEE Computer Society, Washington, DC, USA. https://doi.org/10.1109/SC.2010.12
- Joint Center for Advanced HPC (JCAHPC) (2017) Joint Center for Advanced HPC (JCAHPC). 2017. Basic Specification of Oakforest-PACS. http://jcahpc.jp/files/OFP-basic.pdf. (March 2017).
- Karlin et al. (2013) Ian Karlin, Jeff Keasler, and Rob Neely. 2013. LULESH 2.0 Updates and Changes. Technical Report LLNL-TR-641973. Lawrence Livermore National Laboratory. 1–9 pages.
- Larysch (2016) Florian Larysch. 2016. Fine-Grained Estimation of Memory Bandwidth Utilization. Master Thesis. Operating Systems Group, Karlsruhe Institute of Technology (KIT), Germany.
- Luk et al. (2005) Chi-Keung Luk, Robert Cohn, Robert Muth, Harish Patil, Artur Klauser, Geoff Lowney, Steven Wallace, Vijay Janapa Reddi, and Kim Hazelwood. 2005. Pin: Building Customized Program Analysis Tools with Dynamic Instrumentation. In Proceedings of the 2005 ACM SIGPLAN Conference on Programming Language Design and Implementation (PLDI ’05). ACM, New York, NY, USA, 190–200.
- Nakajima (2003) Kengo Nakajima. 2003. Parallel Iterative Solvers of GeoFEM with Selective Blocking Preconditioning for Nonlinear Contact Problems on the Earth Simulator. In Proceedings of the 2003 ACM/IEEE Conference on Supercomputing (SC). ACM, New York, NY, USA. https://doi.org/10.1145/1048935.1050164
- Olson et al. (2018) Matthew Benjamin Olson, Tong Zhou, Michael R. Jantz, Kshitij A. Doshi, M. Graham Lopez, and Oscar Hernandez. 2018. MemBrain: Automated Application Guidance for Hybrid Memory Systems. In IEEE International Conference on Networking, Architecture, and Storage (NAS’ 18). (to appear).
- Peng et al. (2017) Ivy Bo Peng, Roberto Gioiosa, Gokcen Kestor, Pietro Cicotti, Erwin Laure, and Stefano Markidis. 2017. RTHMS: A Tool for Data Placement on Hybrid Memory System. In Proceedings of the 2017 ACM SIGPLAN International Symposium on Memory Management (ISMM 2017). ACM, New York, NY, USA, 82–91.
- Plimpton (1995) Steve Plimpton. 1995. Fast Parallel Algorithms for Short-range Molecular Dynamics. (March 1995), 19 pages. https://doi.org/10.1006/jcph.1995.1039
- Shimosawa et al. (2014) Taku Shimosawa, Balazs Gerofi, Masamichi Takagi, Gou Nakamura, Tomoki Shirasawa, Yuji Saeki, Masaaki Shimizu, Atsushi Hori, and Yutaka Ishikawa. 2014. Interface for Heterogeneous Kernels: A Framework to Enable Hybrid OS Designs targeting High Performance Computing on Manycore Architectures. In 21th Intl. Conference on High Performance Computing (HiPC).
- Wu et al. (2017) Kai Wu, Yingchao Huang, and Dong Li. 2017. Unimem: Runtime Data Managementon Non-volatile Memory-based Heterogeneous Main Memory. In Proceedings of the International Conference for High Performance Computing, Networking, Storage and Analysis (SC ’17). ACM, New York, NY, USA, Article 58, 14 pages.