Correction of the VIR-visible data set from the Dawn mission at Vesta
Abstract
The following article has been accepted by Review of Scientific Instruments on 15 November 2020. After it is published, it will be found at this link. doi: 10.1063/5.0022902
This work describes the correction method applied to the dataset acquired at the asteroid (4) Vesta by the visible channel of the Visible and InfraRed mapping spectrometer (VIR). The rising detector temperature during data acquisitions in the visible wavelengths leads to a spectral slope increase over the whole spectral range. This limits the accuracy of the studies of the Vesta’ surface in this wavelength range. Here we detail an empirical method to correct for the visible detector temperature dependency while taking into account the specificity of the Vesta dataset.
I Introduction
The NASA Dawn spacecraft orbited the asteroid (4) Vesta from July 2011 to September 2012 Russell et al. (2007). This allowed the on board Visible InfraRed mapping spectrometer (VIR)De Sanctis et al. (2011) to nearly map the whole surface of the asteroid.
The VIR spectrometer is made of two channels which may operate both in synergy or separately: the visible channel (VIS), working in the spectral interval by using a charge coupled device (CCD) and the IR channel (IR), covering the range with a HgCdTe array.
The data acquired by the visible channel of VIR (VIR-VIS) suffer from the increase of the CCD temperature () during the period of data acquisition. This study addresses their correction thanks to a method already developed for the second target of the Dawn mission, Ceres, and detailed in Rousseau et al. (2019). In Sect. II we present the VIR-VIS dataset acquired at Vesta. Sect. III describes the effect of the increase of the CCD temperature on VIR-VIS data. Sect. IV provides details about the method adopted to correct the data, in particular in some specific cases. Examples of the correction are given is Sect. V, before conclusions as summarized in Sect. VI.
II The VIR data at Vesta
The Vesta dataset is divided in several mission phases whose the main characteristics are detailed in the Table 1 (see also Russell and Raymond (2011)).
The data acquired at Vesta by the VIR-VIS channel are available online on the Planetary Data System archive 111https://sbn.psi.edu/pds/resource/dawn/dwnvvirL1.html. We use the LEVEL 1B data which are calibrated from raw digital numbers (DN) to physical unit of radiance and then converted in radiance factor as detailed by Carrozzo et al. (2016).
We applied a correction for spectral artifacts Carrozzo et al. (2016) and a photometric correction Scarica et al. (2016) which minimizes the effect of the observation geometry. Finally, a correction factor developed by Carrozzo et al. (2016) and refined by Rousseau et al. (2020) is used to correct the shape and the systematic red slope observed in the VIR spectra of Vesta and Ceres. This latter correction factor, based on ground-based observations, is a multiplicative factor independent of the CCD temperature and, therefore, different from the one introduced in the present study.
We presently consider the spectral range from to its end. However, we note that for spectral study of the surface, one would consider the shape of the spectra beyond to be less reliable due to lack of signal and would therefore discard this wavelength range.
|
|
|
|
|
|
(K) |
|
|||||||||||||
|---|---|---|---|---|---|---|---|---|---|---|---|---|---|---|---|---|---|---|---|---|
| VSA* | 2011-05-10 | 2011-08-06 | 96/133 | 700–1300 | 169–193 | 80 | VSA | |||||||||||||
| VSS* | 2011-08-12 | 2011-08-31 | 242/271 | 675–715 | 168–191 | 80 | VSS | |||||||||||||
| VTH | 2011-09-19 | 2011-09-25 | 8/12 | 170–205 | 171–180 | 80 | VH2 | |||||||||||||
| VSH* | 2011-09-30 | 2011-10-31 | 325/330 | 168–181 | 168–181 | 80 | VSH | |||||||||||||
| VSL* | 2012-01-08 | 2012-04-29 | 566/572 | 45–75 | 170–177 | 80 - 164 - 177 | VSL | |||||||||||||
| VH2* | 2012-06-15 | 2012-07-24 | 682/685 | 160–205 | 168–179 | 80 | VH2 | |||||||||||||
| VTC | 2012-08-25 | 2012-08-26 | 15/26 | 1485–1585 | 170–191 | 80 | VSS |
III Effects of the detector temperature variation
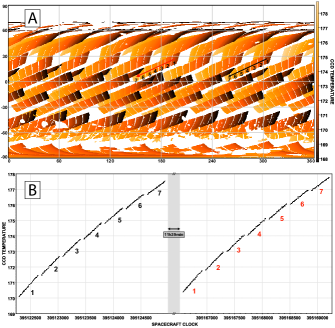
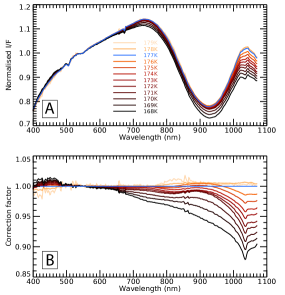
During an observation sequence, the VIR instrument may operate for some hours consecutively. In this temporal interval, several hyperspectral cubes are acquired and, in the case of the VIS channel, the temperature of the CCD progressively increases before passively cooling down when the acquisition sequence stops. The Fig. 1 illustrates this phenomenon through a map of the CCD temperature during the Vesta High Altitude Mapping Orbit 2 (VH2) mission phase. We observed that the spectral response of the CCD is dependent on its temperature. One of the consequences is an apparent increase of the overall spectral slope of the VIR-VIS spectra, which we refer to as ”reddening”. This is illustrated by the Panel (A) of Fig. 2 which groups spectra acquired at the same CCD temperature during the VH2 mission phase.
In contrast, the IR channel is actively cooled down and its temperature () is generally stabilized around 80K. However, if it is not operating, the cryocooler is switched off and the IR detector temperature gently increases until reaching an equilibrium temperature. It has been observed that small spectral distortions affect the VIR-VIS data acquired when is high, i.e. not stabilized around 80K Rousseau et al. (2019). In the case of the Dawn mission at Vesta, this is limited to a portion of the VSL mission phase (see Table 1).
These issues limit the accuracy of the studies of the Vesta’ surface in the visible range and consequently need to be corrected. Here we take advantage of the empirical correction developed to correct the VIR data acquired at Ceres, which suffers from the same issues Rousseau et al. (2019), and we adapt it to the Vesta dataset.
IV Correction of the data
Using the same hypothesizes as for the Ceres case Rousseau et al. (2019), we developed a correction factor for different mission phases of the Vesta dataset. Those correction factors are based on a specific spectral reference, corresponding to a CDD temperature at which the detector response is considered reliable. We previously identified this CCD temperature to be equal to 177KRousseau et al. (2019) and the reference spectrum has been computed by taking advantage of the VH2 mission phase observations. In this respect, among the different mission phases, VH2 observations have the advantage of a) a high redundancy in the 176.5K and 177.5K CCD temperature interval ( spectra) and of b) being homogeneously distributed over the Vesta surface, providing a representative sample of its average spectral properties. Considering this, the generic formula of the correction factor (CF) is:
| (1) |
Where corresponds to the name of the mission phase to be corrected; is the wavelength; and the VIS CCD temperature. At the numerator, is the median radiance factor normalized at for the given mission phase to be corrected, wavelength, and detector temperature interval. At the denominator, is the median radiance factor, normalized at , of the observations acquired during VH2 at and . This is the blue reference spectrum as highlighted in Panel (A) of Fig. 2.
The correction factor () is calculated for discrete CDD temperature interval of 1K, and is a wavelength dependent vector. The set of correction factors of VH2 is represented in Panel (B) of Fig. 2. For each spectrum, the correction factor to be applied is derived by interpolating at the corresponding temperature of acquisition. It is applied by dividing this spectrum by the corresponding interpolated .
for several mission phases have been specially calculated because:
-
1.
During the mission phases, the spatial sampling of the surface varies and implies slightly different median spectral behavior and, consequently, correction factors. This has to be considered to avoid an inappropriate to be applied on a dataset.
-
2.
To avoid any correction errors, no extrapolation outside the minimum or the maximum CCD temperature bound is done (for a given mission phase), leading to the necessity of more than one in case of CCD temperature ranges mismatch between different mission phases.
- 3.
The Table 1 reports the different mission phases with the corresponding correction factors to be applied. In the following sections, we provide details about the correction needed for the VSL and the VSH mission phases.
IV.1 Special cases: the VSH mission phase
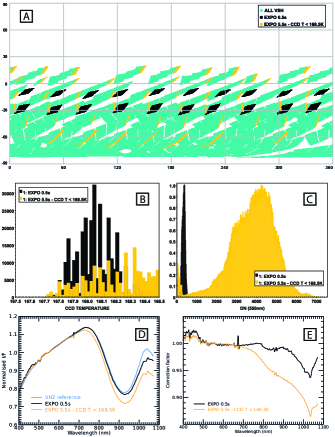
The VSH mission phase covers mainly the south hemisphere of Vesta, as displayed by Panel (A) of Fig. 3. The ranges from 168K to 181K and two exposure times, of and , have been used during VSH. Twenty cubes have been acquired with an exposure time of and are represented in black on Fig. 3. Their is comprised in the 168K interval of CCD temperature (Panel (B) Fig. 1) as defined by the method to compute the correction factor, i.e. between 167.5K and 168.5K. What remains have been acquired with an exposure time of and spans various CCD temperatures. A part of these data has, just like the black subset, a in the 168K interval; displayed in yellow on Fig. 3. As shows by the Panel (C) Fig. 3, the two dataset, for the same , have a level of signal very contrasted: the data with a low exposure time have a mean DN level at of 340 while the DN level of the second dataset, with a higher exposure time, spreads roughly between 1000 and 7000. This impacts the spectral behavior which are different between the two subsets (see the corresponding median spectra, Panel (D), Fig. 3). This additional aspect must be taken take into account to avoid an incorrect correction as a single correction factor would have done. Consequently, a correction factor has been calculated for each of the subset identified in the 168K interval of CCD temperature (see Panel (E), Fig. 3).
IV.2 Special cases: the VSL mission phase
About of the data in the VSL mission phase were acquired while the IR detector temperature () was larger than 80K. A first group of observations was performed with comprised between 163K and 165K and a second between 176K and 178K, as reported in Table 1. High IR temperatures induce a spectral distortion that has to be corrected tooRousseau et al. (2019). We adopted the same strategy as for VSH to correct those data, considering independently the two high IR temperature populations and computing separate correction factors: a first for the data acquired with a close to 80K; a second for the data with a around 164K; a third for the data with a around 178K (see Supplementary Material). The use of the VH2 reference spectrum (see equation 1), which is derived for an IR temperature of 80K, allows us to correct the spectral behavior of the VSL data with those high IR temperature.
V Results
We estimate the efficiency of the correction through the spectral slope that we define as follow:
| (2) |
Where ( hereafter) is the spectral slope computed between the radiance factor at () and at () and is expressed in \reciprocal k Å. This spectral indicator is particularly adapted to evaluate the correction since the evolution of the CCD temperature affects the global slope of the VIR-VIS spectra.
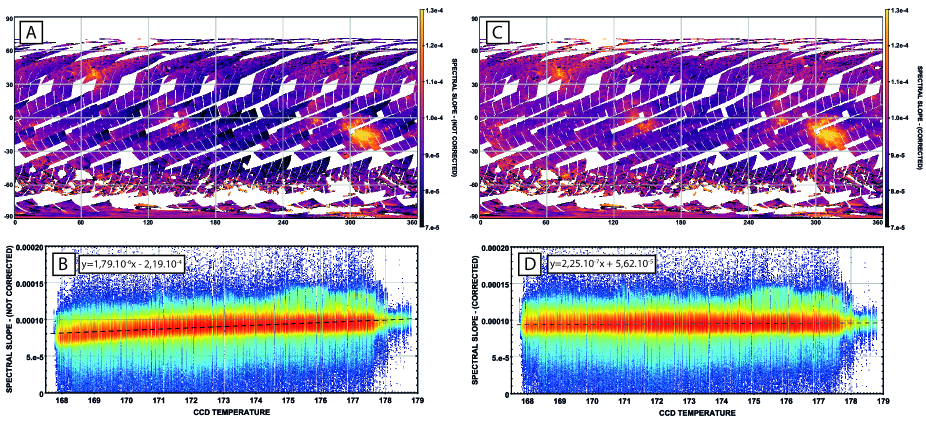
The Fig. 4 reports the correction of the entire VH2 dataset. Maps of the spectral slope and spectral slope distributions with temperature, before and after the correction, are presented. The map of the Panel (A) corresponds to without correction. A gradient in the spectral slope, due to the increase of (see Fig. 1), is visible throughout a sequence of cubes. This gradient is also visible in the Panel (B) which present according to . In this spectral slope distribution, the correlation coefficient of the linear fit is equal to while it drops to after the application of the correction (Panel (E)). This, combined with the lower slope of the linear fit after correction, indicates the accuracy of the latter which is also illustrated through the map of Panel (C).
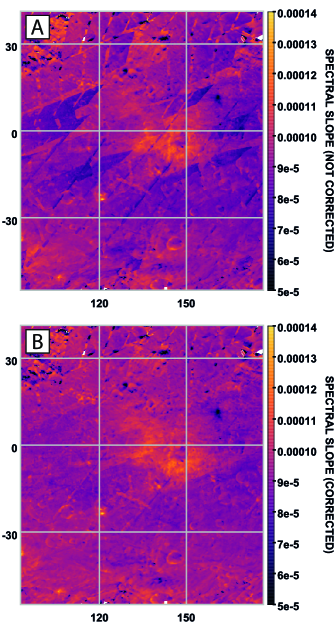
The correction of the different mission phases of the VIR-VIS Vesta dataset allows their merging for mapping purposes. In the Fig. 5, we present an example of such exercise through a close-up of the Vesta’ surface. The maps are built with approximately 3.4M pixels and represent with data from all the mission phases. Pixels are projected as single point and the median is computed in case of overlapping. The Panel (A) shows the spectral slope before the correction; VIR image cube footprints from diverse mission phases are visible due to the absence of correction. On the contrary, Panel (B) exhibits a map almost devoid of artifacts thanks to the correction, even if some footprints are still slightly visible.
VI Conclusion
The data acquired at Vesta and Ceres by the visible channel of the VIR spectrometer suffer from variations in the CCD temperature during their acquisition. The data acquired at Ceres have already benefited from an empirical correction detailed by Rousseau et al. (2019). Here, we developed a similar correction adapted for the Vesta dataset.
Such correction is necessary to carry out reliable studies of the surface like: mapping of spectral parameters (spectral slopes, reflectance), spectral analysis (especially using various VIR hyperspectral cubes), joint studies with the VIR infrared channel (merging of the data) or with the Dawn Framing Camera, photometric correction or analysis (the observation geometry is known to play a role on the spectral slope), spectral modeling for retrieving e.g. the composition.
The correction detailed in this present paper will be included in the calibrated version of the VIR visible data that will be delivered to the PDS (see the link in Sect. Data Availability Statement) in a future data release.
Supplementary Material
See supplementary material for the figures of the median spectra and correction factors of the VSA, VSS, VSH, VSL and VTC mission phases.
Data Availability Statement
The data that support the findings of this study are openly available on the Planetary Data Systeme archive at https://sbn.psi.edu/pds/resource/dawn/dwnvvirL1.html.
Acknowledgements.
VIR is funded by the Italian Space Agency (ASI) and was developed under the leadership of INAF-Istituto di Astrofisica e Planetologia Spaziali, Rome, Italy (Grant ASI INAF I/004/12/0). The instrument was built by Selex-Galileo, Florence, Italy. The authors acknowledge the support of the Dawn Science, Instrument, and Operations Teams. The authors made use of TOPCAT (Tools for OPerations on Catalogues And TablesTaylor (2005)) for a part of the data analysis and figure production. We thank the two reviewers for the suggestions which improved the paper.References
- Russell et al. (2007) C. T. Russell, F. Capaccioni, A. Coradini, M. C. De Sanctis, W. C. Feldman, R. Jaumann, H. U. Keller, T. B. McCord, L. A. McFadden, S. Mottola, C. M. Pieters, T. H. Prettyman, C. A. Raymond, M. V. Sykes, D. E. Smith, and M. T. Zuber, Earth, Moon, and Planets 101, 65 (2007).
- De Sanctis et al. (2011) M. C. De Sanctis, , A. Coradini, E. Ammannito, G. Filacchione, M. T. Capria, S. Fonte, G. Magni, A. Barbis, A. Bini, M. Dami, I. Ficai-Veltroni, and G. Preti, Space Science Reviews 163, 329 (2011).
- Rousseau et al. (2019) B. Rousseau, A. Raponi, M. Ciarniello, E. Ammannito, F. G. Carrozzo, M. C. D. Sanctis, S. Fonte, A. Frigeri, and F. Tosi, Review of Scientific Instruments 90, 123110 (2019).
- Russell and Raymond (2011) C. Russell and C. Raymond, Space Science Reviews 163, 3 (2011).
- Note (1) https://sbn.psi.edu/pds/resource/dawn/dwnvvirL1.html.
- Carrozzo et al. (2016) F. G. Carrozzo, A. Raponi, M. C. De Sanctis, E. Ammannito, M. Giardino, E. D’Aversa, S. Fonte, and F. Tosi, Review of Scientific Instruments 87, 124501 (2016).
- Scarica et al. (2016) P. Scarica, M. Ciarniello, M. C. De Sanctis, E. Ammannito, and F. Tosi, AGU Fall Meeting Abstracts 43, P43C (2016).
- Rousseau et al. (2020) B. Rousseau, M. C. De Sanctis, A. Raponi, M. Ciarniello, E. Ammannito, A. Frigeri, M. Ferrari, S. De Angelis, F. G. Carrozzo, F. Tosi, S. E. Schröder, C. A. Raymond, and C. T. Russell, Astronomy & Astrophysics 642, A74 (2020).
- Taylor (2005) M. B. Taylor, in Astronomical Data Analysis Software and Systems XIV, Vol. 347, edited by P. Shopbell, M. Britton, and R. Ebert (Astronomical Society of the Pacific Conference Series, 2005) p. 29.