Depth-Enhanced Feature Pyramid Network for Occlusion-Aware Verification of Buildings from Oblique Images
Abstract
Detecting the changes of buildings in urban environments is essential. Existing methods that use only nadir images suffer from severe problems of ambiguous features and occlusions between buildings and other regions. Furthermore, buildings in urban environments vary significantly in scale, which leads to performance issues when using single-scale features. To solve these issues, this paper proposes a fused feature pyramid network, which utilizes both color and depth data for the 3D verification of existing buildings 2D footprints from oblique images. First, the color data of oblique images are enriched with the depth information rendered from 3D mesh models. Second, multiscale features are fused in the feature pyramid network to convolve both the color and depth data. Finally, multi-view information from both the nadir and oblique images is used in a robust voting procedure to label changes in existing buildings. Experimental evaluations using both the ISPRS benchmark datasets and Shenzhen datasets reveal that the proposed method outperforms the ResNet and EfficientNet networks by 5% and 2%, respectively, in terms of recall rate and precision. We demonstrate that the proposed method can successfully detect all changed buildings; therefore, only those marked as changed need to be manually checked during the pipeline updating procedure; this significantly reduces the manual quality control requirements. Moreover, ablation studies indicate that using depth data, feature pyramid modules, and multi-view voting strategies can lead to clear and progressive improvements.
keywords:
Building verification , Feature Pyramid Network , 3D Modeling , Oblique images1 Introduction
Buildings form the skeleton of urban environments; however, they are subject to continuous change, especially in areas where rapid urbanization takes place (Nyaruhuma et al., 2012). As an important source of spatial infrastructure data, continuous urban management requires up-to-date building information. It is difficult—if not impossible—to rebuild the entire dataset for each time interval; thus, it is essential to identify the changed regions. The existing buildings must be verified to remove demolished ones or update modified ones in the existing datasets.
Most existing building-verification methods only consider the 2D outlines of buildings, commonly using remote-sensing images to extract roof top information (Hussain et al., 2013; Hong et al., 2019). For example, the normalized difference vegetation index was used to extract the roof areas (Rottensteiner, 2007; Singh et al., 2012), which is inevitably disturbed by high-rise vegetation near buildings; feature engineering or learned representations are also common approaches to identify roof areas (Sidike et al., 2016; Sofina and Ehlers, 2016), which is hard to overcome confusing textures in urban environment using only the nadir views, such as pavements, bridge decks and streets.
In fact, false-alarm detection is probably the most challenging issue for change detection of buildings (Javed et al., 2020). In order to improve the robustness, some seminal works (Nyaruhuma et al., 2012; Xiao and Gerke, 2015) have been done on building verification using penta-view aerial oblique images (Remondino and Gerke, 2015). Because of their multi-angle capabilities, both roof tops and façades were considered. The additional information provided by the façade images has facilitated the detection of regular, structured features of buildings; however, some issues remain unaddressed.
1) Discriminability of features from 2D images
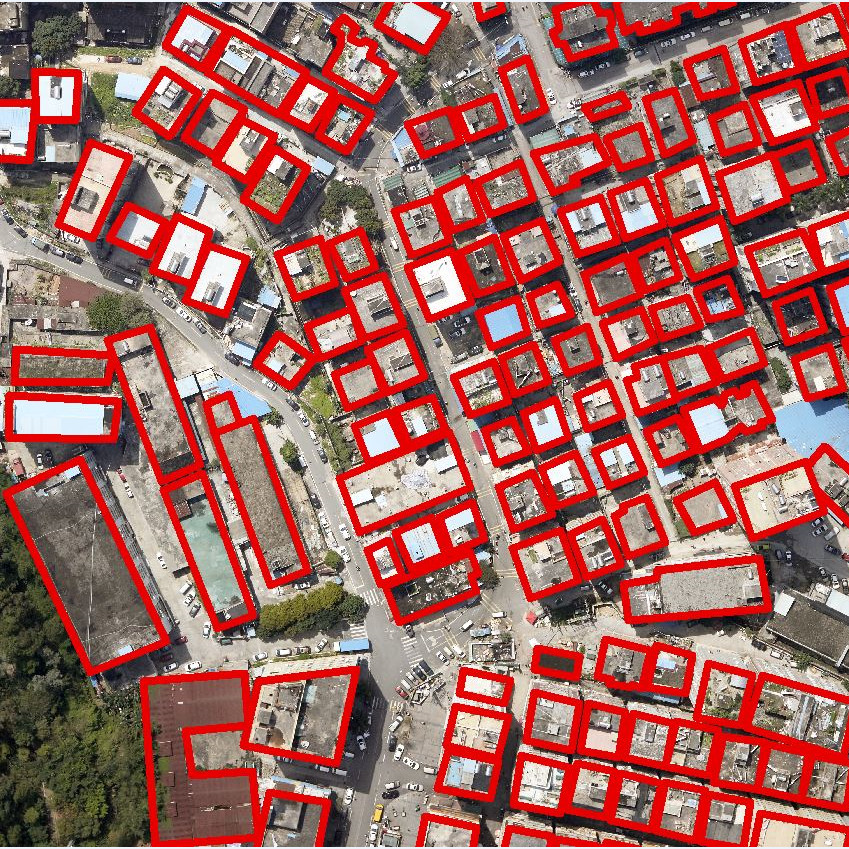
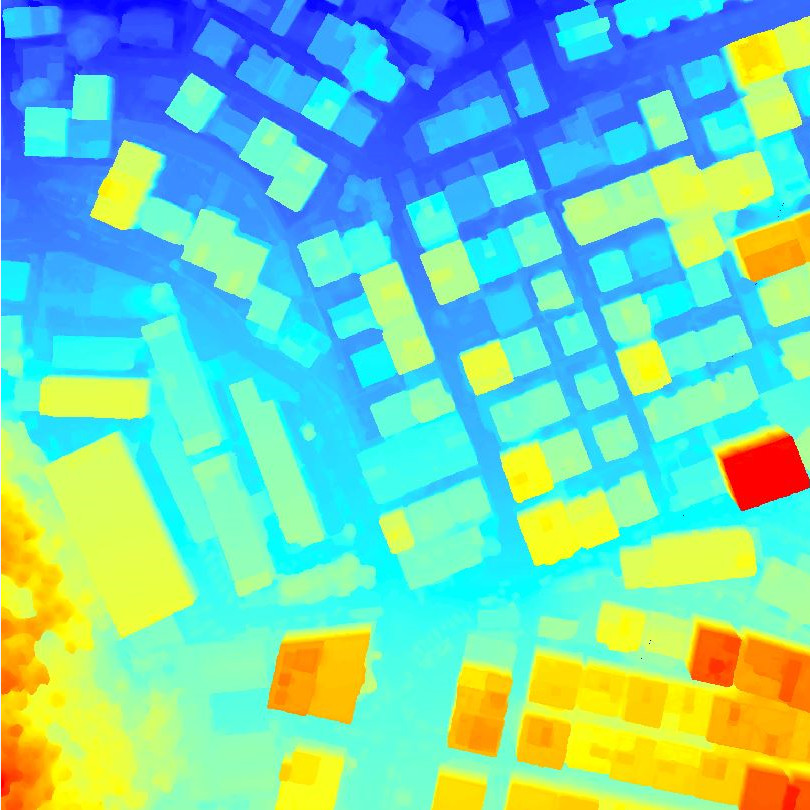
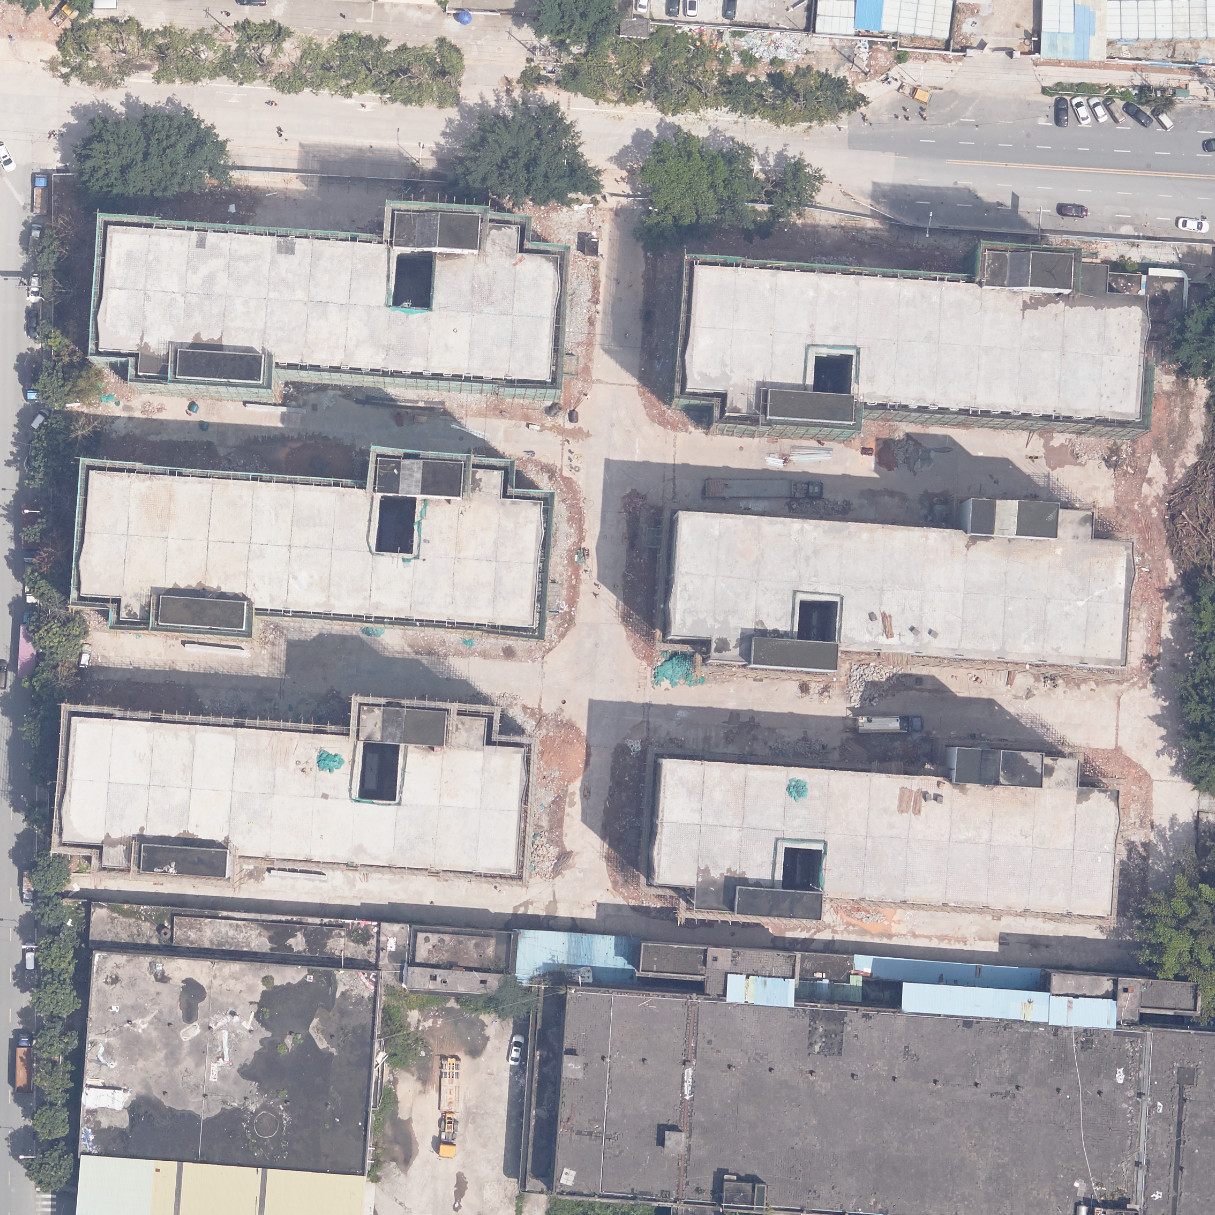
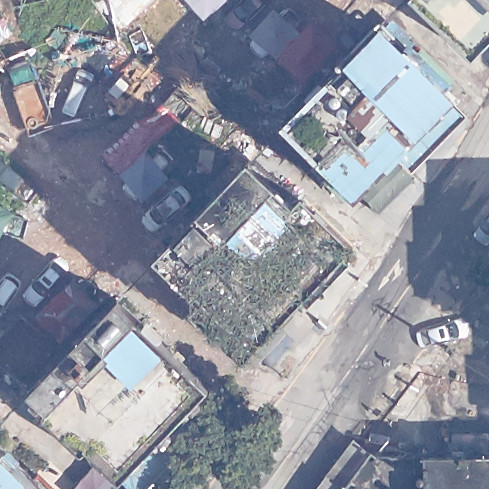
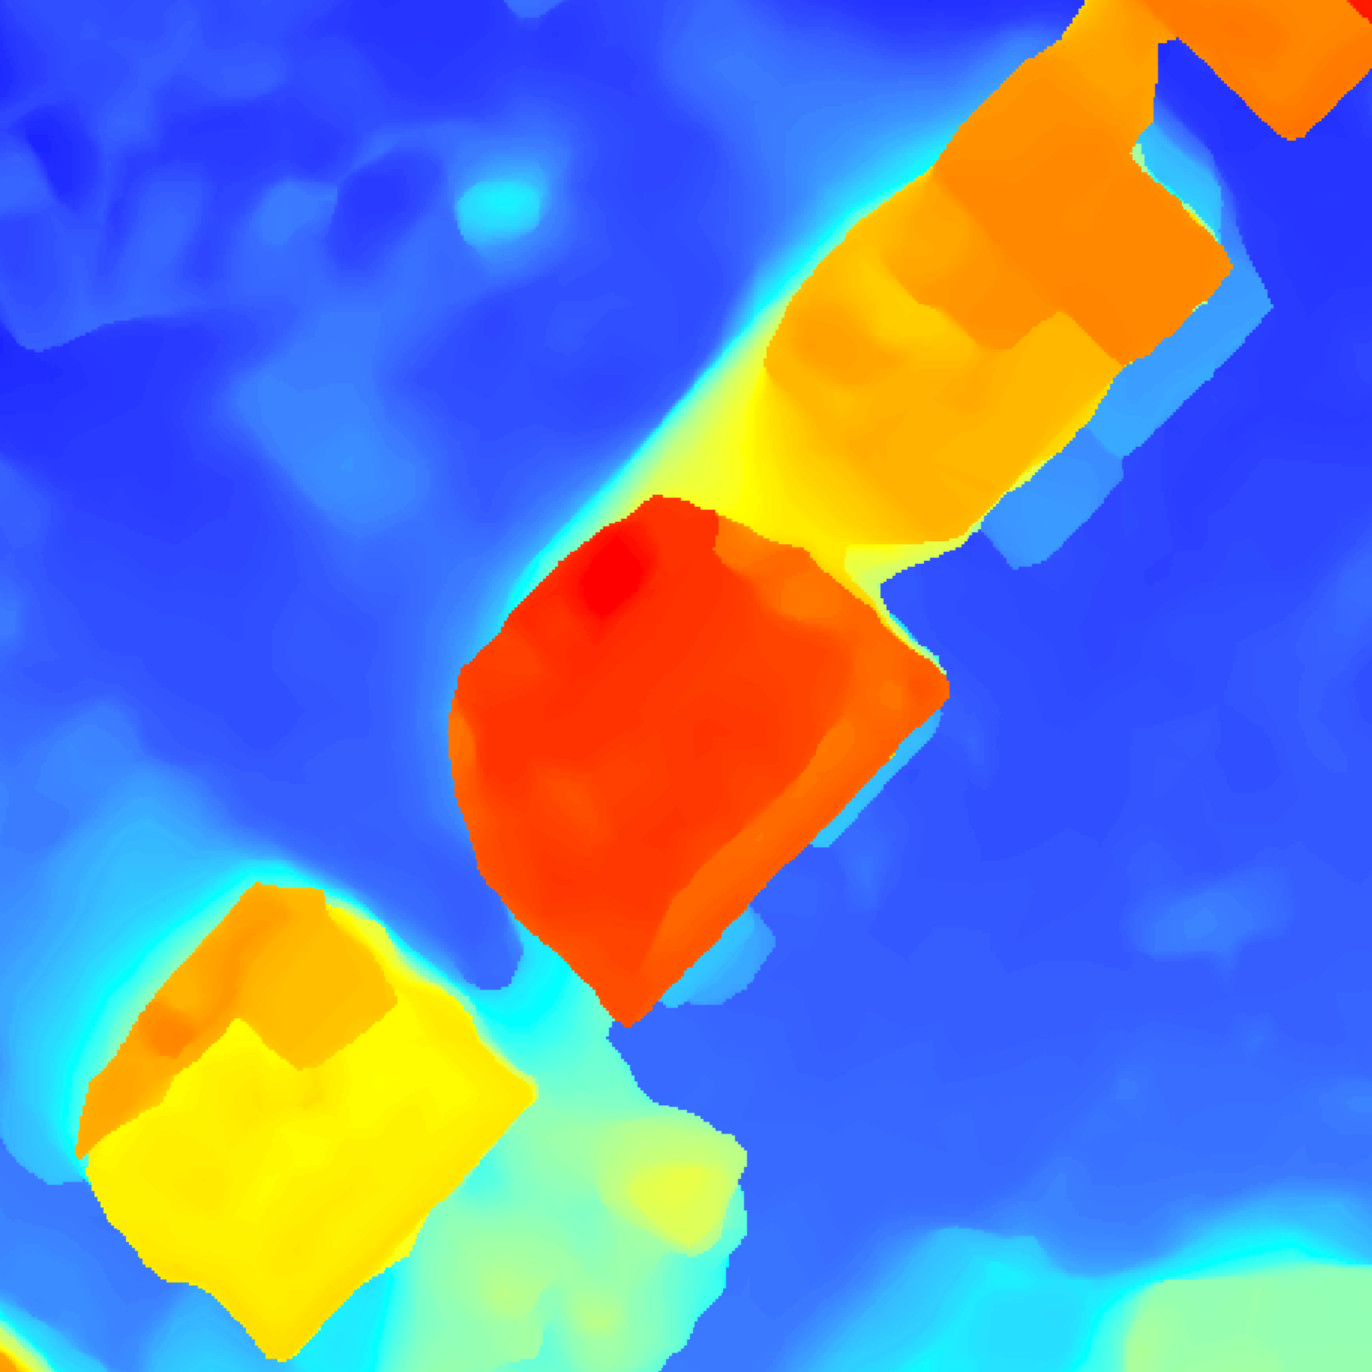
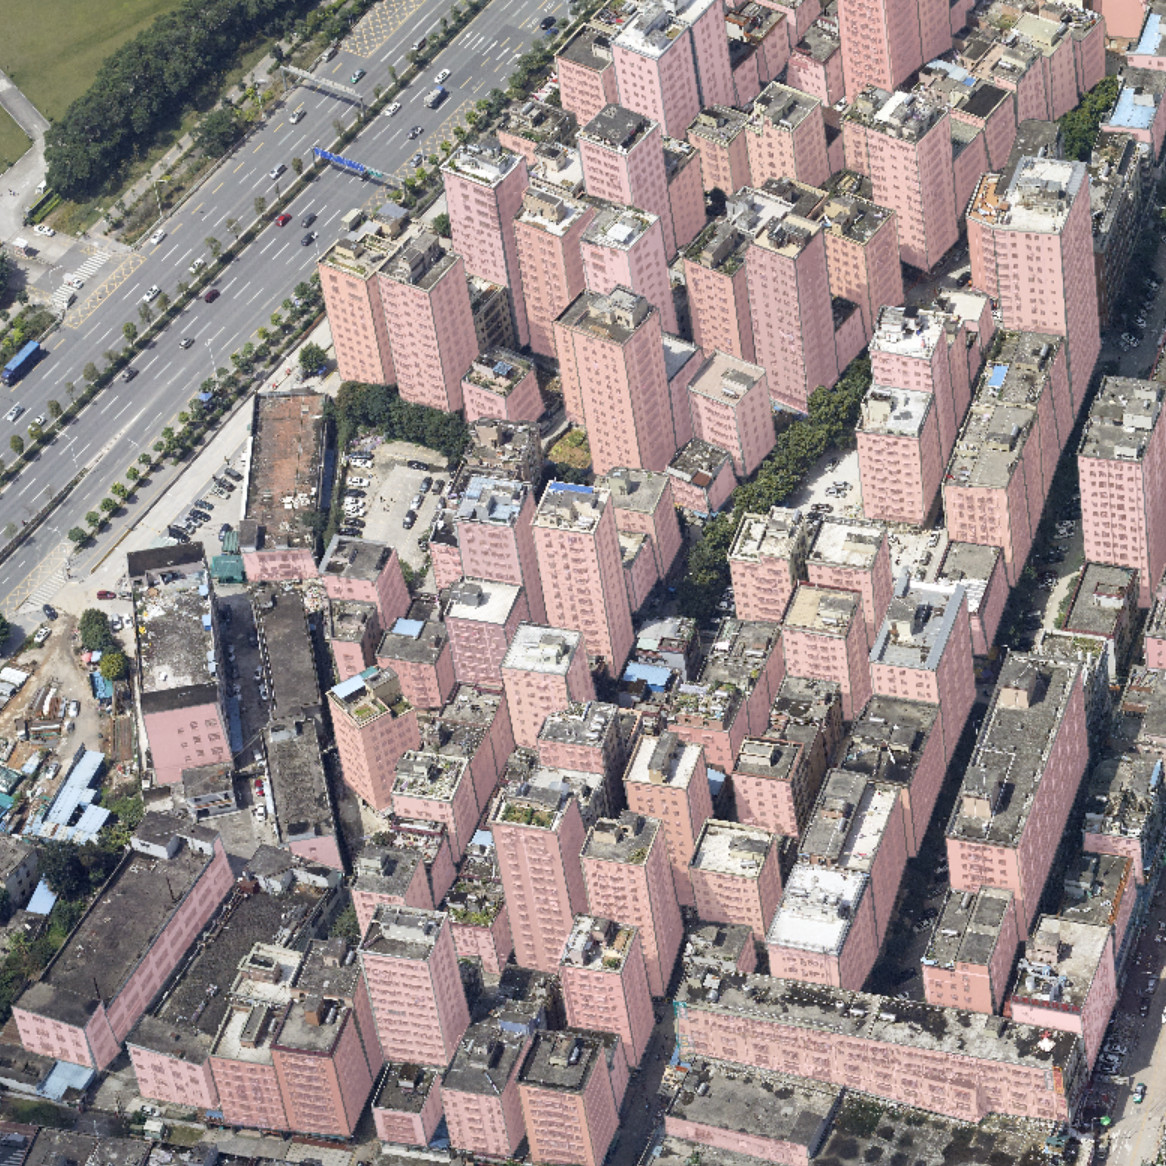
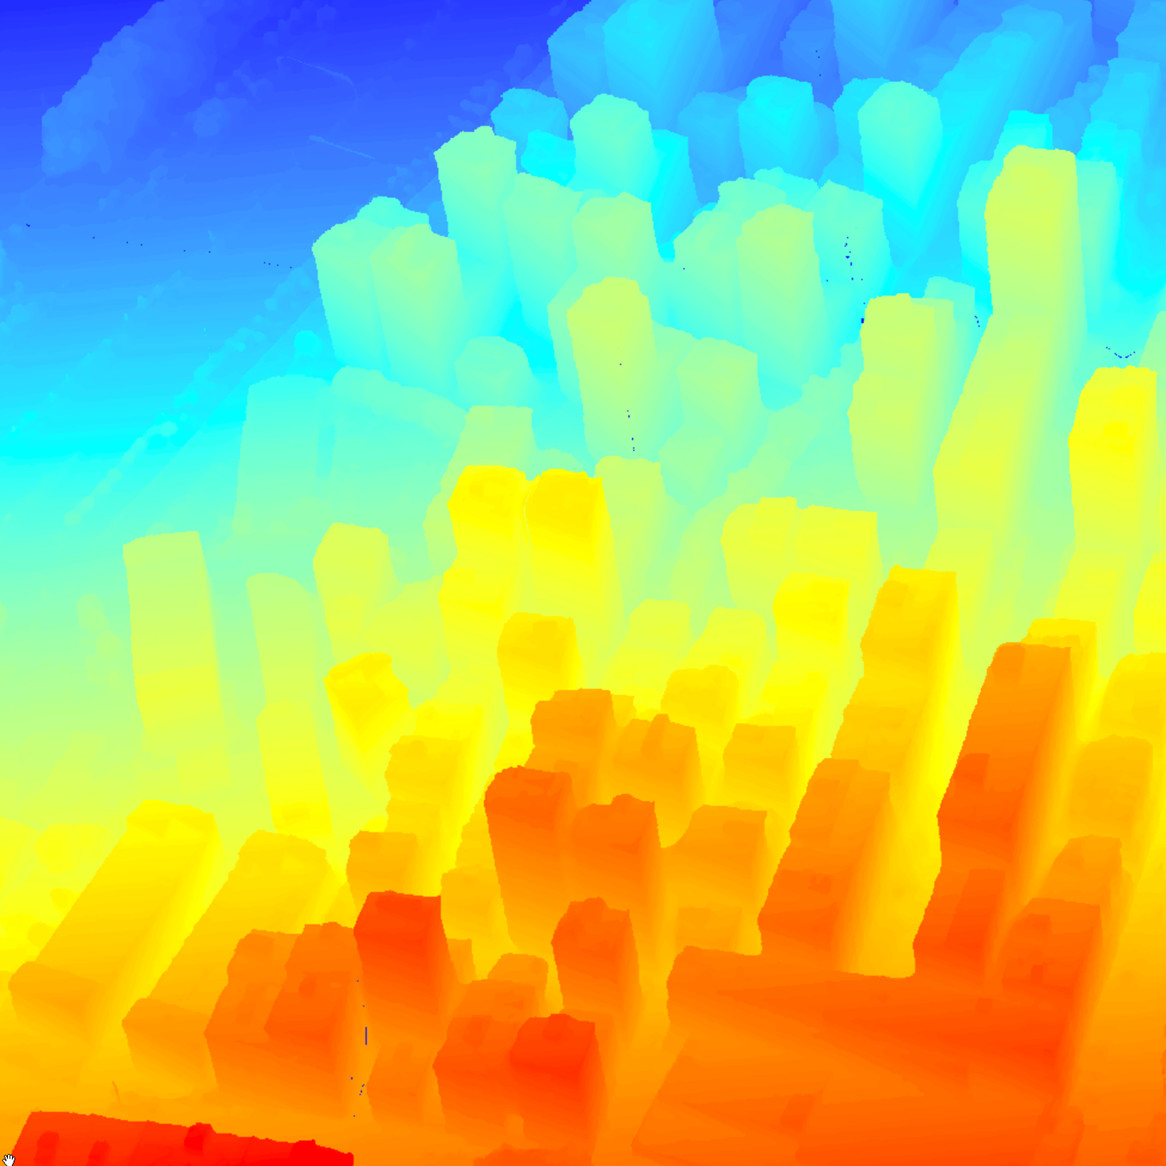
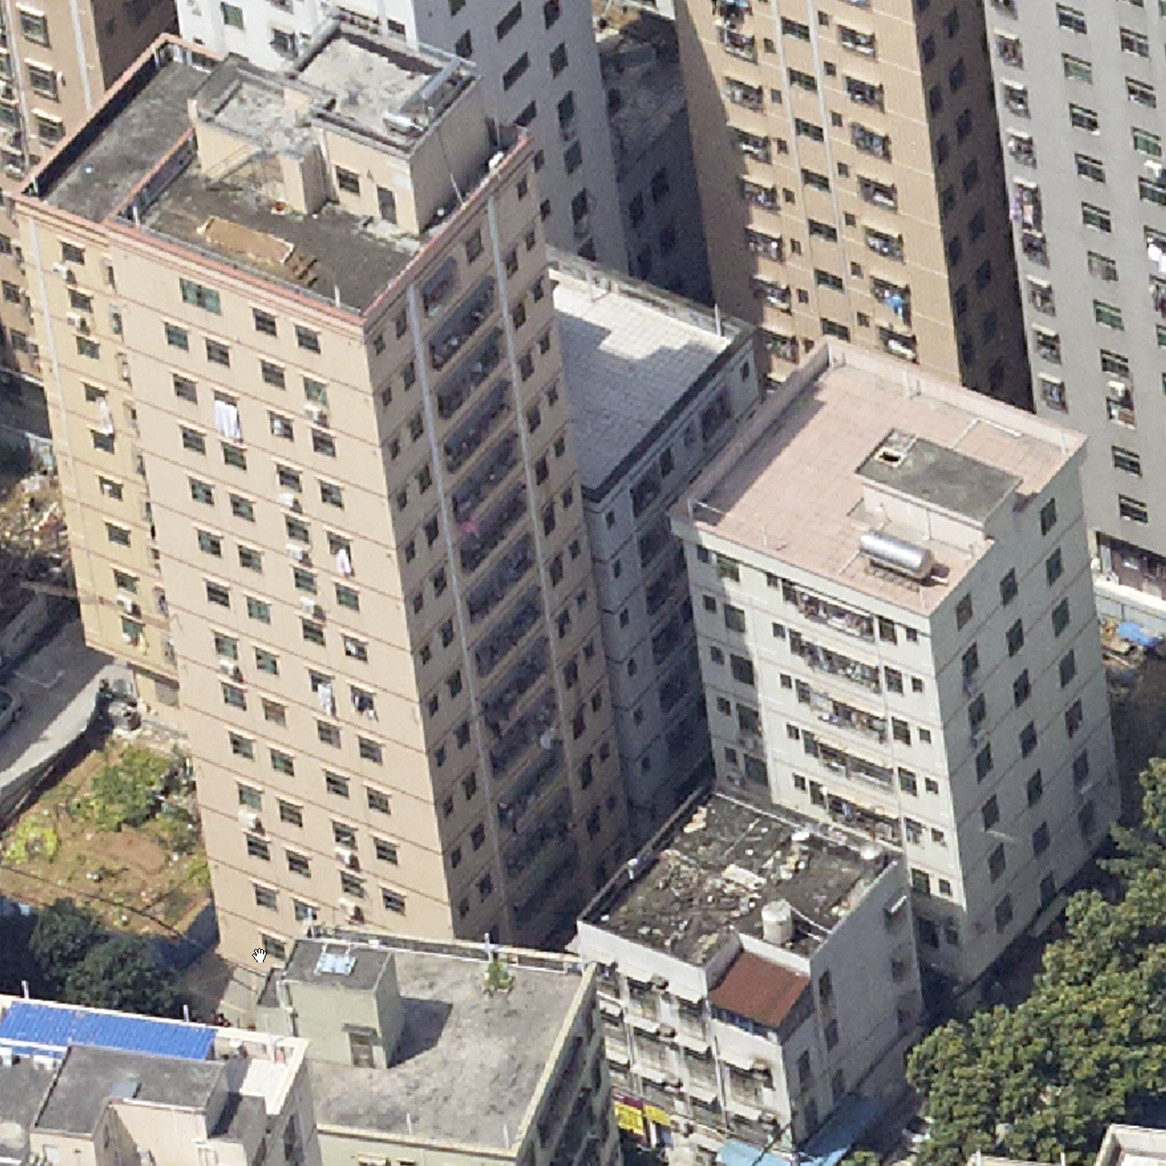
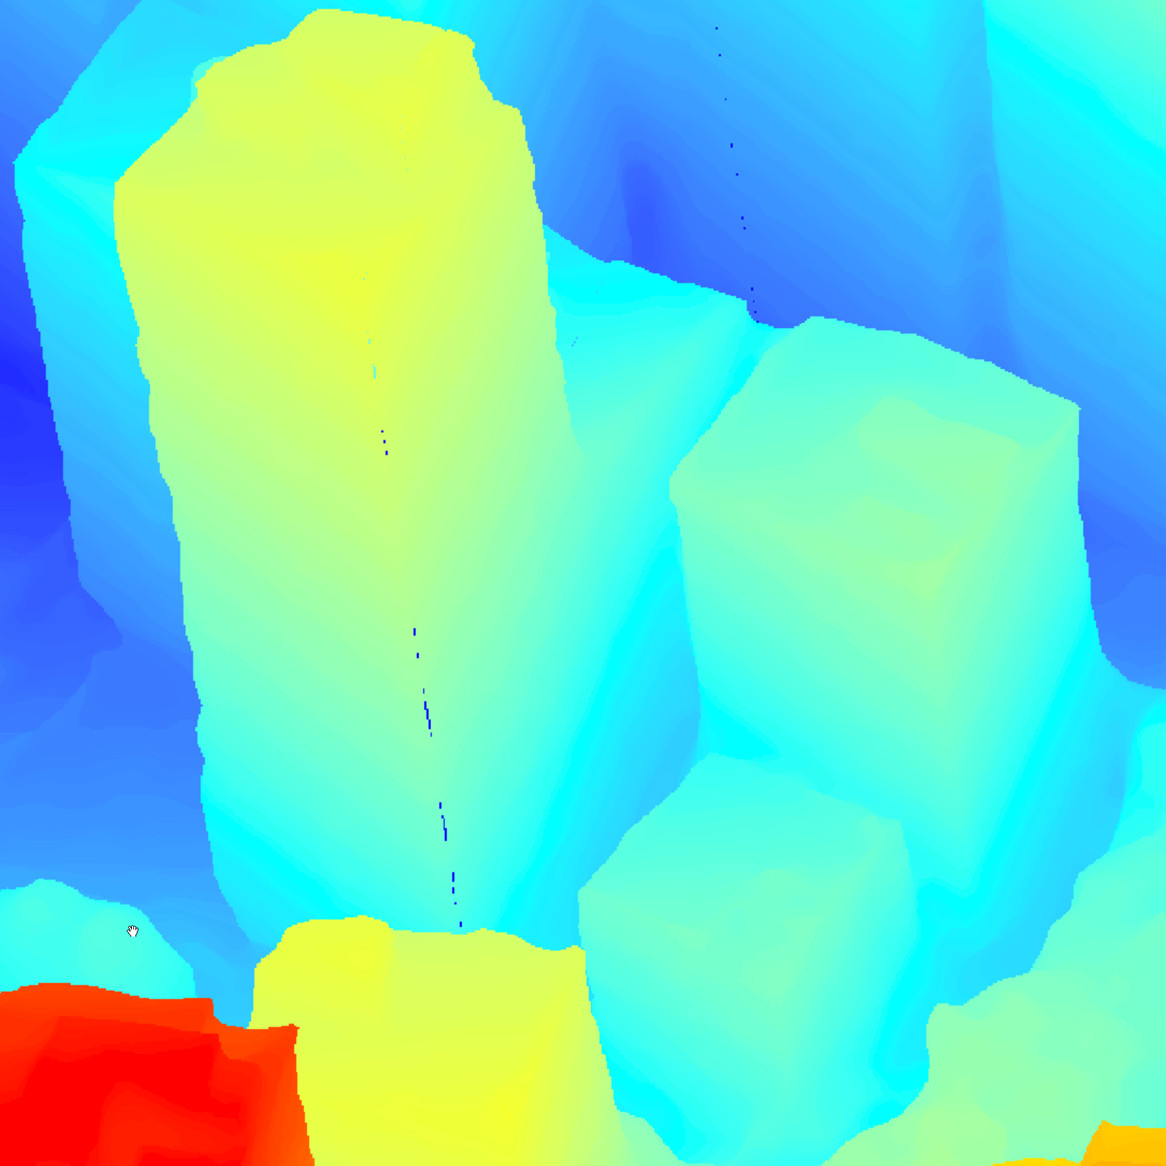
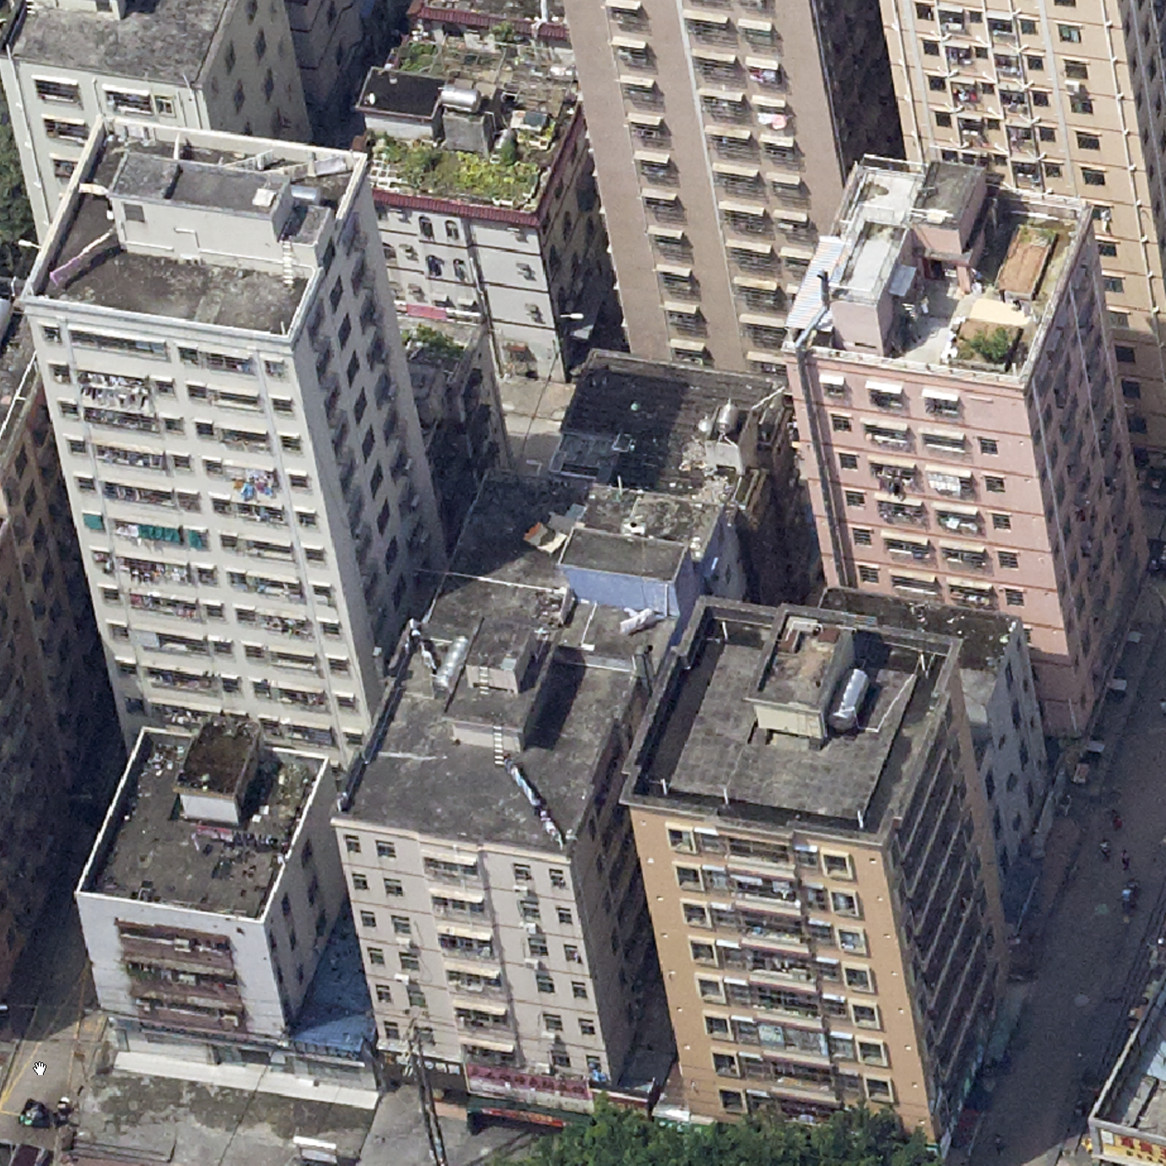
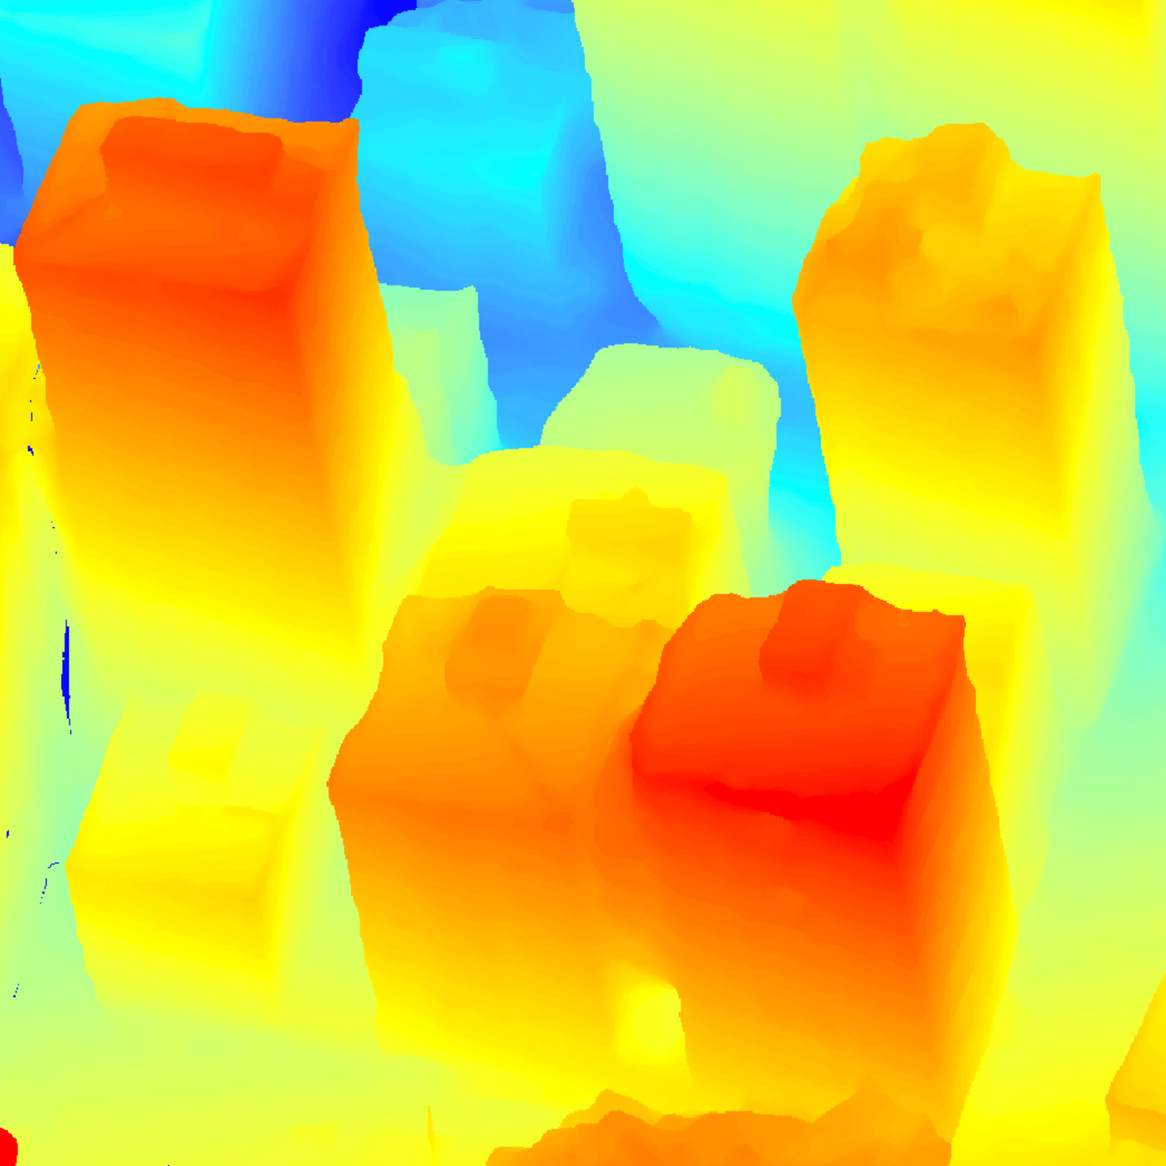
Because a single 2D image does not contain depth information, the performance of either meticulously engineered features (Xiao and Gerke, 2015; Konstantinidis et al., 2016) or learned features (Chen et al., 2017; Zhang et al., 2017) significantly decreases in regions with ambiguous textures (Figure 1). Even when oblique images are considered, most approaches only use the oblique view as 2D images (Xiao and Gerke, 2015), which fails to alleviate the problem (Figure 2). It has been proved that accurate depth information, such as digital surface model (DSM), can help identify buildings, even when only nadir views are used (Rottensteiner, 2007; Qin, 2014; Zhou et al., 2020). Inspired by this strategy, we go one step further in exploiting depth information for oblique-only views by using photogrammetric mesh models (Remondino et al., 2013), as shown in the second rows of figures 1 and 2. We also use depth maps to detect occlusions in complex urban environments.

2) Size variation of buildings
Buildings in complex urban areas have different sizes. Moreover, oblique camera images show notable scale differences between the near and far sides, owing to the large pitch and roll angles. Even for the same building, the scale will be different on images captured from different angles. The generalization ability of existing engineered features (Nyaruhuma et al., 2012; Yang et al., 2015) is doubtful for images at different scales and different noise-level. Furthermore, currently different strategies are generally used for roofs and façades (Xiao and Gerke, 2015). A unified strategy is preferred to handle both primitives.
To address the two aforementioned problems, we propose a depth-enhanced feature pyramid network (FPN) for the occlusion-aware verification of buildings from oblique images. The basic approach is to first enrich the oblique aerial images with depth information from photogrammetric meshes (Zhu et al., 2020b); then, use depth-enhanced penta-view images for building verification. More specifically, 3D mesh models are first reconstructed using automatic structures from motion and multi-view stereo pipelines (Schönberger and Frahm, 2016; Vu et al., 2011). Next, depth information for all the images is retrieved by rendering the mesh models into the corresponding views (Zhu et al., 2020b) using known camera poses. Next, the outlines of buildings in the existing database are extruded according to associated attributes (e.g., number of floors) and projected to all visible views; then, visible patches are extracted through direct depth-information-based occlusion tests. We establish a depth-enhanced FPN (Lin et al., 2017) with an additional fusing layer, to classify the visible patches (which have various scales) to three categories: roof, façade, and background. Finally, a robust multi-view voting strategy is used to ensure that all changed buildings are marked, with a relatively small false-alarm rate set as an ancillary goal.
To summarize, in order to alleviate problem caused by false alarms, the primary contributions of this paper are : 1) An efficient approach to associate 3D mesh models with 2D images, which makes the features more discriminative and supports occlusion tests. 2) An improved pyramid scheme (Lin et al., 2017) tuned for oblique images for buildings of various sizes. 3) A robust multi-view voting strategy, which achieves a 100% true-positive rate with a relatively small false-alarm ratio in two datasets containing more than 3000 buildings. The reminder of this paper is organized as follows: Section 2 briefly reviews the existing studies on building verification and the related works on convolutional neural networks (CNNs). Section 3 describes the depth-enhancement strategy and multi-view verification procedure in detail. Section 4 describes the experimental evaluations, and Section 5 presents our concluding remarks.
2 Related works
In the following, we briefly review the most pertinent topics of this paper: 1) building verification, 2) image classification with learned features, and 3) multi-scale approaches.
1) Building verification
Earlier works (Rottensteiner, 2007; Singh et al., 2012) on building verification typically used the normalized difference vegetation index to perform threshold screening of roof areas. However, such methods are susceptible to interference from vegetation-covered areas or roofs. Several solutions have been proposed to improve the method’s robustness, including principal component analysis (Deng et al., 2008), texture features (Sidike et al., 2016; Sofina and Ehlers, 2016), and shape analysis (Abdessetar and Zhong, 2017). However, these methods cannot overcome the ambiguities caused by ground-object interference.
The re-invention of oblique aerial imaging (Remondino and Gerke, 2015) has made it feasible to consider façades as an additional source of information for improved building verification. Consequently, doors (Nyaruhuma et al., 2010) and other building features (Xiao et al., 2012) have been used for verification, based on geometrical inferences or texture information. For example, lines or corners—the most salient features of building façades—are typically used (Nyaruhuma et al., 2010). Texture information (Frommholz et al., 2015; Yang et al., 2015; Zhu et al., 2020c; Hu et al., 2016a) can also be used to parse façades, and roofs and façades can be jointly considered to improve robustness (Xiao and Gerke, 2015).
However, most of these approaches use solely the oblique aerial images as “pretty images” and they neglect their inherent value in 3D measurement. In fact, it has been proved that even using 2.5D depth information from the DSM will increase the discriminability of roof features (Rottensteiner, 2007; Zhou et al., 2020). We expand upon this strategy by enhancing all images with depth information, rather than using only the orthophoto and the DSM.
2) Image classification with learned features
Most of the aforementioned building-verification methods use meticulously engineered building features (e.g., lines, corners, and textures), which may not generalize well to different scenarios (Huang et al., 2016; Hu et al., 2016b; Hu and Wu, 2017). With the advent of deep learning approaches (especially deep CNNs (Krizhevsky et al., 2012)), learned features have shown impressive performances in numerous tasks (Simonyan and Zisserman, 2014; He et al., 2016; Alshehhi et al., 2017; Zhu et al., 2020a). Many approaches have been proposed to solve the related topic of change detection in buildings, based on the Siamese network(Bromley et al., 1994; Bertinetto et al., 2016). For instance, Zhan et al. (2017) directly converted the Siamese network into a change-detection one, using aerial images as the input; Zhang et al. (2018) generalized a similar approach to manage multi-modal data sources. Another strategy is to extract building areas using instance segmentation (Ji et al., 2019) (e.g., Mask Regions with CNNs (He et al., 2017)) and compare the binary masks using U-Net (Ronneberger et al., 2015).
However, we argue that formulating the problem of building verification in terms of change detection is not ideal. Unlike the orthophotos with nadir views, oblique views cannot be rectified globally and therefore it is hard to perfectly align them from two-phase images. Only the roof structures can be considered for pixel-wise change detection. Therefore, we directly formulate the verification as an image-classification problem (Simonyan and Zisserman, 2014; He et al., 2016); this involves projecting the extruded building planes onto multi-view images and classifying the patches as roofs or façades.
3) Multi-scale approaches
Scale differences are a very common issue in many applications, and pyramid schemes have already been widely applied to resolve them. For instance, spatial pyramid pooling has been proposed (He et al., 2015) to aggregate features across multiple scales. A FPN (Lin et al., 2017), constructed using up-sampling and lateral connections, has demonstrated an impressive performance in object detection. The cascaded pyramid network formulation (Chen et al., 2018) also provides an efficient strategy for integrating features into pyramid networks. In Tan and Le (2019), pyramid scheme was learned using an automatic neural architecture search, which combined depth, width, and resolution transformations. Furthermore, Tan et al. (2020) demonstrated a more efficient strategy for connecting between multi-scale features, to improve object-detection performances. To solve the specific problems raised by conducting building verification using oblique aerial images, we adopt a strategy similar to the FPN (Lin et al., 2017). Specifically, we propose a fusion layer to integrate multi-scale features for the subsequent classification of buildings.
3 Methodology
3.1 Overview
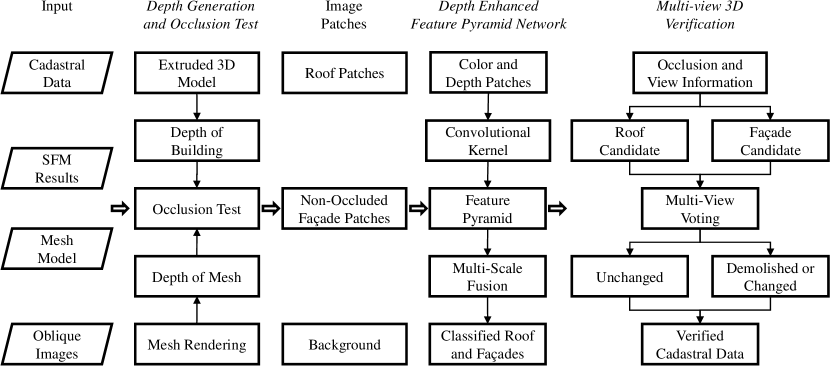
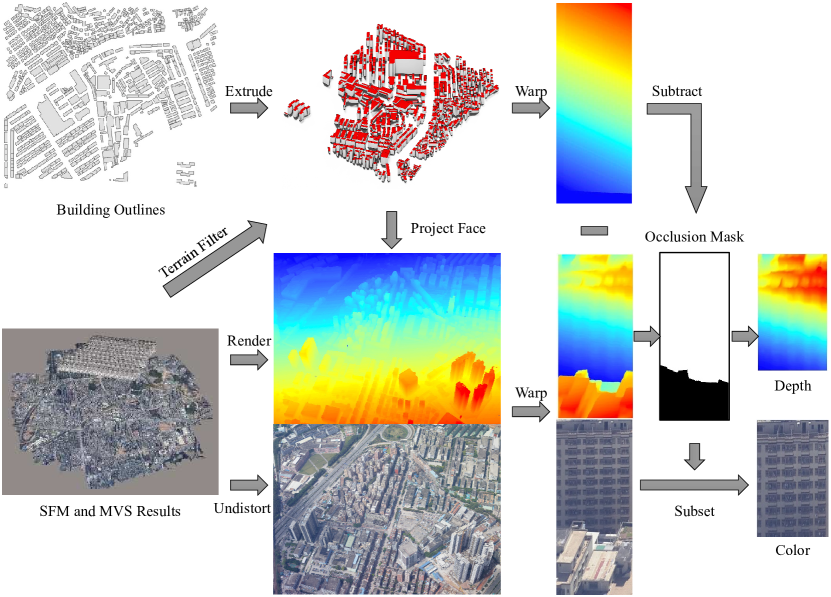
To solve the problem of ambiguous textures using only orthophotos, we combine oblique images and depth features rendered from 3D mesh models for building verification. We construct a FPN to extract features from the oblique and depth images; then, we fuse multi-scale features to improve the discriminability of buildings with varying sizes. In addition, building verification reliability can be further improved by considering the redundancy of multi-view oblique images through a robust multi-view voting strategy. The workflow of the proposed method is briefly illustrated in Figure 3, including the steps for depth generation and occlusion testing, the depth-enhanced FPN, and multi-view 3D verification.
More specifically, this study first uses the mesh model generated from the multiple view stereo (MVS) (Hirschmuller, 2005; Vu et al., 2011) pipeline and the position and orientation parameters from the Structure from Motion (SFM) (Schönberger and Frahm, 2016; Xie et al., 2016) results, to render the corresponding depth information (Zhu et al., 2020b). The buildings’ footprint data are also extruded using the corresponding floor information; then, the depth image is obtained by projecting the photogrammetric mesh models onto corresponding view. Pixel-wise occlusion tests are conducted using depths obtained from both buildings and mesh models. Second, a pyramid convolutional neural network is constructed, to extract feature information from the original color images and rendered depth images. The non-occluded patches are classified into roof, façade, or background categories. Finally, the reliability is further improved through multi-view voting. A single building consists of a roof and several façade planes, and each plane is also visible in multiple views, because of the increasing overlap ratio and the penta-view design (Petrie, 2009) of aerial oblique camera system nowadays. A robust strategy is used to achieve a 100% true-positive rate with a moderate false-alarm ratio.
3.2 Depth generation and occlusion testing
Although the probabilities for multiple regions can be predicted using a unified approach (Girshick, 2015), memory constraints limit the existing architecture to processing aerial images in only a single forward pass of the neural network. In addition, occlusion is inevitable in building rise-up regions, especially in the façade regions of oblique views. Therefore, this study first subsets both roof and façade patches for all buildings and then predicts the classes of each patch separately. Furthermore, the depth information of the 3D mesh models is projected onto the corresponding aerial views. Occlusion testing is conducted, and only visible patches are considered in the subsequent processing. Figure 4 illustrates the visible-patch-generation workflow.
3.2.1 Generation of 3D buildings
Although many cities have migrated cadastral management data from 2D to 3D (Shojaei et al., 2013), 2D building floor plans (Fan et al., 2014) are still widely used in many applications for legacy reasons. To use façades for the verification of existing buildings, the 2D building outlines must be extruded to the corresponding level of detail (LOD-1) (Fan et al., 2014) representation.
The average heights of the mesh models or corresponding DSMs inside each building are used as the height of the roof. To determine the height of the buildings, we first filter non-ground objects in the mesh model or DSM, using an adaptive surface filter (Hu et al., 2014). An aggressive set of parameters is chosen for in this study, e.g., for maximum objects, for the minimum filtering window, and for the height threshold. After filtering out the ground, the roof is extruded to the lowest point inside the region, and a 3D LOD-1 model is obtained. An example of LOD-1 buildings generated from building outlines is shown in the top row of Figure 4.
3.2.2 Generation of depth and color images
Because existing neural network architectures for 3D data (e.g., mesh (Hanocka et al., 2019) and point clouds (Qi et al., 2017)) are not scalable to city scale datasets, we propose an efficient approach to implement the 3D metric capabilities of oblique aerial images, by directly rendering the mesh models (Zhu et al., 2020b) as pixel-wise depth maps. This strategy is capable of handling tiled models (Osfield and Burns, 2014) that are fragmented and discontinuous.
Similar to our previous work (Zhu et al., 2020b), we first convert the position and orientation information for each view (recorded in the BlockExchange format (Bentley, 2019)) to the corresponding notations in OpenGL (GLM, 2019) (e.g., view and projection matrices). A point can be projected onto the normalized screen space as
| (1) |
where the tilde symbols and denote the homogeneous coordinates.
We allocate a buffer to retrieve depth information (i.e., the third dimension of the normalized points in the screen space), as shown in the center of Figure 4. Because this rendering neglects the distortion parameters of the camera, the aerial color image is undistorted using the Brown distortion model (Bentley, 2019). In theory, the rendered depth and undistorted color images should possess a one-to-one mapping. Therefore, we treat them as four channel inputs in the subsequent neural network.
3.2.3 Occlusion testing and generation of depth and color patches
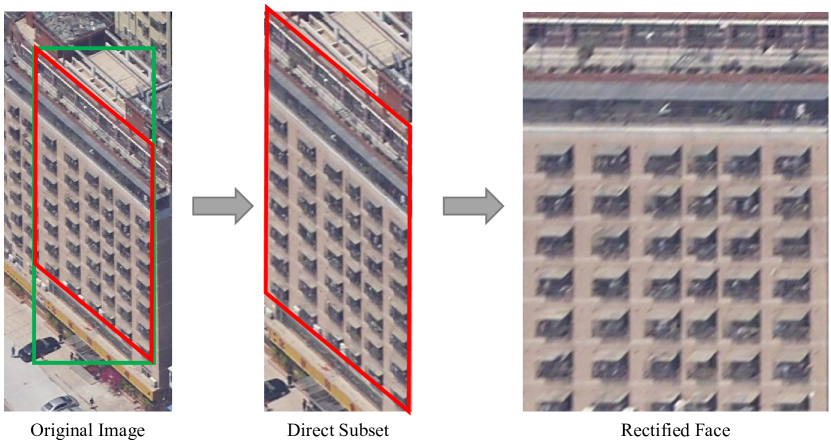
In this section, we describe the procedure of occlusion detection and generation of image patches. The vertices of each polygonal face of the extruded LOD-1 model are projected onto the undistorted image using Eq. 1. Instead of directly sub-setting the patches from the original images, we warp them to the polygonal face to alleviate affine deformations, as shown in Figure 5. This warping procedure is defined by a homographic transformation between the projected points on the image and the planar coordinates of the vertices on the rectified face (Figure 5), scaled by the average ground sample distance.
In the rectified image space, a pixel-wise depth map for the polygonal face is obtained through a bi-linear interpolation of the four corners. Furthermore, the corresponding depths for the mesh model and original color image are also obtained using the homographic matrix , as shown in the right-hand side of Figure 4. It should be noted that the bottom of the target building is often occluded by buildings in the foreground area. Using both the depth map of the polygonal face and the mesh models, the occlusion test can be readily conducted by directly subtracting the two maps. Then a binary mask is generated by thresholding the difference, two meters is used empirically. Only the axis-aligned bounding boxes of the non-occluded subsets are used in the subsequent neural network, as shown in the right-most depth and color patches in Figure 4.
3.3 Fused FPN for building recognition
Existing CNN architectures, e.g., VGGNet (Simonyan and Zisserman, 2014) and residual neural network (ResNet) (He et al., 2016), have already demonstrated impressive performances on large datasets (Krizhevsky et al., 2012). However, we found that after fine tuning, the performance of these models remained unsuitable for our task: to identify all changed buildings with a relatively low false-alarm rate. When this objective is achieved, quality control is only required for buildings marked as changed by the method.
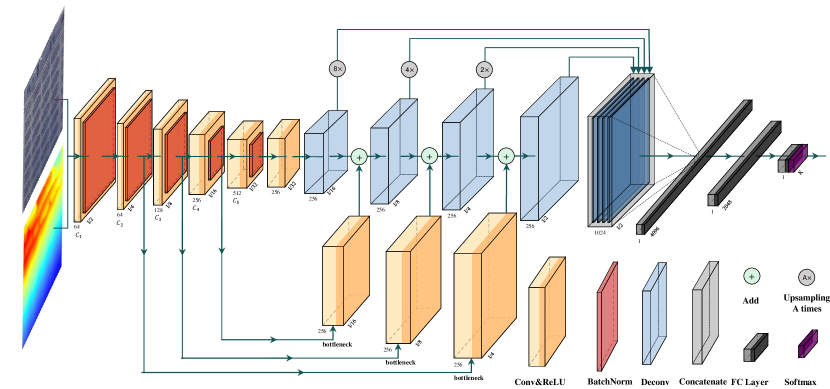
To solve the problems caused by varying building sizes and scale changes in oblique aerial images, we propose a fused FPN, to learn a hybrid representation from both the color and depth images; this method is inspired by the FPN in (Lin et al., 2017). The purpose of constructing the pyramid is to obtain multi-scale features by decomposing the features of the image into large scales and small scales using the multi-scale convolution kernel of the convolutional neural network. As shown in Figure 6, we add a fused module to the tail of the architecture, rather than empirically choosing a suitable pyramid level in the FPN (Lin et al., 2017). In addition, the input is augmented by the corresponding depth image. More specifically, we apply the corresponding numbers of convolutional kernels, to reduce the dimensions of the small-scale feature maps; then, we use the deconvolution kernels (Long et al., 2015) to expand the sizes of the feature maps; finally, we fuse each of these using a large-scale convolution kernel, to generate the predictive feature map. The network ends with a global average pooling layer and a fully connected layer. In addition, the softmax activation is used to generate the normalized probability for each class. The network uses a cross-entropy loss function for multi-class recognition.
3.3.1 Generation of feature pyramid
As shown in Figure 6, we use a standard approach (Simonyan and Zisserman, 2014; He et al., 2016) to generate a series of feature maps as the neural network input. The number of channels and spatial resolutions of the feature maps gradually increase and decrease as and , respectively; is the size of the image. For each convolution block, Rectified Linear Unit (ReLU) activation and batch normalization (Ioffe and Szegedy, 2015) are used.
Because of the large spatial resolution of the feature map , only the subsequent maps are chosen as the convolutional layers of the multi-scale feature pyramid structures, as shown in the left-hand side of Figure 6. In addition, the feature map channels are resized to the same channels that is in the bottleneck, using a convolution layer before fusing (the yellow feature map in the middle-bottom of Figure 6), which is also called lateral connections in FPN (Lin et al., 2017). To retain the strong semantic information in the small-scale feature map, we use a deconvolution structure (the blue feature map in the center of Figure 6) to scale up each pyramid layer from high to low. Then, we add identically sized feature maps together after the convolutional layer in the former procedure; subsequently, the feature maps of all pyramid sizes contain larger quantities of strong semantic information. It should be noted that the structure is also unaffected by the choice of convolution block, e.g., VGG (Simonyan and Zisserman, 2014) or ResNet (He et al., 2016). In this study, ResNet is chosen empirically as the base module for FPN, as it is well modularized and has been widely used in the remote sensing community.
3.3.2 Fusion of feature pyramid
Although the feature pyramid module is constructed from the learned features in each layer, the different sizes and shapes of buildings make it difficult to effectively portray the features in a single layer. Therefore, we use a large convolutional map as a baseline, to retain more building details in the convolutional map. By integrating the features of the pyramids at each level, the network can achieve a balanced implementation of these features at each layer. More specifically, we first expand the scales of the feature maps at each pyramid level via upsampling (the gray operator shown in the middle-top of the Figure 6), to retain the feature maps structures as much as possible. Then, we concatenate all layers, as shown in the right-hand side of Figure 6. The final concatenated feature map is fed into a fully connected layer and activated by a softmax layer before being classified as roof, non-occluded façade, or background. A multi-class cross-entropy loss is used to train the network.
3.3.3 Implementation details
In this study, the training samples consisted of 6000 evenly sampled images for the roof, façade, and background. The sample images were resized to , the input size of the network. The dataset was randomly divided into training and testing sets in a ratio. A pre-trained ResNet network (He et al., 2016) from ImageNet was used. For the depth layer, the average of the three color channels was used in the first layers convolution kernel, and the remaining parameters were zero-initialized. A total of 50 epochs were set for training. The initial learning rate was 0.1, with a five-fold decay every ten epochs. The model with the optimum testing accuracy was used.
3.4 Multi-view voting strategy for building verification
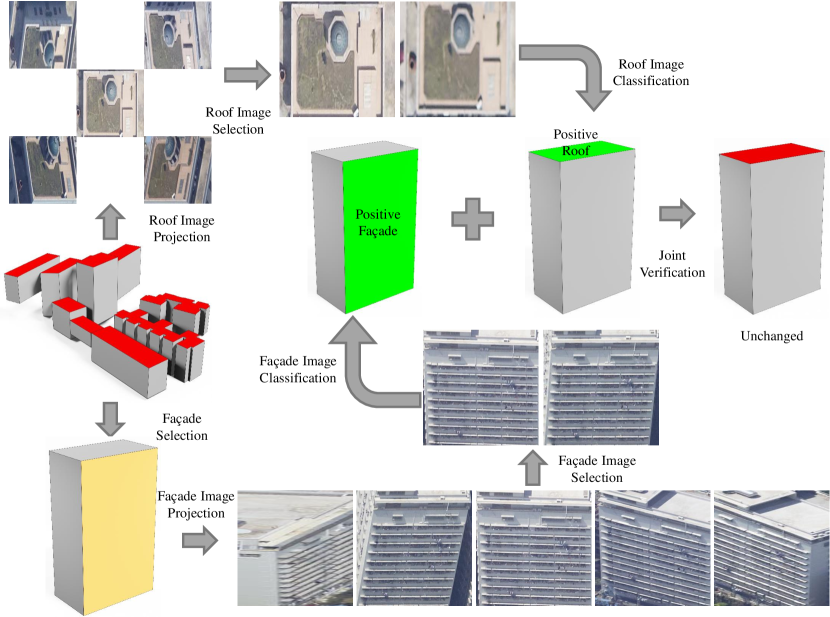
To improve the reliability of the overall building verification procedure, we designed a multi-view voting strategy for roofs and façades, using the multi-view visibility of buildings in oblique images. In Section 3.2.3, when obtaining building image patches, the heights and locations in the building footprint data were not sufficiently accurate, which can result in large deviations of the projection images. Therefore, to make the building verification process more robust, we constructed a building verification image set, by selecting images that are directly facing the building, e.g., the angle between the bore-sight of the camera and normal vector of the plane is small. Because the projection area from images with smaller angle difference (Figure 7) is often the largest, we used image-projection-area ranking to filter out off-center photographed building images, thus constituted the building verification image set.
The visible projected areas of the roofs in the images were typically square in the nadir view (as shown in the upper left-hand side of Figure 7) Thus, the well-projected central area roof images which should be the first (start from the center point by reducing the length and width by half, resulting in total count) of the projected area, are selected to constitute the verification set of the roof. The two larger façades of the same building were selected based on the non-occluded area; although more façades views are absolutely possible, this ensures that the necessary building structure is selected and avoids serious occlusions of the façades. The projected visible area of the façade in the image was typically a sector area from the oblique view (as shown in the lower right-hand side of Figure 7). Thus, the well-projected central area façade images which should be the first (start from the central view by reducing the angle to , resulting in total count) of the projected area, are selected to constitute the verification set of the façades. Then, the image candidate sets for the roof and façade were classified; if all images from both candidate sets were correctly classified, the original building was judged to be unchanged.
The objective of this strategy is to ensure that of the structures verified as buildings are indeed so; that is, we want to ensure that all changed buildings can be detected. Inevitably, some unchanged buildings will be judged as non-building structures; that is, a certain false-alarm rate is tolerable for non-building structures.
4 Experimental evaluation and analysis
The experimental evaluation and analysis is divided into five parts. The first part presents a basic overview of the experimental dataset. The second part presents and analyses the overall experimental results. In the third part, we select some typical ambiguous regions to evalute the specific utility of our three main contributions. Then, we compare the CNN network with different structures against the proposed fused feature pyramid (FFP) network with superimposed color and depth images. The final section discusses the applicability and limitations of the method.
4.1 Datasets specifications
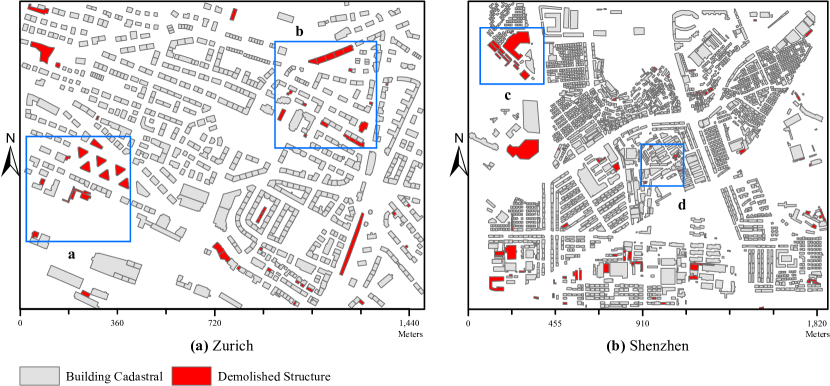
In this paper, two datasets are used for experimental verification: oblique image data of Zurich, collected in 2014 and compiled in the International Society for Photogrammetry and Remote Sensing Benchmark dataset(Cavegn et al., 2014); and oblique image data of Bantian District, Shenzhen, collected in 2016 by the Shenzhen Research Center of Digital City Engineering (SRCDCE). The experimental area of the Zurich dataset was approximately and contained a total of 817 buildings. The building footprint data, downloaded from OpenStreetMap (OpenStreetMap contributors, 2017), were used to verify the algorithms performance; these data include 54 wrongly labeled or demolished building structures, as shown in Figure 8(a). The experimental area of the Bantian District dataset was approximately and contained a total of 2,506 buildings. The census cadastral building data were collected in 2014; according to the SRCDCE, 114 structures had been demolished by 2016, as shown in Figure 8(b). More informations about oblique image dataset is listed in Table 1.
| Dataset | Zurich | Shenzhen |
|---|---|---|
| Area () | 0.74 | 2.52 |
| Buildings | 817 | 2506 |
| Maximum density () | 1104 | 1429 |
| Building source | OpenStreetMap | SRCDCE |
| Camera | Leica RCD30 | Phase One IQ180 |
| Ground Sample Distance () | 5-10 | 6-12 |
| Overlap (Flight/Side) | 70%/50% | 80%/60% |
| Flight Direction | East-West | North-South |
We used ContextCapture (Bentley, 2020) for aerial triangulation and mesh reconstruction assisted by ground control points provided by vendors of the datasets. We empirically verified the quality of the aerial triangulation information, by checking the alignment of the 2.5-D depth and color images; for which, no obvious misalignment are detected. We divided the whole regions into 59 and 143 grid tiles for Zurich and Shenzhen, respectively. Each tile requires approximately 2 hours to generate the mesh models. After projecting the building footprint data, corresponding training image datasets of oblique images were constructed for each experimental area. The actual demolished building areas are marked in red in Figure 8; these were checked manually as part of our evaluation methodology.
4.2 Experimental results
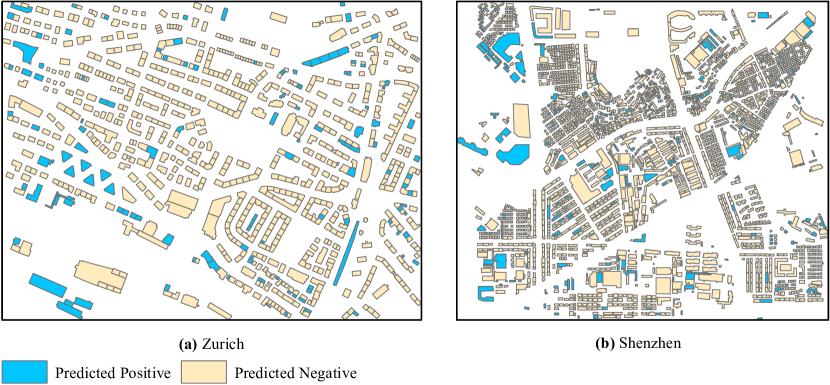
The building types in Zurich are more regularly and sparsely arranged than those in Shenzhen; this leads to differences in the quality of the oblique image projections, which in turn produces more variable disturbance in image identification. All the hyper-parameters for the FPN network are kept the same in this work. To render the features of the building verification images more prominent, we need to select the proper value for the multi-view verification strategy and thereby select the optimal projection quality for the building image. The numbers of selected façade image (Figure 7) are selected differently for the two datasets, according to the visibility of façade views. Shenzhen is featuring dense, high and occluded buildings, therefore only the best façade view is used; for Zurich, because the buildings are relatively lower and visibility better, two best views are used to improve robustness. An overview of the verified building footprint data obtained using the multi-view voting strategy for the Zurich and Shenzhen datasets is displayed in Figure 9.
Furthermore, to evaluate the performance of the proposed multi-view voting strategy, we compared the verification results from the nadir view (using only roof images) and oblique view (using only façade images). We used the general statistical metrics of TP (true positive), TN (true negative), FP (false positive) and FN (false negative) as quantitative indicators. Meanwhile, positive and negative samples refer to demolished and unchanged areas, respectively. To evaluate the results more intuitively, we chose two ratios as criteria: the correctness of positive () and negative () results. These are computed as:
| (2) |
We summarize these metrics and display them in Table 2.
| Dataset | Viewing angle | TP | TN | FP | FN | ||
|---|---|---|---|---|---|---|---|
| Zurich | Nadir view | 51 | 717 | 46 | 3 | 94.4% | 94.0% |
| Oblique view | 28 | 702 | 32 | 26 | 51.9% | 92.0% | |
| Multi-view | 54 | 691 | 72 | 0 | 100% | 90.6% | |
| Shenzhen | Nadir view | 62 | 2294 | 98 | 52 | 54.4% | 95.9% |
| Oblique view | 64 | 2323 | 69 | 50 | 56.1% | 97.0% | |
| Multi-view | 114 | 2231 | 161 | 0 | 100% | 93.2% |
The results indicate that in the Zurich experimental area, because of the uniformity of type and regular roof structures, most buildings could be verified from the nadir view (using only roof images). When combined with the results of the oblique view verification, we could verify several demolished buildings that were only detectable from the oblique view. In the Shenzhen experimental area, the roof structures were complex, heavily covered by vegetation, and exhibited large differences in material; thus, it was difficult to comprehensively detect demolished buildings using roof inspection alone. Meanwhile, this area featured extremely high building densities (e.g., approximately 1430 buildings/ in some places) and considerable height differences between buildings; as a result, the façade occlusion is so serious that some buildings are completely occluded. In façade detection, the optimal building façade projection image should be selected for building verification. When verifying building demolition, the results of the façade verification can complement the results of the roof verification, whilst also improving the reliability of the overall verification. However, it is inevitable that the relative rates of false detection for unchanged buildings increases with the integration of the roof and façade verification results. Therefore, it can be seen in Table 2 that the correctness of the verification results for unchanged buildings in the multi-view strategy is lower than nadir view or oblique view.
4.3 Experimental analyses
In this section, we select some typical regions of ambiguity to evaluate the specific utility of our three main contributions.
4.3.1 Effects of depth information
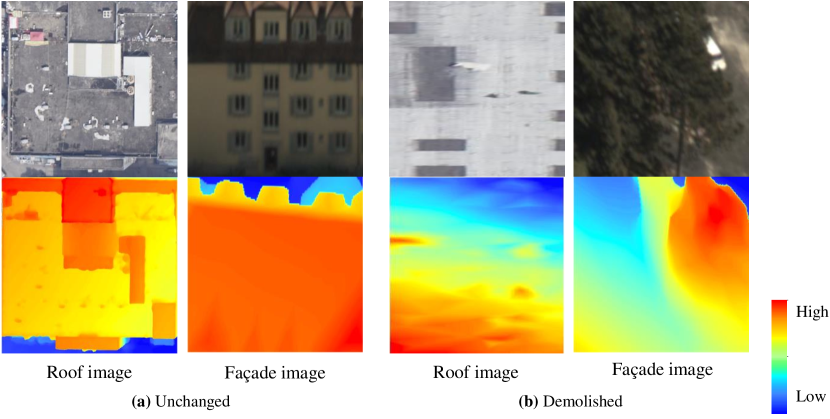
To interpret the characteristic differences between color images and depth images for the roof and façade areas in buildings and non-buildings, Figure 10 depicts some typical patches. The roof regions are fairly similar to the demolished remains seen from the nadir perspective, which makes it difficult to distinguish them using the traditional image feature descriptor. However, the depth image of the roof is more regular, whilst the distribution of depth information for non-building areas is more random. Meanwhile, comparing the façade images, we find that by performing occlusion detection of the depth information, we can filter out images with complete information for the façade in the non-occlusion condition. Therefore, we infer that depth information can provide a more effective basis for building classification.
4.3.2 Effects of FFP module
Analyzing the images of roofs in the Shenzhen area, we can see that they are well extracted and identified from large sizes () down to small ones (). We divided the building area size into three intervals: below , between and , and above . Dividing buildings in this way ensures that the number of buildings in each interval is evenly distributed. We counted the correctly verified building at each interval and calculated the correctness. In the Zurich area, the correctnesses are 92.00% for building size below , 93.74% between and and 95.65% above . In the Shenzhen area, the correctnesses are 94.15% for building size below , 97.03% between and and 95.96% above . It could be noted that the correctness is almost not influenced by the sizes of buildings, thanks to the FFP module.
4.3.3 Effects of multi-view voting
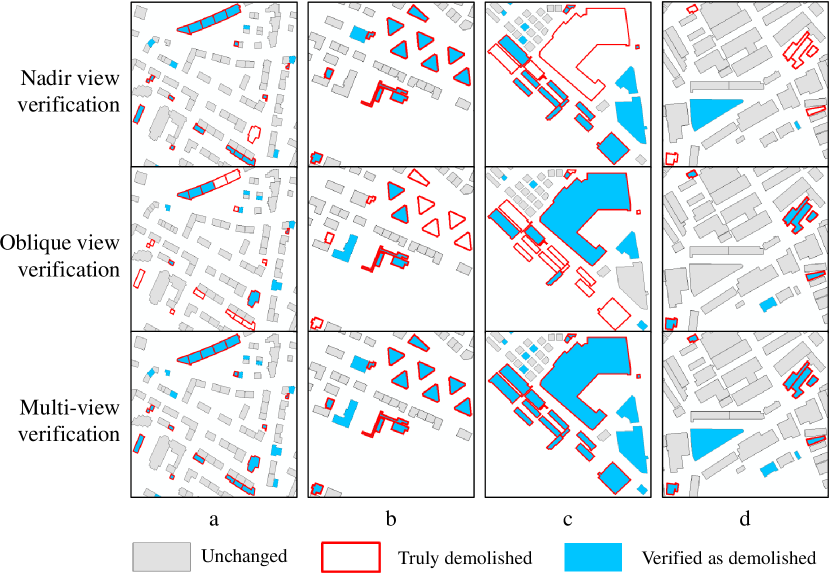
We selected two typical areas from each of the two study regions, to illustrate the effects of multi-view voting; these are marked by the blue rectangles in Figure 8. We compared the results verified using three different strategies: the nadir-view strategy (using only roof images), the oblique-view strategy (using only façade images), and the multi-view strategy (using both roof and façade images). As shown in Figure 11, the large ambiguities observed from the single viewpoint meant that some demolished building could only be correctly determined using 3D verification, and using only nadir or oblique views tended to cause some kind of error. We conclude that the multi-view verification strategy can achieve credible results.
4.4 Ablation studies
To further evaluate the effects of depth data and the FFP network, we conducted ablation studies using the two datasets. First, the FFP module was compared against the well-established ResNet (He et al., 2016) and the state-of-the-art EfficientNet (Tan and Le, 2019) models. Second, for each architecture, we compared the network with and without the depth data. From Table 3, we conclude that the accuracy of each category in the FFP network is improved by more than compared to ResNet and more than compared to EfficientNet. Adding the depth convolutional channel leads to an accuracy improvement of more than for each type of network. Therefore, the FFP network that integrates multi-scale feature pyramids with color and depth information is superior in classifying multi-size roofs and façades.
| Dataset | Network | Roof | Façade | ||
|---|---|---|---|---|---|
| Accu.(%) | Recall(%) | Accu.(%) | Recall(%) | ||
| Zurich | FFP color+depth | 97.2 | 98.1 | 94.3 | 95.0 |
| FFP color | -0.9 | -0.5 | -1.1 | -0.2 | |
| EfficientNet-B0 color+depth | -0.4 | -1.5 | -1.6 | -2.2 | |
| EfficientNet-B0 color | -2.9 | -2.5 | -3.5 | -4.7 | |
| ResNet-34 color+depth | -5.0 | -5.7 | -5.0 | -5.5 | |
| ResNet-34 color | -5.9 | -6.3 | -6.5 | -6.7 | |
| Shenzhen | FFP color+depth | 95.4 | 96.5 | 94.4 | 94.9 |
| FFP color | -2.2 | -3.1 | -1.0 | -1.9 | |
| EfficientNet-B0 color+depth | -0.5 | -0.4 | -1.7 | -3.1 | |
| EfficientNet-B0 color | -3.9 | -4.0 | -2.6 | -4.6 | |
| ResNet-34 color+depth | -5.0 | -6.5 | -4.4 | -4.7 | |
| ResNet-34 color | -7.0 | -8.9 | -6.2 | -6.7 | |
4.5 Discussion
Based on the above evaluations of the FFP networks building verification abilities, we now discuss several characteristics and limitations of the proposed method.
1) Use of depth data. Existing oblique-image-based building verification methods do not take full advantage of the 3D information available in oblique images, e.g., the mesh models from the SFM (Schönberger and Frahm, 2016; Hu et al., 2016b) and MVS (Vu et al., 2011; Hu et al., 2016a) pipelines. In this study, we fuse depth images with color images, to incorporate 3D depth information with 2D images in an occlusion-aware verification method. The depth data eliminate the problems encountered in ambiguous texture regions.
2) Robustness of FFP and multi-view voting. The aim of the proposed method is to detect all changed buildings whilst maintaining a reasonably low false-alarm rate. This requires the proposed method to be robust in different scenarios, and many redundancy checks are required. This objective is achieved through the feature pyramid module and multi-view voting strategy, which uses the multi-view capabilities of oblique aerial images.
3) Limitations. As a supervised approach, manual work is still required for labeling roofs and façades. Furthermore, this method can only verify existing building data; it cannot detect new buildings from the oblique images.
5 Conclusions
This paper proposes a multi-view voting strategy for oblique-image-based building verification using a depth-enhanced fused feature pyramid CNN. We render the mesh model into the oblique image viewpoint, to obtain depth images. Then, we combine the depth image and color image, to perform building verification using the fused FPN. The fused multi-sized feature pyramid structure improves the accuracy of building-image classification. The multi-view voting strategy also improves the building verification models performance. Future work may be devoted to building-change detection, not only for identifying demolished structures but also for discovering newly constructed ones. To make the system robust, multi-view voting from oblique images and depth information from photogrammetric mesh models are probably still useful to improve the robustness.
Acknowledgments
This work was supported in part by the National Natural Science Foundation of China (Projects No.: 41631174, 42071355, 41871291) and in part by the National Key Research and Development Program of China (Project No. 2018YFC0825803). In addition, the authors gratefully acknowledge the ISPRS/EuroSDR Project and the German Society for Photogrammetry, Remote Sensing, and Geoinformation for providing the Zurich dataset (Cavegn et al., 2014).
References
- Abdessetar and Zhong (2017) Abdessetar, M., Zhong, Y., 2017. Buildings change detection based on shape matching for multi-resolution remote sensing imagery. International Archives of the Photogrammetry, Remote Sensing & Spatial Information Sciences 42.
- Alshehhi et al. (2017) Alshehhi, R., Marpu, P.R., Woon, W.L., Dalla Mura, M., 2017. Simultaneous extraction of roads and buildings in remote sensing imagery with convolutional neural networks. ISPRS Journal of Photogrammetry and Remote Sensing 130, 139–149.
- Bentley (2019) Bentley, 2019. Contextcapture camera model. https://docs.bentley.com/LiveContent/web/ContextCapture%20Help-v10/en/GUID-2D452A8A-A4FE-450D-A0CA-9336DCF1238A.html.
- Bentley (2020) Bentley, 2020. Contextcapture. https://www.bentley.com/en/products/brands/contextcapture.
- Bertinetto et al. (2016) Bertinetto, L., Valmadre, J., Henriques, J.F., Vedaldi, A., Torr, P.H., 2016. Fully-convolutional siamese networks for object tracking, in: European conference on computer vision, Springer. pp. 850–865.
- Bromley et al. (1994) Bromley, J., Guyon, I., LeCun, Y., Säckinger, E., Shah, R., 1994. Signature verification using a “siamese” time delay neural network, in: Advances in neural information processing systems, pp. 737–744.
- Cavegn et al. (2014) Cavegn, S., Haala, N., Nebiker, S., Rothermel, M., Tutzauer, P., 2014. Benchmarking high density image matching for oblique airborne imagery. International Archives of the Photogrammetry, Remote Sensing & Spatial Information Sciences .
- Chen et al. (2017) Chen, C., Gong, W., Hu, Y., Chen, Y., Ding, Y., 2017. Learning oriented region-based convolutional neural networks for building detection in satellite remote sensing images. The International Archives of Photogrammetry, Remote Sensing and Spatial Information Sciences 42, 461.
- Chen et al. (2018) Chen, Y., Wang, Z., Peng, Y., Zhang, Z., Yu, G., Sun, J., 2018. Cascaded pyramid network for multi-person pose estimation, in: Proceedings of the IEEE Conference on Computer Vision and Pattern Recognition, pp. 7103–7112.
- Deng et al. (2008) Deng, J., Wang, K., Deng, Y., Qi, G., 2008. Pca-based land-use change detection and analysis using multitemporal and multisensor satellite data. International Journal of Remote Sensing 29, 4823–4838.
- Fan et al. (2014) Fan, H., Zipf, A., Fu, Q., Neis, P., 2014. Quality assessment for building footprints data on openstreetmap. International Journal of Geographical Information Science 28, 700–719.
- Frommholz et al. (2015) Frommholz, D., Linkiewicz, M., Meißner, H., Dahlke, D., Poznanska, A.M., 2015. Extracting semantically annotated 3d building models with textures from oblique aerial imagery. The International Archives of the Photogrammetry, Remote Sensing and Spatial Information Sciences, Volume XL-3/W2, 2015 , 53–58.
- Girshick (2015) Girshick, R., 2015. Fast r-cnn, in: Proceedings of the IEEE international conference on computer vision, pp. 1440–1448.
- GLM (2019) GLM, 2019. Opengl mathematics. https://glm.g-truc.net/.
- Hanocka et al. (2019) Hanocka, R., Hertz, A., Fish, N., Giryes, R., Fleishman, S., Cohen-Or, D., 2019. Meshcnn: a network with an edge. ACM Transactions on Graphics (TOG) 38, 1–12.
- He et al. (2017) He, K., Gkioxari, G., Dollár, P., Girshick, R., 2017. Mask r-cnn, in: Proceedings of the IEEE international conference on computer vision, pp. 2961–2969.
- He et al. (2015) He, K., Zhang, X., Ren, S., Sun, J., 2015. Spatial pyramid pooling in deep convolutional networks for visual recognition. IEEE transactions on pattern analysis and machine intelligence 37, 1904–1916.
- He et al. (2016) He, K., Zhang, X., Ren, S., Sun, J., 2016. Deep residual learning for image recognition, in: Proceedings of the IEEE conference on computer vision and pattern recognition, pp. 770–778.
- Hirschmuller (2005) Hirschmuller, H., 2005. Accurate and efficient stereo processing by semi-global matching and mutual information, in: 2005 IEEE Computer Society Conference on Computer Vision and Pattern Recognition (CVPR’05), IEEE. pp. 807–814.
- Hong et al. (2019) Hong, D., Yokoya, N., Ge, N., Chanussot, J., Zhu, X.X., 2019. Learnable manifold alignment (lema): A semi-supervised cross-modality learning framework for land cover and land use classification. ISPRS journal of photogrammetry and remote sensing 147, 193–205.
- Hu et al. (2016a) Hu, H., Chen, C., Wu, B., Yang, X., Zhu, Q., Ding, Y., 2016a. Texture-aware dense image matching using ternary census transform. ISPRS annals of the photogrammetry, remote sensing and spatial information sciences .
- Hu et al. (2014) Hu, H., Ding, Y., Zhu, Q., Wu, B., Lin, H., Du, Z., Zhang, Y., Zhang, Y., 2014. An adaptive surface filter for airborne laser scanning point clouds by means of regularization and bending energy. ISPRS Journal of Photogrammetry and Remote Sensing 92, 98–111.
- Hu et al. (2016b) Hu, H., Ding, Y., Zhu, Q., Wu, B., Xie, L., Chen, M., 2016b. Stable least-squares matching for oblique images using bound constrained optimization and a robust loss function. ISPRS journal of photogrammetry and remote sensing 118, 53–67.
- Hu and Wu (2017) Hu, H., Wu, B., 2017. Bound-constrained multiple-image least-squares matching for multiple-resolution images. Photogrammetric Engineering & Remote Sensing 83, 667–677.
- Huang et al. (2016) Huang, Z., Cheng, G., Wang, H., Li, H., Shi, L., Pan, C., 2016. Building extraction from multi-source remote sensing images via deep deconvolution neural networks, in: 2016 IEEE International Geoscience and Remote Sensing Symposium (IGARSS), Ieee. pp. 1835–1838.
- Hussain et al. (2013) Hussain, M., Chen, D., Cheng, A., Wei, H., Stanley, D., 2013. Change detection from remotely sensed images: From pixel-based to object-based approaches. ISPRS Journal of photogrammetry and remote sensing 80, 91–106.
- Ioffe and Szegedy (2015) Ioffe, S., Szegedy, C., 2015. Batch normalization: Accelerating deep network training by reducing internal covariate shift. arXiv preprint arXiv:1502.03167 .
- Javed et al. (2020) Javed, A., Jung, S., Lee, W.H., Han, Y., 2020. Object-Based Building Change Detection by Fusing Pixel-Level Change Detection Results Generated from Morphological Building Index. Remote Sensing 12, 2952.
- Ji et al. (2019) Ji, S., Shen, Y., Lu, M., Zhang, Y., 2019. Building instance change detection from large-scale aerial images using convolutional neural networks and simulated samples. Remote Sensing 11, 1343.
- Konstantinidis et al. (2016) Konstantinidis, D., Stathaki, T., Argyriou, V., Grammalidis, N., 2016. Building detection using enhanced hog–lbp features and region refinement processes. IEEE Journal of Selected topics in applied Earth observations and Remote Sensing 10, 888–905.
- Krizhevsky et al. (2012) Krizhevsky, A., Sutskever, I., Hinton, G.E., 2012. Imagenet classification with deep convolutional neural networks, in: Advances in neural information processing systems, pp. 1097–1105.
- Lin et al. (2017) Lin, T.Y., Dollár, P., Girshick, R., He, K., Hariharan, B., Belongie, S., 2017. Feature pyramid networks for object detection, in: Proceedings of the IEEE conference on computer vision and pattern recognition, pp. 2117–2125.
- Long et al. (2015) Long, J., Shelhamer, E., Darrell, T., 2015. Fully convolutional networks for semantic segmentation, in: Proceedings of the IEEE conference on computer vision and pattern recognition, pp. 3431–3440.
- Nyaruhuma et al. (2010) Nyaruhuma, A.P., Gerke, M., Vosselman, G., 2010. Evidence of walls in oblique images for automatic verification of buildings. International Archives of Photogrammetry, Remote Sensing and Spatial Information Sciences 38, 263–268.
- Nyaruhuma et al. (2012) Nyaruhuma, A.P., Gerke, M., Vosselman, G., Mtalo, E.G., 2012. Verification of 2d building outlines using oblique airborne images. ISPRS journal of photogrammetry and remote sensing 71, 62–75.
- OpenStreetMap contributors (2017) OpenStreetMap contributors, 2017. Planet dump retrieved from https://planet.osm.org . https://www.openstreetmap.org.
- Osfield and Burns (2014) Osfield, R., Burns, D., 2014. Open scene graph. http://www.openscenegraph.org.
- Petrie (2009) Petrie, G., 2009. Systematic oblique aerial photography using multiple digital cameras. Photogrammetric Engineering & Remote Sensing 75, 102–107.
- Qi et al. (2017) Qi, C.R., Yi, L., Su, H., Guibas, L.J., 2017. Pointnet++: Deep hierarchical feature learning on point sets in a metric space, in: Advances in neural information processing systems, pp. 5099–5108.
- Qin (2014) Qin, R., 2014. Change detection on lod 2 building models with very high resolution spaceborne stereo imagery. ISPRS journal of photogrammetry and remote sensing 96, 179–192.
- Remondino and Gerke (2015) Remondino, F., Gerke, M., 2015. Oblique aerial imagery–a review, in: Photogrammetric week, pp. 75–81.
- Remondino et al. (2013) Remondino, F., Spera, M.G., Nocerino, E., Menna, F., Nex, F., Gonizzi-Barsanti, S., 2013. Dense image matching: comparisons and analyses, in: 2013 Digital Heritage International Congress (DigitalHeritage), IEEE. pp. 47–54.
- Ronneberger et al. (2015) Ronneberger, O., Fischer, P., Brox, T., 2015. U-net: Convolutional networks for biomedical image segmentation, in: International Conference on Medical image computing and computer-assisted intervention, Springer. pp. 234–241.
- Rottensteiner (2007) Rottensteiner, F., 2007. Building change detection from digital surface models and multi-spectral images. International Archives of the Photogrammetry, Remote Sensing and Spatial Information Sciences (IAPRS) 36, 145–150.
- Schönberger and Frahm (2016) Schönberger, J.L., Frahm, J.M., 2016. Structure-from-motion revisited, in: Conference on Computer Vision and Pattern Recognition (CVPR).
- Shojaei et al. (2013) Shojaei, D., Kalantari, M., Bishop, I.D., Rajabifard, A., Aien, A., 2013. Visualization requirements for 3d cadastral systems. Computers, Environment and Urban Systems 41, 39–54.
- Sidike et al. (2016) Sidike, P., Prince, D., Essa, A., Asari, V.K., 2016. Automatic building change detection through adaptive local textural features and sequential background removal, in: 2016 IEEE International Geoscience and Remote Sensing Symposium (IGARSS), IEEE. pp. 2857–2860.
- Simonyan and Zisserman (2014) Simonyan, K., Zisserman, A., 2014. Very deep convolutional networks for large-scale image recognition. arXiv preprint arXiv:1409.1556 .
- Singh et al. (2012) Singh, D., Maurya, R., Shukla, A.S., Sharma, M.K., Gupta, P., 2012. Building extraction from very high resolution multispectral images using ndvi based segmentation and morphological operators, in: 2012 Students Conference on Engineering and Systems, IEEE. pp. 1–5.
- Sofina and Ehlers (2016) Sofina, N., Ehlers, M., 2016. Building change detection using high resolution remotely sensed data and gis. IEEE Journal of Selected Topics in Applied Earth Observations and Remote Sensing 9, 3430–3438.
- Tan and Le (2019) Tan, M., Le, Q.V., 2019. Efficientnet: Rethinking model scaling for convolutional neural networks. arXiv preprint arXiv:1905.11946 .
- Tan et al. (2020) Tan, M., Pang, R., Le, Q.V., 2020. Efficientdet: Scalable and efficient object detection, in: Proceedings of the IEEE/CVF Conference on Computer Vision and Pattern Recognition, pp. 10781–10790.
- Vu et al. (2011) Vu, H.H., Labatut, P., Pons, J.P., Keriven, R., 2011. High accuracy and visibility-consistent dense multiview stereo. IEEE transactions on pattern analysis and machine intelligence 34, 889–901.
- Xiao and Gerke (2015) Xiao, J., Gerke, M., 2015. Building footprint extraction based on radiometric and geometric constraints in airborne oblique images. International journal of image and data fusion 6, 270–287.
- Xiao et al. (2012) Xiao, J., Gerke, M., Vosselman, G., 2012. Building extraction from oblique airborne imagery based on robust façade detection. ISPRS journal of photogrammetry and remote sensing 68, 56–68.
- Xie et al. (2016) Xie, L., Hu, H., Wang, J., Zhu, Q., Chen, M., 2016. An asymmetric re-weighting method for the precision combined bundle adjustment of aerial oblique images. ISPRS Journal of Photogrammetry and Remote Sensing 117, 92–107.
- Yang et al. (2015) Yang, X., Qin, X., Wang, J., Wang, J., Ye, X., Qin, Q., 2015. Building façade recognition using oblique aerial images. Remote Sensing 7, 10562–10588.
- Zhan et al. (2017) Zhan, Y., Fu, K., Yan, M., Sun, X., Wang, H., Qiu, X., 2017. Change detection based on deep siamese convolutional network for optical aerial images. IEEE Geoscience and Remote Sensing Letters 14, 1845–1849.
- Zhang et al. (2017) Zhang, A., Liu, X., Gros, A., Tiecke, T., 2017. Building detection from satellite images on a global scale. arXiv preprint arXiv:1707.08952 .
- Zhang et al. (2018) Zhang, Z., Vosselman, G., Gerke, M., Tuia, D., Yang, M.Y., 2018. Change detection between multimodal remote sensing data using siamese cnn. arXiv preprint arXiv:1807.09562 .
- Zhou et al. (2020) Zhou, K., Lindenbergh, R., Gorte, B., Zlatanova, S., 2020. Lidar-guided dense matching for detecting changes and updating of buildings in airborne lidar data. ISPRS Journal of Photogrammetry and Remote Sensing 162, 200–213.
- Zhu et al. (2020a) Zhu, Q., Chen, L., Hu, H., Pirasteh, S., Li, H., Xie, X., 2020a. Unsupervised feature learning to improve transferability of landslide susceptibility representations. IEEE Journal of Selected Topics in Applied Earth Observations and Remote Sensing 13, 3917–3930.
- Zhu et al. (2020b) Zhu, Q., Wang, Z., Hu, H., Xie, L., Ge, X., Zhang, Y., 2020b. Leveraging photogrammetric mesh models for aerial-ground feature point matching toward integrated 3d reconstruction. ISPRS Journal of Photogrammetry and Remote Sensing 166, 26–40.
- Zhu et al. (2020c) Zhu, Q., Zhang, M., Hu, H., Wang, F., 2020c. Interactive correction of a distorted street-view panorama for efficient 3-d façade modeling. IEEE Geoscience and Remote Sensing Letters .