Stick-slip phenomena and Schallamach waves captured using reversible cohesive elements
Abstract
Reversibility is of paramount importance in the correct representation of surface peeling in various physical settings, ranging from motility in nature, to gripping devices in robotic applications, and even to sliding of tectonic plates. Modeling the detachment-reattachment sequence, known as stick-slip, imposes several challenges in a continuum framework. Here we exploit customized reversible cohesive elements in a hybrid finite element model that can handle occurrence of snap-through instabilities. The simulations capture various peeling phenomena that emerge in experimental observations, where layers are pulled from a flat, rigid substrate in the direction parallel to the surface. For long layers, periodicity in reattachment is shown to develop and is linked to the concept of Schallamach waves. Further, the connection between surface properties and stick-slip behavior is investigated: we find that stick-slip is linked to the propensity of the interface to localize deformation and damage. Beyond elucidating the various peeling behaviors and the detachment modes, the computational framework developed here provides a straightforward approach for investigation of complex delamination processes, which can guide the development of future applications across different scales and in various settings.
Keywords: Finite Element Method, Cohesive Elements, Stick-Slip, Schallamach Waves, Soft Adhesives, Peeling
1 Introduction
Failure of bonded interfaces is ubiquitous at different scales and in various settings. While, in the mundane, failure of an adhesive layer is a common nuisance, in advanced engineering applications, controlling this failure can lead to desired functionalities and novel fabrication methods. Several such applications are inspired by the superior performance of adhesive interfaces that are used for locomotion in the animal kingdom, with examples ranging from the scale of a single cell, to insects and lizards (Gerde and Marder, 2001; Ronsin et al., 2011; Zhou et al., 2013). At even larger scales, relative motion between tectonic plates, and the resulting seismic waves, are also triggered by interfacial failure (Galeano et al., 2000; Uenishi and Rice, 2003; Ronsin et al., 2011). In certain instances, depending on the nature of the bonding interaction and the loading state, local re-bonding can occur if the two faces of the interface come back into contact, before complete failure. Such reversible bonding may emerge, for example, due to interlocking of asperities on rough surfaces, or by molecular interactions, such as van der Waals forces, and can significantly alter the observed phenomena (Nosonovsky and Bhushan, 2007)111Note that among several mechanisms that contribute to friction (Nosonovsky and Bhushan, 2007), such as plastic deformation at the interface and wear or contamination particles between the surfaces, we restrict our attention in this work to reversible mechanisms..
Reversibility is a desired feature in robotics applications, where the exceptional load bearing capacities of modern adhesive layers that do not damage the climbing surface (Sahay et al., 2015; Li et al., 2016; Dharmawan et al., 2019), has facilitated the development of inspection devices for dangerous environments (Menon et al., 2004; Dharmawan et al., 2019), and of high-precision soft adhesive grippers that allow manipulation of fragile objects without leaving residue (Shintake et al., 2018; Lee et al., 2019; Hsiao et al., 2019; Zhang and Lu, 2020); which is a particularly useful functionality for minimally invasive surgery (Hammond et al., 2014; Rateni et al., 2015). Such high-load bearing capacities with unlimited cycles of detachment and reattachment, at high speeds, and without damaging even on rough surfaces have been repeatedly observed in nature. Several competing theories have been proposed to delineate the various characteristics of natural adhesives that allow them to exhibit such unrivaled reversibility. The role of hierarchical fibrillar structures that are observed in several species has been proposed as a possible explanation (Geim et al., 2003; Autumn et al., 2006; Cheng et al., 2012; Gu et al., 2016; Brodoceanu et al., 2016; Li et al., 2016; O’Rorke et al., 2016; Eisenhaure and Kim, 2017). However, it has been shown that the high load bearing capabilities observed across species (Labonte et al., 2016) can be matched without hierarchical features, by tuning the in-plane compliance of the layer (Bartlett et al., 2012). This was achieved with adhesive systems composed of a soft adhesive layer with a stiff backing (Jagota and Hui, 2011; Risan et al., 2015; Liu et al., 2019). In this work we focus our attention to such bi-layer systems.
A recent study has shown that bi-layer adhesives can exhibit various distinct failure modes, including the formation of an interfacial cavity near the pulling end, or the propagation of a peeling front from the opposite end, which is referred to as curling, as it is associated with bending deformation of the far region (Cohen et al., 2018). Experimental observations show that this curling mode spontaneously leads to complete failure, while additional pulling is required to arrive at complete failure after the first formation of an interfacial cavity. A theoretical model that accounts for finite stiffness of the adhesive bond explains the onset of different failure modes. However, it was unable to capture the propagation of failure nor to determine the load bearing capacity. In this work we consider a similar problem setting to study the response of bi-layer adhesives to pulling along the direction of the substrate, as in a zero-degree peeling test. In this configuration, the layer may be more prone to reattachment, which can have a significant influence on the final failure mode and the load bearing capacity222It should be noted that studies on single-layer adhesives subjected to similar loading conditions (Ponce et al., 2015; Mojdehi et al., 2017b, a) show a different failure response. This is explained by the effect of the stiffer backing on the distribution of the shear deformation, also referred to as ‘shear lag’..
While full control of the delamination process of soft adhesives is essential in robotics applications and has been observed in nature, successive de-bonding and re-bonding can occur spontaneously within regions of a loaded interface. Such phenomena have been referred to as stick-slip events (Brace and Byerlee, 1966), Schallamach waves (Schallamach, 1971), and self-healing pulses or Heaton waves (Heaton, 1990), and have long been established as a prominent mechanism in earthquakes (Galeano et al., 2000; Uenishi and Rice, 2003; Ronsin et al., 2011). The driving mechanism is similar for both the formation of Schallamach waves in soft materials (Schallamach, 1971; Gabriel et al., 2010) and slip pulses in geologic faults (Cochard and Rice, 2000): local buckling caused by tension-compression fields drives the formation and propagation.
The apparent analogies between stick-slip processes in tectonic plate movement, and debonding of soft adhesive layers, have motivated several studies that consider the latter as a desktop scale representation of the former (Galeano et al., 2000; Ronsin et al., 2011; Wang and Tréhu, 2016). For example, waves that emerge during sliding contact between a hard indentor and a soft substrate have been considered in several experimental and theoretical studies (Lin and Hui, 2002; Barthel and Haiat, 2002; Rand and Crosby, 2006; Nakano and Maegawa, 2009; Gabriel et al., 2010; Fukahori et al., 2010; Maegawa and Nakano, 2010; Das et al., 2013; Cortet et al., 2013; Mishra et al., 2015; Viswanathan et al., 2016a, b; Maegawa et al., 2016; Schapery, 2020). Finite element models used in these studies describe the development of the detachment and the formation of the first Schallamach wave, but they do not include reattachment. Recently, continuum models including friction-adhesion contact coupling have been proposed to treat this challenge (Cocou et al., 2010; Raous, 2011; Sauer, 2016; Mergel et al., 2019; Khajeh Salehani et al., 2019) and have even been applied to sliding processes (Mergel et al., 2021). Despite the recent advances, literature on theoretical models that can capture the entire, unsteady, process of delamination, in presence of stick-slip events, is in a nascent state. Addressing this limitation may thus provide additional insights into various phenomena and may even help to explain why adhesion based motility exhibited in nature has yet to be matched by its synthetic counterparts.
Capturing the propagation of failure from its initiation to complete detachment in a theoretical model is especially challenging when considering zero-degree loading. This complexity is primarily due to the limited available computational tools that can account for the layers ability to re-attach, at a new location, if it comes back into contact with the substrate. Nonetheless, experimental evidence of this phenomenon has been repeatedly reported (Amouroux et al., 2001; Baumberger et al., 2002; Cortet et al., 2007; Collino et al., 2014; Ponce et al., 2015; Cohen et al., 2018; Zhu et al., 2019; Zotti et al., 2019), and can occur even when pulling at a prescribed angle (Collino et al., 2014; Dalbe et al., 2015). The stick-slip behavior is also evident from the force-displacement curves that show sudden drops in the load followed by recovery in controlled pulling tests (Ponce et al., 2015; Cohen et al., 2018).
To the best of our knowledge, to date, no theoretical model has provided a comprehensive account of the various phenomena that emerge when reattachment of an adhesive interface is possible, as observed in zero-degree peeling of bi-layer adhesives. Understanding the range of model parameters for which such phenomena occur and their influence on the global behavior of the adhesive pad, can pave the way to engineering of advanced adhesive systems, and can elucidate phenomena observed in the natural world at various scales.
In a finite element framework, cohesive elements are a natural choice for representing interfacial forces that are weaker than the bonds in the bulk of the material, where the failure is localized to the interface. Other than capturing fracture phenomena in stiff or brittle materials, such as metals and concrete (Pandolfi et al., 2000; de Borst, 2002), cohesive elements are commonly used for modeling soft adhesives (Rahulkumar et al., 2000; Wei, 2004; Zhang and Wang, 2009). However, most cohesive laws do not include healing or reattachment. Continuum damage models have been proposed to model healing by allowing broken elements to reverse damage and have been successfully implemented in finite element analysis using discrete element methods and mesh-free methods (Oucif and Mauludin, 2018; Javierre, 2019). To determine the healing kinetics, recent studies have included, for example, chemo-mechanical coupling (Ozaki et al., 2016; Sanz-Herrera et al., 2019; Jefferson, Anthony et al., 2019; Roldán et al., 2019), thermodynamic healing (Alsheghri and Al-Rub, 2015, 2016) and biological factors (He et al., 2019). However, this approach is not well adapted to capture interfacial phenomena considered here.
The objective of this work, is to capture reversible interfacial peeling phenomena that may emerge in various delamination processes, including instability and stick-slip events. Hence, in this study, we propose a modification to the classical cohesive law by Ortiz and Pandolfi (1999), to allow full recovery of a cohesive bond upon contact of the two sides of the interface. We will apply this modified cohesive law to study peeling phenomena in elastic bi-layer adhesives that are capable of large deformations, as they are pulled along the direction of the substrate.
This manuscript is organized as follows: the next section describes the physical problem setting with all relevant model parameters, and provides an overview of various physical phenomena that emerge in experimental observations of this system. Modeling of the interface response is documented in Section 3. The specialized finite element algorithm developed to capture the peeling response is detailed in Section 4. Next, Section 5 presents the simulation results and their discussion, showing agreement with our experimental observations. We further extend the analysis to capture the response of infinitely long layers and to elucidate the constitutive sensitivities. Finally, concluding remarks are given in Section 6.
2 Problem setting and observations of peeling response
Consider an elastic bi-layer composed of an adhesive layer of length and thickness that is perfectly attached to a stiffer backing of thickness and placed on a smooth, infinitely stiff substrate, as illustrated in Figure 4. Restricting our attention to plane-strain deformation, we define the Lagrangian coordinates such that the bi-layer adhesive occupies the region
| (1) |
A horizontal displacement, , is applied to the backing at - henceforth referred to as the pulling end, and is associated with a resultant force (per unit length).
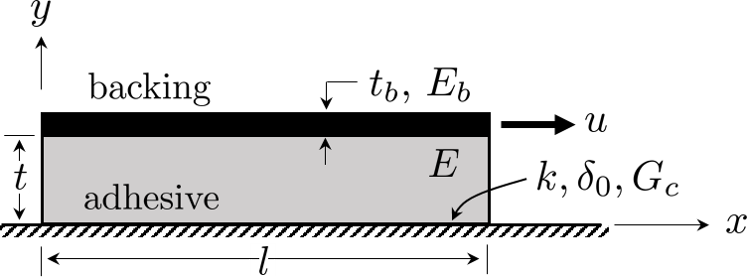
We assume that both the adhesive layer and the backing of this bi-layer system are incompressible and capable of large elastic deformations that are well described by the neo-Hookean hyperelastic model. Their strain energy density can thus be written in terms of a single constitutive parameter, the elastic modulus , in the form where is the first invariant of the right Cauchy-Green deformation tensor. We denote the distinct elastic moduli of the adhesive layer and the backing by and , respectively.
Before defining the properties of the interface, it is instructive to examine, in more detail, the different modes of failure that may emerge in this system. Hence, we conduct a series of observations that we describe next. We emphasize that while earlier studies have provided a more comprehensive experimental investigation of the considered bi-layer system (Cohen et al., 2018), we provide these observations here as visual context: for choice of a specific cohesive law; for qualitative comparison; and for clarification of numerical results555We emphasise that these observations are not intended as a comprehensive experimental investigation..
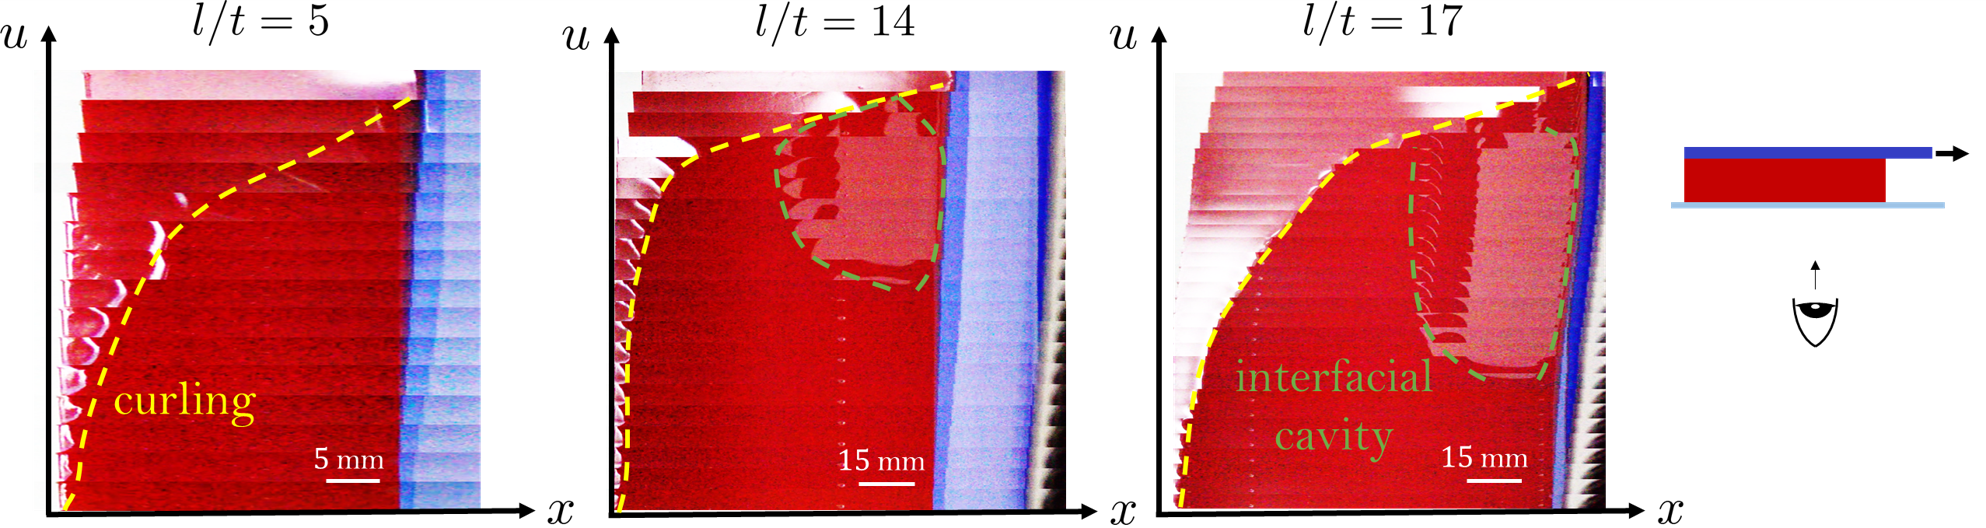
The different modes of failure and the possible influence of re-bonding is demonstrated by three observations in Figure 2. For all cases we use Polydimethylsiloxane (PDMS) to fabricate both the backing and the adhesive layer with thicknesses mm and mm, and with elastic moduli MPa, and MPa, respectively. A pigment is used to distinguish between the adhesive (red) and the backing (blue). The only difference between the three bi-layer systems is their length, as shown by the different values of . Observations are made by looking through the glass substrate as the backing is pulled using a mechanical testing machine. Additional details on the fabrication process and testing can be found in Appendix A. Videos of the peeling are provided in the supplementary material.
First, for the shortest layer , we observe that peeling initiates from the far end (i.e ) and propagates towards the pulling end, up to complete failure. In comparison with the pulling rate, which is effectively shown by the slope of the line that divides the red and blue regions in the figure, the curling front propagates faster, and accelerates as pulling progresses. In contrast, peeling of the layer with propagates differently. More displacement of the pulling end is needed to initiate the propagation of the curling front (notice the different scale bars indicated for the different cases), which occurs simultaneously with the formation of an interfacial cavity. Shortly after its formation, the interfacial cavity is shown to split into two regions while an intermediate region appears to re-bond. This shedding event666As shown in the video, the main cavity releases a smaller cavity, which due to re-bonding, appears to propagate toward the far end. Hence the use of the term shedding. seems to allow the main cavity (nearest the pulling end) to maintain a nearly constant size. Finally, as peeling progresses, the curling front rapidly engulfs as it propagates towards the pulling end. Quite interestingly, rather than merging the debonded regions, the interfacial cavity reattaches to the substrate as the curling front approaches. For the longest layer, with , the nearly constant size of the main cavity and its closure in response to the approaching curling front, becomes even more pronounced.
In all cases, effects are observed upon initiation of failure and during its propagation. In particular, we find that the interfacial cavity nucleates from defects near the edges and then propagates to the entire width. These effects are not accounted for under the plane-strain assumption for which the entire length of the cavity would form simultaneously. It is thus expected that the model predictions, which we describe next, will result in a tougher response with higher load bearing capacity.
3 Interface properties and reversible cohesive elements
From our observations in the previous section, re-bonding is clearly shown to play a key role in the peeling process. Moreover, as seen from the large displacements that are attained before complete failure, it can occur at a distance from the initial bonding location. To understand the influence of re-bonding on the peeling process and on the load bearing capacity of the layer, we describe next a cohesive law that can capture peeling and re-bonding at a new location, upon contact between the two surfaces.
While several forms of a cohesive law can be conceived, without evidence of a specific physical form, we choose here the simplest possible law; a bi-linear stress-opening relationship777Note that for consistency, we describe the cohesive element in terms of its stress-opening response, where the stress is the force per unit area of the cohesive element and the opening is the gap between top and bottom surface of the cohesive element., as illustrated schematically in Figure 3. Here represents the absolute distance between two corresponding segments on either side of the adhesive interface, hence the normal and tangential components of the opening affect the cohesive response with the same weight, and the interface stress, , acts along the direction of the opening (). Initially, the bonds deform elastically with stiffness (per unit area). Then, once an opening of and the corresponding critical stress are reached, an unstable softening response is activated up to full detachment at where . The total energy expended is , as indicated by the shaded blue region. Overall, this cohesive response can be represented by three independent material parameters. Investigation of the constitutive sensitivity in the following sections, will center on the set (, , ), or equivalently, its dimensionless counterpart (as described in Section 5).
Unloading response. Before describing the re-attachment of the adhesive bond, we first consider situations in which unloading initiates before complete bond breakage is achieved. On the stable branch, unloading would merely reverse the direction of the response along the stress-opening curve. However, if unloading occurs on the unstable branch, the response must depart from the original bi-linear law, resulting in hysteresis. The response then follows a new bi-linear form with the point of departure from the unstable branch (indicated by the red circle on Figure 3) being the new peak stress at , as in the classical formulation of the Camacho–Ortiz linear irreversible cohesive law (Camacho and Ortiz, 1996). Mathematically, the interface stress can be written as
| (2) |
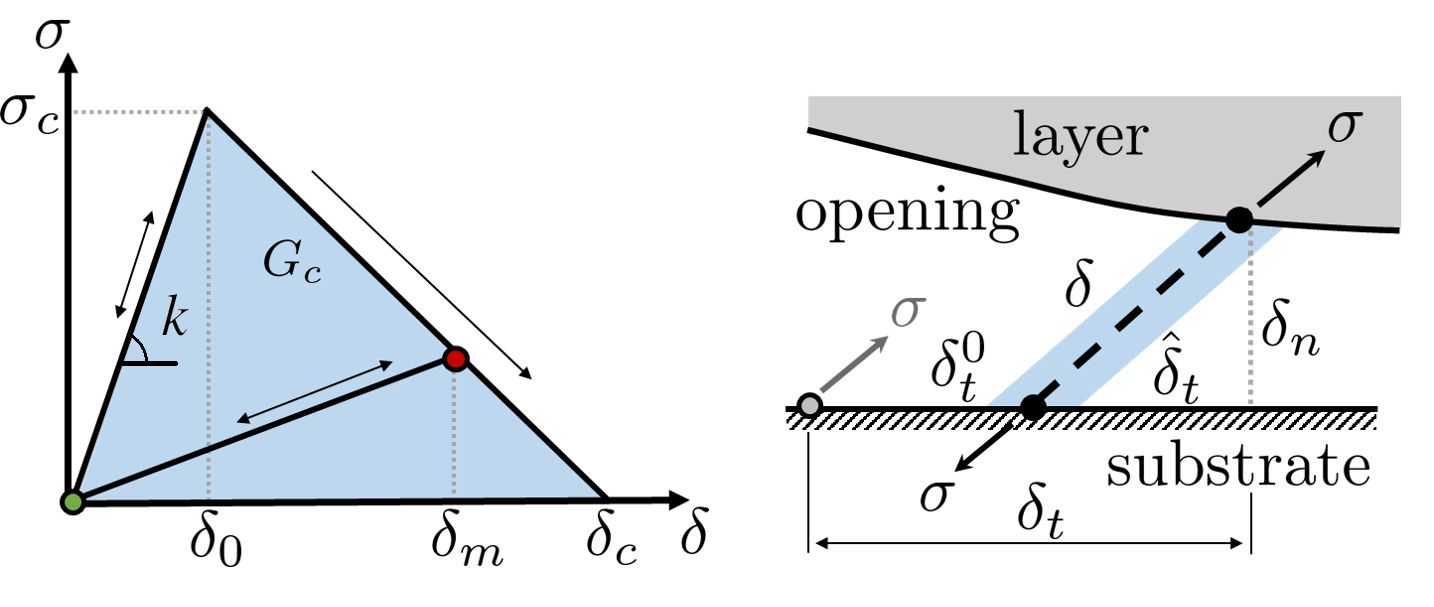
Additionally, we will examine the separate contributions of the tangential displacement and the normal opening , which define the absolute opening through the equality
| (3) |
where , accounts for an initial gap between the corresponding segments on either side of the interface, in the adhered state. Before re-bonding occurs . Nonetheless, if the bond breaks and then re-bonding occurs, this gap can change, as will be explained shortly.
The corresponding tangential and normal components of the interface stress are
| (4) |
respectively. Note, that the above formulation of the cohesive law in equations (2)-(4), assumes no interpenetration, i.e. . However, if then an impenetrability condition is enforced.
Contact penalty. Considering impenetrable substrates, we include a numerical penalty for interpenetration, which is activated if . Then, the tangential and normal component of the interface stress are calculated separately as
| (5) |
where the stiffness is a numerical interpenetration penalty.
Damage accumulation. For interpretation of the numerical results, it is instructive to determine the level of damage within the cohesive zone. Hence, we define a damage parameter that varies linearly between and as damage accumulates, up to complete failure
| (6) |
Although in conventional cohesive laws, damage is mechanically irreversible, in this work, we consider situations in which renewed contact between the two faces of the interface allows to recover the adhesive bond, and as such, to reverse the damage.
Reversibility. Finally, we describe the key feature of the cohesive elements used in this work, their reversibility. For simplicity, we will assume here that if a segment of the adhesive surface reestablishes contact with the substrate, then the bond is fully recovered. Nonetheless, it would be rather straight forward to relax this assumption to account for a deterioration of the adhesive capability from one delamination event to another, or also its dependence on the peak value of the normal compressive interface stress applied in reestablishing the contact. Considering situations in which large displacements can lead to re-bonding at a new location that may be distant from the initial bond, it seems natural to allow for new segments on either side of the interface to form bonds. However, such an approach is mathematically complex and computationally very costly. Instead, in this work, we implement the re-attachment between the initially linked pair, while re-positioning the interface stress to correctly account for the location of reattachment. An artifact of this approach is that the reaction interface stress acting on the substrate will be located at the position of the initial bond (Figure 3). By limiting our attention to peeling from flat rigid substrates, this has no bearing on the results. Mathematically, the implementation of this simplified approach is straightforward. Following the elongation and breakage of the initial bond, if a segment of the adhesive surface reestablishes contact with the substrate, such that , then the full cohesive energy is recovered at the new tangential location and the damage is set back to , namely
| (7) |
Then, as the bond is further deformed, the tangential displacement is measured from this point. In this framework, re-attachment events can happen multiple times and it is sufficient to declare a different . Accordingly, at the onset, for all .
In this section we have established a framework that describes the response of reversible cohesive elements. For simplicity, this framework considers a bi-linear response, it is limited to adhesion on flat rigid substrates, and considers full recovery of the adhesive bond upon contact with the substrate. Nonetheless, it is straight forward to extend this framework and relax these assumptions to account for more complex, rate-dependent, adhesive response and mixed mode failure (Snozzi and Molinari, 2013; Wang and Elbanna, 2014). In the next section we provide the details of the numerical exploitation of these cohesive elements by adapting a readily available finite element framework, and we describe the solution procedure.
4 Numerical Implementation
The considered problem encompasses large deformations, both in the bulk and at the interface, as well as local unstable response of interface bonds and their reversibility; it is thus highly nonlinear and requires specialized numerical implementation. The ingredients that are included in the numerical scheme to resolve these nonlinearities, and to minimize computation times, are detailed here:
Setup of the simulation. The problem setting and constitutive properties described in Section 2 are implemented numerically to investigate the peeling response. The pad is loaded by imposing an increasing displacement of the edge of the backing (i.e. at and ), while not allowing vertical displacement along of this edge. Zero thickness, reversible cohesive elements, with a response described in the previous section, are included at the bottom of the pad (i.e. at and ). At the interface between the adhesive layer, a rigid substrate is included in the simulation to ensure proper boundary conditions. The remaining free surfaces of the layer remain unloaded.
Meshing and calculation software. The mesh is generated using the open-source mesh-generation software Gmsh (Geuzaine and Remacle, 2009) and the simulations are performed with the open source multi-core finite element solver, Akantu (Richart and Molinari, 2015; Vocialta et al., 2016). The bulk materials are meshed into T3 elements with linear interpolation and the adhesive surface is meshed into zero thickness cohesive 4-node elements with a Gauss integration scheme. The spatial discretization is chosen such that the cohesive process zone is sufficiently discretized. Visual post-processing is achieved using the open-source visualization application ParaView (Ahrens et al., 2005; Ayachit, 2015). To avoid element locking in the simulations, we use the modified neo-Hookean law to allow for small levels of compressibility. Numerical values used in the simulation are provided in Appendix B.
Hybrid solution procedure. In the finite element framework, the static problem can be described by the system of equations
| (8) |
Using its linearization at each iteration of a Newton-Raphson-based scheme, a linear system of equations is solved at every iteration
| (9) |
where is the tangent stiffness of the structure that depends on , the set of nodal displacements888To avoid confusion, note the difference between and the applied displacement . Solving this system using a static solution procedure incurs unavoidable convergence issues that result from the cohesive elements and the nonlinear material laws. To treat such issues, the solution procedure can employ increasingly smaller displacement steps . However, this requires longer computational times and, moreover, once interfacial bonds begin to break, convergence may not be achieved.
Alternatively, one can employ an explicit dynamic solver, formulated using the central difference solution procedure
| (10) |
where nodal accelerations and velocities are permitted, and is the lumped mass matrix. In this time stepping scheme the nodal forces, displacements, accelerations and velocities depend on time, , and integration is performed using time increments, , which correspond to displacement steps , where is the pulling rate. To capture a ‘nearly’ quasi-static peeling response (i.e. with negligible levels of inertia), the choice of a specific pulling rate is a compromise between achieving minimal inertial effects, and allowing for reasonable simulation times999In this work numerical stability is achieved for of the order of the critical time step of the bulk, , resulting in long computation times of hours on cores. The maximal critical time step is defined as the time the fastest wave needs to travel the characteristic length of the mesh(Richart, 2016) in the bulk..
Overall, both the explicit and implicit solvers, represented by equations (8) and (10), respectively, have significant shortcomings. Nonetheless, the static solution performs well before onset of bond breakage and the dynamic solution procedure, although it is time intensive, allows to handle instabilities that may emerge in the peeling process. To take advantage of both of these methods, we use in this work a hybrid approach: a static procedure is employed until the first section along the surfaces reaches a damage value of , at which point the dynamic solution procedure is initiated. The dynamic solution procedure is not meant to capture inertial effects; rather it is deployed to capture the non-equilibrium transition between static equilibrium states, it is accordingly damped to the degree of becoming nearly quasi-static. To avoid imposing a numerical shock in the loading procedure, at the transition into the dynamic scheme, the pulling velocity is gradually increased up to its target value.
Damping. In this work we aim to capture the quasi-static peeling response of the system by sufficiently damping the dynamic response, in an approach similar to Rice (1993). Without justification for a specific physical damping mechanism, we employ artificial damping by imposing a numerical correction factor on the velocity. Accordingly, at every time step the equation of motion (10) is solved, and the predicted velocity is reduced by application of the factor, , such that
| (11) |
The initial velocity before damping correction is calculated according to the standard explicit central difference method.
| (12) |
The damping factor is defined based on the time step-independent constant101010This constant is calculated using the formula to eliminate dependence on the time step . . The damping constant is a numerical parameter and can in practice be tuned to achieve desired levels of damping. In this work we seek an optimal value for that minimally influences the force-displacement response while eliminating vibrations. Therefore, we determine by considering a simplified benchmark problem: a block of linear elastic material of cross-section is perfectly adhered to the substrate and subjected to tensile deformation by pulling its top surface at the same velocity (as in the simulations) until 1% strain and releasing it to observe oscillations resulting from the loading relaxation. The desired value leads to critically damped behavior, such that the block returns rapidly to its stable position at rest without oscillations.
Snap-through. As observed from our experiments in Section 2, failure can occur abruptly and thus, the failure of one cohesive element can lead to a cascade of interfacial failure even without continuing to pull, namely while holding the pulling displacement constant. This physical snap-through instability is also encountered in experimental settings (see Fig. 2 and corresponding video). Eventually, this rapid delamination arrests as a new quasi-static equilibrium state is found. However, if the pulling progresses while such snap-through events occur, the response can be highly dependent on the pulling rate while inertial effects become dominant and numerical damping has a non-negligible effect on the applied force. Thus, in this work, to numerically capture a ‘nearly’ quasi-static response, once a single cohesive element fails, the numerical procedure continues but with constant displacement (i.e. ) until a new equilibrium is achieved. Then, the velocity is gradually introduced again. This procedure is continued until 95% of the total adhesive surface has failed, avoiding the final dynamics linked to development of failure of the complete pad.
-
1.
Initialize the system: , and .
-
2.
If , continue to next step; otherwise, repeat this step.
-
3.
Hold dynamic solver: Update and . Use (10) to obtain , and . Use (6) to obtain . Repeat for 10 steps.
If more than 95% of the surface failed, stop the simulation.
If , continue to the next step; otherwise, repeat the current step.
-
4.
Accelerate dynamic solver: Increase the pulling velocity with a triangular acceleration profile over 100 by varying , along constant . Update and .
If , return to step 3; otherwise continue with this step.
Once the target velocity is reached, continue to the next step.
-
5.
Steady dynamic solver: Update with a constant and .
If , return to step 3; otherwise, repeat this step.
5 Results and discussion
In this section we apply the computational model, described in the previous sections, to study the influence of reversible adhesive bonds on the peeling process. For a bi-layer adhesive pad, of given aspect ratio , the problem is fully defined by a set of five independent dimensionless parameters
| (13) |
The first three of these parameters are sufficient to describe the elastic response prior to debonding, as shown in the theoretical model by Cohen et al. (2018). Therein, assuming linearly elastic response, the deformation of the layer was captured, thus allowing to infer the location of initiation of failure, but not its propagation. An investigation of the model sensitivities finds that curling response becomes dominant for increasing values of the longitudinal stiffness ratio - , for decreasing values of the dimensionless bond stiffness - , and for smaller aspect ratios - (Cohen et al., 2018). However, the response is shown to be insensitive to the thickness ratio - . In this work, to capture the entire delamination process, two additional dimensionless parameters are introduced: the dimensionless surface energy - , and the dimensionless load bearing capacity - . To elucidate the role of the interface properties in determining the peeling response, the sensitivity analysis in this work will center on the last two dimensionless parameters, while considering different aspect ratios .
Next, we define the dimensionless pulling displacement, and the corresponding dimensionless applied force as
| (14) |
respectively. Recall that is defined as the force applied per unit depth of the layer.
5.1 Qualitative agreement with observations
To examine the ability of our model to capture the different modes of failure that have been observed in Figure 2, we first consider layers with
| (15) |
Note that this base set of parameters will be used in all simulations, unless noted otherwise. The dimensional values implemented in the simulations are provided in Appendix B.
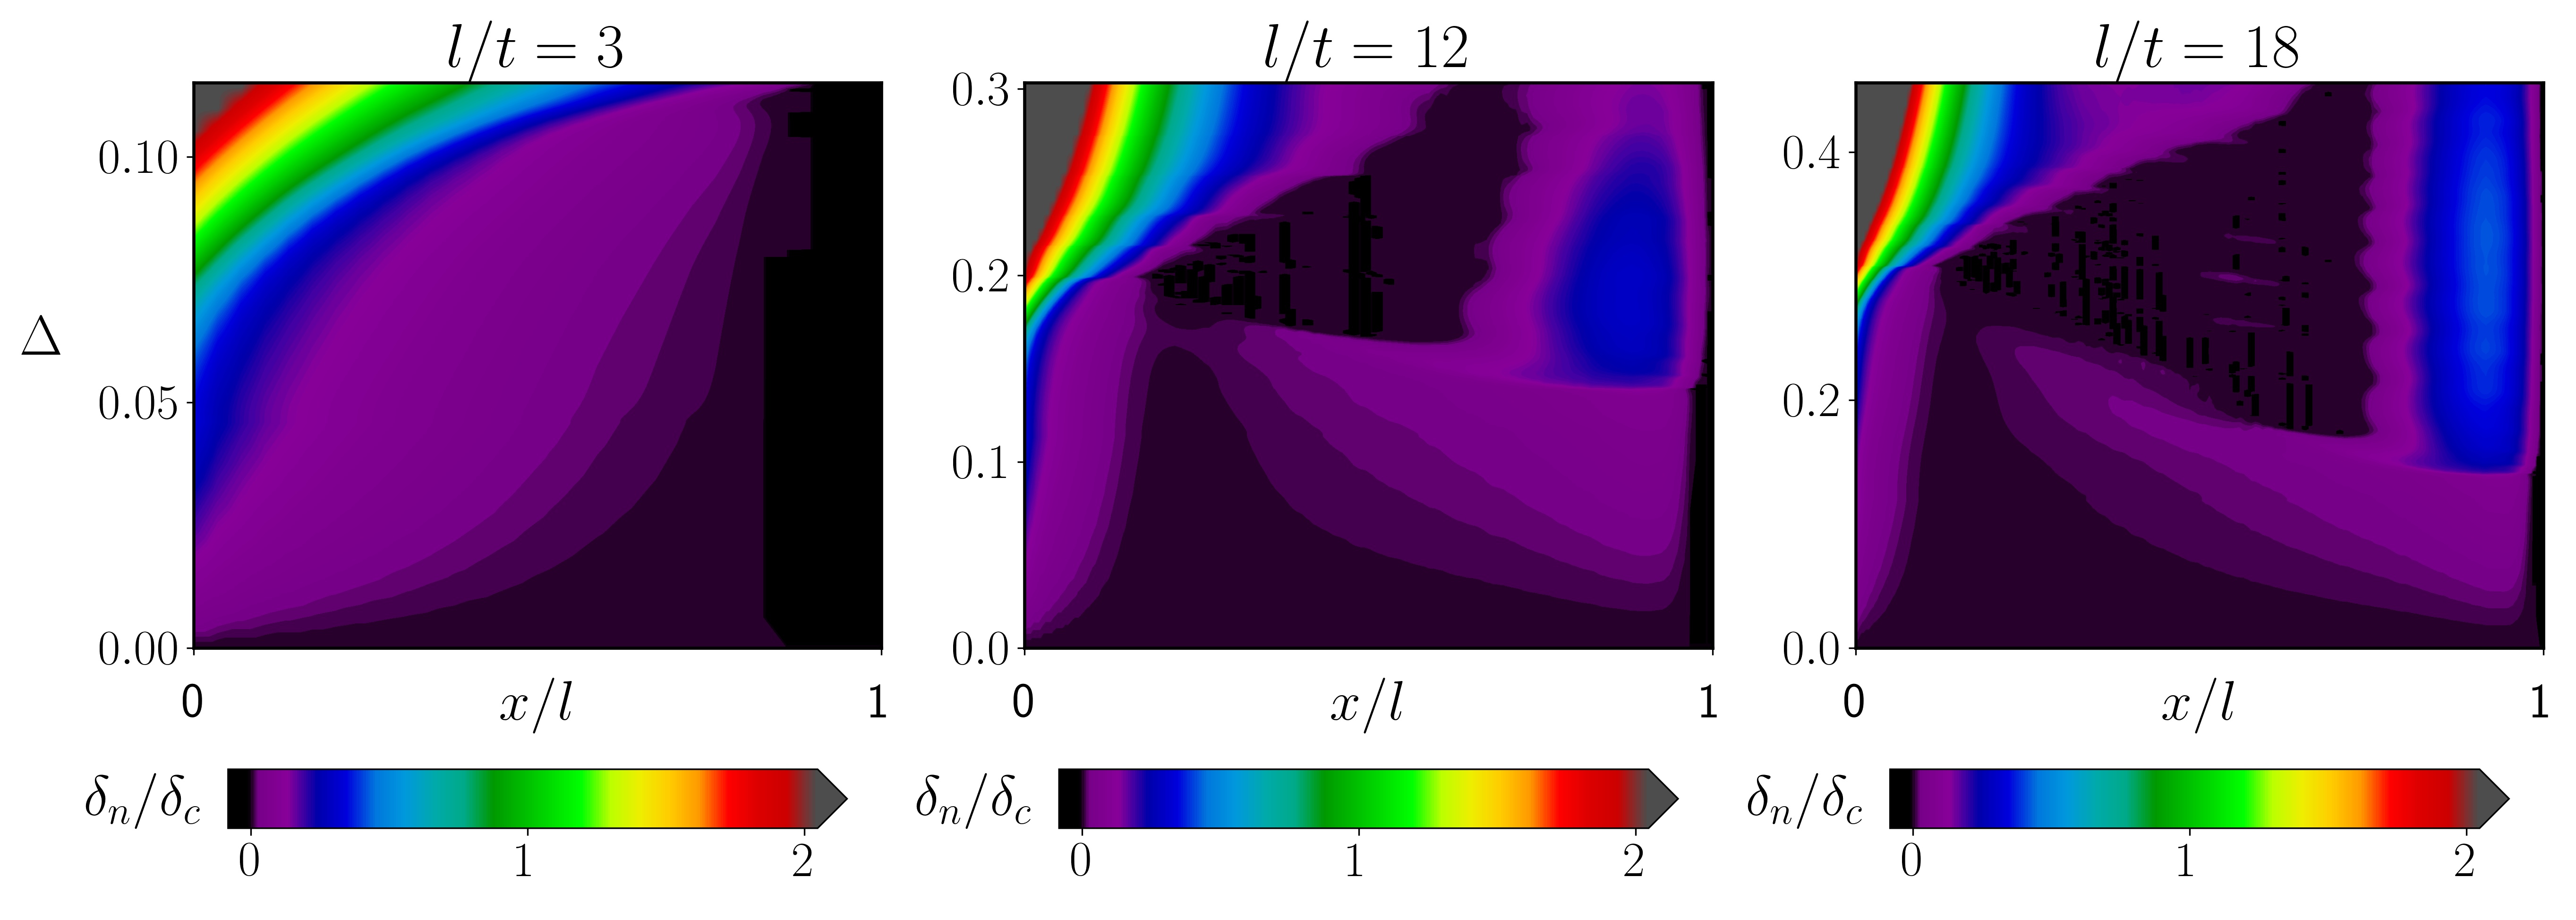
To visually compare the numerical results with the observations, we first show maps of the dimensionless normal displacements, , on the plane for three different aspect ratios , in Figure 4. Note that these results, in contrast to the observations in Figure 2, are shown in the Lagrangian frame (i.e the locations refer to the undeformed state). Additionally, while in the observations only two shades are observed and correspond to regions that are in contact (dark) or removed (bright) from the substrate, in the numerical results the lift off of the substrate is quantified. Nonetheless, the qualitative agreement between the observed phenomena and the simulation is apparent. For the shorter layer, lift off begins at the far end and is shown to accelerate as it approaches the pulling end. For longer layers (i.e. larger aspect ratio ) the formation of an interfacial cavity is clearly observed. Furthermore, it appears to maintain a nearly constant size as pulling progresses and regions in its wake (i.e. at smaller values ) come back into contact with the substrate. Finally, curling from the far end accelerates as it propagates towards the front end and leads to final failure.
An important parameter that is not visible from neither the observation (Figure 2) nor the results in Figure 4, is the local tangential displacement . Nonetheless, the tangential motion is expected to play a significant role in determining both the initiation of debonding, and the possible occurrence of stick-slip events. From the numerical simulations, we can quantify the tangential displacements, and the damage via (6), as shown in Figure 5. From these curves the differences between curling and interfacial cavitation become even more apparent. An interfacial cavity of finite length forms nearly instantaneously (at a constant ) for and . This is succeeded by a more gradual propagation of damage, during which reversal of damage over time and stick-slip can be clearly observed; the sudden decrease of tangential opening indicates stick-slip as elements have reattached at a different location. In contrast, curling is shown to propagate gradually and smoothly without re-bonding. Quite notably, the unstable propagation of delamination in the event of curling exhibits formation of fingering-like patterns, reminiscent of the Saffman-Taylor instability (Saffman and Taylor, 1958), but in the plane. This morphological instability of the delamination front is highly sensitive to initial imperfections and emerges naturally in our simulations. Nonetheless, the general features of the response and the typical length-scales are consistent and independent of the mesh refinement.
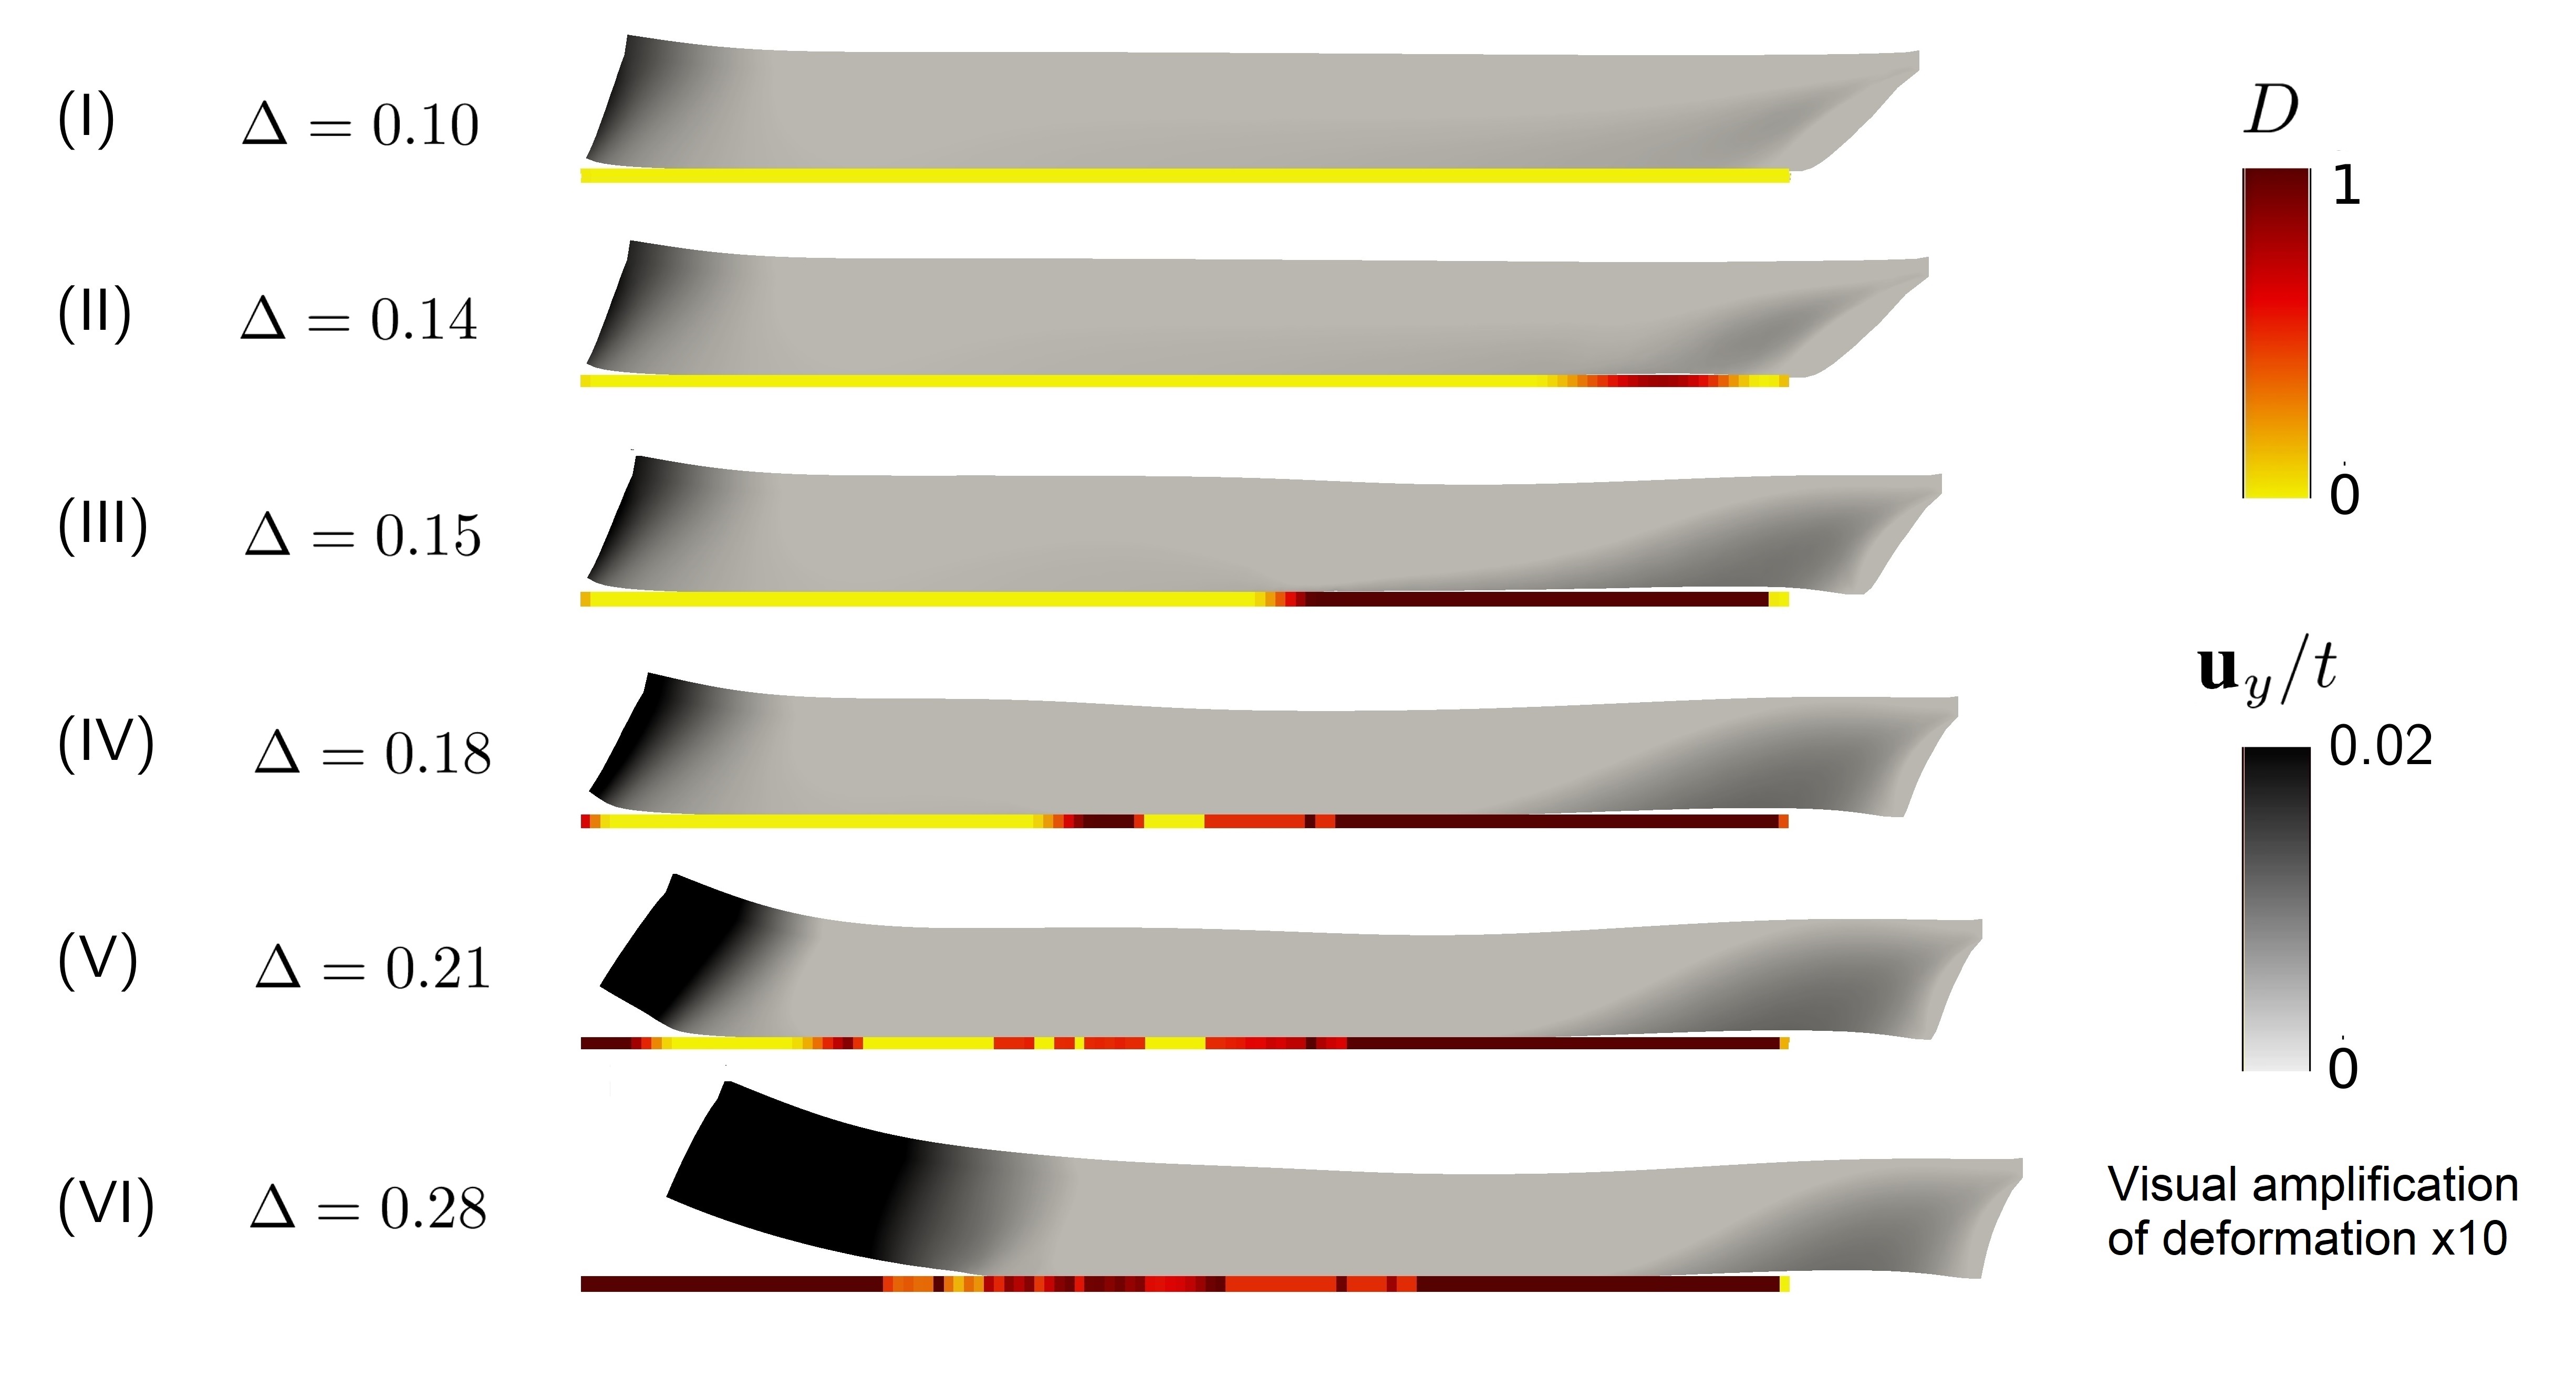
To better portray the complex delamination process, which involves formation of an interfacial cavity, we show in Figure 6 a sequence of cross-sectional views of the deformed layer obtained from the plane strain simulation with (note that deformation is magnified by ). Here the interface (at its undeformed location) is shown as a thin line below the layer and is shaded to indicate the corresponding degree of damage. For this layer, initiation of peeling is observed first near the pulling end (II), then an interfacial facial cavity rapidly forms (III). Shedding of a smaller cavity can be seen in (IV) by the appearance of an intermediate region that has re-adhered (yellow region in the cohesive zone). Such shedding events appear multiple times throughout the peeling process. Finally, in (V) curling initiates; it then propagates (VI) until the layer is fully detached.
By now, we have portrayed the peeling process in multiple ways. The normal opening, , is shown to be the most intuitive field parameter and corresponds directly to our observations, however it only provides a partial understanding of the phenomena. Our numerical simulations also allow examining the tangential displacements, , from which we can observe the occurrence of stick slip events, and the damage, which provides us with clarity on the extent of failure propagation. Next, we examine how these peeling phenomena translate into load bearing capacity of the layer and determine the stability of the peeling process.
5.2 Force-displacement response
In Figure 7 we show the variation of the applied force, , as the pulling progresses for different aspect ratios, and the corresponding fractions of fully detached and reattached surface areas and , respectively. First, the distinct behaviour of the layer with is apparent. Failure is catastrophic as the force drops rapidly following a peak value, beyond which debonding propagates, as seen from the steep increase in , and no reattachment occurs; this behavior is typical of the curling response. In contrast, for all the higher aspect ratios, the initial slopes of the force-displacement curves is similar while the interface failure develops more gradually; this behavior is typical of interfacial cavitation, and the common slope can be understood by the fact that only a small region near the pulling end is activated initially. This also explains the distinct slope observed for , in which case, the entire length of the pad is activated. Interestingly, this distinction in the force-displacement response would allow to experimentally differentiate the different failure mechanisms. For larger aspect ratios, successive shedding and stick-slip events occur, as seen from the jumps in detached and reattached area. Corresponding jumps in the force-displacement response are typical of stick-slip, and are often reported experimentally (Amouroux et al., 2001; Baumberger et al., 2002; Cortet et al., 2007; Collino et al., 2014; Ponce et al., 2015; Cohen et al., 2018; Zhu et al., 2019; Zotti et al., 2019). Reattachement persists as peeling progresses, as seen by the increasing values of , up to a peak value beyond which the entire layer is activated and a curling front begins to propagate.
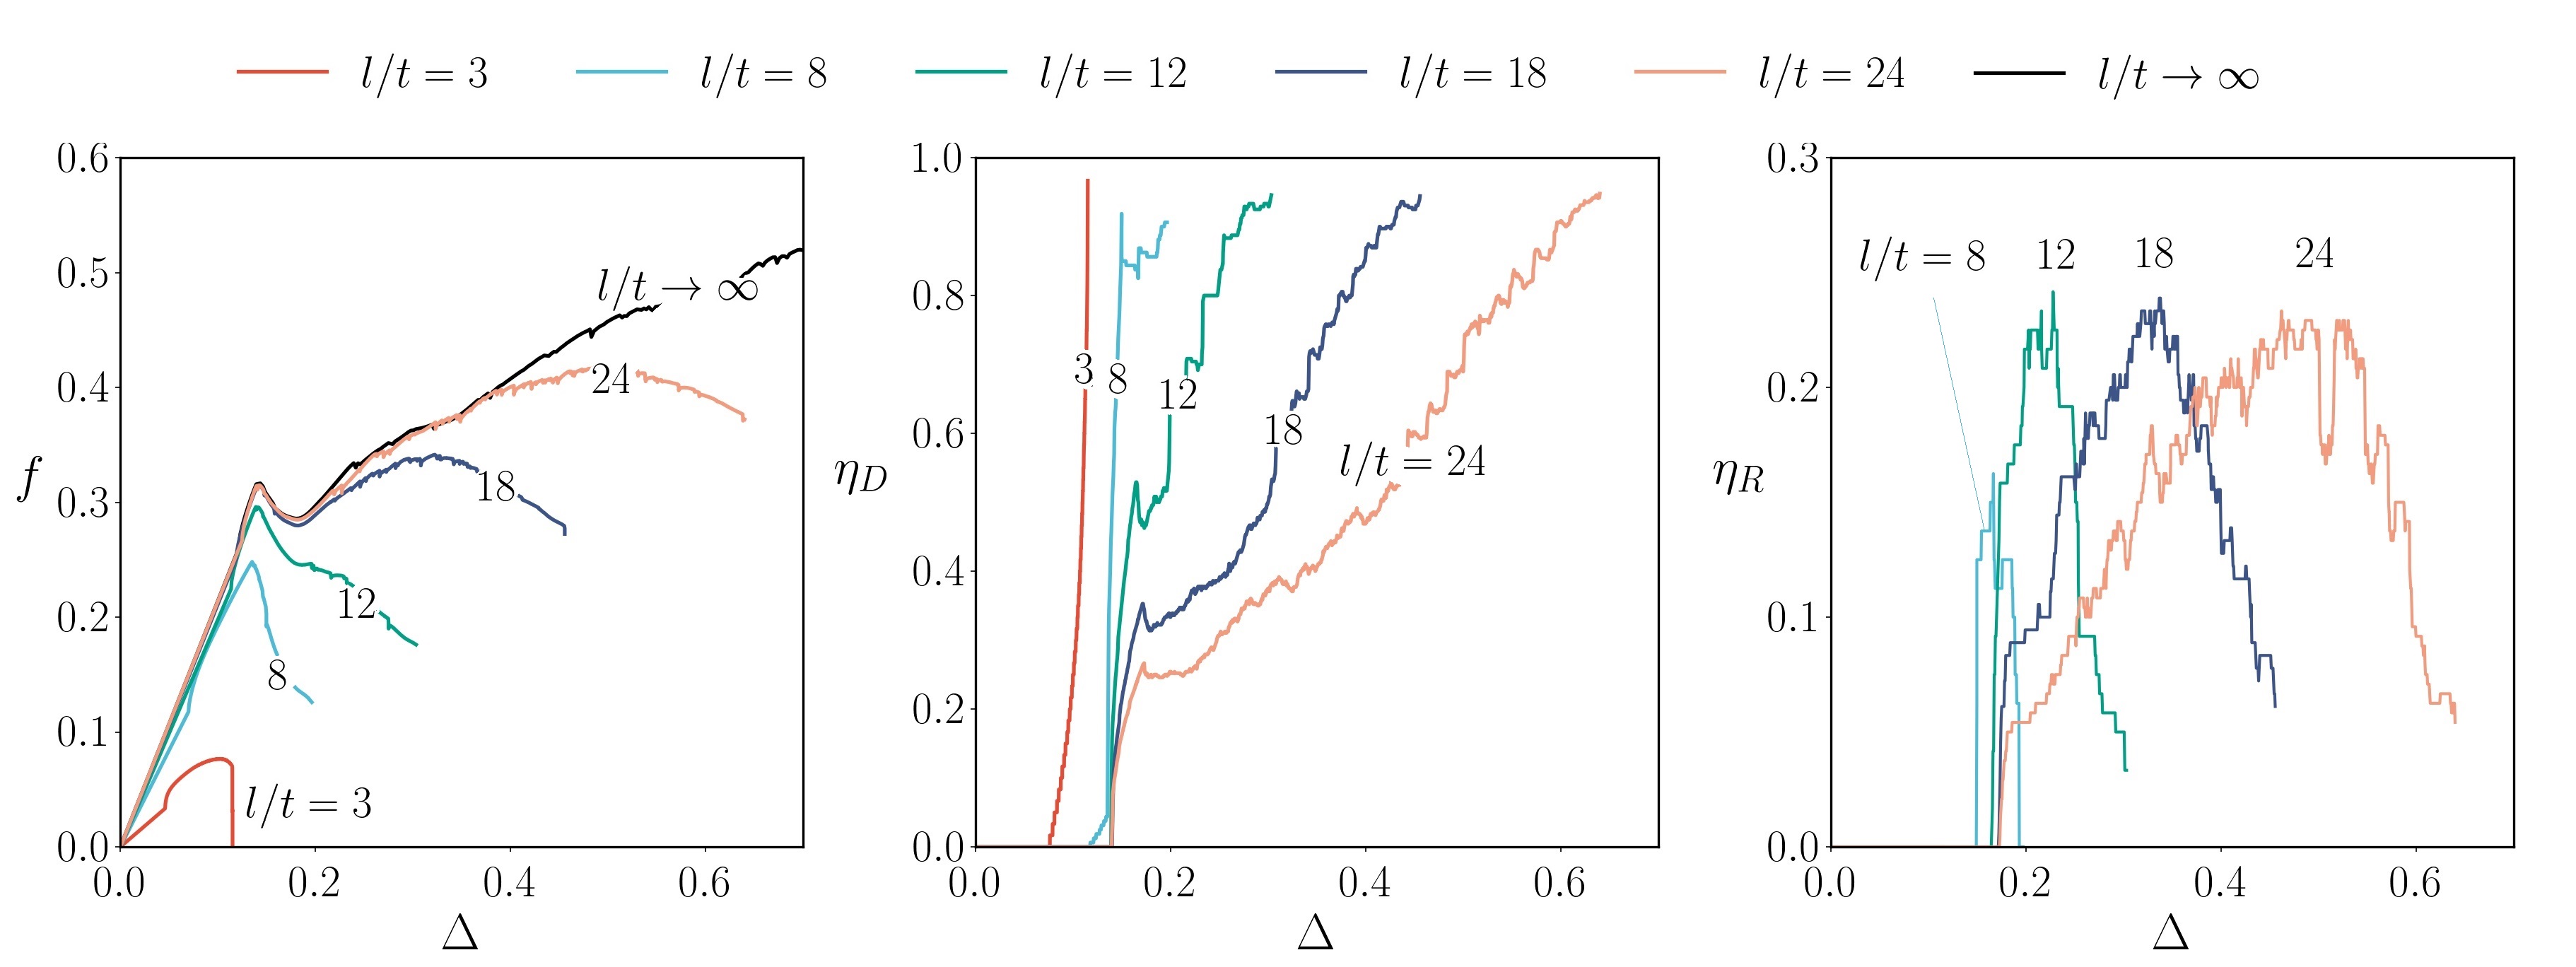
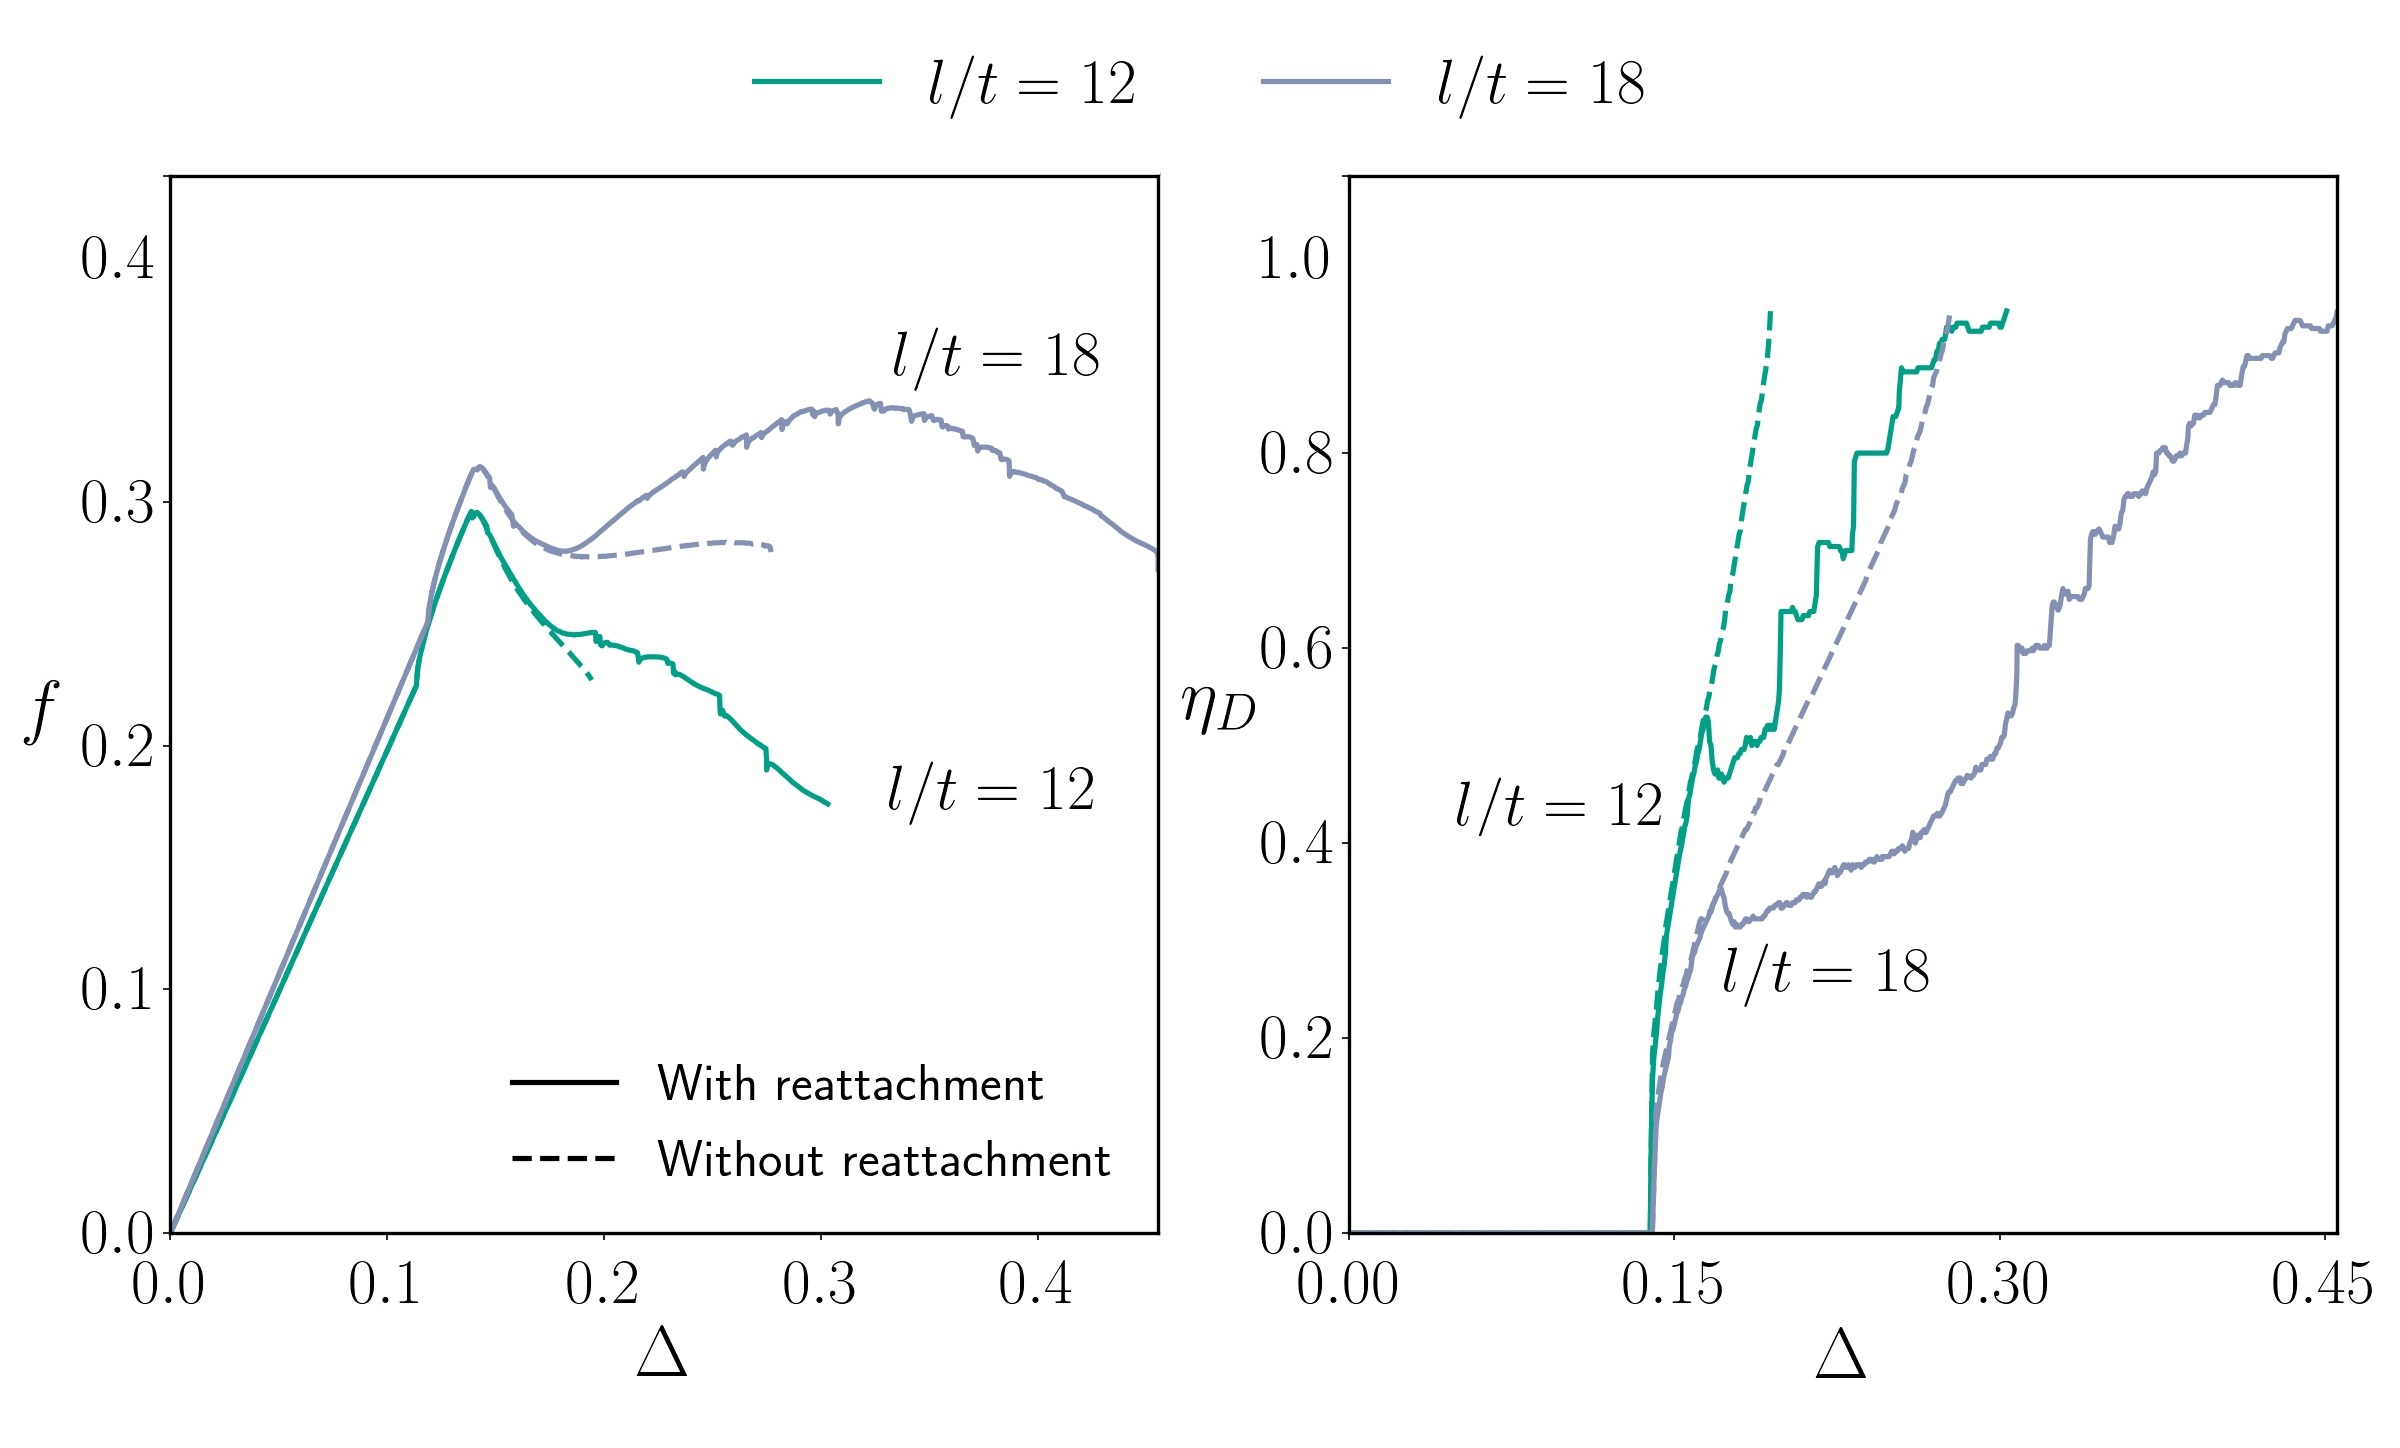
The response of pads with higher aspect ratios illustrates the importance of reattachment. Successive shedding and stick-slip events significantly impede the failure process and increase the force-bearing capacity. Even upon initiation of curling, rather than catastrophic failure, a slower decline in force occurs. The impact of reattachment on the response can be further explained by examining the response of the same pads but without permitting reattachment, as shown on Figure 8, for layers with and . Without reattachment, the total failure energy of the layer is reduced and failure occurs at a lower displacement and with lower applied force. Upon local initiation, failure continues to propagate smoothly. In contrast, if reattachment can occur, it hinders the propagation and requires more energy input to induce complete failure. From this comparison, it is clear that reversibility can have a critical influence on the overall behavior and load bearing capacity. This effect becomes more pronounced for increasingly slender layers, but appears to be bounded, by the response of an infinitely long layer, as shown by the convergence of the curves in Figure 7 to that of . The response at this limit is further investigated in the next section.
5.3 Infinitely long layers and Schallamach waves
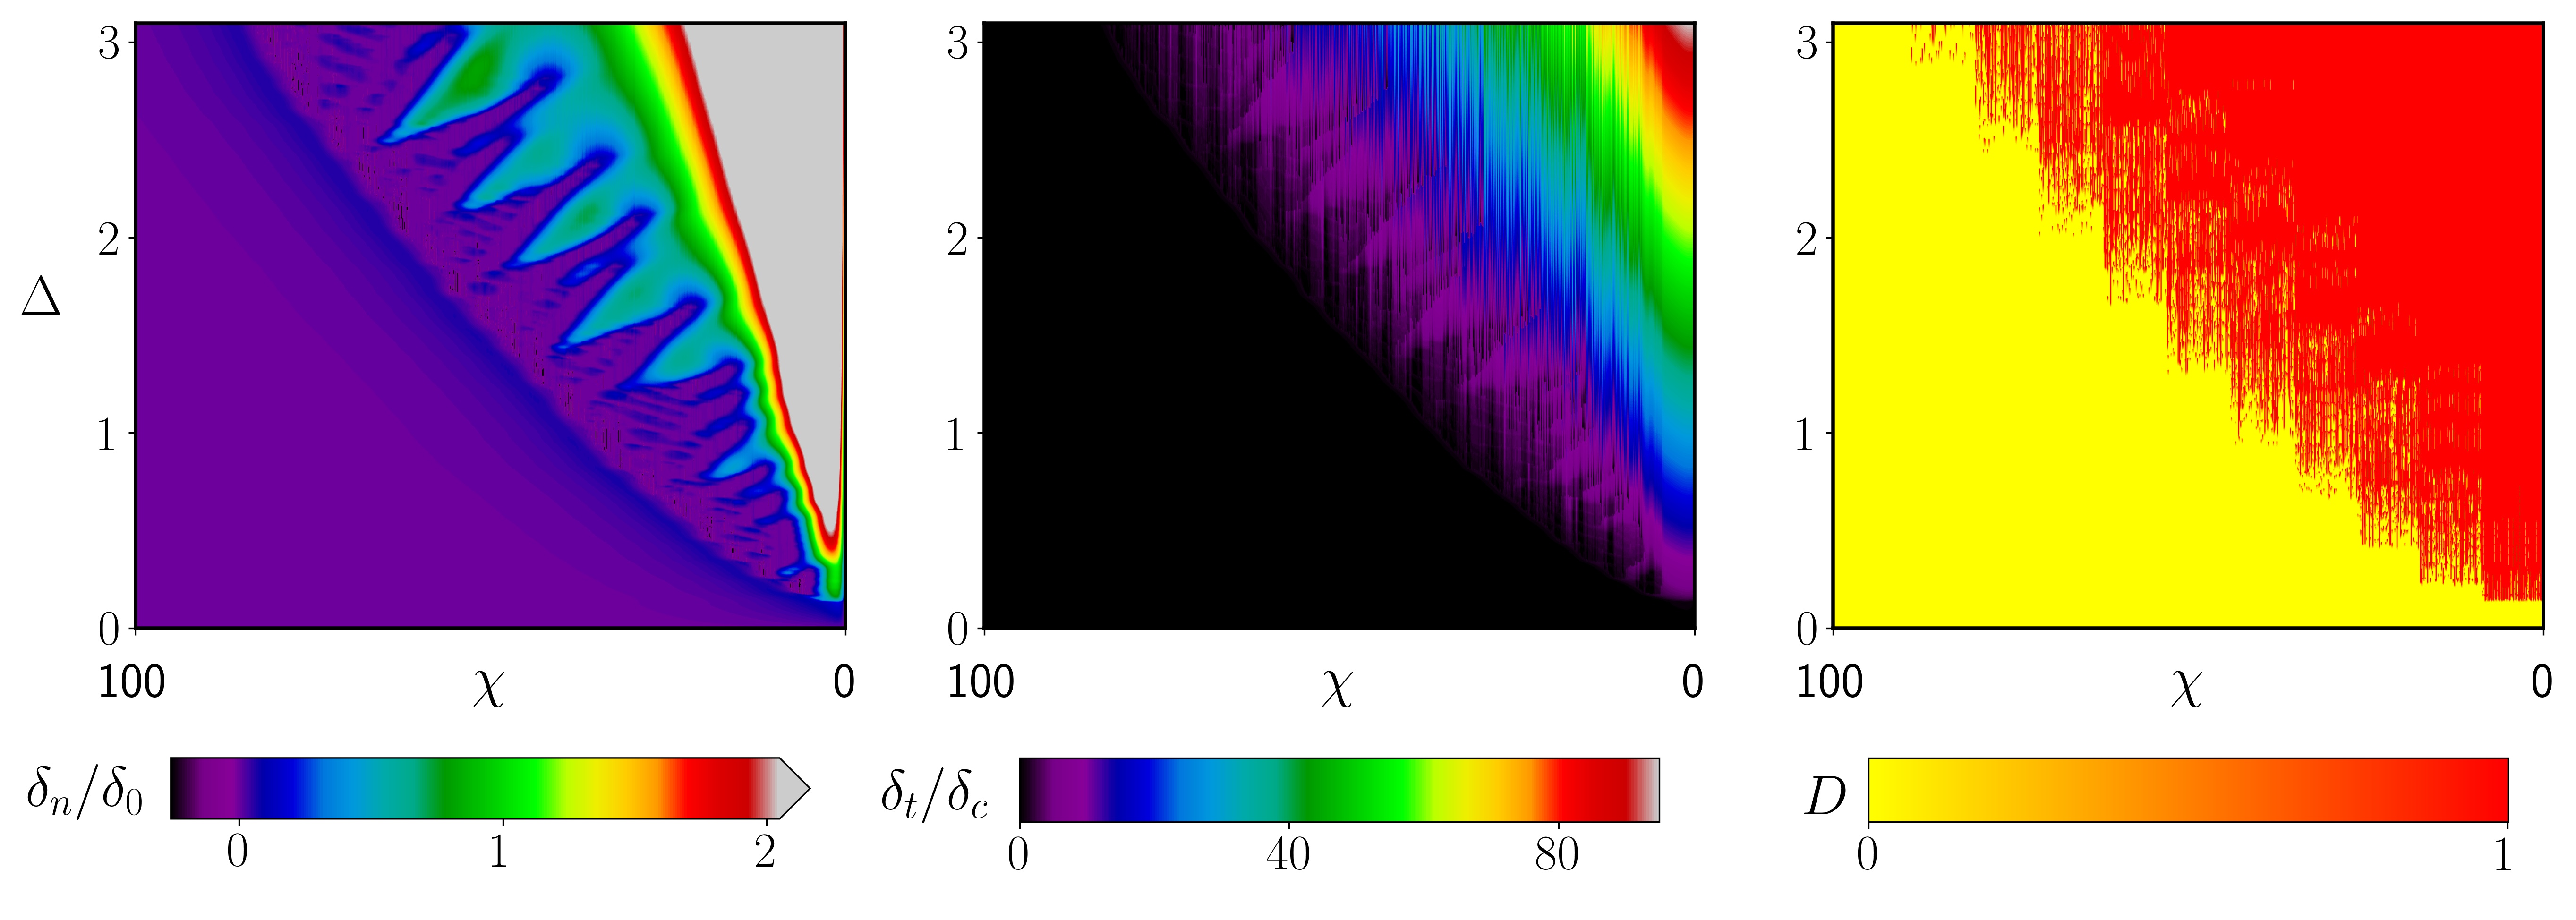
Beyond the transitional peeling response and the formation of the first interfacial cavity, emerges a steady peeling front that can propagate in infinitely long layers. This front is characterized by periodic events of peeling and re-adhering which become apparent by examining the map of normal opening in Figure 9. In the wake of an ever growing interfacial cavity (grey region) a zone of periodicity develops. Within this zone, tangential displacement as well as re-adhering is present, as observed from the corresponding maps of tangential displacement and damage. As does the interfacial cavity, this zone of periodicity continues to expand and appears to approach a steady rate of expansion (with respect to the quasi-static pulling rate), which is indicated by the linear dependence on .
Intuitively, the observed periodicity can be understood by considering the displacement of the pad, which is similar to what was shown for the layer with in Figure 6. Initially only a small region of the pad, near the pulling end, is influenced by the pulling displacement. The interfacial cavity suddenly forms within that region and leads to the redistribution of stress that expands the range of the affected zone. Continued pulling leads to reattachment of an intermediate region within the cavity as it grows, and thus effectively to the shedding of a smaller cavity. Now, this reattached area locally anchors the layer to the substrate and functions as a new pulling end. From here, the same sequence of events of back and forward motion of the peeling by formation of an interfacial cavity and reattachment, repeats periodically. The propagation of this periodic wave through the layer is captured here at the quasi-static limit. Nonetheless, its features are consistent with those of a Schallamach wave (Schallamach, 1971). Note that numerically was used to approximate an infinite pad. It was confirmed that no end effects are present within the considered range of values.
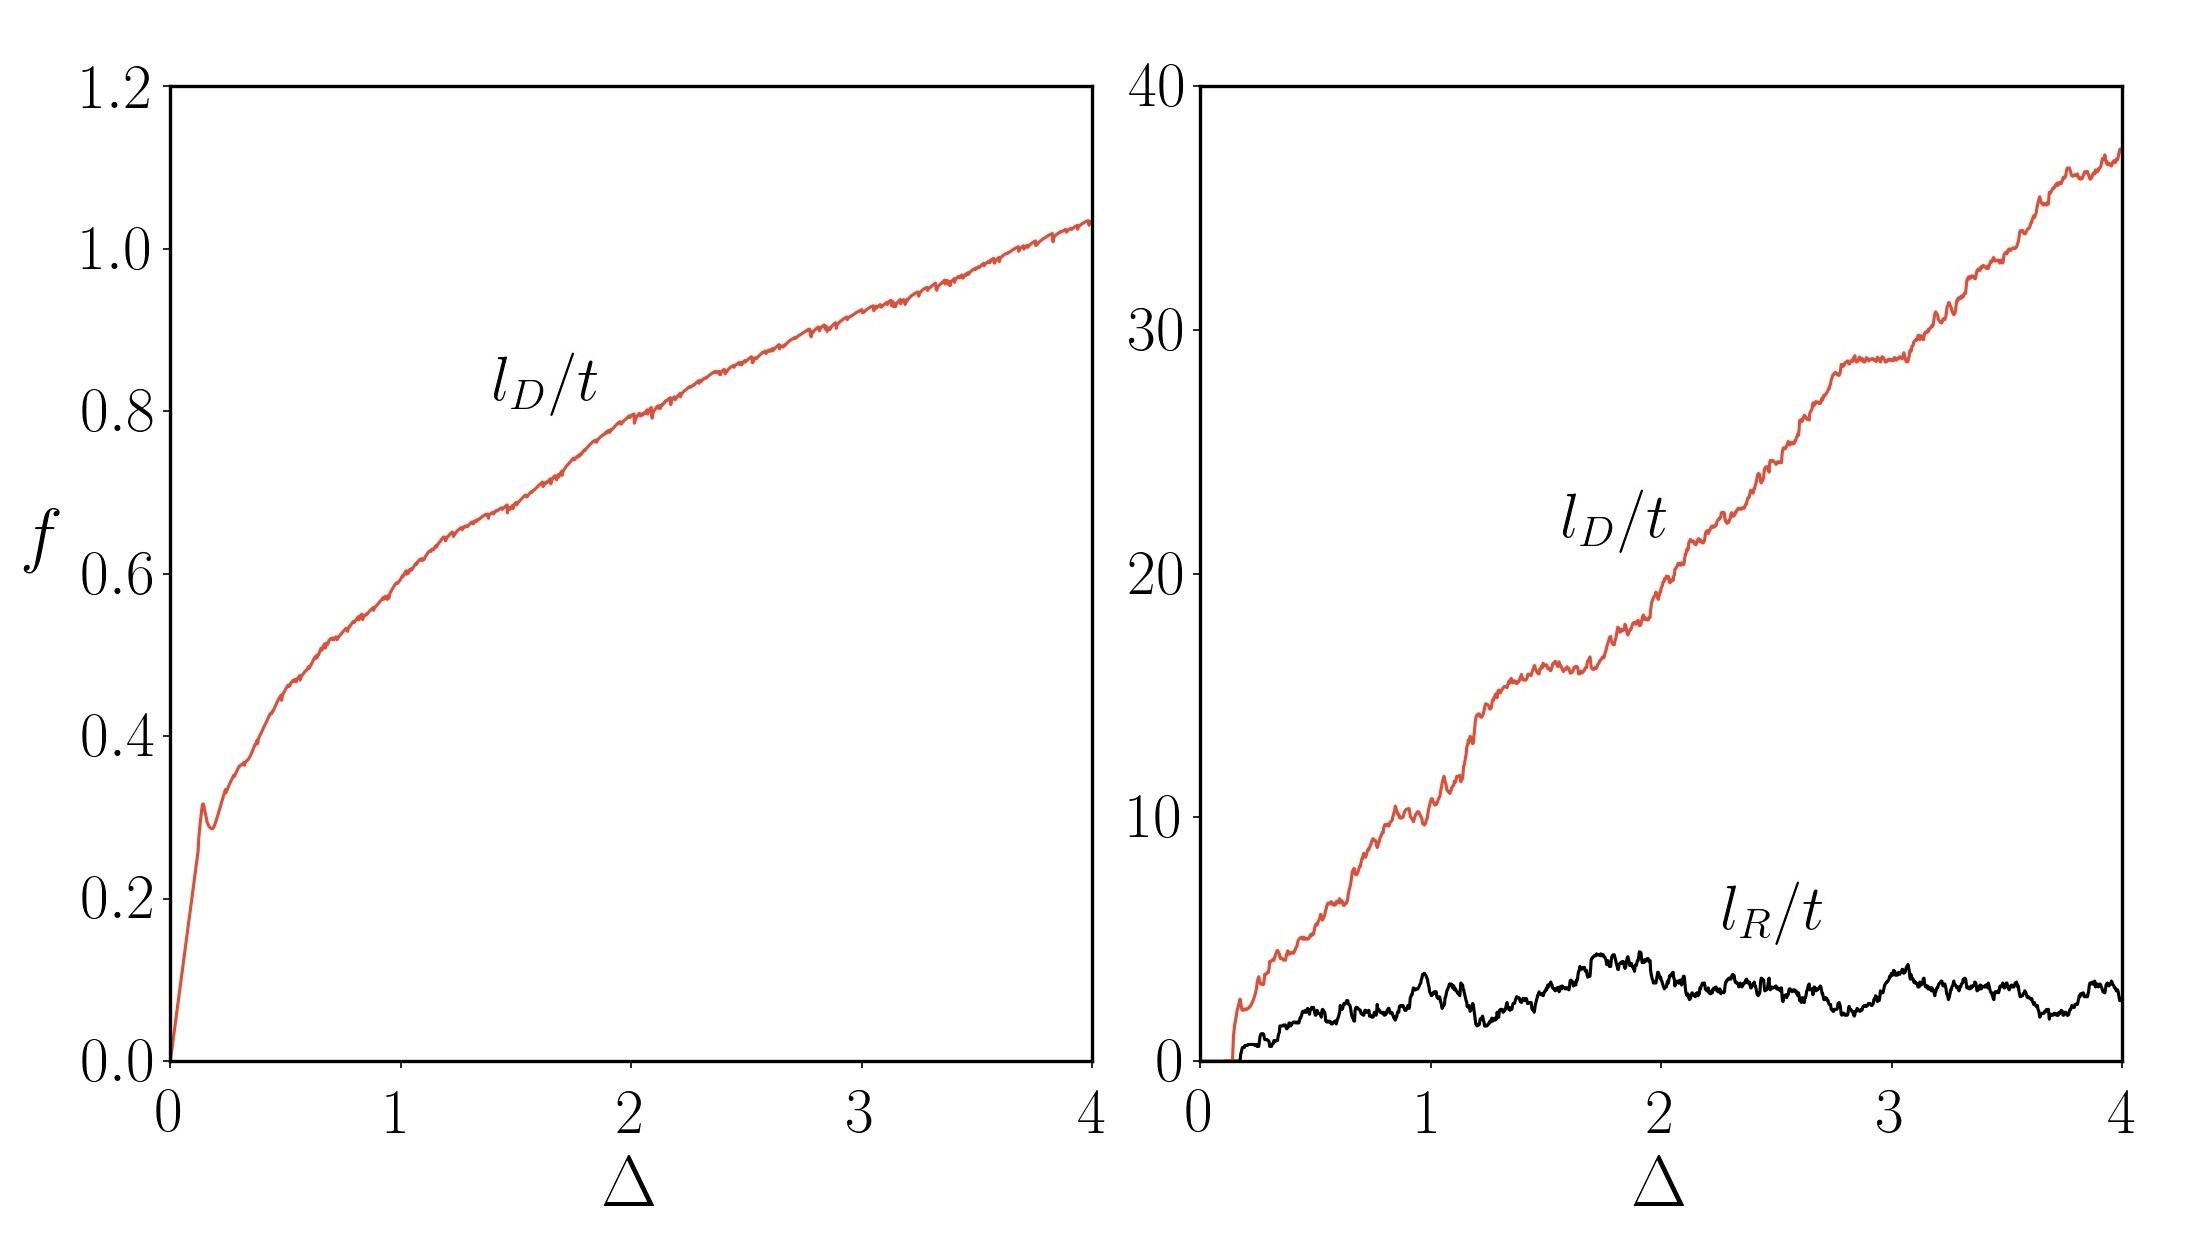
The influence of the periodicity on the force-displacement response is shown in Figure 10 for a larger range of values, along with the corresponding detached and reattached length of the interface, respectively and 111111We display and for the infinitely long layer as and are not well defined on a infinite layer.. Following nucleation of the first interfacial cavity (which appears as a noticeable peak force in the early stage of pulling), drops and re-increases in the pulling force as well as the detached length correlate with the periodic peeling events. The reattached length is found to saturate in this range.
5.4 Influence of surface properties on stick-slip
The stick-slip phenomena observed in the previous sections, are critically dependant on surface properties. Nonetheless, different physical systems can exhibit a range of surface properties that are not always straightforward to measure121212For example, reported experimental values of surface energy of PDMS vary up to 3 orders of magnitude (Collino et al., 2014; Galliano et al., 2003; Sofla et al., 2010)..
To examine this effect we consider two layers of the same aspect ratio of and with the same dimensionless set of parameters131313This set (different from earlier simulations) is chosen to allow for computational convergence within a wide range of values, which will be needed for the phase diagram that will be presented next.
| (16) |
and vary only the dimensionless surface energy and the dimensionless load-bearing capacity .
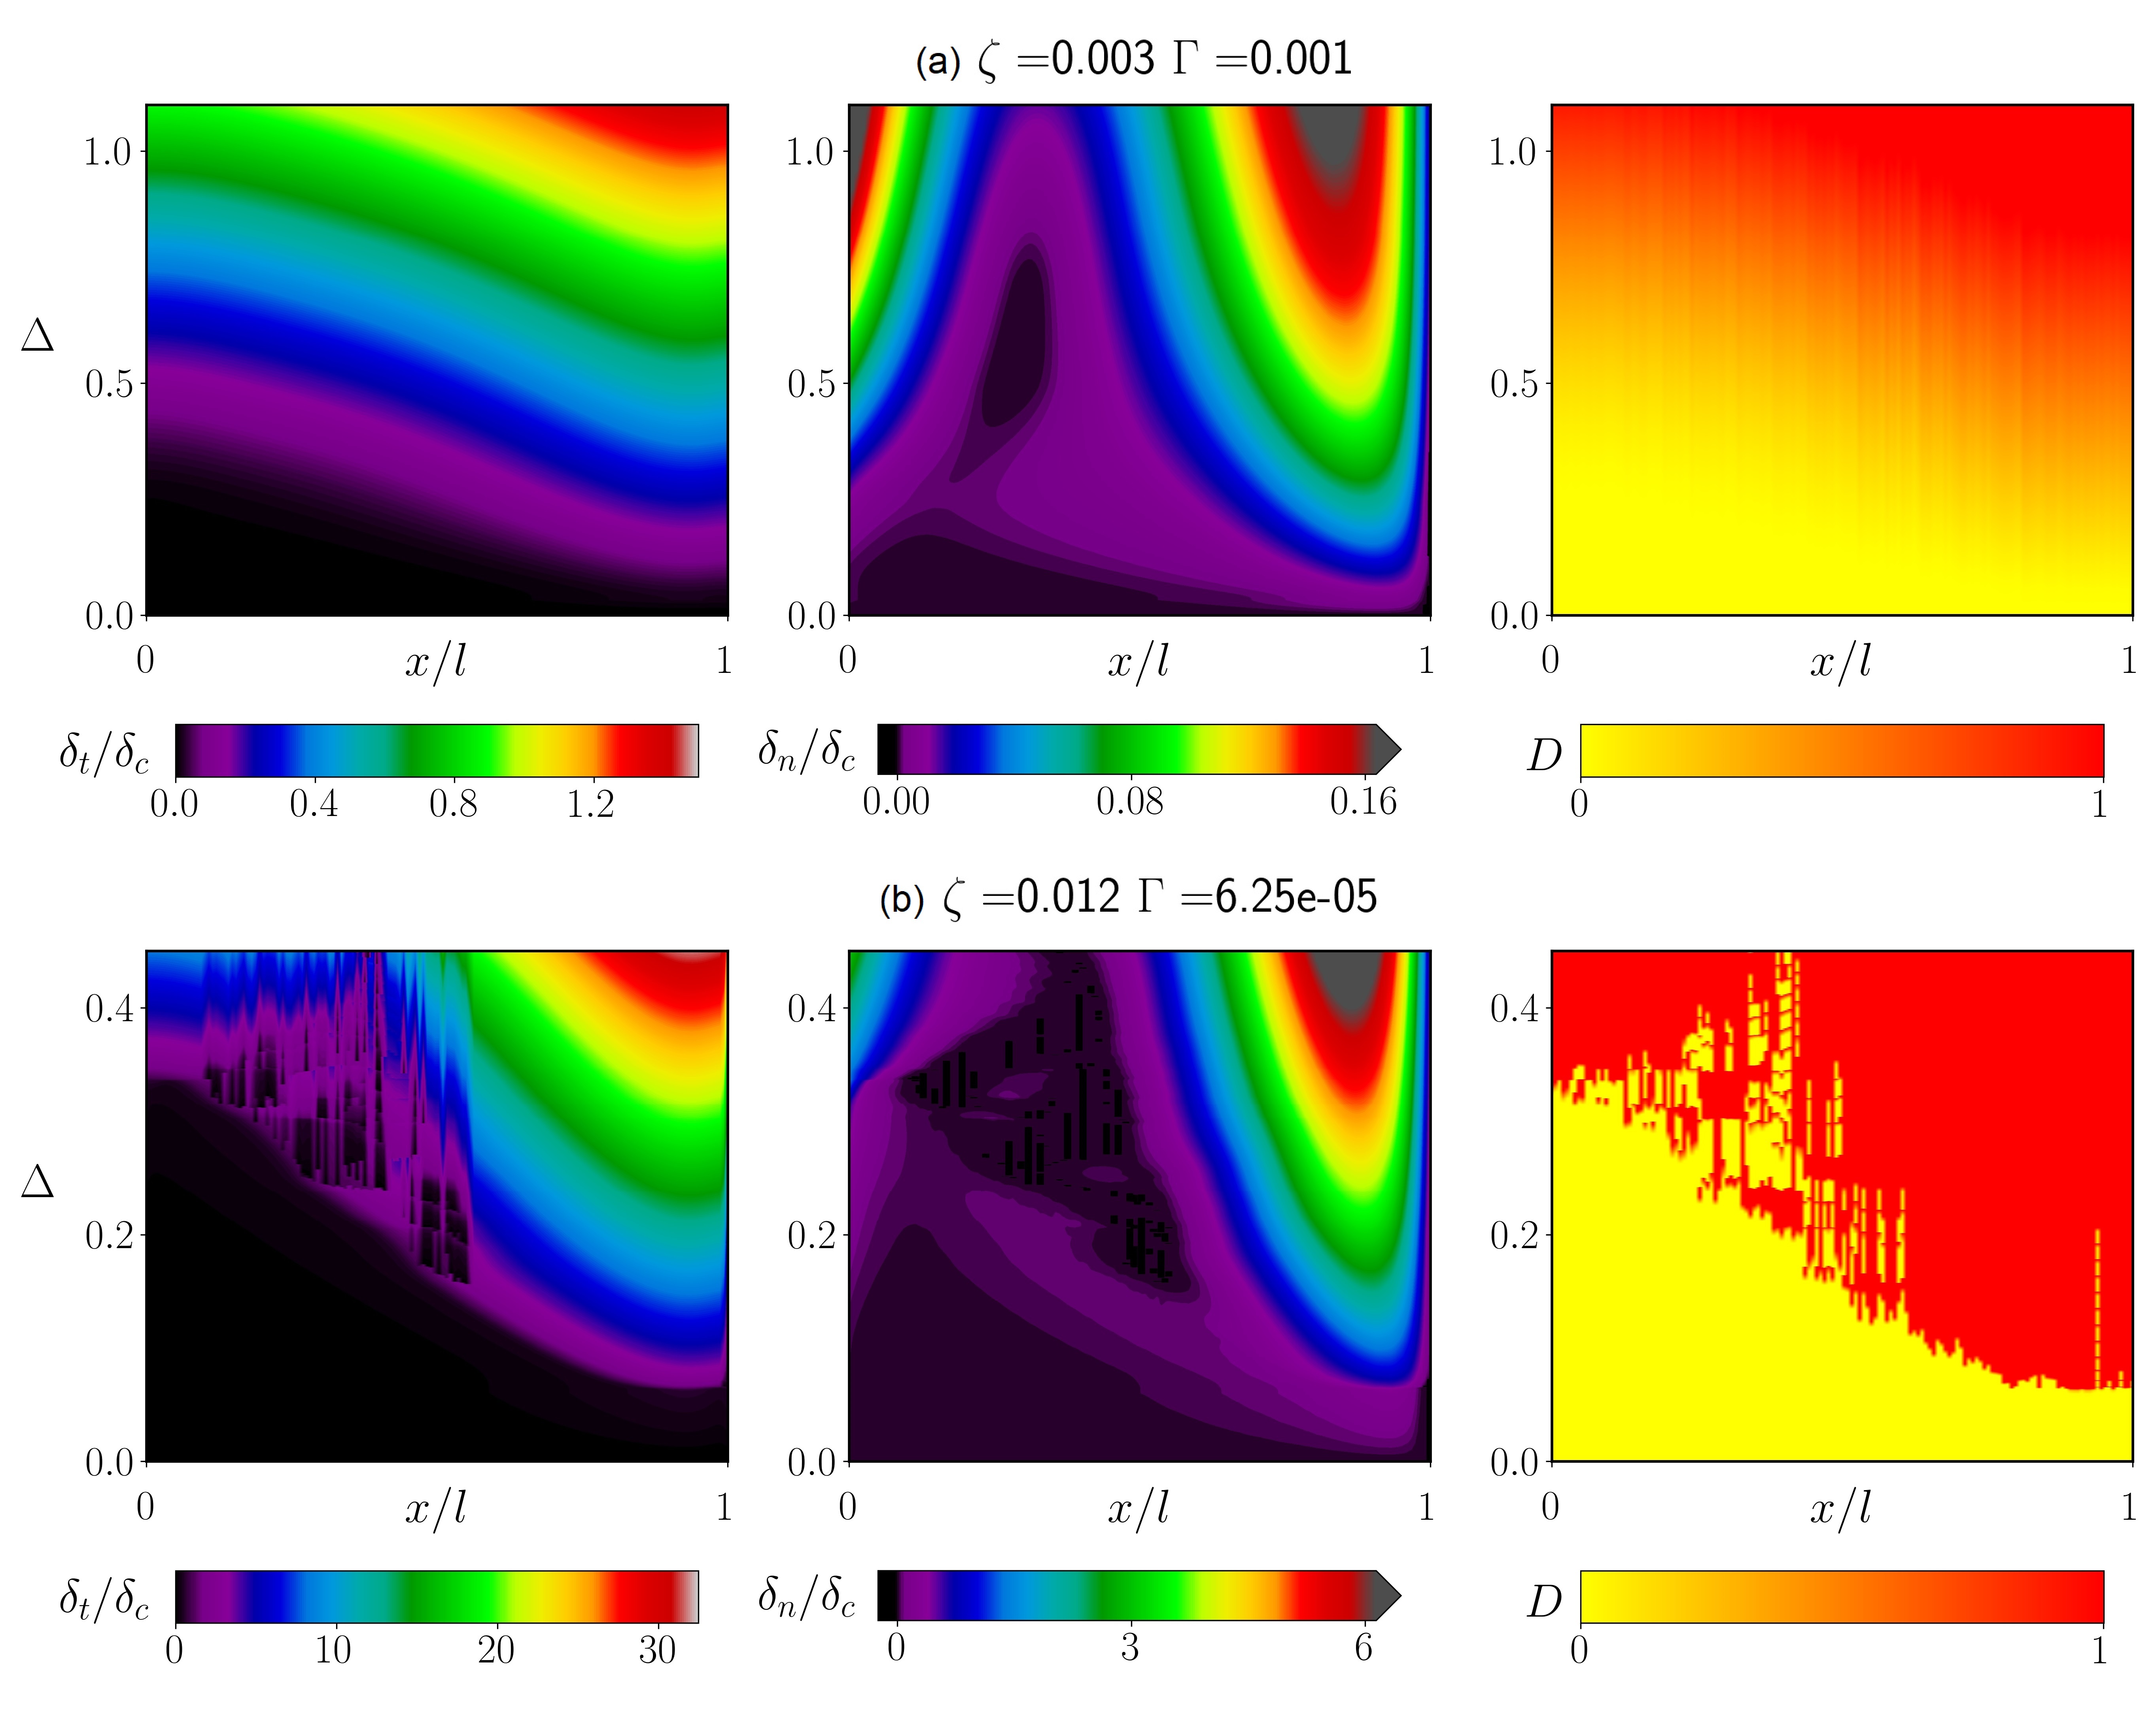
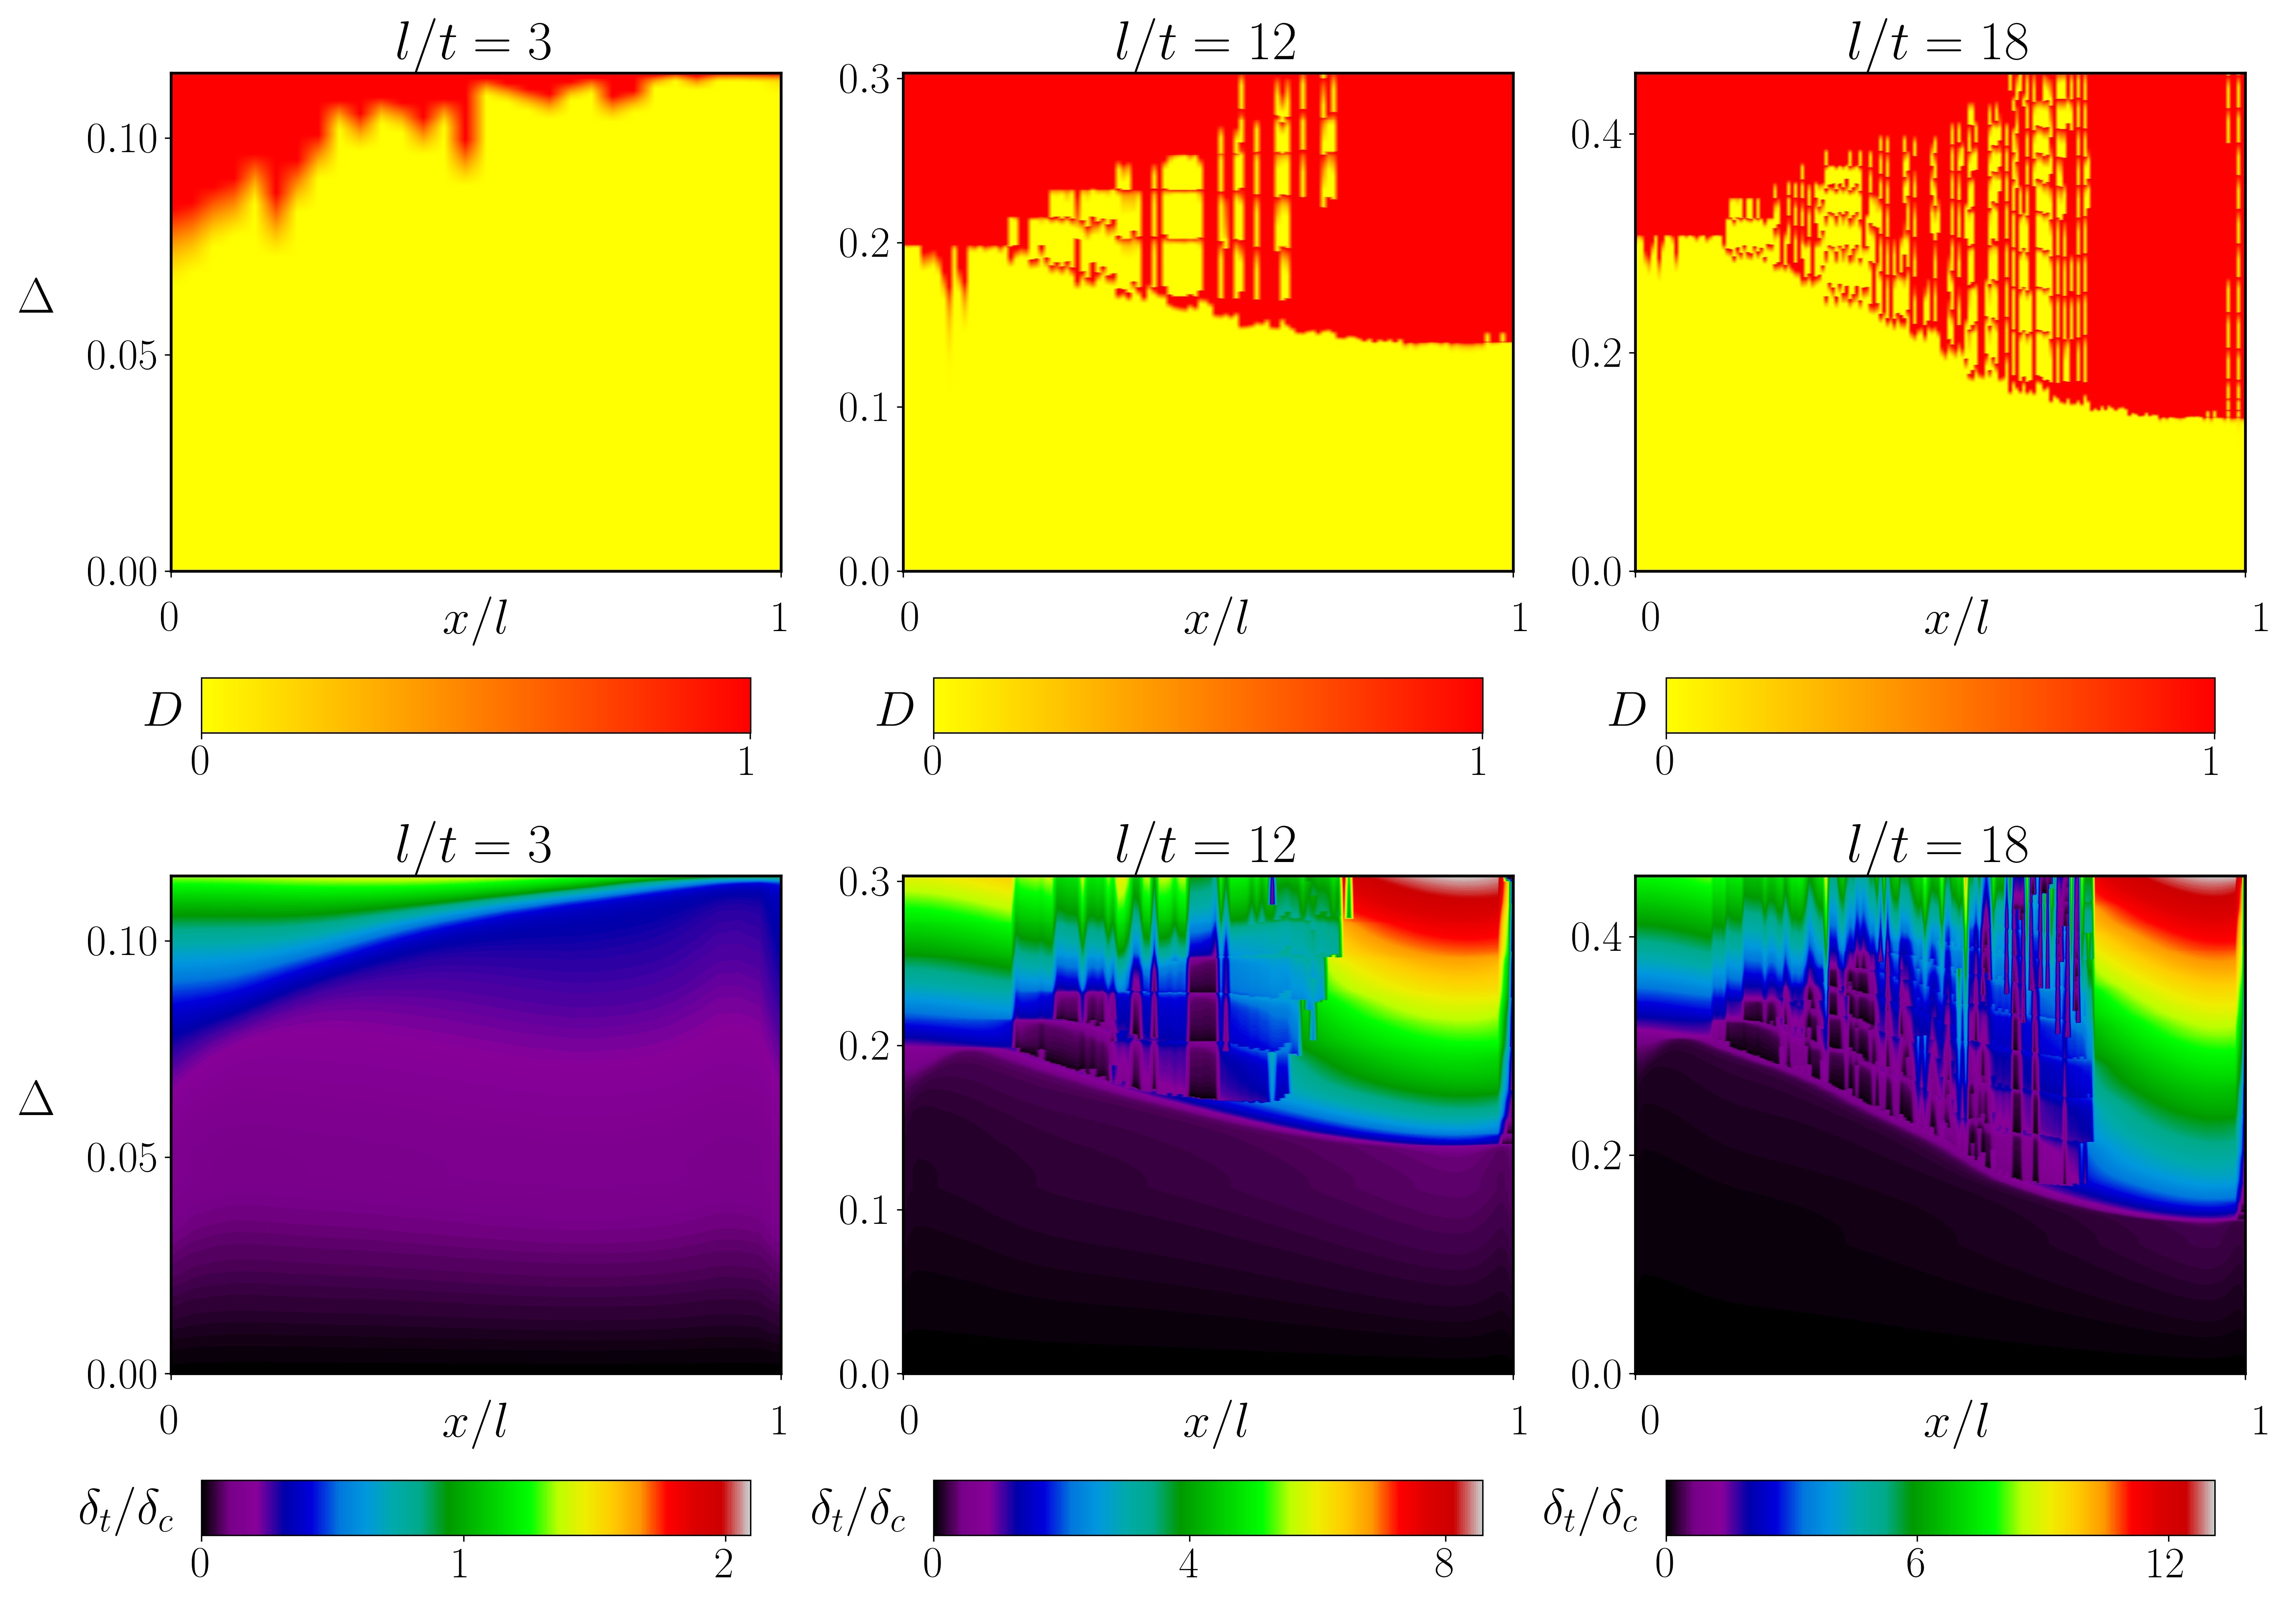
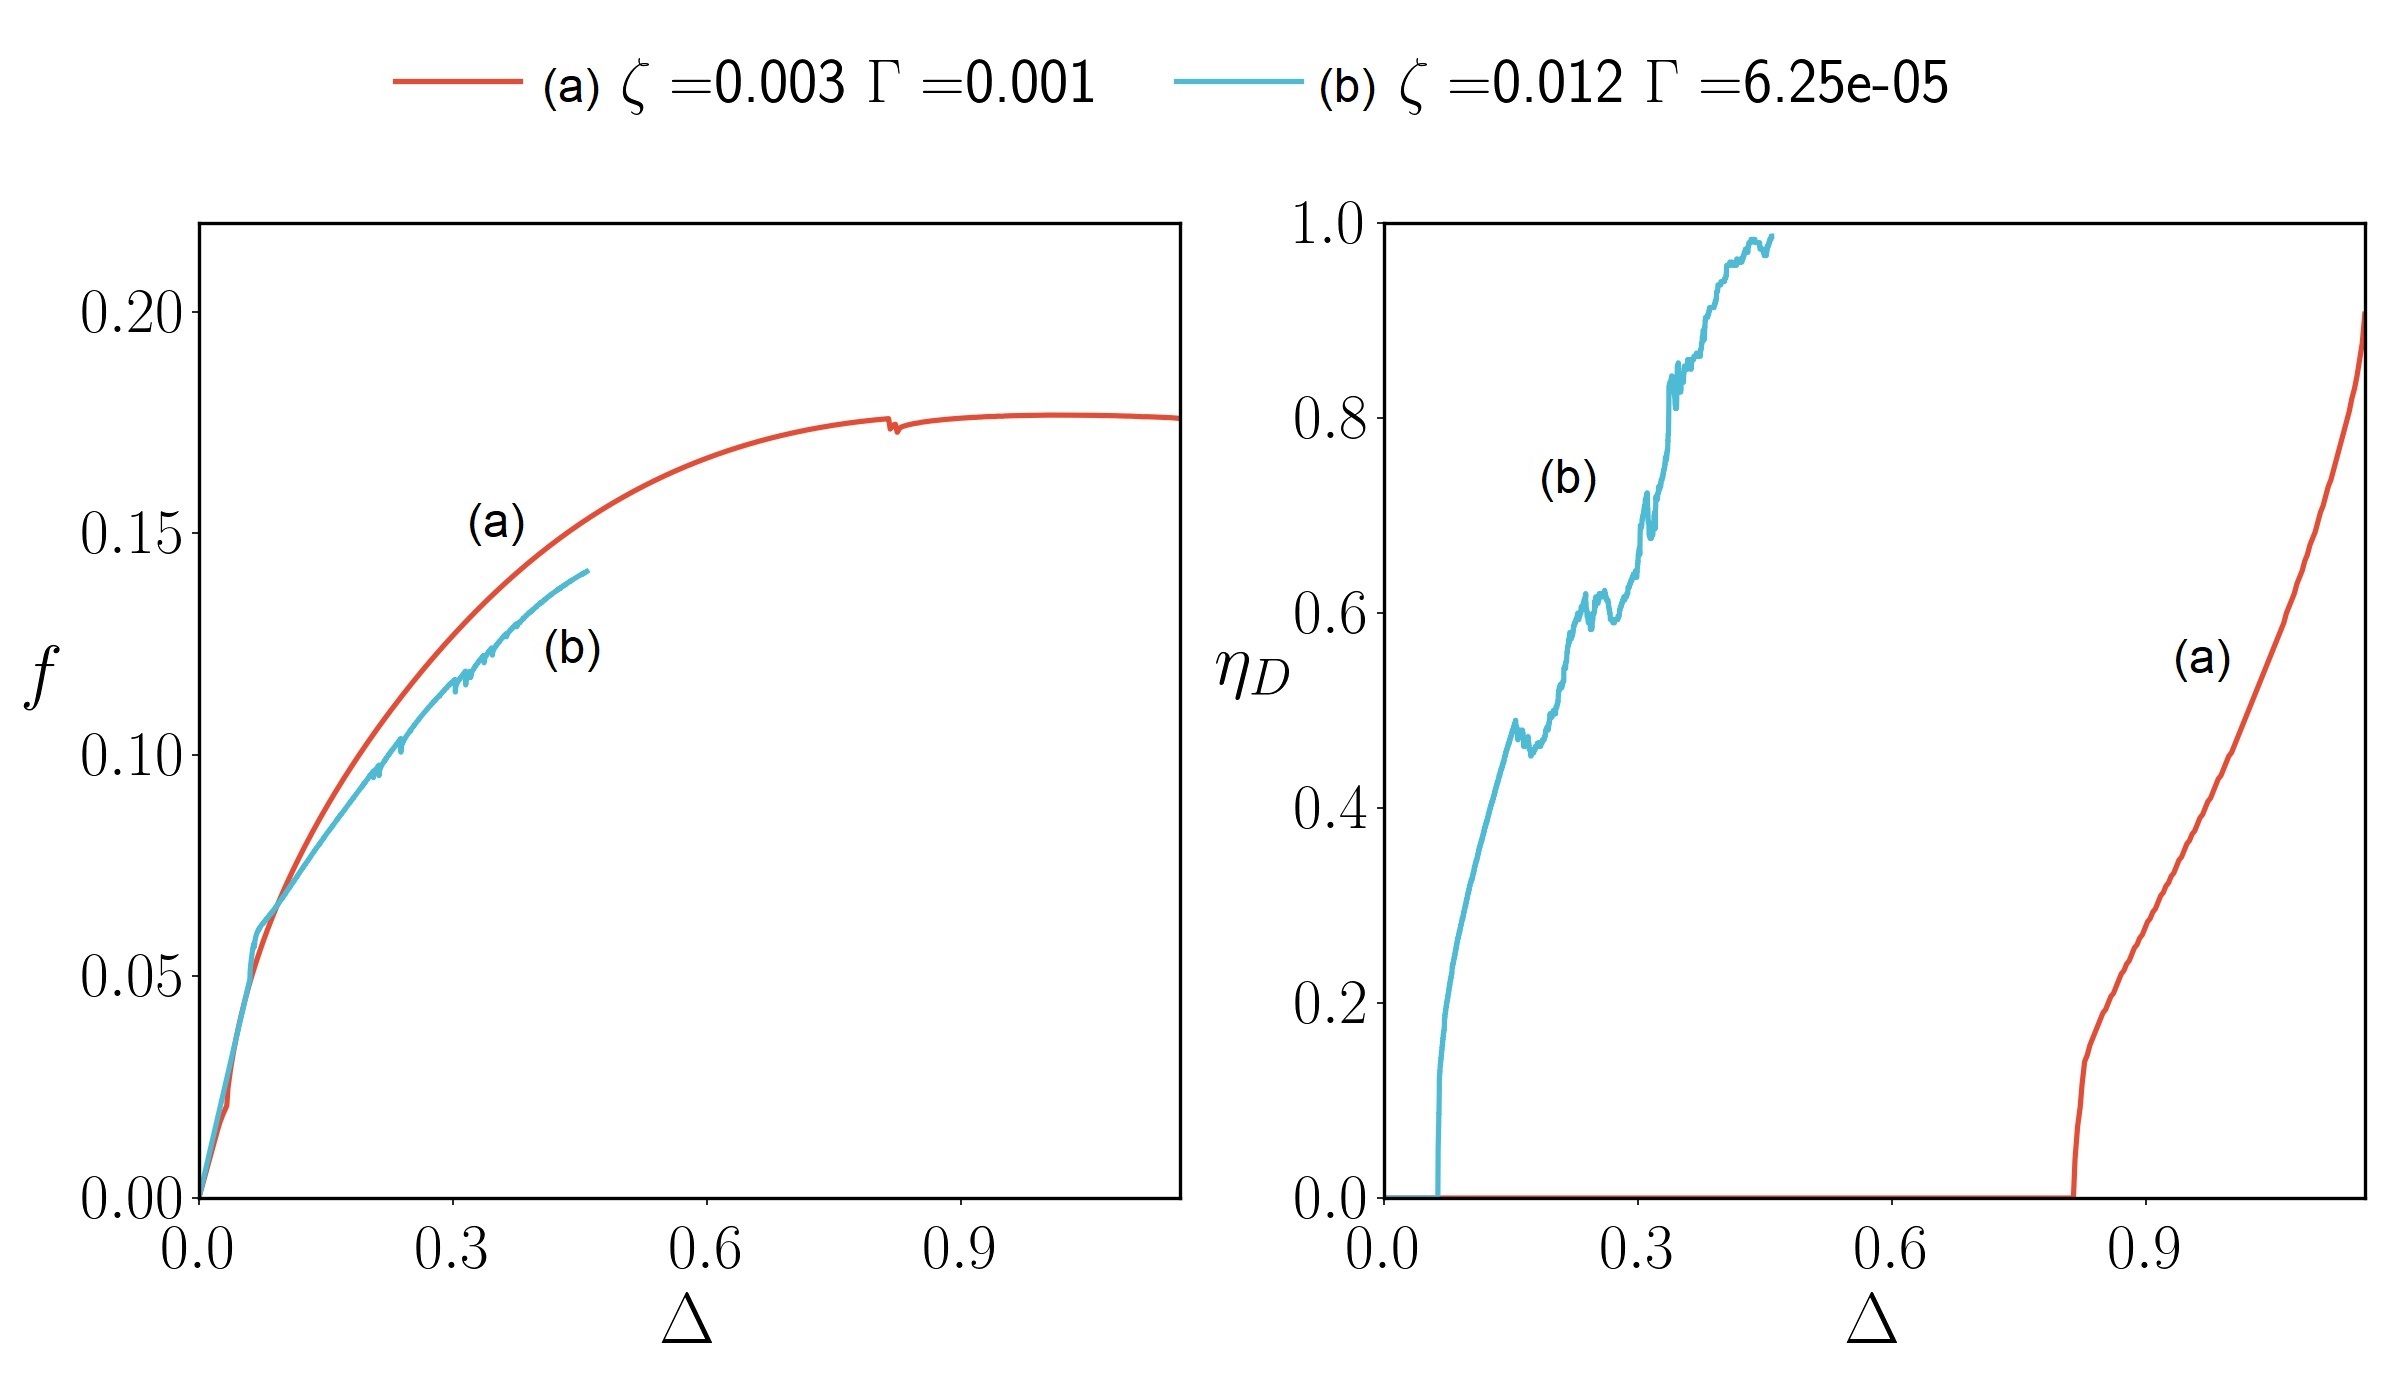
The surface parameters of the two layers are chosen such that one of them (a) has a very long unstable softening phase, and the second (b) has a very short unstable softening phase. Their vertical opening, tangential displacement and damage maps are shown in Figure 11. The corresponding force-displacement curves are included in Appendix C. First we note that despite the apparent similarities in the vertical displacements, layer (a) exhibits smaller displacements for similar values of . Next, we find that the differences appear most strikingly on the damage map. The distribution of energy within the cohesive bond in (a) allows to distribute the stress along a longer portion of the pad before debonding. Hence a smooth transition is observed with no stick-slip events. In contrast, for (b), instability is abrupt. This leads to a higher localization of the process zone, both in space and time, and involves significant stick-slip events. The latter also shows reattachment that is not observed in case (a). The localization of displacement and damage is thus immediately linked to stick-slip and reattachment. This observation confirms earlier studies emphasizing the influence of the shape of the cohesive law, rather than only its energy within this range of parameters.
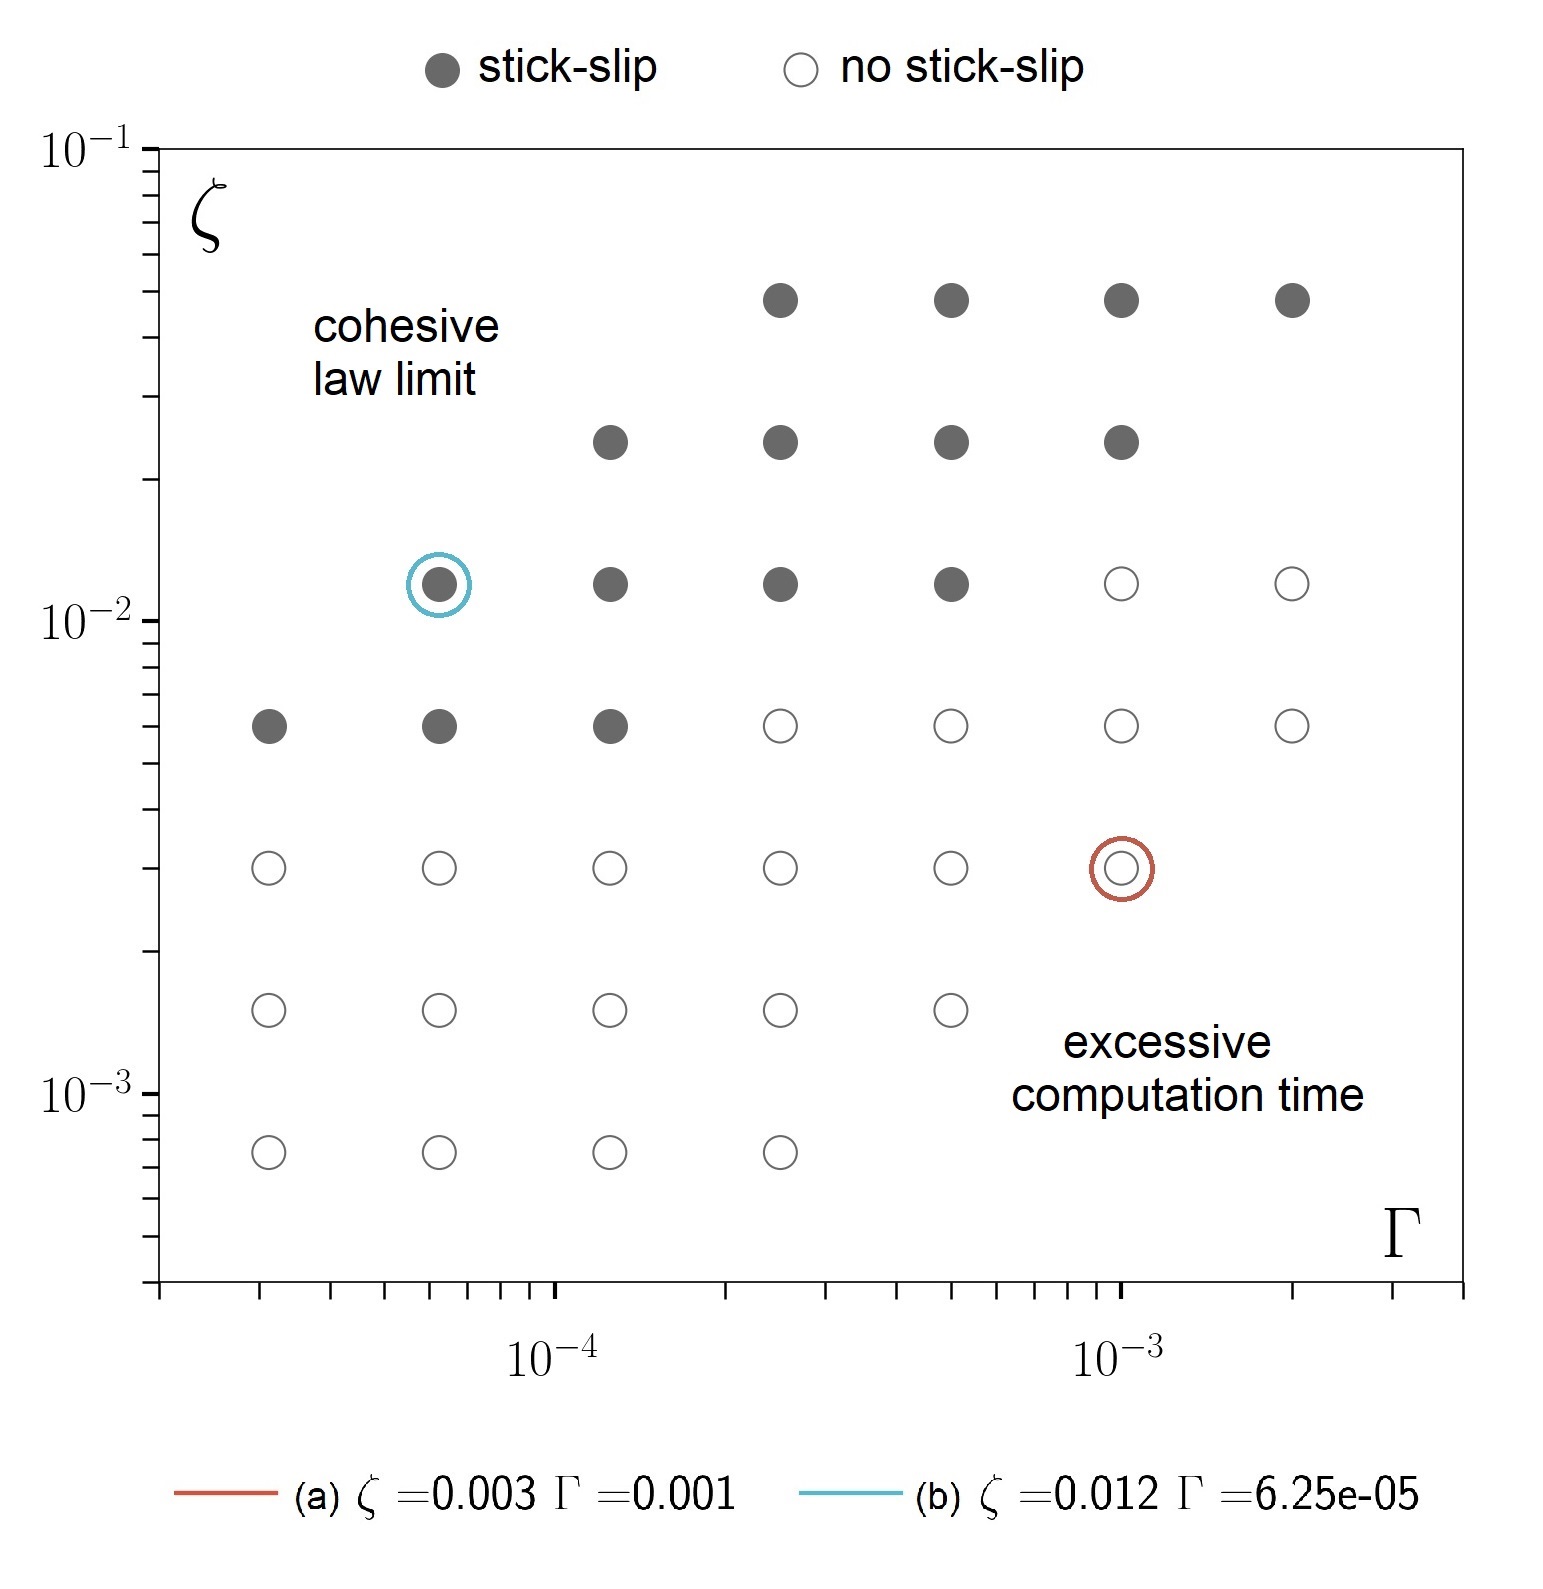
These results inspire a more comprehensive sensitivity analysis that centers on the surface properties , and the specific load bearing capacity, , as shown by the phase diagram in Figure 12. This diagram, which spans orders of magnitude in the parameters space, confirms that stick-slip after initial failure events is present predominantly in layers with interface properties approaching a cohesive law with no softening phase - the cohesive law limit, at which bonds break almost instantaneously when the critical stress is achieved.
Overall, the results in this section demonstrate the application of our modification to the classical cohesive law by Ortiz and Pandolfi (1999), to allow for full recovery of a cohesive bond upon contact of the two sides of the interface. It is shown that this new framework can capture reversible interfacial peeling phenomena that emerge in various delamination processes. Specifically, this is demonstrated for elastic bi-layer adhesives capable of large deformations, pulled along the direction of the substrate.
6 Concluding remarks
From synthetic adhesive pads to tectonic plates and locomotive capabilities in nature: sliding adhesive systems exhibit various interface phenomena. In many of them, reattachment can significantly alter the observed behavior. This is especially the case for bi-layer adhesives that peel via various failure modes, including formation of a stable interfacial cavity near the pulling end, unstable curling emerging from the opposite end, stick-slip and shedding events, as shown by our experimental observations. While earlier studies have focused on determining the conditions at initiation of failure in such systems, in this study we have developed reversible cohesive elements that are employed in a finite element framework to investigate the propagation of failure. These elements permit re-bonding at any new location upon re-establishing contact as achieved by a straightforward adaptation to the Camacho-Ortiz cohesive law. Additionally, to remedy numerical issues that are inevitable in presence of snap-through events, we employ a specialized algorithm that pauses pulling during spontaneous propagation of surface failure, thus capturing a nearly quasi-static path. It is shown that this simple approach is able to capture the entire range of observed behaviors. Moreover, the significant role of re-bonding is confirmed by comparing with results for which re-bonding is not permitted. This emphasizes the importance of accounting for reversibility to study peeling processes.
Extending this analysis to study peeling of infinitely long layers reveals the emergence of periodic de-bonding and re-bonding events leading to the propagation of a peeling front with a steady failure sequence. This periodicity is found to be consistent with reports of Schallamach waves albeit in a quasi-static simulation, thus suggesting a rate independent origin of Schallamach waves, which may be more prevalent in a larger extent of surface interactions than first thought. The importance of surface properties among the large range of systems where stick-slip could potentially occur, is portrayed on a phase diagram that covers several orders of magnitude of two main surface parameters. A clear transition between systems with and without stick-slip is shown to rely on the length of the unstable softening phase of the cohesive law relative to that of the stable phase. Stick-slip only occurs for interface laws with short softening phases and is linked to localization of displacement and damage. This observation can allow to deduce the general features of a cohesive law shape based on observations of surface behavior, or inversely, to deduce whether stick-slip will occur, based on knowledge of surface properties of a given system. This work is not without limitations, future developments are needed to capture peeling processes that occur on curved surfaces. Additionally, several peeling processes can exhibit significant rate dependence, a loss of adhesive power upon rebonding, and a dependence on previous loading and bonding states. These phenomena are not captured by the present formulation, but can be incorporated in the future, similar to (Wang and Elbanna, 2014). Finally, whether it is in the study of tectonic plate movement or in the design of robotic devices that mimic motility in natural systems, this work emphasizes the importance of predictive models that can capture the entire peeling process as well as possible re-bonding.
Acknowledgements
We thank Ismail Honsali and Shabnam Raayai-Ardakani for helpful conversations and for the experimental observations. T.C. acknowledges the financial support from NSF (CMMI, MOMS, 1942016).
Appendix
Appendix A Material fabrication
Both the adhesive and backing were fabricated from the commercially available PDMS - Dow ™ 184 Silicone Elastomer, using different cross-linker mass ratios to vary the elastic stiffness. For the adhesive layer a mass ratio of was used, resulting in Young’s modulus of , and for the backing a mass ratio of , resulting in a Young’s modulus of . Additional details on measurement of the material properties can be found in (Raayai-Ardakani et al., 2019). The adhesive mix is put in a rotating mixer for cycles of seconds, poured in an acrylic mold, de-gassed in a vacuum chamber for hours, and cured in a C oven for hours. This procedure is repeated for the backing, which is pored onto the adhesive layer. The adhesive layer thus undergoes two curing cycles. The pads are then attached to a glass plate by applying pressure manually. For the peeling test setup, the Instron™ 5943 Single Column Tabletop Testing System is used. The glass plate is clamped on one side of the machine, and the backing is clamped on the other side. The backing is pulled at a velocity of millimeter per minute. A high-definition camera is used to capture a bottom view of the detachment of the pad through the glass plate.
Appendix B Numerical parameters used in the simulations
For all simulations, thicknesses of and are used for the adhesive layer and the backing. The elastic modulus of the adhesive layer is in all simulations, except in section 5.4 where it is . In the numerical scheme, small levels of compressiblity are permitted by using a compressible neo-Hookean model and setting the Poisson’s ratio to 0.45. The mass density used in the simulations is , the pulling speed is and the damping time is of . Finally, the spatial discretization was found to be sufficient for a cohesive element length of and the temporal discretization for a dynamic timestep of . A maximum of parallel cores are utilized in the simulations, which typically takes hours on a high performance computing cluster.
Appendix C Comparison of force-displacement response - with and without stick-slip
References
- Ahrens et al. (2005) Ahrens, J., Geveci, B., Law, C., 2005. ParaView: An End-User Tool for Large Data Visualization. Elsevier. Visualization Handbook, ISBN: 978-0123875822.
- Alsheghri and Al-Rub (2015) Alsheghri, A.A., Al-Rub, R.K.A., 2015. Thermodynamic-based cohesive zone healing model for self-healing materials. Mechanics Research Communications 70, 102 – 113. doi:10.1016/j.mechrescom.2015.10.003.
- Alsheghri and Al-Rub (2016) Alsheghri, A.A., Al-Rub, R.K.A., 2016. Finite element implementation and application of a cohesive zone damage-healing model for self-healing materials. Engineering Fracture Mechanics 163, 1 – 22. doi:10.1016/j.engfracmech.2016.06.010.
- Amouroux et al. (2001) Amouroux, N., Petit, J., Léger, L., 2001. Role of interfacial resistance to shear stress on adhesive peel strength. Langmuir 17, 6510–6517. doi:10.1021/la010146r.
- Autumn et al. (2006) Autumn, K., Dittmore, A., Santos, D., Spenko, M., Cutkosky, M., 2006. Frictional adhesion: A new angle on gecko attachment. The Journal of experimental biology 209, 3569—3579. doi:10.1242/jeb.02486.
- Ayachit (2015) Ayachit, U., 2015. The ParaView Guide: A Parallel Visualization Application. Kitware, Inc., USA. ISBN: 978-1930934306.
- Barthel and Haiat (2002) Barthel, E., Haiat, G., 2002. Approximate model for the adhesive contact of viscoelastic spheres. Langmuir 18, 9362–9370. doi:10.1021/la025959+.
- Bartlett et al. (2012) Bartlett, M.D., Croll, A.B., King, D.R., Paret, B.M., Irschick, D.J., Crosby, A.J., 2012. Looking beyond fibrillar features to scale gecko-like adhesion. Advanced Materials 24, 1078–1083. doi:10.1002/adma.201104191.
- Baumberger et al. (2002) Baumberger, T., Caroli, C., Ronsin, O., 2002. Self-healing slip pulses along a gel glass interface. Phys. Rev. Lett. 88, 075509. doi:10.1103/PhysRevLett.88.075509.
- Brace and Byerlee (1966) Brace, W., Byerlee, J., 1966. Stick-slip as a mechanism for earthquakes. Science 153, 990–992. doi:10.1126/science.153.3739.990.
- Brodoceanu et al. (2016) Brodoceanu, D., Bauer, C.T., Kroner, E., Arzt, E., Kraus, T., 2016. Hierarchical bioinspired adhesive surfaces—a review. Bioinspiration & Biomimetics 11, 051001. doi:10.1088/1748-3190/11/5/051001.
- Camacho and Ortiz (1996) Camacho, G., Ortiz, M., 1996. Computational modelling of impact damage in brittle materials. International Journal of Solids and Structures 33, 2899 – 2938. doi:10.1016/0020-7683(95)00255-3.
- Cheng et al. (2012) Cheng, Q.H., Chen, B., Gao, H.J., Zhang, Y.W., 2012. Sliding-induced non-uniform pre-tension governs robust and reversible adhesion: a revisit of adhesion mechanisms of geckos. Journal of The Royal Society Interface 9, 283–291. doi:10.1098/rsif.2011.0254.
- Cochard and Rice (2000) Cochard, A., Rice, J.R., 2000. Fault rupture between dissimilar materials: Ill-posedness, regularization, and slip-pulse response. Journal of Geophysical Research: Solid Earth 105, 25891–25907. doi:10.1029/2000JB900230.
- Cocou et al. (2010) Cocou, M., Schryve, M., Raous, M., 2010. A dynamic unilateral contact problem with adhesion and friction in viscoelasticity. Zeitschrift für angewandte Mathematik und Physik 61, 721–743. doi:10.1007/s00033-009-0027-x.
- Cohen et al. (2018) Cohen, T., Chan, C.U., Mahadevan, L., 2018. Competing failure modes in finite adhesive pads. Soft Matter 14, 1771–1779. doi:10.1039/C7SM02378B.
- Collino et al. (2014) Collino, R.R., Philips, N.R., Rossol, M.N., McMeeking, R.M., Begley, M.R., 2014. Detachment of compliant films adhered to stiff substrates via van der waals interactions: role of frictional sliding during peeling. Journal of The Royal Society Interface 11, 20140453. doi:10.1098/rsif.2014.0453.
- Cortet et al. (2007) Cortet, P.P., Ciccotti, M., Vanel, L., 2007. Imaging the stick-slip peeling of an adhesive tape under a constant load. Journal of Statistical Mechanics Theory and Experiment 2007. doi:10.1088/1742-5468/2007/03/P03005.
- Cortet et al. (2013) Cortet, P.P., Dalbe, M.J., Guerra, C., Cohen, C., Ciccotti, M., Santucci, S., Vanel, L., 2013. Intermittent stick-slip dynamics during the peeling of an adhesive tape from a roller. Phys. Rev. E 87, 022601. doi:10.1103/PhysRevE.87.022601.
- Dalbe et al. (2015) Dalbe, M.J., Cortet, P.P., Ciccotti, M., Vanel, L., Santucci, S., 2015. Multiscale stick-slip dynamics of adhesive tape peeling. Physical Review Letters 115. doi:10.1103/PhysRevLett.115.128301.
- Das et al. (2013) Das, S., Chary, S., Yu, J., Tamelier, J., Turner, K.L., Israelachvili, J.N., 2013. Jkr theory for the stick–slip peeling and adhesion hysteresis of gecko mimetic patterned surfaces with a smooth glass surface. Langmuir 29, 15006–15012. doi:10.1021/la403420f.
- de Borst (2002) de Borst, R., 2002. Fracture in quasi-brittle materials: a review of continuum damage-based approaches. Engineering Fracture Mechanics 69, 95 – 112. doi:10.1016/S0013-7944(01)00082-0.
- Dharmawan et al. (2019) Dharmawan, A.G., Xavier, P., Hariri, H.H., Soh, G.S., Baji, A., Bouffanais, R., Foong, S., Low, H.Y., Wood, K.L., 2019. Design, Modeling, and Experimentation of a Bio-Inspired Miniature Climbing Robot With Bilayer Dry Adhesives. Journal of Mechanisms and Robotics 11. doi:10.1115/1.4042457. 020902.
- Eisenhaure and Kim (2017) Eisenhaure, J., Kim, S., 2017. A review of the state of dry adhesives: Biomimetic structures and the alternative designs they inspire. Micromachines 8, 125. doi:10.3390/mi8040125.
- Fukahori et al. (2010) Fukahori, Y., Gabriel, P., Busfield, J., 2010. How does rubber truly slide between schallamach waves and stick–slip motion? Wear 269, 854 – 866. doi:10.1016/j.wear.2010.08.016.
- Gabriel et al. (2010) Gabriel, P., Fukahori, Y., Thomas, A.G., Busfield, J.J.C., 2010. FEA Modeling of Schallamach Waves. Rubber Chemistry and Technology 83, 358–367. doi:10.5254/1.3481697.
- Galeano et al. (2000) Galeano, J., Español, P., Rubio, M.A., 2000. Experimental and theoretical results of stress relaxations in a model of earthquake dynamics. Europhysics Letters (EPL) 49, 410–416. doi:10.1209/epl/i2000-00164-y.
- Galliano et al. (2003) Galliano, A., Bistac, S., Schultz, J., 2003. Adhesion and friction of pdms networks: molecular weight effects. Journal of Colloid and Interface Science 265, 372 – 379. doi:10.1016/S0021-9797(03)00458-2.
- Geim et al. (2003) Geim, A., Dubonos, S., Grigorieva, I., Novoselov, K., Zhukov, A., Shapoval, S.Y., 2003. Microfabricated adhesive mimicking gecko foot-hair. Nature materials 2, 461—463. doi:10.1038/nmat917.
- Gerde and Marder (2001) Gerde, E., Marder, M., 2001. Friction and fracture. Nature 413, 285–288. doi:10.1038/35095018.
- Geuzaine and Remacle (2009) Geuzaine, C., Remacle, J.F., 2009. Gmsh: A 3-d finite element mesh generator with built-in pre- and post-processing facilities. International Journal for Numerical Methods in Engineering 79, 1309 – 1331. doi:10.1002/nme.2579.
- Gu et al. (2016) Gu, Z., Li, S., Zhang, F., Wang, S., 2016. Understanding surface adhesion in nature: A peeling model. Advanced Science 3, 1500327. doi:10.1002/advs.201500327.
- Hammond et al. (2014) Hammond, F.L., Kramer, R.K., Wan, Q., Howe, R.D., Wood, R.J., 2014. Soft tactile sensor arrays for force feedback in micromanipulation. IEEE Sensors Journal 14, 1443–1452. doi:10.1109/JSEN.2013.2297380.
- He et al. (2019) He, Y., Zuo, D., Hackl, K., Yang, H., Mousavi, S.J., Avril, S., 2019. Gradient-enhanced continuum models of healing in damaged soft tissues. Biomechanics and Modeling in Mechanobiology 18, 1443–1460. doi:10.1007/s10237-019-01155-z.
- Heaton (1990) Heaton, T.H., 1990. Evidence for and implications of self-healing pulses of slip in earthquake rupture. Physics of the Earth and Planetary Interiors 64, 1 – 20. doi:10.1016/0031-9201(90)90002-F.
- Hsiao et al. (2019) Hsiao, J.H., Chang, J.Y.J., Cheng, C.M., 2019. Soft medical robotics: clinical and biomedical applications, challenges, and future directions. Advanced Robotics 33, 1099–1111. doi:10.1080/01691864.2019.1679251.
- Jagota and Hui (2011) Jagota, A., Hui, C.Y., 2011. Adhesion, friction, and compliance of bio-mimetic and bio-inspired structured interfaces. Materials Science and Engineering: R: Reports 72, 253 – 292. doi:10.1016/j.mser.2011.08.001.
- Javierre (2019) Javierre, E., 2019. Modeling self-healing mechanisms in coatings: Approaches and perspectives. Coatings 9, 122. doi:10.3390/coatings9020122.
- Jefferson, Anthony et al. (2019) Jefferson, Anthony, Selvarajoo, Tharmesh, Freeman, Brubeck, Davies, Robert, 2019. An experimental and numerical study on vascular self-healing cementitious materials. MATEC Web Conf. 289, 01004. doi:10.1051/matecconf/201928901004.
- Khajeh Salehani et al. (2019) Khajeh Salehani, M., Irani, N., Nicola, L., 2019. Modeling adhesive contacts under mixed-mode loading. Journal of the Mechanics and Physics of Solids 130, 320 – 329. doi:10.1016/j.jmps.2019.06.010.
- Labonte et al. (2016) Labonte, D., Clemente, C.J., Dittrich, A., Kuo, C.Y., Crosby, A.J., Irschick, D.J., Federle, W., 2016. Extreme positive allometry of animal adhesive pads and the size limits of adhesion-based climbing. Proceedings of the National Academy of Sciences 113, 1297–1302. doi:10.1073/pnas.1519459113.
- Lee et al. (2019) Lee, S.H., Hwang, I., Kang, B.S., Jeong, H.E., Kwak, M.K., 2019. Highly flexible and self-adaptive dry adhesive end-effectors for precision robotics. Soft Matter 15, 5827–5834. doi:10.1039/C9SM00431A.
- Li et al. (2016) Li, Y., Krahn, J., Menon, C., 2016. Bioinspired dry adhesive materials and their application in robotics: A review. Journal of Bionic Engineering 13, 181 – 199. doi:10.1016/S1672-6529(16)60293-7.
- Lin and Hui (2002) Lin, Y.Y., Hui, C.Y., 2002. Mechanics of contact and adhesion between viscoelastic spheres: An analysis of hysteresis during loading and unloading. Journal of Polymer Science Part B: Polymer Physics 40, 772–793. doi:10.1002/polb.10140.
- Liu et al. (2019) Liu, Z., Minsky, H., Creton, C., Ciccotti, M., Hui, C.Y., 2019. Mechanics of zero degree peel test on a tape — effects of large deformation, material nonlinearity, and finite bond length. Extreme Mechanics Letters 32, 100518. doi:10.1016/j.eml.2019.100518.
- Maegawa et al. (2016) Maegawa, S., Itoigawa, F., Nakamura, T., 2016. Dynamics in sliding friction of soft adhesive elastomer: Schallamach waves as a stress-relaxation mechanism. Tribology International 96, 23 – 30. doi:10.1016/j.triboint.2015.11.034.
- Maegawa and Nakano (2010) Maegawa, S., Nakano, K., 2010. Mechanism of stick-slip associated with schallamach waves. Wear 268, 924 – 930. doi:10.1016/j.wear.2009.12.018.
- Menon et al. (2004) Menon, C., Murphy, M., Sitti, M., 2004. Gecko inspired surface climbing robots, in: 2004 IEEE International Conference on Robotics and Biomimetics, pp. 431–436. doi:10.1109/ROBIO.2004.1521817.
- Mergel et al. (2019) Mergel, J.C., Sahli, R., Scheibert, J., Sauer, R.A., 2019. Continuum contact models for coupled adhesion and friction. The Journal of Adhesion 95, 1101–1133. doi:10.1080/00218464.2018.1479258.
- Mergel et al. (2021) Mergel, J.C., Scheibert, J., Sauer, R.A., 2021. Contact with coupled adhesion and friction: Computational framework, applications, and new insights. Journal of the Mechanics and Physics of Solids 146, 104194. doi:10.1016/j.jmps.2020.104194.
- Mishra et al. (2015) Mishra, N., Parida, N.C., Raha, S., 2015. Time scales of the stick slip dynamics of the peeling of an adhesive tape. Proceedings of the Royal Society A: Mathematical, Physical and Engineering Sciences 471, 20140399. doi:10.1098/rspa.2014.0399.
- Mojdehi et al. (2017a) Mojdehi, A.R., Holmes, D.P., Dillard, D.A., 2017a. Friction of extensible strips: An extended shear lag model with experimental evaluation. International Journal of Solids and Structures 124, 125 – 134. doi:10.1016/j.ijsolstr.2017.06.021.
- Mojdehi et al. (2017b) Mojdehi, A.R., Holmes, D.P., Dillard, D.A., 2017b. Revisiting the generalized scaling law for adhesion: role of compliance and extension to progressive failure. Soft Matter 13, 7529–7536. doi:10.1039/C7SM01098B.
- Nakano and Maegawa (2009) Nakano, K., Maegawa, S., 2009. Stick-slip in sliding systems with tangential contact compliance. Tribology International 42, 1771 – 1780. doi:10.1016/j.triboint.2009.04.039. special Issue: 35th Leeds-Lyon Symposium.
- Nosonovsky and Bhushan (2007) Nosonovsky, M., Bhushan, B., 2007. Multiscale friction mechanisms and hierarchical surfaces in nano-and bio-tribology. Materials Science and Engineering: R: Reports 58, 162–193.
- Ortiz and Pandolfi (1999) Ortiz, M., Pandolfi, A., 1999. Finite-deformation irreversible cohesive elements for three-dimensional crack-propagation analysis. International Journal for Numerical Methods in Engineering 44, 1267–1282. doi:10.1002/(SICI)1097-0207(19990330)44:9<1267::AID-NME486>3.0.CO;2-7.
- Oucif and Mauludin (2018) Oucif, C., Mauludin, L., 2018. Continuum damage-healing and super healing mechanics in brittle materials: A state-of-the-art review. Applied Sciences 8, 2350. doi:10.3390/app8122350.
- Ozaki et al. (2016) Ozaki, S., Osada, T., Nakao, W., 2016. Finite element analysis of the damage and healing behavior of self-healing ceramic materials. International Journal of Solids and Structures 100-101, 307 – 318. doi:10.1016/j.ijsolstr.2016.08.026.
- O’Rorke et al. (2016) O’Rorke, R.D., Steele, T.W.J., Taylor, H.K., 2016. Bioinspired fibrillar adhesives: a review of analytical models and experimental evidence for adhesion enhancement by surface patterns. Journal of Adhesion Science and Technology 30, 362–391. doi:10.1080/01694243.2015.1101183.
- Pandolfi et al. (2000) Pandolfi, A., Guduru, P., Ortiz, M., Rosakis, A., 2000. Three dimensional cohesive-element analysis and experiments of dynamic fracture in c300 steel. International Journal of Solids and Structures 37, 3733 – 3760. doi:doi.org/10.1016/S0020-7683(99)00155-9.
- Ponce et al. (2015) Ponce, S., Bico, J., Roman, B., 2015. Effect of friction on the peeling test at zero-degrees. Soft Matter 11, 9281–9290. doi:10.1039/C5SM01203A.
- Raayai-Ardakani et al. (2019) Raayai-Ardakani, S., Chen, Z., Earl, D.R., Cohen, T., 2019. Volume-controlled cavity expansion for probing of local elastic properties in soft materials. Soft Matter 15, 381–392. doi:10.1039/C8SM02142B.
- Rahulkumar et al. (2000) Rahulkumar, P., Jagota, A., Bennison, S., Saigal, S., 2000. Cohesive element modeling of viscoelastic fracture: application to peel testing of polymers. International Journal of Solids and Structures 37, 1873 – 1897. doi:10.1016/S0020-7683(98)00339-4.
- Rand and Crosby (2006) Rand, C.J., Crosby, A.J., 2006. Insight into the periodicity of schallamach waves in soft material friction. Applied Physics Letters 89, 261907. doi:10.1063/1.2408640.
- Raous (2011) Raous, M., 2011. Interface models coupling adhesion and friction. Comptes Rendus Mécanique 339, 491 – 501. doi:10.1016/j.crme.2011.05.007.
- Rateni et al. (2015) Rateni, G., Cianchetti, M., Ciuti, G., Menciassi, A., Laschi, C., 2015. Design and development of a soft robotic gripper for manipulation in minimally invasive surgery: a proof of concept. Meccanica 50, 2855–2863. doi:10.1007/s11012-015-0261-6.
- Rice (1993) Rice, J.R., 1993. Spatio-temporal complexity of slip on a fault. Journal of Geophysical Research: Solid Earth 98, 9885–9907. doi:10.1029/93JB00191.
- Richart (2016) Richart, N., 2016. Akantu - User’s Guide. Ecole Polytechnique Federale de Lausanne. Url: akantu.ch/issues/.
- Richart and Molinari (2015) Richart, N., Molinari, J., 2015. Implementation of a parallel finite-element library: Test case on a non-local continuum damage model. Finite Elements in Analysis and Design 100, 41–46. doi:10.1016/j.finel.2015.02.003.
- Risan et al. (2015) Risan, J., Croll, A.B., Azarmi, F., 2015. Compliance switching for adhesion control. Journal of Polymer Science Part B: Polymer Physics 53, 48–57. doi:10.1002/polb.23624.
- Roldán et al. (2019) Roldán, L., Muñoz, J., Sáez, P., 2019. Computational modeling of epithelial wound healing: Short and long term chemo-mechanical mechanisms. Computer Methods in Applied Mechanics and Engineering 350, 28 – 56. doi:10.1016/j.cma.2019.02.018.
- Ronsin et al. (2011) Ronsin, O., Baumberger, T., Hui, C.Y., 2011. Nucleation and propagation of quasi-static interfacial slip pulses. The Journal of Adhesion 87, 504–529. doi:10.1080/00218464.2011.575342.
- Saffman and Taylor (1958) Saffman, P.G., Taylor, G.I., 1958. The penetration of a fluid into a porous medium or hele-shaw cell containing a more viscous liquid. Proceedings of the Royal Society of London. Series A. Mathematical and Physical Sciences 245, 312–329.
- Sahay et al. (2015) Sahay, R., Low, H.Y., Baji, A., Foong, S., Wood, K.L., 2015. A state-of-the-art review and analysis on the design of dry adhesion materials for applications such as climbing micro-robots. RSC Adv. 5, 50821–50832. doi:10.1039/C5RA06770G.
- Sanz-Herrera et al. (2019) Sanz-Herrera, J., Aliko-Benitez, A., Fadrique-Contreras, A., 2019. Numerical investigation of the coupled mechanical behavior of self-healing materials under cyclic loading. International Journal of Solids and Structures 160, 232 – 246. doi:10.1016/j.ijsolstr.2018.10.029.
- Sauer (2016) Sauer, R.A., 2016. A survey of computational models for adhesion. The Journal of Adhesion 92, 81–120. doi:10.1080/00218464.2014.1003210.
- Schallamach (1971) Schallamach, A., 1971. How does rubber slide? Wear 17, 301 – 312. doi:10.1016/0043-1648(71)90033-0.
- Schapery (2020) Schapery, R., 2020. A model for the prediction of rubber friction with schallamach waves. Tribology International 143, 106018. doi:10.1016/j.triboint.2019.106018.
- Shintake et al. (2018) Shintake, J., Cacucciolo, V., Floreano, D., Shea, H., 2018. Soft robotic grippers. Advanced Materials 30, 1707035. doi:10.1002/adma.201707035.
- Snozzi and Molinari (2013) Snozzi, L., Molinari, J.F., 2013. A cohesive element model for mixed mode loading with frictional contact capability. International Journal for Numerical Methods in Engineering 93, 510–526. doi:10.1002/nme.4398.
- Sofla et al. (2010) Sofla, A., Seker, E., Landers, J.P., Begley, M.R., 2010. PDMS-Glass Interface Adhesion Energy Determined Via Comprehensive Solutions for Thin Film Bulge/Blister Tests. Journal of Applied Mechanics 77. doi:10.1115/1.4000428. 031007.
- Uenishi and Rice (2003) Uenishi, K., Rice, J.R., 2003. Universal nucleation length for slip-weakening rupture instability under nonuniform fault loading. Journal of Geophysical Research: Solid Earth 108. doi:10.1029/2001JB001681.
- Viswanathan et al. (2016a) Viswanathan, K., Sundaram, N.K., Chandrasekar, S., 2016a. Slow wave propagation in soft adhesive interfaces. Soft Matter 12, 9185–9201. doi:10.1039/C6SM01960A.
- Viswanathan et al. (2016b) Viswanathan, K., Sundaram, N.K., Chandrasekar, S., 2016b. Stick-slip at soft adhesive interfaces mediated by slow frictional waves. Soft Matter 12, 5265–5275. doi:10.1039/C6SM00244G.
- Vocialta et al. (2016) Vocialta, M., Richart, N., Molinari, J., 2016. 3d dynamic fragmentation with parallel dynamic insertion of cohesive elements. International Journal for Numerical Methods in Engineering 109, 1655–1678. doi:10.1002/nme.5339.
- Wang and Tréhu (2016) Wang, K., Tréhu, A.M., 2016. Invited review paper: Some outstanding issues in the study of great megathrust earthquakes—the cascadia example. Journal of Geodynamics 98, 1 – 18. doi:10.1016/j.jog.2016.03.010.
- Wang and Elbanna (2014) Wang, W., Elbanna, A., 2014. Crack propagation in bone on the scale of mineralized collagen fibrils: role of polymers with sacrificial bonds and hidden length. Bone 68, 20–31.
- Wei (2004) Wei, Y., 2004. Modeling nonlinear peeling of ductile thin films–critical assessment of analytical bending models using fe simulations. International Journal of Solids and Structures 41, 5087 – 5104. doi:10.1016/j.ijsolstr.2004.04.026.
- Zhang and Wang (2009) Zhang, L., Wang, J., 2009. A generalized cohesive zone model of the peel test for pressure-sensitive adhesives. International Journal of Adhesion and Adhesives 29, 217 – 224. doi:10.1016/j.ijadhadh.2008.05.002.
- Zhang and Lu (2020) Zhang, Y., Lu, M., 2020. A review of recent advancements in soft and flexible robots for medical applications. The International Journal of Medical Robotics and Computer Assisted Surgery 16, e2096. doi:10.1002/rcs.2096.
- Zhou et al. (2013) Zhou, M., Pesika, N., Zeng, H., Tian, Y., Israelachvili, J., 2013. Recent advances in gecko adhesion and friction mechanisms and development of gecko-inspired dry adhesive surfaces. Friction 1, 114–129. doi:10.1007/s40544-013-0011-5.
- Zhu et al. (2019) Zhu, Z., Xia, Y., Li, J., Jiang, C., Jiang, H., 2019. Rate dependent shear debonding between a highly stretchable elastomer and a rigid substrate: Delayed debonding and pre-stretch effect. Engineering Fracture Mechanics 222, 106743. doi:10.1016/j.engfracmech.2019.106743.
- Zotti et al. (2019) Zotti, V., Rapina, K., Cortet, P.P., Vanel, L., Santucci, S., 2019. Bending to kinetic energy transfer in adhesive peel front microinstability. Physical Review Letters 122. doi:10.1103/PhysRevLett.122.068005.